Marine Strategy Framework Directive: Common Implementation ...€¦ · Web viewMarine Strategy...
136
Marine Strategy Framework Directive (MSFD) Common Implementation Strategy 18 th Meeting of the Working Group on Programmes of Measures, Economic and Social Analysis (WG POMESA) 23 March 2018 European Commission, XX), xx xx, xx Brussels Agend a item: EUROPEAN COMMISSION DIRECTORATE-GENERAL ENVIRONMENT Directorate D - Water, Chemicals & Biotechnology ENV.D.2 - Marine 4 Document: POMESA_17-2018-04 Title: Informal meeting of EU Water Directors and EU Marine Directors, 26-27 May 2011, Budapest DOC 2.3.b Guidance Document on Economic and Social Assessment: draft update Prepared by: DG ENV & co-chairs Date modified: 29/01/2018 Available under: Circabc Agenda Item 2.3.b Working Group on Economic and Social Assessment 1
Transcript of Marine Strategy Framework Directive: Common Implementation ...€¦ · Web viewMarine Strategy...
Marine Strategy Framework Directive (MSFD)
Common Implementation Strategy18th Meeting of the Working Group on Programmes of Measures,
Economic and Social Analysis (WG POMESA)
23 March 2018
European Commission, XX), xx xx, xx Brussels
Agenda item:
EUROPEAN COMMISSIONDIRECTORATE-GENERALENVIRONMENTDirectorate D - Water, Chemicals & BiotechnologyENV.D.2 - Marine
4
Document: POMESA_17-2018-04
Title: Informal meeting of EU Water Directors and EU Marine Directors,26-27 May 2011, Budapest
DOC 2.3.bGuidance Document on Economic and Social Assessment: draft update
Prepared by: DG ENV & co-chairs
Date modified: 29/01/2018
Available under: Circabc
Agenda Item 2.3.b Working Group on Economic and Social AssessmentEconomic and Social Analysis for the Initial Assessment for the Marine Strategy Framework Directive: A Guidance Document
Document number: 2.3.bDate: 20/05/2011Submitted by: EC DG ENV
Guidance Document on Economic and Social Assessment: draft update
1
2
Working Group on Economic and Social Assessment Economic and Social Analysis for the Initial Assessment for the Marine Strategy Framework Directive: A Guidance Document
This Guidance was developed by an informal European working group of experts and stakeholders in the context of the Common Implementation Strategy agreed by Member States and the European Commission (EC) for supporting the implementation of the MSFD. Among other topics, the Guidance identifies key issues for consideration in undertaking the social and economic analyses for the initial assessment.
The original version was adopted by the EU Water and Marine Directors at a meeting on 26-27 May 2011 in Budapest. It was revised in 2018 and adopted by *** on ***.
3
EUROPEAN COMMISSIONDIRECTORATE-GENERALENVIRONMENT
Working Group on Economic and Social Assessment
ECONOMIC AND SOCIAL ANALYSIS FOR THE
INITIAL ASSESSMENT FOR THE MARINE STRATEGY FRAMEWORK DIRECTIVE: A GUIDANCE DOCUMENT
A NON-LEGALLY BINDING DOCUMENT
[21 December 2010 ***to be updated]
4

5
TABLE OF CONTENT
INTRODUCTION ............................................................................................................................... 5
Purpose and status of this Guidance document .............................................................................................5
Content ........................................................................................................................................................ 5
Level of detail required for the Initial Assessment .........................................................................................6
The Working Group on Economic and Social Assessment (WG ESA) ...............................................................7
1. ECONOMIC AND SOCIAL ANALYSES IN THE MARINE STRATEGY FRAMEWORK DIRECTIVE ........................................................................................................................................ 8
1.1 DPSIR framework .................................................................................................................................. 11
1.2 Illustrative definitions of some key concepts .........................................................................................13
2. AN ECONOMIC AND SOCIAL ANALYSIS OF THE USE OF MARINE WATERS .........16
2.1 Different approaches for the analysis ....................................................................................................162.1.1. The Ecosystem services approach .........................................................................................................172.1.2. Marine water accounts approach .........................................................................................................18
2.2 Capturing the use of marine waters ....................................................................................................... 202.2.1 Direct use – economic sectors ................................................................................................................202.2.2 Direct use – other activities ....................................................................................................................202.2.3 Other benefits ........................................................................................................................................21
2.3 Identify pressures affecting the state of the marine waters ....................................................................22
2.4 Difference between the two approaches ...............................................................................................23
2.5 Identifying stakeholders affected by changes in policies (Impact) ...........................................................24
3. ‘BUSINESS AS USUAL’ SCENARIOS ...................................................................................25
3.1 Definitions and Core Features of a BAU Scenario ...................................................................................25
3.2 Establishing the Core Features of BAU Scenarios ....................................................................................263.2.1 Uses of marine waters, and their projected development .....................................................................263.2.2 Changes in Pressures from (projected) developments of uses of waters ...............................................283.2.3 The Legislative and Regulatory Framework ............................................................................................283.2.4 Change in Marine Environment under Business As Usual ......................................................................30
6
3.3 Common Issues in the Establishment of BAU Scenarios ..........................................................................303.3.1 Uncertainty around future trends in uses of marine waters ..................................................................303.3.2 Uncertainty around pressures and states ..............................................................................................313.3.3 Irreversible Effects ..................................................................................................................................313.3.4 Exogenous Environmental Trends ..........................................................................................................323.3.5 Transboundary and Regional Issues .......................................................................................................32
3.4 Guiding Principles .................................................................................................................................. 32
4. COST OF DEGRADATION ........................................................................................................ 35
4.1 The Ecosystem Service Approach ........................................................................................................... 354.1.1 Objective of the analysis ........................................................................................................................364.1.2 Suggested approach to the analysis .......................................................................................................364.1.3 Issues to consider ...................................................................................................................................37
4.2 The Thematic Approach ......................................................................................................................... 394.2.1 Objective of the analysis ........................................................................................................................394.2.2 Suggested approach to the analysis .......................................................................................................394.2.3 Issues to consider ...................................................................................................................................39
4.3 The Cost-based Approach ...................................................................................................................... 424.3.1 Objective of the analysis ........................................................................................................................424.3.2 Suggested approach to the analysis .......................................................................................................424.3.3 Issues to consider ...................................................................................................................................44
4.4 Valuation methods applicable to each of the approaches ......................................................................454.4.1 Valuation in qualitative, quantitative and monetary terms ....................................................................454.4.2 Capturing the Total Economic Value (TEV) of an ecosystem service ......................................................464.4.3 Qualitative and quantitative assessment ...............................................................................................464.4.4 Valuation studies ....................................................................................................................................46
4.5 Conclusion: choosing the most suitable approach ..................................................................................47
5. POTENTIAL DATA SOURCES ................................................................................................. 49
5.1 Introduction .......................................................................................................................................... 49
5.2 EU-level and international organizations ...............................................................................................495.2.1 DG MARE ................................................................................................................................................495.2.2 European Environment Agency (EEA) .....................................................................................................505.2.3 EUROSTAT ..............................................................................................................................................525.2.4 International Maritime Organization (IMO) ...........................................................................................545.2.5 Other organizations and companies .......................................................................................................55
5.3. Regional Seas conventions ................................................................................................................... 555.3.1 North-East Atlantic (OSPAR convention) ................................................................................................565.3.2 Baltic Sea: Helsinki Commission (HELCOM) ............................................................................................565.3.3 Mediterranean Sea (Barcelona Convention) ..........................................................................................58
7
5.3.4 Black Sea (Bucharest Convention) ..........................................................................................................58
5.4 Programmes and projects ...................................................................................................................... 595.4.1 ODEMM ..................................................................................................................................................595.4.2 SeaDataNet ............................................................................................................................................595.4.3 KnowSeas ...............................................................................................................................................595.4.4 Clamer ....................................................................................................................................................595.4.5 Hermione ...............................................................................................................................................605.4.6 Meece ....................................................................................................................................................605.4.7 Sesame ...................................................................................................................................................60
5.5 Some examples of national data sources and applications .....................................................................60
REFERENCES .................................................................................................................................. 62
ANNEX A: SPATIAL, SECTORAL AND TEMPORAL ASPECTS .............................................65
ANNEX B: LESSONS LEARNT FROM THE WATER FRAMEWORK DIRECTIVE .............68
ANNEX C: LITERATURE .............................................................................................................. 75
ANNEX D: MEMBERS OF THE WG ESA ....................................................................................85
INTRODUCTION ............................................................................................................................... 7
Purpose and status of this Guidance document .............................................................................................7
Content ........................................................................................................................................................ 7
Level of detail required for the Initial Assessment .........................................................................................8
The Working Group on Programmes of Measures and Economic and Social Assessment (WG POMESA) ........9
1. ECONOMIC AND SOCIAL ANALYSES IN THE MARINE STRATEGY FRAMEWORK DIRECTIVE ...................................................................................................................................... 10
1.1 DPSIR framework .................................................................................................................................. 13
1.2 Illustrative definitions of some key concepts .........................................................................................15
2. AN ECONOMIC AND SOCIAL ANALYSIS OF THE USE OF MARINE WATERS .........18
2.1 Different approaches for the analysis ....................................................................................................182.1.1. The Ecosystem services approach .........................................................................................................192.1.2. Marine water accounts approach .........................................................................................................20
8
2.2 Capturing the use of marine waters ....................................................................................................... 212.2.1 Direct use – economic sectors ................................................................................................................212.2.2 Direct use – other activities ....................................................................................................................222.2.3 Other benefits ........................................................................................................................................23
2.3 Identify pressures affecting the state of the marine waters ....................................................................24
2.4 Difference between the two approaches ...............................................................................................24
2.5 Identifying stakeholders affected by changes in policies (Impact) ...........................................................25
3. ‘BUSINESS AS USUAL’ SCENARIOS ...................................................................................27
3.1 Definitions and Core Features of a BAU Scenario ...................................................................................27
3.2 Establishing the Core Features of BAU Scenarios ....................................................................................283.2.1 Uses of marine waters, and their projected development .....................................................................293.2.2 Changes in Pressures from (projected) developments of uses of waters ...............................................303.2.3 The Legislative and Regulatory Framework ............................................................................................303.2.4 Change in Marine Environment under Business As Usual ......................................................................32
3.3 Common Issues in the Establishment of BAU Scenarios ..........................................................................323.3.1 Uncertainty around future trends in uses of marine waters ..................................................................333.3.2 Uncertainty around pressures and states ..............................................................................................333.3.3 Irreversible Effects ..................................................................................................................................333.3.4 Exogenous Environmental Trends ..........................................................................................................343.3.5 Transboundary and Regional Issues .......................................................................................................34
3.4 Guiding Principles .................................................................................................................................. 35
4. COST OF DEGRADATION ........................................................................................................ 37
4.1 The Ecosystem Service Approach ........................................................................................................... 374.1.1 Objective of the analysis ........................................................................................................................384.1.2 Suggested approach to the analysis .......................................................................................................384.1.3 Issues to consider ...................................................................................................................................39
4.2 The Thematic Approach ......................................................................................................................... 414.2.1 Objective of the analysis ........................................................................................................................414.2.2 Suggested approach to the analysis .......................................................................................................414.2.3 Issues to consider ...................................................................................................................................41
4.3 The Cost-based Approach ...................................................................................................................... 444.3.1 Objective of the analysis ........................................................................................................................444.3.2 Suggested approach to the analysis .......................................................................................................444.3.3 Issues to consider ...................................................................................................................................46
4.4 Valuation methods applicable to each of the approaches ......................................................................474.4.1 Valuation in qualitative, quantitative and monetary terms ....................................................................47
9
4.4.2 Capturing the Total Economic Value (TEV) of an ecosystem service ......................................................474.4.3 Qualitative and quantitative assessment ...............................................................................................484.4.4 Valuation studies ....................................................................................................................................48
4.5 Conclusion: choosing the most suitable approach ..................................................................................49
5. POTENTIAL DATA SOURCES ................................................................................................. 51
5.1 Introduction .......................................................................................................................................... 51
5.2 EU-level and international organizations ...............................................................................................515.2.1 DG MARE ................................................................................................................................................515.2.2 European Environment Agency (EEA) .....................................................................................................525.2.3 EUROSTAT ..............................................................................................................................................535.2.4 International Maritime Organization (IMO) ...........................................................................................54
5.3. Regional Seas conventions ................................................................................................................... 555.3.1 North-East Atlantic (OSPAR convention) ................................................................................................555.3.2 Baltic Sea: Helsinki Commission (HELCOM) ............................................................................................565.3.3 Mediterranean Sea (Barcelona Convention) ..........................................................................................575.3.4 Black Sea (Bucharest Convention) ..........................................................................................................58
5.4 Programmes and projects ...................................................................................................................... 58
5.5 Some examples of national data sources and applications .....................................................................58
REFERENCES .................................................................................................................................. 60
ANNEX A: SPATIAL, SECTORAL AND TEMPORAL ASPECTS .............................................64
ANNEX B: LESSONS LEARNT FROM THE WATER FRAMEWORK DIRECTIVE ............67
Figures
Figure 1: Illustration of linkages between requirements on economic analysis and other requirements by the Marine Strategy Framework Directive (2008/56/EC).
Figure 2: DPSIR (Drivers Pressures Status Impact and Response) framework
Figure 3: Illustration of the gap analysis that can be used in the analysis of cost of degradation.
Figure 4: Overview of cost categories
Tables
Table 1: How the ecosystem service (X) and the Marine water account (O) approaches captures different aspects.
10
11
INTRODUCTION
Purpose and status of this Guidance document
On the 17th of June 2008, Directive 2008/56/EC of the European Parliament and of the Council was published. The Marine Strategy Framework Directive (MSFD) establishes a framework for community action in the field of marine environmental policy. Within this framework, Member States (MS) shall take the necessary measures to achieve or maintain Good Environmental Status in the marine environment by the year 2020 at the latest. For that purpose, marine strategies shall be developed and implemented in order to protect and preserve the marine environment, prevent its deterioration or, where practicable, restore marine ecosystems in areas where they have been adversely affected. In addition, marine strategies shall prevent and reduce inputs into the marine environment, with a view to phasing out pollution (as defined in Art. 3(8) in the MSFD), so as to ensure that there are no significant impacts on or risks to marine biodiversity, marine ecosystems, human health or legitimate uses of the sea.
The design of a framework aims to contribute to the coherence between the different EU-policies, including the EU’s maritime policy, Common Fisheries Policy and the existing water and nature directives, Habitats Directive (92/43/EEC), Birds Directive (2009/147/EC codified version of Council Directive 79/409/EEC) and Water Framework Directive, WFD (2000/60/EC). The implementation of the MSFD will therefore occur in combination with these policies, for which the real impacts are in many areas unknown.
From the above, it is clear that the MSFD focuses on the protection of marine waters as defined in Art. 3.1 of the MSFD, by preventing deterioration or, where practicable, restoration of marine ecosystems. Therefore, the Directive calls for a management that aims at achieving Good Environmental Status and enables sustainable use. This means that the Directive does not prohibit the use of the marine environment, but requires the use to be sustainable.
Content
This Guidance Document focuses on the economic and social analyses required for supporting the development of the Initial Assessment (art. 8.1 of the MSFD). It describes what the MSFD says, and presents some methods that could be applied.
This Guidance Document will help practitioners in:
12
Understanding which economic and social analyses is required under the MSFD (Chapter 1).
Understanding the place and role of the social and economic analyses within the policy processes related to the MSFD (Chapter 1).
Using the results of the economic analysis for aiding decision-making and supporting the development of programs of measures (Art. 5 MSFD).
Acquiring some common language, which can be helpful when discussing socio-economic issues at the international level in the Regional Seas conventions (e.g. definitions of key concepts in Chapter 1).
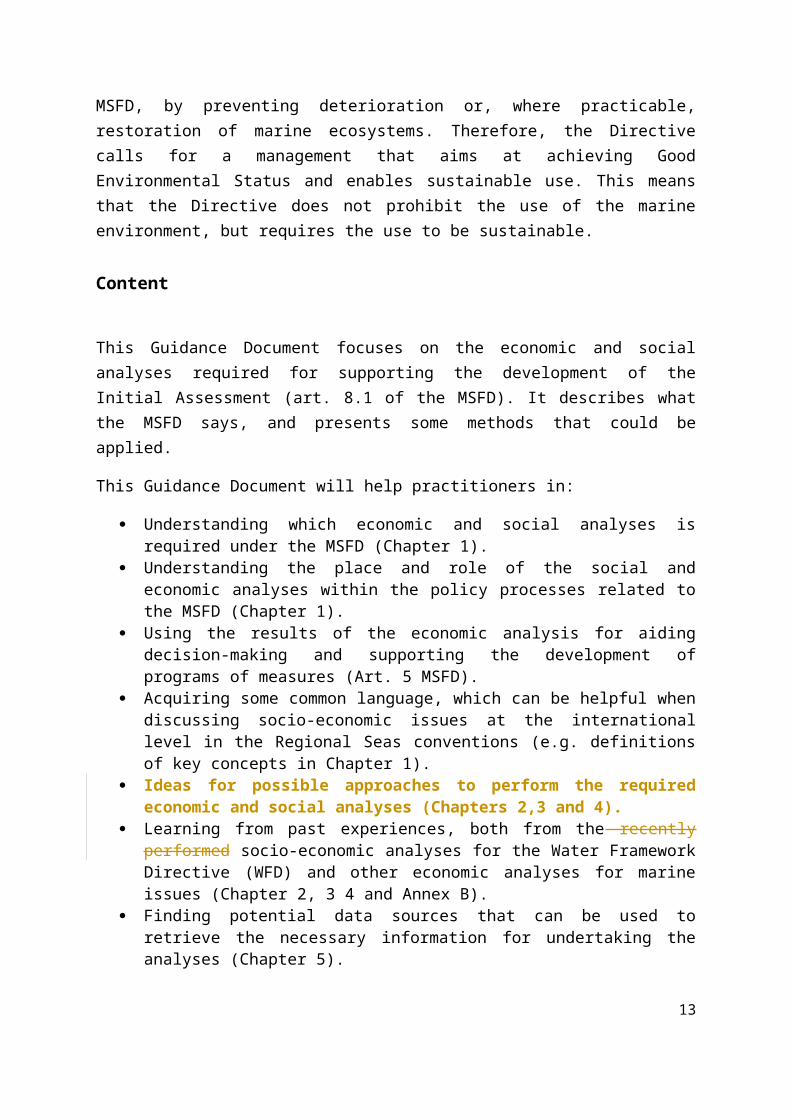
Ideas for possible approaches to perform the required economic and social analyses (Chapters 2,3 and 4).
Learning from past experiences, both from the recently performed socio-economic analyses for the Water Framework Directive (WFD) and other economic analyses for marine issues (Chapter 2, 3 4 and Annex B).
Finding potential data sources that can be used to retrieve the necessary information for undertaking the analyses (Chapter 5).
Reporting on the economic and social analysis to the European Commission as required by the MSFD (COM assignment and link with the working group on Data Information and Knowledge Exchange group, DIKE).
Level of detail required for the Initial Assessment
The MSFD is an ambitious piece of legislation not only in terms of its overall objective of achieving good environmental status by 2020, but also because it requires marine strategies to apply an ecosystem-based approach covering a diverse set of descriptors. The guidance contained in this document aims to respond to that level of ambition by describing some approaches that use the DPSIR (Drivers Pressures Status Impact Response) framework and account for the full range of ecosystem goods and services. However, it is recognised that there is a significant gap between theoretical ideals and what can practically be done in the short-term to meet the MSFD’s 2012 deadlines. For example, data are generally lacking on non-economic uses, non-use values, correlations between drivers, pressures and state and their spatial scale. Member States will therefore need to focus on making best use of the available data in order to account for marine uses and cost of degradation for the purposes of their Initial Assessment, whilst working towards more comprehensive coverage over the longer term. This will inevitably mean using a mix of quantitative and qualitative data, employing expert opinion and being transparent about levels of certainty and confidence in the assessment. A number of examples of how Member States are managing this are presented in this Guidance document.
This guidance is advisory only and not binding on Member States.
13
The Working Group on Programmes of Measures and Economic and Social Assessment (WG ESAPOMESA)
This Guidance has been developed by an informal European working group of experts and stakeholders in the context of the Common Implementation Strategy agreed by Member States and the European Commission (EC) for supporting the implementation of the MSFD. By the time of the revision of this document, WG ESA hasPOMESA had met four17 times with steadily increasing level of attendance from Member State participation,States plus representation from the European Commission, European Environment Agency (EEA), United Nations Environment Programme (UNEP), some of the Regional Conventions and other stakeholders1. Papers for the meetings, including meeting records and other background material are available through CIRCA2. Apart from the production of this Guidance, an important value of the meetings has been to create an active network of marine policy-makers and economists and the means to exchange views and experience during the implementation process. The chairs of the working group are particularly grateful to the experts who have volunteered to act as lead authors and reviewers of the various parts of this document.
The Guidance builds on:
The expertise and experience of members of the working group; The expertise with Water Framework Directive studies carried out throughout Europe; The results of marine studies carried out throughout Europe; Regular interactions with technical experts of the Common Implementation Strategy; Input and feedback from a wide range of experts and stakeholders that participated in
a series of workshops and conferences.
1 See Annex D for a list on WG ESA members.
2Link to Circa: http://circa.europa.eu/Members/irc/env/marine/library?l=/implementation_coordinat/economic_analysis/assessment_stockholm&vm=detailed&sb=Title
14
1. ECONOMIC AND SOCIAL ANALYSES IN THE MARINE STRATEGY FRAMEWORK DIRECTIVE
The economic and social (i.e. socio-economic) analyses required by the MSFD need to be understood in the context of the general objective of the Directive. The MSFD requires Member States to achieve or maintain Good Environmental Status (GES) in their waters by 2020 (Art 1.1 MSFD). The Directive states in Art. 1.3 that Member States shall, when developing marine strategies, apply an ecosystem-based approach to assess the state of their marine area and that Member States shall undertake “an analysis of the predominant pressures and impacts, including human activity, on the environmental status of those waters” as well as “an economic and social analysis of the use of those waters and of the cost of degradation of the marine environment” (Art. 8.1 MSFD).
There are a number of analytical milestones specified along the way to achieve or maintain GES. These are:
An initial assessment of the current environmental status of a Member State’s marine waters (to be completed by July 2012) (Art 8.1 MSFD);
A determination of what GES means for those waters (to be completed by July 2012) (Art.9 MSFD);
Establishment of targets and indicators designed to show whether a Member State is achieving GES (to be established by July 2012) (Art. 10 MSFD);
Establishment of monitoring programmes to measure progress towards GES (to be established by July 2014) (Art.11 MSFD);
Establishment of programmes of measures designed to achieve or maintain GES (to be developed by July 2015 and made operational by July 2016) (Art.13 MSFD).
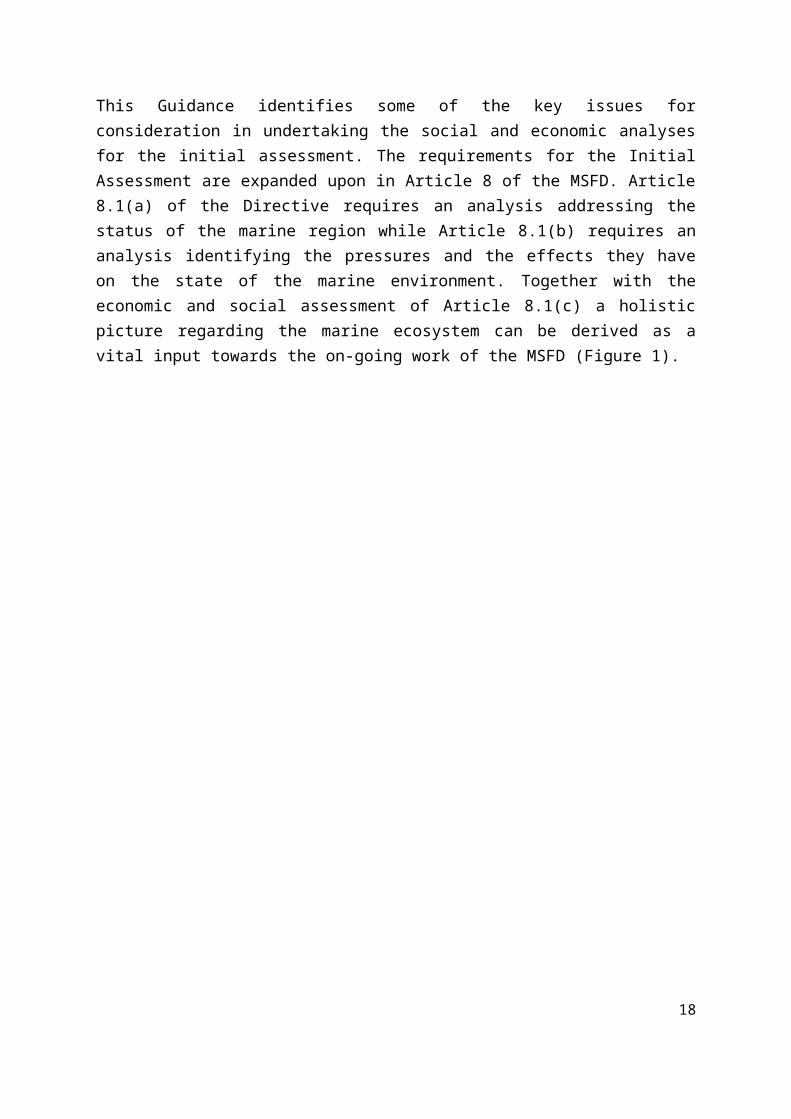
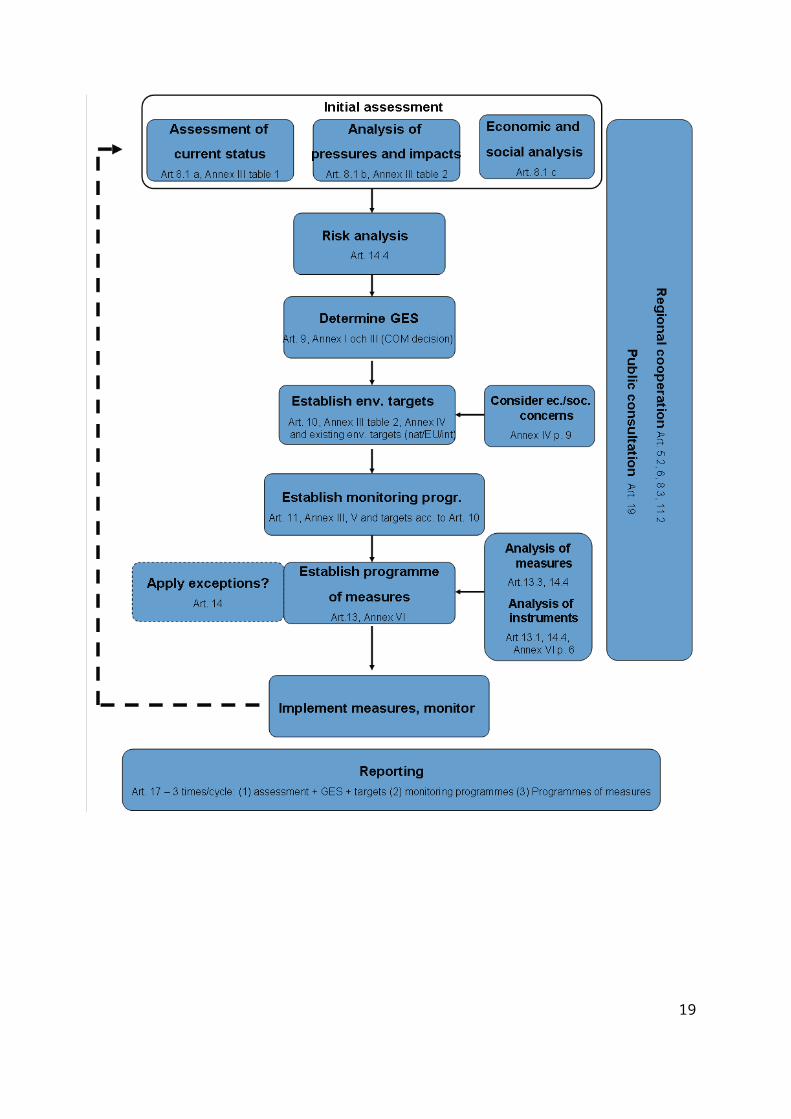
This Guidance identifies some of the key issues for consideration in undertaking the social and economic analyses for the initial assessment. The requirements for the Initial Assessment are expanded upon in Article 8 of the MSFD. Article 8.1(a) of the Directive requires an analysis addressing the status of the marine region while Article 8.1(b) requires an analysis identifying the pressures and the effects they have on the state of the marine environment. Together with the economic and social assessment of Article 8.1(c) a holistic picture regarding the marine ecosystem can be derived as a vital input towards the on-going work of the MSFD (Figure 1).
15
16
Figure 1: Illustration of linkages between requirements on economic and social analysis and other requirements by the Marine Strategy Framework Directive (2008/56/EC). (Note that the “risk analysis” is here placed according to a direct interpretation of the wording in the MSFD. However, another interpretation could indicate an analysis of risk to be included also later on in the process)
17
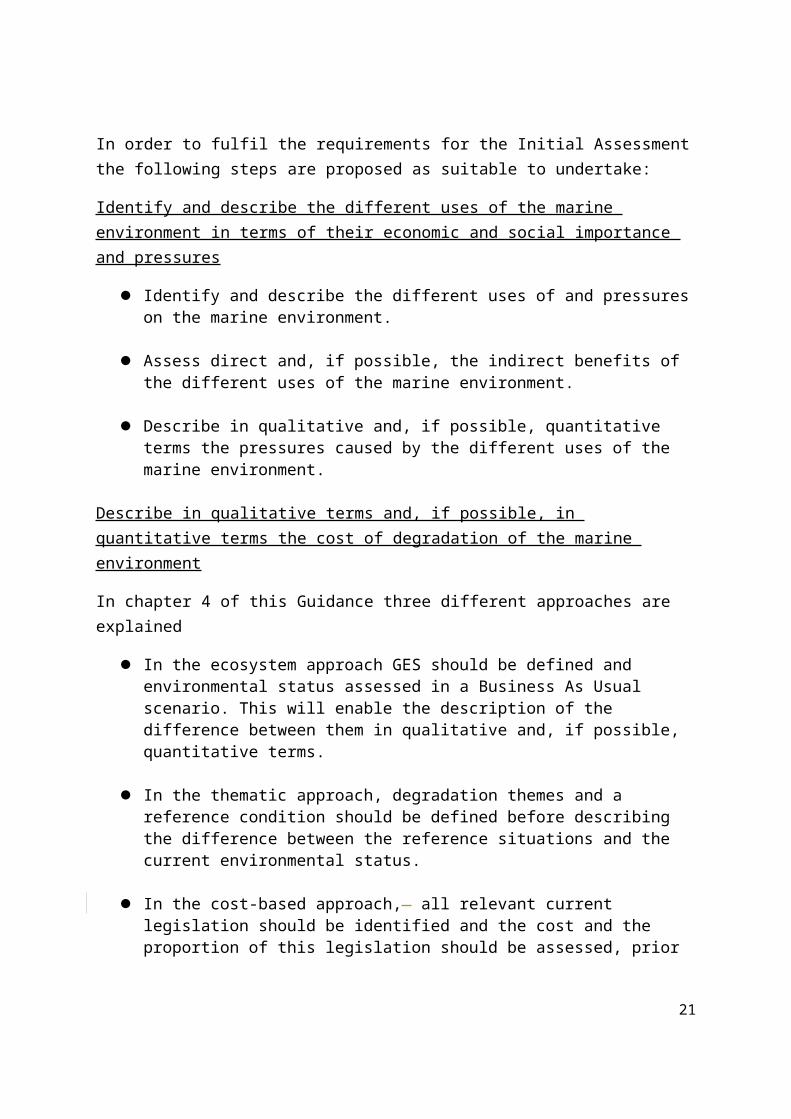
In order to fulfil the requirements for the Initial Assessment the following steps are proposed as suitable to undertake:
Identify and describe the different uses of the marine environment in terms of their economic and social importance and pressures
Identify and describe the different uses of and pressures on the marine environment.
Assess direct and, if possible, the indirect benefits of the different uses of the marine environment.
Describe in qualitative and, if possible, quantitative terms the pressures caused by the different uses of the marine environment.
Describe in qualitative terms and, if possible, in quantitative terms the cost of degradation of the marine environment
In chapter 4 of this Guidance three different approaches are explained
In the ecosystem approach GES should be defined and environmental status assessed in a Business As Usual scenario. This will enable the description of the difference between them in qualitative and, if possible, quantitative terms.
In the thematic approach, degradation themes and a reference condition should be defined before describing the difference between the reference situations and the current environmental status.
In the cost-based approach, all relevant current legislation should be identified and the cost and the proportion of this legislation should be assessed, prior to adding the costs attributable to the protection of the marine environment together.
Later on in the process - develop a programme of measures 3
Describe in qualitative and, if possible, quantitative terms the needs to reach GES of the marine environment, using the list of pressures in table 2 Annex III MSFD.
Identify possible measures for achieving or maintaining GES, including potential regional or European Union policies.
Define the costs of the possible measures.
Estimate potential benefits of these (alternative programmes of) measures
Define a programme of measures taking into account cost effectiveness, cost-benefit considerations, and the distribution of costs as well as implications in neighbouring regions, and proportionality of costs.
1.1 DPSIR framework
3 Not dealt with in this guidance document18
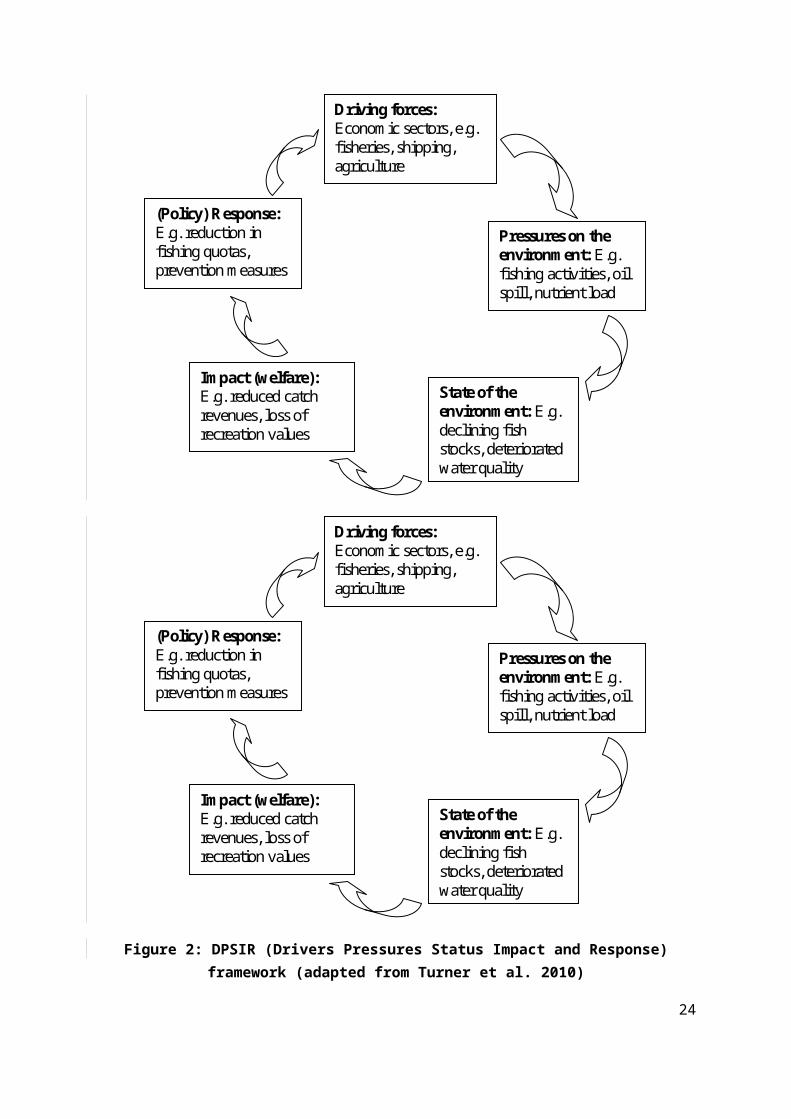
The DPSIR (Drivers, Pressures, State, Impact and Response) framework is a theoretical framework used for systematically analysing environmental problems on the one hand and identifying measures on the other hand (Turner et al. 2010). The DPSIR framework starts with a description of the Driving forces that cause environmental Pressures. These Pressures cause a change in the State of the environment. This may have Impacts on human wellbeing. If these Impacts are unwanted, policy-makers will Respond by taking actions aimed at the Driving forces to reduce their Pressures. This is the basic idea (Figure 2).
This framework can also be used to understand and represent the various steps of the MSFD. The Driving forces are the activities, and the social factors driving these activities, that use the marine waters, either directly or indirectly, and consequently impact the marine environment. The use of marine waters puts Pressure on the marine environment in various ways. The pressures degrade the State of the environment, which Impact upon human health and the value of ecosystem goods and services provided. Society can decide to Respond by acting on the Driving forces, Pressures, State as well as the Impact of the problem by implementing measures and incentives (i.e. policy instruments).
The description of the Drivers, Pressures, State and Impact of the marine water use obtained under Art. 8 MSFD will therefore be an important input in setting environmental targets (Art. 10 MSFD). The risk assessment (Art. 14 MSFD) is a vital element to determine the programme of measures (Art. 13 MSFD). This stresses that it is of utmost importance to link the economic and social analyses of the use of the marine environment with the work done by the people describing the effects on marine waters of human activities.
19
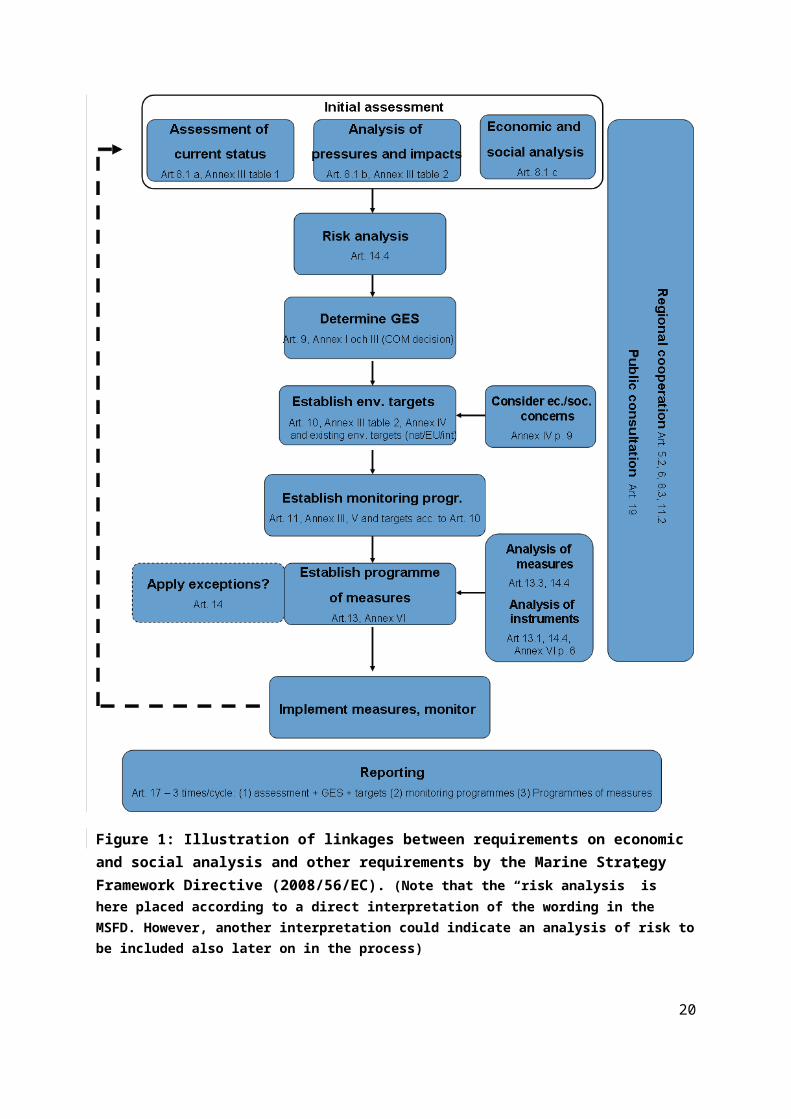
Figure 2: DPSIR (Drivers Pressures Status Impact and Response) framework (adapted from Turner et al. 2010)
20
Driving forces: Economic sectors, e.g. fisheries, shipping, agriculture
Pressures on the environment: E.g. fishing activities, oilspill, nutrient load
State of the environment: E.g. declining fishstocks, deterioratedwater quality
Impact (welfare): E.g. reduced catchrevenues, loss of recreation values
(Policy) Response: E.g. reduction in fishing quotas, prevention measures
Conceptually an Initial Assessment should aim to articulate the full range of uses of a Member State’s marine environment and the associated impacts, including:
The current level of environmental quality of a Member State’s marine area(s) The current uses of the marine area(s), and The pressures and impacts on ecosystem services that result from these uses.
An Initial Assessment should also articulate how these would evolve over time in the absence of the MSFD (in the first cycle of implementation), or in the absence of an update to the Programmes of Measures under the MSFD that is being considered (in any subsequent cycle of implementation) (See chapter 3 on Business as Usual (BAU) scenarios). However, much of the information that would be necessary to undertake a conceptually rigorous assessment may not be available at present, meaning more pragmatic approaches may have to be used. These are also presented in this guidance document.
1.2 Illustrative definitions of some key concepts
Some of the key concepts needed for the Initial Assessment are defined below.
Use of marine waters
The use of marine waters is defined as any human activity using or influencing the marine space and/or ecosystem goods and services provided by marine waters.
Ecosystem services
Ecosystem services are defined as goods and services – benefits – that the ecosystem provides to human beings (MEA, 2005)4. Ecosystem services can be separated into final and intermediate services. Definitions of ecosystem services have been evolving from the
4 “Ecosystem services contribute to economic welfare in two ways – through contributions to the generation of income and well-being, and through the prevention of damages that inflict costs on society. The latter is characteristic of certain ecosystem services that provide insurance, regulation and resilience functions” (DEFRA 2007). For example the fishing industry derives benefits from harvesting fish stocks (a ‘provisioning’ ecosystem service) but does so at the cost of other ecosystem services e.g. the ‘supporting’ service through the maintenance of balanced food webs.
21
Millennium Ecosystem Assessment (MEA) and The Economics of Ecosystems and Biodiversity (TEEB) to the Intergovernmental Panel on Biodiversity and Ecosystem Services (IPBES, referring to Nature Contributions to People). The EU Mapping and Assessment of Ecosystems and their Services (MAES) refers to all of these5.
Degradation
Degradation is the reduction in the provision of ecosystem services compared to another state.
Cost of degradation
The cost of degradation is the welfare foregone, reflecting the reduction in the value of the ecosystem services provided compared to another state.
Socio-economic analysis
A socio-economic analysis aims to identify the impact on human welfare of a given policy. This includes economic as well as social aspects, and may include consideration of the distribution of these impacts across stakeholders. In light of this definition, an explicit distinction between ‘economic’ and ‘social’ analysis is not necessary.
Baseline scenario/business as usual
A baseline, or a Business As Usual (BAU) scenario, describes the anticipated evolution in the environmental, social, economic and legislative situation in a marine environment over a certain time horizon in the absence of the policy under consideration (i.e. if the MSFD is not implemented).. In the first cycle of implementation6, this is the scenario where the MSFD is not implemented. In subsequent cycles, it is the scenario where the Programme of Measures (POM) as defined in the most recent previous cycle is being implemented, but in the absence of any adaptation of that POM that may be considered.
Counterfactual
A counterfactual in the context of the MSFD is a description of the ecosystem services provided by the marine environment and the uses of the marine environment that are likely to been present if a policy decision had been taken differently.
Scenarios
5 "The benefits that people obtain from ecosystems (MA, 2005). The direct and indirect contributions of ecosystems to human wellbeing (TEEB, 2010). The concept 'ecosystem goods and services' is synonymous with ecosystem services. The service flow in MAES conceptual framework refers to the actually used service." See http://ec.europa.eu/environment/nature/knowledge/ecosystem_assessment/pdf/MAESWorkingPaper2013.pdf
6 Under Art.17, the marine strategies are to be kept up to date in a six-year cycle.22
Scenarios are projections of future states of the society and the environment based on specific assumptions about key drivers, such as population, economic growth, technological change or environmental policies.
Drivers
Drivers are those factors inducing the pressures (e.g. agriculture, fishing, subsidies, regulation) and are important to identify when looking into different policy options.
Pressures
Pressures are the forces that generate changes in the state of the ecosystem and thereby the provision of its services (e.g. nutrient load, salinity, fishing effort, oil spills, invasive species).
Impacts
Impacts are the consequences for human welfare based on the use of the marine environment, caused by the drivers and pressures affecting the state of the marine environment. However, this definition does not cover impacts on the environmental status of the marine waters as referred to in Article 8.1(b) MSFD.
Intermediate marine ecosystem services
Intermediate services are those that in a supporting or regulating way enable the final services and thereby influence human well-being indirectly, such as habitats and mitigation of eutrophication7.
Final marine ecosystem services
Final services are those that directly generate a benefit to humans, such as fish-stocks for fishing, water clarity for bathing.
Use value
The use value (both direct and indirect) captures the direct link between ecosystem services and human welfare8.
Non-use value
The non-use value describes, for example, the importance people attach to knowing that a healthy sea surrounds them and that this resource may be passed on to future generations.
7 This separation is important in order to capture all those services that are of significance for human well-being, not falling into the trap of only focusing on final services in the analysis. However, to avoid double counting when monetary evaluation is undertaken, only final services should be counted.
8 Direct use value includes the profits of fishers, recreational sea angling operators and the oil and gas industry etc. (“economic” value) and wider benefits that are more difficult to measure, since they are not captured by market interactions, for example recreational activities such as swimming, fishing, scuba diving etc., as well as the importance to local coastal communities of maintaining their marine heritage (“social” value). Indirect use value includes the benefits we derive from the environment’s provision of ecosystem services such as waste decomposition or carbon sequestration.
23
2. AN ECONOMIC AND SOCIAL ANALYSIS OF THE USE OF MARINE WATERS
Art. 8.1 (c) MSFD asks for an economic and social analysis of the use of marine waters, together with a description of the environmental pressures caused by these uses (8.1 (b)). The Directive does not prescribe how these analyses need to be performed in practice. The Directive states that the objective is a management of the marine waters based on the ecosystem approach (see Art. 1.3 MSFD). Member States may therefore wish to consider an assessment that goes beyond a description of economic and other activities that take place in their waters by also (as far as methodologically possible) quantifying the environmental pressures of those activities. Going forward, the key will be to collect information that is relevant to water management issues in the marine region and to stakeholders likely to be affected by the implementation of the Directive.
A range of approaches to undertake the Initial Assessment is available. In this Guidance document some of these are presented, but these examples are not intended to represent an exhaustive list of the available options or to direct Member States to the adoption of any particular approach. Whichever approach Member States eventually take, they should be mindful of the link drawn in the Directive between human activities and the pressures that are caused by them, as well as the impacts these pressures have on human well-being. This makes it important to combine the information on human activities with information on pressures and impacts. In order to guide policymakers in their decision-making the trade-offs between different policy alternatives need to be made clear and transparent.
In section 2.1 two different approaches for assessing the use of water are described. The different kinds of uses to be considered regardless of approach are described in 2.2, while 2.3 highlights the need to identify the pressures on the marine water. An illustration of what the different approaches are able to capture with regard to uses and pressures is described in 2.4. Finally, the impact of changes in marine uses on different stakeholders is discussed in 2.5.
2.1 Different approaches for the analysis
Two approaches are described below (the Ecosystem services approach and Marine Water Accounts) but several other approaches may be considered. The main difference between the ecosystem services approach and the Marine water accounts approach lies in the starting point and ambition level (thereby also data requirements). While the ecosystem services approach starts by identifying the ecosystem service of the marine area, the Marine Water Accounts approach takes its starting point at the economic sectors using the marine waters.
24
2.1.1. The Ecosystem services approach
The following steps can illustrate the ecosystem services approach:
1. Identify ecosystem services of the marine areas in cooperation with the analysis of status (Art. 8.1 (a) MSFD) and the analysis of pressures and impacts (Art. 8.1(b) MSFD).
2. Identify and if possible quantify and value the welfare derived from the ecosystem services using different methods to estimate the use and non-use values of these services described in section 2.2 below.
3. Identify the drivers and pressures affecting the ecosystem services.
The ecosystem services approach takes the ecosystem services obtained from the marine waters as a starting point. A checklist for marine ecosystem services (such as the one in DEFRA 2007, p.24) can be used to provide a preliminary qualitative assessment of the use of marine waters which services are likely to be affected by the MSFD and the likely importance of these. It is important to attempt to assess as many aspects of the ecosystem services as possible, aiming at a full consideration of the use of the marine ecosystem. Ecosystem services can be divided into final and intermediate services. Final services, (e.g. food provisioning, raw materials and energy) are usually easiest to identify since they link directly to human welfare, while intermediate services capture the underlying services that affect the final services (e.g. habitat, climate regulation, eutrophication mitigation and resilience) and will therefore require a deeper understanding of the dynamics and interactions of the marine ecosystems in order to be identified. In particular, the resilience of the ecosystem is a service that might be challenging to address. However, not including resilience in the assessment can, in the worst case, cause irreversible consequences (see also section 3.3.3)9. As a final step, a quantification of the environmental pressures the different uses have on ecosystem services and thereby human welfare is done.
At an early stage in the analysis, it is also important to take into consideration how different services may interact. This is important since the benefits derived from one ecosystem service may depend on its relationship with other services, and any impact on the latter service might reduce the benefit derived from the former. There may be complementarities as well as conflicts between services. After identifying ecosystem services, these should be linked to the relevant descriptors included in Annex I MSFD. The monitoring of these descriptors can capture changes of ecosystem services over time. This work should be done in cooperation with natural scientists.
9 Article 3.5(a) of MSFD includes resilience as an important factor of good environmental status, in that it is necessary for sustainable water use. Resilience is strongly correlated to the biodiversity of the marine ecosystem and, therefore, everything that has a negative effect on the biodiversity is likely to also have a negative effect on the resilience. The value of resilience lies in its insurance against unwanted outcomes (regime shifts) thus making it hard to value or even inform about, especially when the state of a possible new regime is uncertain (Folke et al. 2010; Gunderson et al. 2006 and Walker et al. 2004).
25
When the ecosystem services of concern have been identified the impact these have on people’s well-being can be addressed. When assessing the impact of ecosystem services on human welfare, it is critical to focus on the benefits generated by these services, as this is what affects human welfare directly. It is, therefore, the benefits rather than the services per se that are to be valued. These benefits can be described by identifying use and non-use values derived from final ecosystem services. Thereafter, stakeholders can be identified by connecting benefits with different actors (e.g. tourism, fishing, households, governments, public, etc). One theoretical approach of capturing and describing the benefits derived from the different services is the Total Economic Value (TEV) framework described in chapter 4 on the cost of degradation. The framework provides a systematic tool for considering the full range of impacts the marine environment has on human welfare. This includes both “economic” and “social” considerations.
Finally, the pressures and drivers affecting the ecosystem services of concern are identified, providing guidance and information when developing the scenarios used in the cost of degradation analysis.
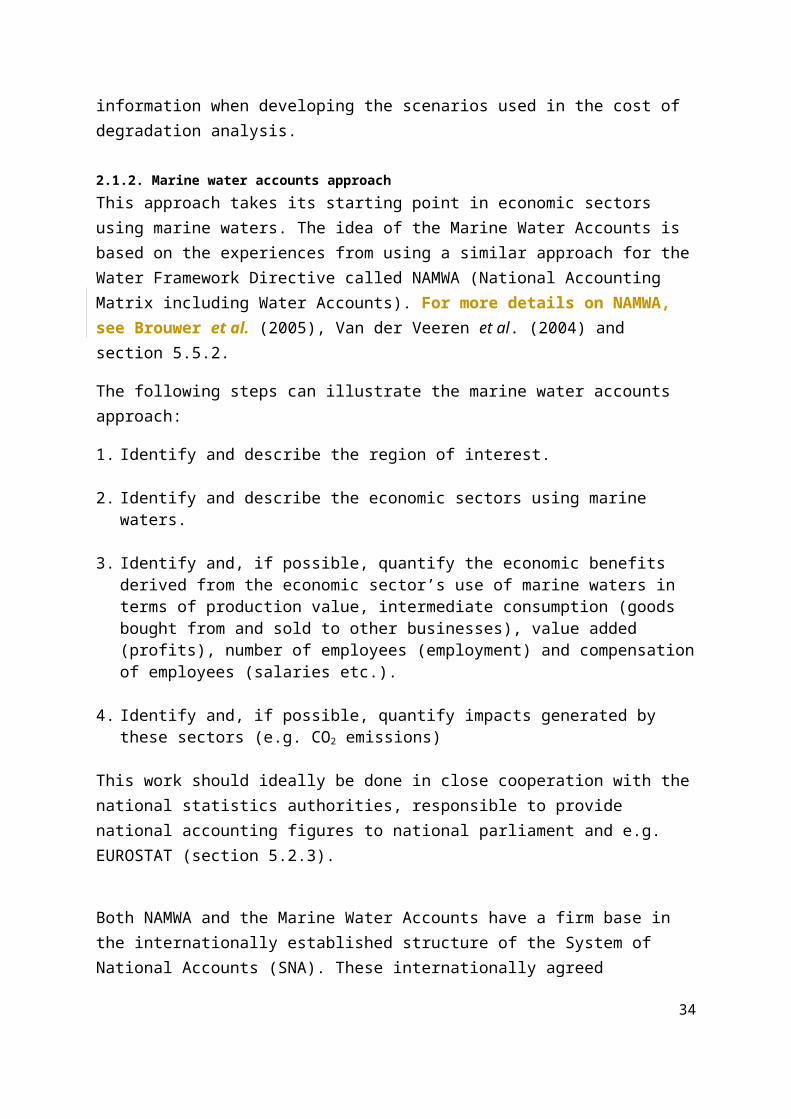
2.1.2. Marine water accounts approach
This approach takes its starting point in economic sectors using marine waters. The idea of the Marine Water Accounts is based on the experiences from using a similar approach for the Water Framework Directive called NAMWA (National Accounting Matrix including Water Accounts). For more details on NAMWA, see Brouwer et al. (2005), Van der Veeren et al. (2004) and section 5.5.2.
The following steps can illustrate the marine water accounts approach:
1. Identify and describe the region of interest.
2. Identify and describe the economic sectors using marine waters.
3. Identify and, if possible, quantify the economic benefits derived from the economic sector’s use of marine waters in terms of production value, intermediate consumption (goods bought from and sold to other businesses), value added (profits), number of employees (employment) and compensation of employees (salaries etc.).
4. Identify and, if possible, quantify impacts generated by these sectors (e.g. CO2 emissions)
This work should ideally be done in close cooperation with the national statistics authorities, responsible to provide national accounting figures to national parliament and e.g. EUROSTAT (section 5.2.3).
Both NAMWA and the Marine Water Accounts have a firm base in the internationally established structure of the System of National Accounts (SNA). These internationally agreed definitions and methods make it is possible to present data that are internationally
26
comparable. The Marine Water Accounts are based on the regional economic accounts. These give a quantitative description of the economic processes in the various regions in the country in such a way that the economic processes can be linked to the national accounts. The economic accounts consist of the following five indicators:
1. Production2. Use of intermediary products (at purchase prices)3. Gross value added (at market prices)4. Employers’ wages5. Labour force
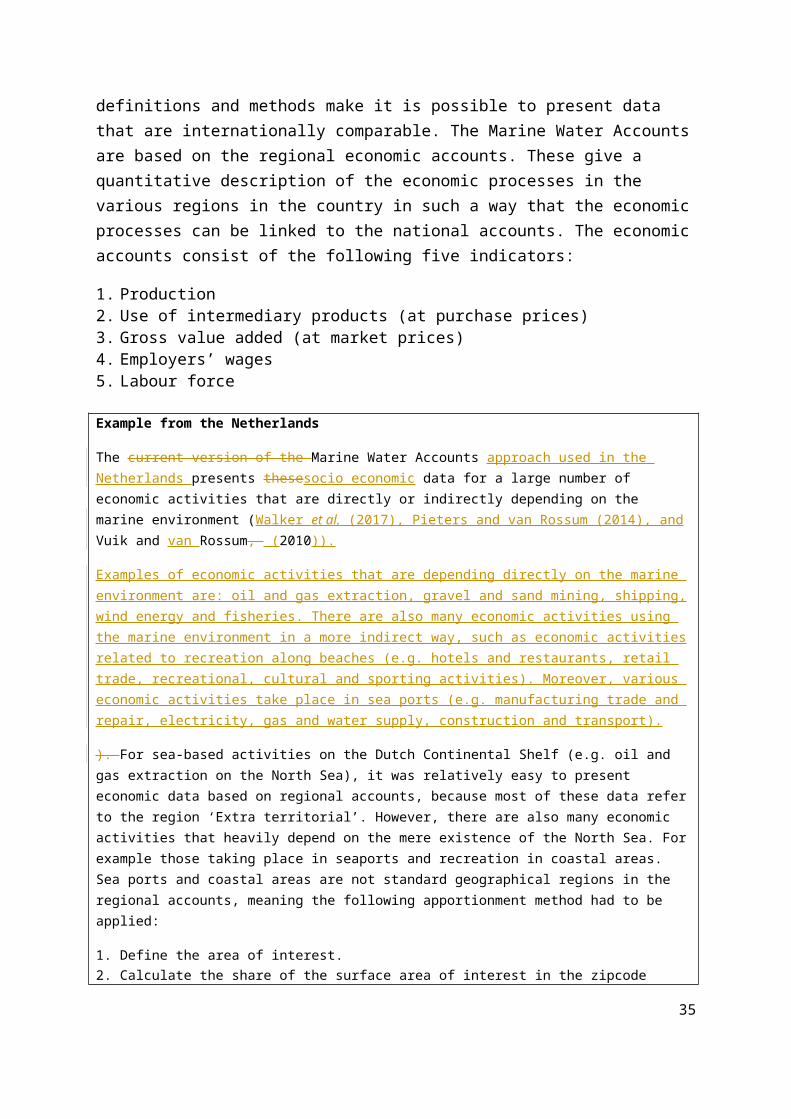
Example from the Netherlands
The current version of the Marine Water Accounts approach used in the Netherlands presents thesesocio economic data for a large number of economic activities that are directly or indirectly depending on the marine environment (Walker et al. (2017), Pieters and van Rossum (2014), and Vuik and van Rossum, (2010)).
Examples of economic activities that are depending directly on the marine environment are: oil and gas extraction, gravel and sand mining, shipping, wind energy and fisheries. There are also many economic activities using the marine environment in a more indirect way, such as economic activities related to recreation along beaches (e.g. hotels and restaurants, retail trade, recreational, cultural and sporting activities). Moreover, various economic activities take place in sea ports (e.g. manufacturing trade and repair, electricity, gas and water supply, construction and transport).
). For sea-based activities on the Dutch Continental Shelf (e.g. oil and gas extraction on the North Sea), it was relatively easy to present economic data based on regional accounts, because most of these data refer to the region ‘Extra territorial’. However, there are also many economic activities that heavily depend on the mere existence of the North Sea. For example those taking place in seaports and recreation in coastal areas. Sea ports and coastal areas are not standard geographical regions in the regional accounts, meaning the following apportionment method had to be applied:
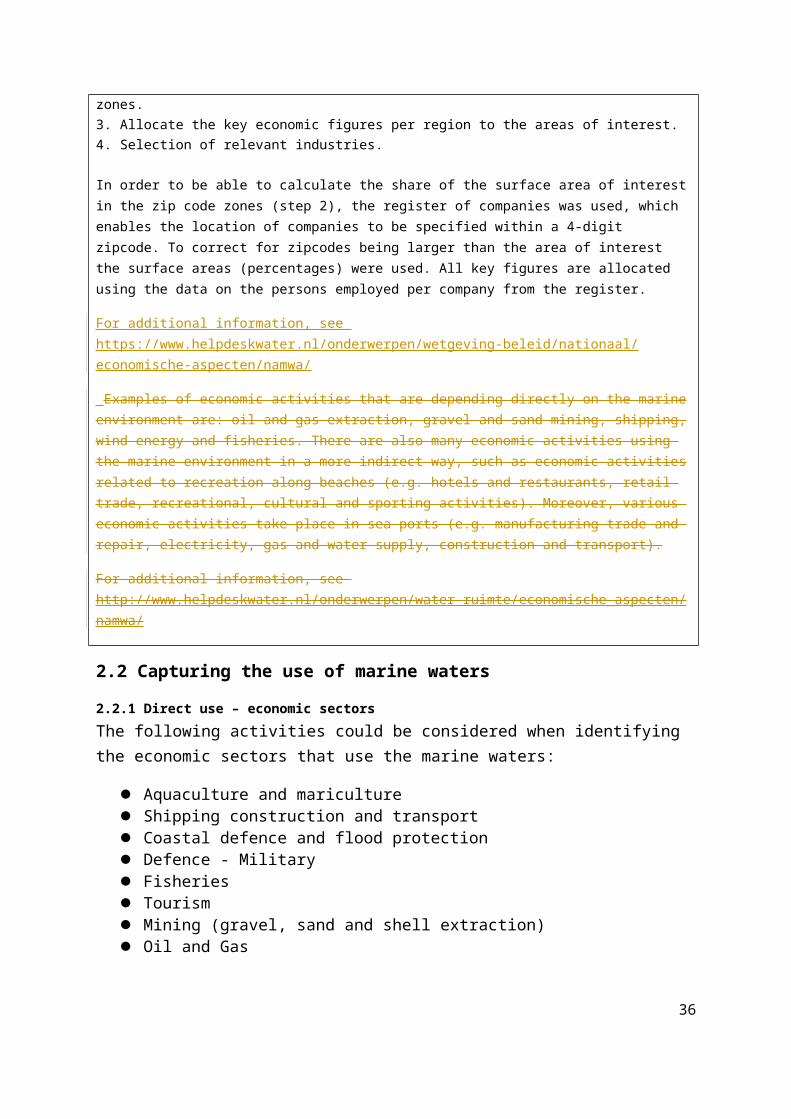
1. Define the area of interest.2. Calculate the share of the surface area of interest in the zipcode zones.3. Allocate the key economic figures per region to the areas of interest.4. Selection of relevant industries.
In order to be able to calculate the share of the surface area of interest in the zip code zones (step 2), the register of companies was used, which enables the location of companies to be specified within a 4-digit zipcode. To correct for zipcodes being larger than the area of interest the surface areas (percentages) were used. All key figures are allocated using the data on the persons employed per company from the register.
For additional information, see https://www.helpdeskwater.nl/onderwerpen/wetgeving-beleid/nationaal/economische-aspecten/namwa/
Examples of economic activities that are depending directly on the marine environment are: oil and gas extraction, gravel and sand mining, shipping, wind energy and fisheries. There are also many economic activities using the marine environment in a more indirect way, such as economic activities related to recreation along beaches (e.g. hotels and restaurants, retail trade, recreational, cultural and sporting activities). Moreover, various economic activities take place in sea ports (e.g. manufacturing trade and repair, electricity, gas and water supply, construction and transport).
27
For additional information, see http://www.helpdeskwater.nl/onderwerpen/water-ruimte/economische_aspecten/namwa/
2.2 Capturing the use of marine waters
2.2.1 Direct use – economic sectors
The following activities could be considered when identifying the economic sectors that use the marine waters:
Aquaculture and mariculture Shipping construction and transport Coastal defence and flood protection Defence - Military Fisheries Tourism Mining (gravel, sand and shell extraction) Oil and Gas Cables (e.g. Power transmission, Telecommunications, Pipelines - interconnectors) Renewable energy (e.g. wind farms) Storage (of gases e.g. CO2, CCS) Water abstraction Water transport The use of the marine water for waste and wastewater disposal (agriculture,
industry, households etc.) Supporting infrastructure (e.g. ports, marinas, navigation aids)
Potential indicators of importance for assessing use values of these sectors are:
Value added Production value Income Employment
The gross value added (GVA)10 of the industries above captures the net gain in terms of the contribution of these activities to the gross national product (GDP). When estimates of GVA are not available other market-based measures such as turnover could be used instead, but these should be treated with caution and caveated appropriately. Measures, such as employment in industry, are sometimes used as proxies for some of the wider value associated with these activities (e.g. social importance of an activity).
2.2.2 Direct use – other activities
There are other direct uses that are not directly reflected in the above sectors, for example, recreational activities and cultural benefits such as:
10 Gross value added is the difference between the sale price of a product and the total costs of production. To measure this both the inputs and outputs of production need to be measured.
28
bathing, sport fishing, scuba diving, and other recreational activities linked to the marine areas educational and research activities linked to the marine areas importance that local and national communities attach to their marine environment
These activities are of significance to human well-being but their value is not easily obtained. A number of methods (see e.g. Turner et.al. 2010 and DEFRA, 2007 ) exist that can be used to obtain a value for these.
Potential indicators of importance for assessing use values not reflected in market values are:
Expression of economic and social preferences, via public consultation, newspapers, etc.
Market prices for complementary products (e.g. fishing licenses, scuba equipment) Recreation values Different survey results (e.g. opinion polls, willingness-to-pay studies)
Identifying these uses contributes to a more holistic view on the benefit derived from the marine waters, even tough it might be challenging to quantify and evaluate these.
2.2.3 Other benefits
There are two kinds of benefits that people might derive from marine waters that are not captured by the direct uses described above, namely: indirect uses and non-use values.
Indirect use-values
There are also indirect use values where individuals benefits from ecosystem services supported by a resource rather than directly using it, such as:
the capacity of the ecosystem for carbon sequestration nutrient cycling resilience
These indirect benefits are often not recognized by people until they are damaged or lost.
Non-use values
In addition to use values, non-use values can also be identified and linked to the ecosystem services of marine waters. Non-use values are associated with benefits people obtain from simply knowing that a particular ecosystem is maintained, and consist of:
altruistic values (knowing that others can enjoy the services provided); bequest values (passing on ecosystem services intact to future generations); and existence values (satisfaction to humans from knowing that ecosystems continue to
exist).
29
The protection of the blue whale in the wild, or preservation of the Antarctic are examples of things that people put a value on even though they do not think they will see a blue whale in the wild or visit the Antarctic during their lifetime.
There is evidence that the non-use value associated with environmental assets may be large11.
Non-use values should be independent of geographic location and their valuation may introduce transboundary questions. For example, the environmental assets (such as marine biodiversity) that are valued are not confined to the waters of individual Member States.
Although difficult to capture, it should be highlighted that there may also exist option values (e.g. species with pharmaceutical applications). Non-use and option values are more difficult to capture than use values.
After identifying the use and non-use values the next step is to think about what criteria and methodology to use to capture the values. Different valuation tools as well as their pros and cons are described in, for example, Turner et al. (2010) and DEFRA (2007). One example of identifying ecosystem services is a survey that was conducted in all the Baltic Sea countries in 2010 with the objective of identifying the different benefits derived from the Baltic Sea (Swedish EPA, 2010)
2.3 Identify pressures affecting the state of the marine waters
The next step consists of identifying and, if possible quantifying the pressures originating from the different uses of the marine environment, using the indicative list of pressures set out in table 2 Annex III and analysis made under Art. 8.1(b) MSFD of the predominant pressures and impacts, including human activity, on the environmental status. This step requires communication/cooperation with natural scientists. The assessment of water use and the drivers and pressures affecting these provides a vital foundation for the gap and/or risk analysis, and thus for the cost-benefit analysis of potential MSFD measures.
In the ecosystem services approach, pressures are identified as factors affecting the state of the marine ecosystem. In the Marine Water Account approach, on the other hand, pressures are identified as the effect on marine waters by the economic sectors identified in the first step. There probably is an overlap, but there may also be differences between these two.
2.4 Difference between the two approaches
11 See for example Defra (2007) Chapter 4.30
An overview of what the two different approaches capture is illustrated in Table 1. An X symbolizes the ecosystem service approach, while an O symbolizes the Marine Water Accounts approach. To what extent they capture different uses are illustrated first, while how they capture the use in terms of pressures is illustrated next. It is clear from the table that the ecosystem services approach has a higher ambition level when it comes to capturing the different uses of the marine waters, while the Marine Water Account focuses on what can be obtained from the national accounts. If we focus on the uses that influence the state of the marine waters (i.e. pressures) the Marine Water Account approach only captures the emissions from of the economic sectors identified, while the ecosystem services approach aims at capturing all pressures that have an impact on the marine ecosystem. However, a high ambition level requires more time and resources to acquire the necessary information.
Table 1: How the ecosystem service (X) and the Marine water account (O) approaches captures different aspects
Identify Quantify Value
1. Uses
Direct use:
- Economic sectors XO XO XO
- Other uses X X X
Indirect use X X X
Non-use X X X
2. Pressures
Emissions from economic sectors XO XO X
Other pressures X X X
It should be emphasized that, even though it might be possible to value most of the different uses, it may be enough to identify and quantify in order to provide sufficient information for decision-making.
2.5 Identifying stakeholders affected by changes in policies (Impact)
31
Identifying the impact on welfare of different services provided by the marine waters is not a part of the water use analysis, but could provide some guidance regarding the ambition level of this analysis, since it gives indications of the relative importance of the different uses.
To identify the groups of people in society who will be affected by changes in ecosystem services is vital as this will determine how these impacts will be valued and over what population the values are to be aggregated. The value of recreational fishing can differ significantly between different marine areas due to differences in preferences, accessibility, rivalry with other uses (commercial fishing) etc. The spatial scale to identify the affected population will, therefore, differ according to the water use of concern and could be on a local, regional or international scale. Combining biophysical and economic information will require agreement on common spatial scale of analysis and reporting (see Annex A for a more thorough discussion regarding spatial and temporal scale). Changes in policies will also affect stakeholders, such as businesses and households, directly by perhaps putting restrictions on their use of the marine waters or indirectly as they finance (through e.g. taxes) certain measures aimed at protecting the marine waters. These distributional effects should be addressed in the programmes of measures.
32
3. ‘BUSINESS AS USUAL’ SCENARIOS
This chapter is intended to generate a common understanding of the role of Business As Usual (BAU) scenarios in the Initial Assessment for the Marine Strategy Framework Directive (MSFD). It also offers suggestions as to what BAU scenarios might contain, and how the content of BAU scenarios can be developed.
The analysis suggested in this chapter should be undertaken in light of the analysis required for part (b) of the Initial Assessment (an analysis of the predominant pressures and impacts, including human activity, on the environmental status of those waters) as this is concerned with establishing the qualitative and quantitative mix of the various pressures, as well as discernible trends.
3.1 Definitions and Core Features of a BAU Scenario
Chapter 1 defines a BAU scenario as follows:
“A baseline, or a Business As Usual (BAU) scenario, describes the anticipated evolution in the environmental, social, economic and legislative situation in the marine environment over the agreed time horizon in the absence of the policy under consideration (i.e. if the MSFD is not implemented).”. In the first cycle of implementation, this is the scenario where the MSFD is not implemented . In subsequent cycles, it is the scenario where the Programme of Measures (POM) as defined in the most recent previous cycle is being implemented, but in the absence of any adaptation of that POM that may be considered”
BAU scenarios therefore contain a number of core features. It is suggested that BAU scenarios should:
Identify the Member State’s uses of marine waters, and provide a projection as to how these uses could change over time;
Identify the Pressures that these uses of marine waters create, and provide a projection of how these could develop over time, also taking into account other pressures, e.g. regional pressures;
Identify relevant legislation, measures and voluntary agreements (at the international, EU, Regional Seas, and Member State levels) that could have an influence on the development of pressures over time; and,
Identify changes in the state of the marine environment that could result from changes and developments of pressures, over the time period considered by the Initial Assessment.
The role of BAU scenarios in the Initial Assessment are to provide projections of how the marine environment might evolve over time, given potential trends in uses of marine waters
33
and the existing legislative and regulatory framework governing those waters. Consequently, BAU scenarios may inform the development of estimates of the cost of degradation within the Initial Assessment if approach 1 presented in Ch. 4 (section 4.1) is applied. The BAU scenario plays a key role in the gap analysis, as it can be used to illustrate the potential difference between GES and the situation that might occur in the absence of measures to achieve GES. BAU scenarios may therefore also have a role in setting the context for the development of measures to achieve GES.
BAU scenarios should be developed to at least the same spatial and temporal scale that the other aspects of Member States’ Initial Assessments address. The
In the first implementation cycle, the time period chosen should cover the period up to 2020, in order to indicate the potential state of Member States’ marine waters over the GES timeframe, in the absence of MSFD. However, Member States’ BAU scenarios can extend beyond 2020 if desired, in order to allow the potential impacts of existing policies to be reflected more fully. Specific time periods, including reference years, used by Member States could be agreed at Regional Seas Convention level, with each member of a Regional Seas Convention using at least that time period.
In subsequent implementation cycles, the time period should cover at least the time until the next update of the marine strategy under Art.17. Again the time horizon can be extended beyond that date if desired, in order to allow the potential impacts of policies existing at the time to be reflected more fully.
The MSFD provides a list of descriptors for GES, and the Commission Decision on Criteria and Methodological Standards12 has provided further detail on these descriptors. However, there is not an ‘overarching’ or ‘composite’ GES descriptor: instead, the available GES descriptors cover a range of characteristics. It is therefore unlikely that a BAU scenario could be based around a single descriptor, as this would not be sufficient to incorporate the full range of uses of a Member State’s marine waters, how they might develop, and the diverse range of pressures they may generate on the marine environment. The focus of the analysis is to identify the difference between GES and what might occur if the MSFD did not exist, (in the first implementation cycle) or if the update of the strategy being considered did not exist (in subsequent implementation cycles), and it is possible for a range of uses to create pressures relevant to individual GES descriptors. It is therefore suggested that Member States’ Initial Assessments should develop a BAU scenario containing an analysis of how GES descriptors are affected from different uses of marine waters.
3.2 Establishing the Core Features of BAU Scenarios
12 The Commission Decision can be found at: http://eur-lex.europa.eu/LexUriServ/LexUriServ.do?uri=OJ:L:2010:232:0014:0024:EN:PDF http://eur-lex.europa.eu/LexUriServ/LexUriServ.do? uri=OJ:L:2010:232:0014:0024:EN:PDF
34
This section provides suggestions around how Member States could develop BAU scenarios for the different GES descriptors. These suggestions are not definitive, and do not represent binding recommendations for Member States.
3.2.1 Uses of marine waters, and their projected development
The first task in the establishment of a BAU scenario is to identify the uses made of a Member State’s marine waters, within the relevant geography. Member States are required to identify uses of their marine waters within the Initial Assessment13. However, the main challenge at this stage of developing a BAU scenario centres on how to establish how uses of marine waters, and their volume and intensity, might develop and evolve over the time period being considered.
The analysis around how uses might develop and evolve will necessarily involve projections of the development of uses of marine waters, and extrapolation of existing trends. These will be subject to the availability of quantitative data and information on proposed future uses of marine waters. Member States may adopt a ‘top-down’ approach to developing industry projections, where Member States make general projections for uses of marine waters based on extrapolation of trends on macroeconomic growth, and use of macroeconomic, industry, and population growth forecasts14. Where Member States have developed longer-term plans for the development of their marine waters, they may be able to adopt a ‘bottom-up’ approach when developing their projections. Each of these approaches has advantages: a top-down approach will be less data-intensive, while a bottom-up approach may offer more detail on the potential development of individual uses of marine waters, and may therefore be more directly useful for helping to identify the marginal impacts of specific policies. No specific approach is recommended for adoption by Member States: the approach Member States adopt should reflect the data they have available, and its robustness. However, it is suggested that potential future developments in uses of marine waters should be quantified where possible (e.g. where Member States have specific quantified evidence on changes in levels of activity within marine waters)15.
As the timescale covered by Member States’ BAU scenarios may be relatively long, it may be the case that there are insufficient quantitative data available to provide projections for uses of marine waters. Also, industry development plans may not exist for specific uses. Where such data do not exist, it is suggested that expert opinion should be sought from stakeholders and industry experts to investigate the potential longer-term evolution of uses of marine waters16. This opinion should be used to generate projections for those uses.
13 Examples of uses of marine waters are presented in Chapter 2,.
14 A guide to the types of data that might be available to Member States is presented in Chapter 5, on Data Availability.
15 Examples of quantified evidence that would be relevant for a ‘bottom-up’ approach such as the spatial maps included in the UK’s Charting Progress 2, and the Scottish Government’s Draft Plan for Offshore Wind in Scottish Territorial Waters.
35
It is possible that different uses of marine waters will impact on several GES descriptors. The projections made for different uses may therefore contribute to the analysis of different GES descriptors underpinning the BAU scenario.
3.2.2 Changes in Pressures from (projected) developments of uses of waters
The second task in the establishment of a BAU scenario is to estimate the effects that the projected developments of uses of marine waters might have on the marine environment (as defined by the GES descriptors). This task will require substantive input from scientists (both terrestrial and marine) across a range of disciplines, and close cooperation between scientists, industry and policymakers.
The initial phase of this task is to identify the pressures that individual uses of marine waters may impose on the marine environment, and establish how these correspond to the GES descriptors. This is largely contained within part Art 8.1(b) of the Initial Assessment, and as such approaches for undertaking this analysis are not discussed further in this Chapter.
The next phase involves assessing the effects of projected developments in uses of marine waters on the pressures they generate. In order to undertake this assessment, understanding is required of the relationship between changes in extent and intensity of activities and changes in pressures. The approach adopted, and the level of accuracy that can be expected, will vary according to the availability of scientific data and evidence (for instance, the availability of activity - pressure functions for specific uses of the marine environment, and relevant to the characteristics of their marine waters). It is recognised that whilst use of quantitative data and evidence would be preferable, Member States may not have access to evidence of this nature.
If this is the case, it is suggested that qualitative assessments should be undertaken. This could involve the use of ‘expert groups’, and application of relevant scientific knowledge and evidence from other Member States’ waters, to generate qualitative judgements on potential increases in different pressures from projected changes in uses of marine waters, their spatial extent, and the significance of their impact on the state of marine waters.
3.2.3 The Legislative and Regulatory Framework
BAU scenarios should also take account of the existing legislative and regulatory framework governing uses of marine waters, as this places limits and constraints on uses, and could mitigate pressures even in the absence of MSFD. (in the first implementation cycle; or in the absence of the update of the marine strategy being considered, in subsequent cycles). Consideration of the existing legislative and regulatory framework is therefore essential to 16 A range of qualitative consultative and deliberative techniques, such as the Delphi method (a communication technique, originally developed as a systematic, interactive forecasting method which relies on a panel of experts) can be used to seek expert and stakeholder opinion and translate these into qualitative evidence. It is beyond the scope of this guidance document to specify techniques or discuss their methodologies. However, the following resource offers further detail: UK Civil Service (2010), The Magenta Book: Guidance Notes for Policy Evaluation and Analysis
36
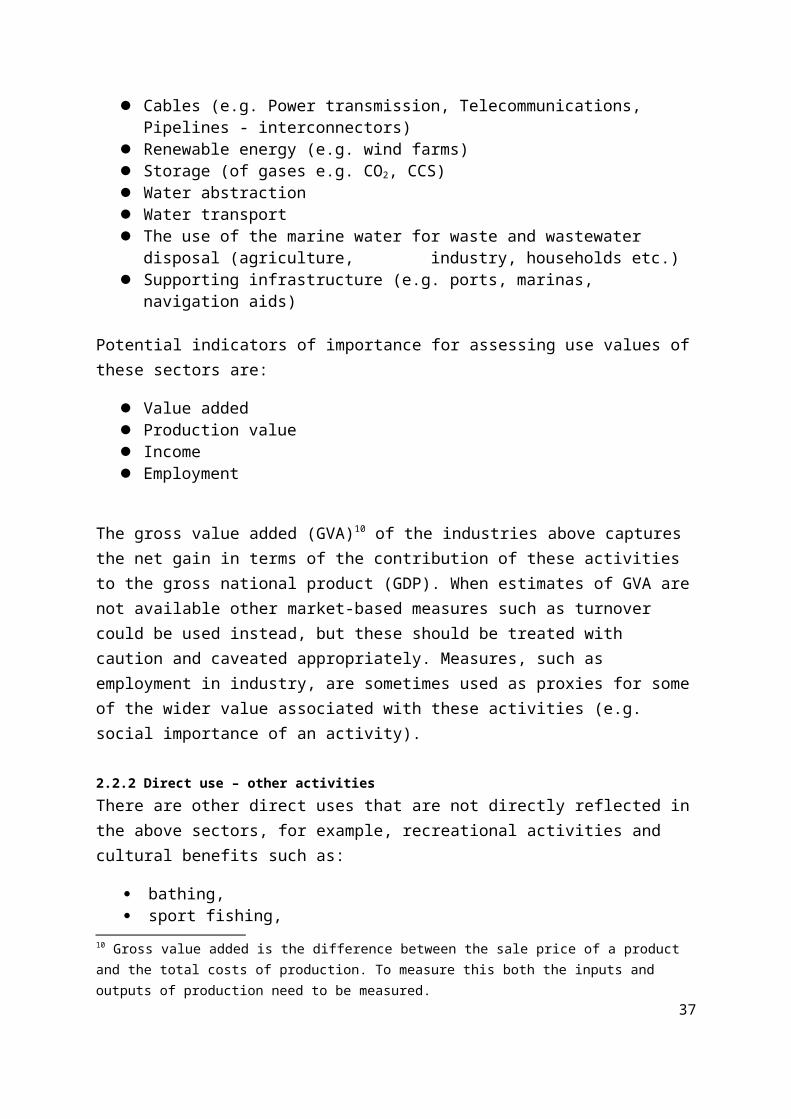
ensuring that a scenario of the evolution of the marine environment in the absence of MSFD can be developed.
The marine environment can be affected by both terrestrial and marine activities that make use of marine waters. Consequently, the effects of marine legislation and policies and terrestrial legislation and policies that significantly affect the marine environment should be included within BAU scenarios. Uses of marine waters are also governed by a range of legislation, regulations and voluntary agreements from different levels of government. It is therefore recommended that Member States take account of the impact of relevant legislation, regulations and voluntary agreements originating from international forums, e.g. the UN, the EU, Regional Seas Conventions, and from Member States themselves. Examples of international and EU instruments that may be relevant include:
Common Fisheries Policy Integrated Maritime Policy Common Agricultural Policy Natura 2000 Directive Birds Directive Habitats Directive Water Framework Directive Nitrate Directive The International Convention for the Prevention of Pollution from Ships (MARPOL) International Convention on the Control of Harmful Anti-fouling Systems on Ships International Convention for the Control and Management of Ships’ Ballast Water
and Sediments The Helsinki Convention (HELCOM) The Oslo Paris Convention (OSPAR) The Barcelona Convention The Bucharest Convention The Convention on the Prevention of Marine Pollution by Dumping of Wastes and
Other Matter
Legislation and agreements may also include transport and energy policies agreed upon at international forums e.g. the UN the EU, Regional Seas Conventions, as well as from Member States. These may also have an impact on the marine environment and if this is the case, this legislation should be included within the analysis.
An assessment of the impact of legislation and regulation should identify the uses of marine waters affected, and identify the impact on the pressures generated by that activity. Policy appraisal and evaluation evidence could provide a useful source of data for these impacts. However, the impact of existing legislation may be unclear from the existing evidence base. If this is the case, Member States could undertake qualitative analysis, using stakeholder and other expert opinion to assess the potential impact that existing legislation and regulations may have on uses of marine waters and the pressures they generate. Sensitivity analysis may also be used to identify the potential impact of different assumptions around the impacts of existing legislation and regulations. However, the analysis should not always assume that
37
policies and legislation are fully successful and deliver the full range of outputs and outcomes expected if there is not sufficient evidence available to support this.
The BAU scenario should also take account of relevant legislative and regulatory reforms that are likely to come into effect prior to 2020. This includes, for example, the reforms to the Common Fisheries Policy, which will come into effect in 2013, and the upcoming Ballast Water Convention. (in the first cycle of implementation; or prior to the time horizon of the scenario, in subsequent cycles). However, as the precise content of these future developments will be uncertain, it will be difficult to assess the impacts of these policies on uses of the marine environment and the pressures they create. Consequently, it is suggested that the BAU scenario should identify policies and legislation under development, but should not make assumptions about future content, beyond assuming that the range of current measures contained within those policies continue to remain in effect.
3.2.4 Change in Marine Environment under Business As Usual
The analyses suggested in the sections above should be combined to provide an assessment of which uses of marine waters that will have an impact on individual GES descriptors, and how the marine environment (as described by the GES descriptors) might change, given the projected changes in uses of marine waters, and the effect of significant legislation and regulation. Taken together, these represent the BAU scenario.
The results of the BAU scenario analysis will vary according to the availability of quantitative data and evidence on uses, pressures and states. However, as a minimum, Member States should seek to identify the trend under BAU for each descriptor (i.e. the analysis should indicate whether the pressures and impacts resulting from changing uses of marine waters are leading to a deterioration, improvement, or no change in the environmental state as described by the GES descriptors). It should also indicate whether, under the trends identified in the analysis, GES is likely to be achieved under each descriptor by 202017. (in the first cycle of implementation; or by the time horizon of the cycle, in subsequent cycles)18.
3.3 Common Issues in the Establishment of BAU Scenarios
There are likely to be a range of issues and difficulties associated with developing BAU scenarios. This section identifies some of these issues, and provides suggestions to address them.
17 A generic example of this sort of analysis may be found in Turner et al (2009): 11-17. However, the precise choice of drivers, pressures, states and scenarios should vary according to individual Member States’ and Regional Sea Conventions’ circumstances.
18 A generic example of this sort of analysis may be found in Turner et al (2009): 11-17. However, the precise choice of drivers, pressures, states and scenarios should vary according to individual Member States’ and Regional Sea Conventions’ circumstances.
38
3.3.1 Uncertainty around future trends in uses of marine waters
Each Member State’s BAU scenario will be affected by uncertainties around future trends in uses of marine waters, particularly as they will be based on projections of the development of uses of waters, underpinned by assumptions about the future. Although assumptions and projections should be informed by the available evidence, they may not accurately correspond to how uses of waters develop over time, as the information they will be based upon is likely to be incomplete, and because the future is inherently difficult to predict.
In order to address the potential uncertainty around future trends in uses of marine waters, sources of uncertainty should be explicitly identified within the BAU, and tested where possible. There are several measures that can be adopted in order to reflect the uncertainty inherent in projections around future uses of marine waters. The assumptions underpinning projections for each use should be clearly and explicitly identified, and a range of feasible and plausible alternative assumptions should also be presented. These can then be used to develop different ‘versions’ of the BAU scenario, based on different feasible, plausible and coherent combinations of assumptions about the development of uses of marine waters. This process will also require the selection of a ‘most probable’ combination of assumptions to form the ‘most probable’ BAU scenario. It is recommended that this selection process should include consultation with stakeholders and other experts, and that the rationale behind the selection of the ‘most probable’ assumptions should be clearly and transparently presented.
Another possible approach, for uses where quantitative data is available, involves the use of sensitivity analysis. This centres on testing how the most probable BAU might alter given small changes in projections for individual uses. Sensitivity analysis can help to illustrate the potential range of outcomes for specific sets of assumptions, where quantitative data is available.
3.3.2 Uncertainty around pressures and states
It is likely that each Member State’s BAU scenario will be affected by uncertainties around the changes in pressures and states associated with changes in uses of marine waters, particularly if there is a lack of available evidence around these links, or if the main source of evidence is qualitative. It is therefore suggested that a similar approach to that illustrated in Section 3.3.1 is adopted. The assumptions underpinning changes in pressures and states associated with changes in uses should be clearly and explicitly identified, and a range of feasible and plausible alternative assumptions should also be presented. These can then be used to develop different ‘versions’ of the BAU scenario, based on different feasible, plausible and coherent combinations of assumptions about the development of uses of marine waters. This process will also require the selection of a ‘most probable’ combination of assumptions to form the ‘most probable’ BAU scenario. It is recommended that this selection process should include consultation with scientific experts and that the rationale behind the selection of the ‘most probable’ assumptions should be clearly and transparently presented.
3.3.3 Irreversible Effects
39
It may be possible that the development of individual uses of marine waters may impose changes in pressures and states that lead to irreversible changes in the marine environment. Examples of such irreversible changes could include irreparable damage to rare marine features and habitats, or irreparable damage to important species. Identifying the potential for irreversible effects may be difficult in the Initial Assessment, as there may not be sufficient data to do so. However, it is suggested that the potential for severe or irreversible effects relating to specific GES descriptors should be noted in the analysis where there is evidence to suggest they may occur (see also note 7 on page 16).
3.3.4 Exogenous Environmental Trends
It may be possible that changes may occur in the marine environment during the time period covered by the BAU scenario for reasons other than developing uses of marine waters. For instance, warming of Member States’ waters caused by climate change could impact on biodiversity, non-indigenous species, populations of commercially exploited fish and shellfish, and on marine food webs. It is possible that these changes would occur regardless of Member States’ efforts to achieve GES. There is thus a need to be aware of which exogenous environmental trends that may impact on the marine environment within the BAU.
When developing their BAU scenarios, it is suggested that Member States should identify the GES descriptors that may be affected by exogenous environmental trends, and assess how those descriptor will be affected by the trends identified. This assessment should be based on quantitative scientific evidence where possible, but may also require the use of expert groups and other forms of qualitative evidence. The potential impact on the relevant descriptor, and the implications for GES, should then be explicitly presented within the BAU scenario.
3.3.5 Transboundary and Regional Issues
It may be possible that changes occur in the marine environment during the time period covered by the BAU scenario for reasons which originate from neighbouring countries uses of marine waters. For instance, it is estimated that approximately one tenth of the average total annual nitrogen input to the Baltic Sea during the period of 2001-2006 was from transboundary sources (HELCOM 2010). It is possible that such input would increase in the future regardless of Member States' efforts to achieve GES. To take another example, maritime transportation intensity in all European regional seas has increased significantly during recent years and is predicted to increase further affecting the BAU scenarios of Member States. There are several other regional and transboundary trends and features which may have potential impacts which needs to be identified and presented within the BAU scenario.
40
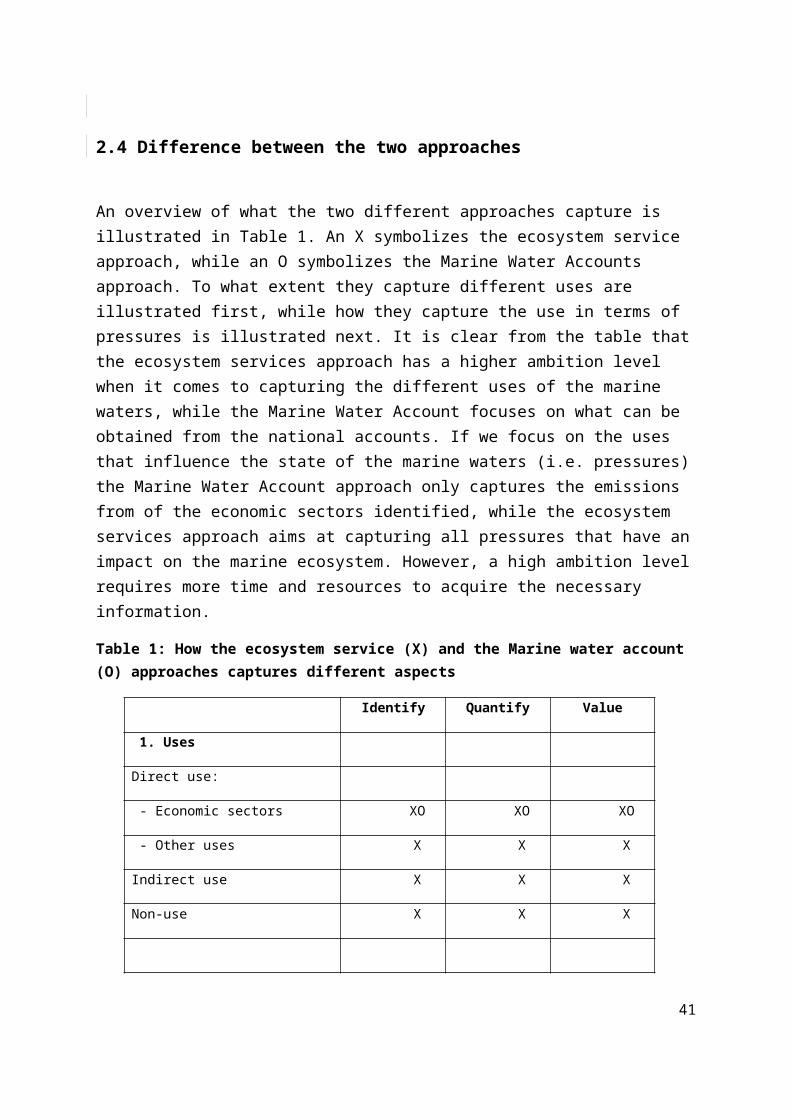
It is therefore suggested that the methodology and assumptions used to generate the BAU scenarios should be consistent in the whole marine region or subregion and that transboundary impacts and features are taken into account. This may require regional cooperation and coordination of Member States of the marine (sub)region and, where appropriate, also include land-locked countries in the catchment area, if the run-off from these countries affects the marine environment.
3.4 Guiding Principles
When preparing a BAU scenario, it is important to recognise that the results are projections, not predictions or forecasts of what will occur in the future. It is important that the assumptions used to generate the BAU scenario are explicit and transparent, and are based on robust evidence as far as is possible. Also, the sources of uncertainty within the analysis should be identified, and the analysis should test the assumptions used in order to reflect some of this uncertainty.
Overall, this Guidance document suggests that Member States’ BAU scenarios should include the following:
Identification of uses of marine waters, and the GES descriptors each use may affect; Potential future trends for the uses of marine waters; Analysis of the pressures and impacts arising from potential future trends in uses of
marine waters; Analysis of the impacts of legislation and regulation with significant effects on uses of
marine waters and the marine environment; Assessment of the potential for irreversible effects, and the impact of exogenous
environmental trends; Development, if possible, of several scenarios for evolution of the marine
environment (as described by the GES descriptors), and identification of a ‘most probable’ BAU scenario;
Sensitivity analysis around changes within the scenario.
Example from the first implementation cycle: The Danish approach
A BAU scenario is useful to fulfil the requirements for the MSFD when estimating the cost of degradation as required in Art. 8.1. (c). There is a strong linkage to the assessment of GES and the definition of the 11 descriptors. There also is a strong linkage to data availability.
First a Total Economic Value (TEV) for the present use of the marine environment has to be calculated (TEVesa). Normally the most recent data should be employed, e.g. 2010 data. Below is a non-exclusive list of relevant sectors:
Fishing Aquaculture Shipping Off-shore carbon hydrogen extraction
41
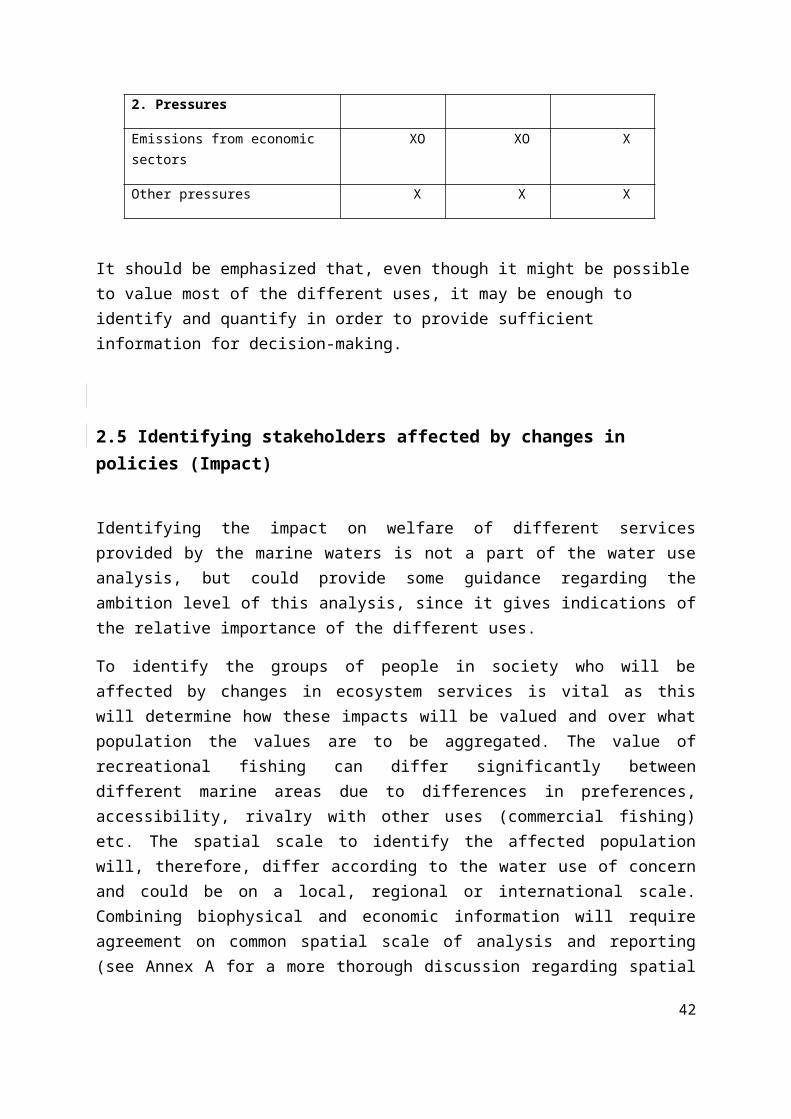
Off-shore wind mills and other energy producers. Marine tourism Dredging Extraction of marine raw materials Non-commercial activities (recreational angling, diving etc.)
The market value of these services is calculated to get TEVesa. An important task is to define the sectors and additionally what kind of value-added is relevant. The model is made from the following assumptions:
The 11 descriptors of GES (Annex I MSFD) are interpreted literally as the objectives that later on will be determined for the quality of the marine environment. This is an appropriate choice for use in the analysis.
Previously decided measures should already be implemented and are therefore not recognized in the cost of implementation of MSFD. The implementation of the WFD, Natura 2000 Directives, convention resolutions e.g. Baltic Sea Action Plan (BSAP) or voluntary agreements e.g. with the offshore industry, IMO-decisions (see section 5.2.4)are therefore not included in the cost of implementation of MSFD. An assumption is that bordering countries already meet decided initiatives, including those of MSFD or Regional Sea Conventions decisions.
The development until 2020 could result in impacts on the marine environment that are not known or handled today. This could include effects of climate change or that effects of implemented measures prove not to meet the expectations.
The analysis identifies and describes existing objectives, commitments and actions related to the topics that the individual descriptors cover. Furthermore, the analysis describes the sectoral (boating, fishing etc.) impact of the issues that the individual descriptors are covering. Overall, this material is called the base scenario. The scenario is therefore describing the developments up to 2016-2020 without the implementation of MSFD. The base scenario is then compared with a project scenario, which describes the requirements for further improvement of natural and environmental quality, which is assumed to be a result of the 11 objectives (descriptors). To the extent that there are differences between the two scenarios under the selected conditions, there will be a need for further developments to meet MSFD's objectives.
With input from the assessment of GES, the state of the environment without the MSFD in e.g. 2020 can thus be calculated (BAU-scenario). The TEV for the above sectors could then be calculated. This is called TEVbas. It is mainly a projection of TEVesa to e.g. 2020. In the same way, the TEV including measures under MSFD can be calculated. It is called the TEVpro.
Cost of degradation TEVdeg is then calculated as: TEVdeg = TEVpro - TEVbas
Source: Ministry of Environment, Denmark
42
4. COST OF DEGRADATION
This chapter is intended to generate a common understanding of the requirements regarding the economic and social analysis of the cost of degradation of the marine environment. The MSFD does not prescribe how this analysis needs to be performed in practice. This chapter will therefore illustrate how the analysis of the cost of degradation could be performed, including pragmatic examples showing how implementation could occur despite time, data and resource constraints. The approaches presented in this chapter are examples of how the analyses could be performed; Member States are not confined to the adoption of the approaches described here.
The analysis of the cost of degradation can usefully constitute a basis for later analyses in the Directive, for example as a base for the cost-benefit analyses of measures (Art. 13 MSFD) and/or as a foundation for the discussion of potential exemptions (Art. 14 MSFD). This chapter will present three approaches to the analysis of the cost of degradation. These approaches are: the ecosystem services approach, the thematic approach and the cost-based approach.
These three approaches are very different from one another, and Member States may take valuable lessons from all three. The ecosystem services approach may set your ambition, the thematic approach may provide a useful example of how to present your own framework, and the cost-based approach may appear to be useful when resources are scarce.
4.1 The Ecosystem Service Approach
The objective of the MSFD is an ecosystem-based approach to the management of the marine waters. The ecosystem services approach presented in this section builds on the scientific base for the ecosystem approach and is future-facing in order to provide a basis for answering the question “what should be done in the future to protect the environment?”
Summary: The steps of the ecosystem service approach
1. Define GES using the qualitative descriptors listed in Annex 1, list of elements in table 1 Annex II and list of pressures in table 2 Annex III in MSFD.
2. Assess the environmental status in a Business As Usual (BAU) scenario.3. Describe in qualitative and, if possible, quantitative terms the difference between the GES
and the environmental status in the BAU scenario, i.e. the degradation of the marine environment.
4. Describe the consequences to human well-being of degradation of the marine environment, either qualitatively, quantitatively or in monetary terms.
43
4.1.1 Objective of the analysis
The value of the ecosystem services, calculated as the potential difference between Good Environmental Status (GES) and the situation that might occur in the absence of measures to obtain GES, can be interpreted as the cost of degradation. In this way, the description of the cost of degradation can be used at an early stage to convince policy-makers why measures for the MSFD (or marine policies in general) are necessary in principle; to avoid the cost of degradation. Using this approach, the analysis identifies the ecosystem services, and associated benefits, which are potentially lost if the environment is negatively affected. These potentially lost benefits of achieving GES might later be compared to the costs of reaching the MSFD targets, when the programmes of measures will be specified.
4.1.2 Suggested approach to the analysis
When conducting an economic and social analysis, it is important to analyse the change between two or more states. When assessing the cost of degradation this will imply that the difference in the ecosystem services provided in each state should be analysed. In order to say something about the value of this difference, some sort of valuation should be applied. This does not imply, however, that everything has to be measured monetarily.
In this case, at least two scenarios for future states of the environment should be built. One is the Business As Usual (BAU) scenario, for which there is guidance in chapter 3. The other is an MSFD scenario. This scenario will consist of a best guess of how the ecosystems will evolve when the MSFD is implemented. Indicators for environmental status should be comparable in the two scenarios.
The classification of ecosystem services according to the Millennium Ecosystem Assessment (MEA 2005) could be helpful when describing the changes to ecosystem services that are reflected by the cost of degradation, to structure the approach to consider all potential ecosystem services and to avoid double-counting the costs of loosing these services.
In order to account for uncertainty about the future state of the world, various BAU scenarios can be defined and then applied to the MSFD scenario to see how they change the result. It is also possible to define various bundles of MSFD scenarios and compare them with the BAU.
The main focus is to describe and evaluate the difference in ecosystem services between the scenarios (gap analysis). A simple illustrative example is presented in Figure 3.
44
Figure 3: Illustration of the gap analysis that can be used in the analysis of the cost of degradation19
The figure illustrates the difference in environmental status between GES and the BAU, which is the first step in estimating the cost of degradation. There is also a cost of degradation in the years before and after 2020, (in the first implementation cycle; or the time horizon of the analysis, in subsequent cycles), which can all be added together to assess the present value of the full cost of degradation over time.20 This present value of the cost of degradation over time is likely to be hard to assess within the time available before the Initial Assessment is due, so analysing the cost of degradation at specific points in time is a pragmatic
19 Figure 3 is a simplified illustration for pedagogical purposes only. In practice, the environmental status does not change linearly, nor does it necessarily decline.
20 Note that estimating the full cost of degradation means estimating the difference between GES and BAU in each year of interest – NOT the total value of the marine environment.
45
alternative. As part of this approach it could be useful to consider the Total Economic Value (TEV) framework set out in section 4.4.2.
4.1.3 Issues to consider
To perform a quantified and monetized assessment of the full cost of degradation over time will require significant resources, and is likely to be infeasible in the timescales of the Initial Assessment. For that reason, an example of a qualitative analysis using this approach is provided, and then alternatives to assessing the full cost of degradation over time is described in the next two sections.
Irreversible effects can be defined as an irreversible change in human welfare or the services provided by the ecosystem (see note 7, page 17 and section 3.3.3 for further explanation). It is recommended that irreversible effects with large consequences are given special attention. The special feature of these changes is that there are no substitutes so the costs associated with them may be infinite and standard approaches to valuation may not be applicable. Irreversible effects with marginal consequences (perhaps where there are close substitutes) do not necessarily need to be given special attention because standard approaches to valuation of ecosystem services can be applied.
Example: The UK approach
In the UK, one starts with a categorisation of uses of the marine environment (a list of all ecosystem services), using the Millennium Ecosystem Assessment (MEA) framework with supporting, regulating, cultural and provisioning services labelled as primary, intermediate or final services to avoid double-counting. One identifies which of these are most relevant to each of the regions of the UK’s water defined in “Charting Progress 2 - The state of the UK seas”, prepared by the UK Marine Monitoring and Assessment Strategy (UKMMAS) community (2010) and which are likely to change most over the next 20 years in a way that will have a significant impact on human welfare. This is effectively a prioritisation exercise but also gives information on how the state of the environment provides us with valuable services.
Projections are produced of changes that might be expected in the state of the environment and that are relevant to the UK’s priority list of ecosystem services. The state of the environment is assessed using scientific indicators published in Charting Progress 2. Depending on the data available, these projections might be based upon forecasts of drivers and pressures, or may be a very simple extension of historic trends in the state of the environment.
As part of the UK’s plan to implement MSFD, discussions are taking place with scientific experts about what “Good Environmental Status” might look like, leading to the development of specific targets and indicators for GES.
The expected difference between the state of the environment under BAU and under GES will be described in words. For instance, as an example: “today, GES might mean around twice the amount of North Sea Cod that is currently observed. Without further action under the Common Fisheries Policy and other legislation affecting fish stocks, a minimal change to this over the foreseeable future is expected, so GES might mean around twice as much North Sea Cod compared to business as usual in 2020”. This difference will also be more explicitly quantified wherever possible.
What this means for the final ecosystem services from which people derive direct value will then be assessed,
46
and where it adds to the understanding of the cost of degradation, this value will be expressed in monetary terms. For instance, “with twice as much Cod in the North Sea, catch quotas could be sustainably relaxed by X %, meaning a €Y thousand increase in the annual value of the UK fishing industry. This is the value of the change in provisioning service, but there may also be an associated increase in non-use values.”
For further information see the UK’s Charting Progress 2 report: http://chartingprogress.defra.gov.uk/ http://chartingprogress.defra.gov.uk/ for the scientific evidence, and Turner et al (2010) for the theoretical foundations of the UK’s approach to economic and social analysis in the marine context.
4.2 The Thematic Approach
The thematic approach assesses the current cost of degradation. Recognizing that the approach in section 4.1 will be both time-consuming and heavily depend on data that might not be available, this and the following section will focus on more pragmatic approaches to how the analysis of the cost of degradation can be conducted in practice.
4.2.1 Objective of the analysis
Given the limited time and resources available to undertake this analysis, Member States could conduct an analysis of the present costs, expenses and loss of benefits related to the anthropogenic degradation of the marine environment. This is similar to the more future-oriented approach described in 4.1 but does not rely on uncertain forecasts of BAU and is therefore analytically less contentious. It still provides information that could be useful for
47
Summary: The steps of the thematic approach:
1. Define degradation themes, e.g. marine litter, chemical compounds etc.2. Define a reference condition, for example a condition where targets for good
environmental status are achieved3. Describe in qualitative and, if possible, quantitative terms the difference between
the reference condition and the present environmental status, i.e. the degradation of the marine environment, for all the degradation themes.
4. Describe the consequences to human well-being of degradation of the marine environment, either qualitatively, quantitatively or in monetary terms.
Summary: The steps of the thematic approach:
[1.] Define degradation themes, e.g. marine litter, chemical compounds etc.[2.] Define a reference condition, for example a condition where targets for good
environmental status are achieved[3.] Describe in qualitative and, if possible, quantitative terms the difference between the
reference condition and the present environmental status, i.e. the degradation of the marine environment, for all the degradation themes.
[4.] Describe the consequences to human well-being of degradation of the marine environment, either qualitatively, quantitatively or in monetary terms.
assessing the benefits of additional measures today, if not in the future, and may therefore have a place in the subsequent assessment of programmes of measures.
4.2.2 Suggested approach to the analysis
The idea is to estimate, qualitatively or quantitatively, different costs related to the current degradation of the marine environment, for example as they are stated in the figure illustrated in the French example (see box below). This will include accounting costs which refer to current expenditures on measures for environmental protection and environmental prevention; abatement costs and transaction costs, as well as opportunity costs that relate to loss of benefits for activities that suffer from environmental degradation.
4.2.3 Issues to consider
The implied counterfactual that the degradation is measured against with this approach is a possible situation where GES is achieved. This situation will have to be determined and explained for each cost type analyzed (e.g. the absence of green algae on the beach for the mitigation cost related to the cleaning of beaches). An example of this approach is given below.
Example: The French approach
It may be doubtful that a “total economic value assessment” for the marine ecosystem, including BAU scenarios or hypotheses relative to the GES, can be produced on time for the Initial Assessment (lack of data and scientific publications on the subject). Thus, it is not sure that the cost of degradation can be estimated by a “loss of total economic value” analysis.
Therefore, in France, it is planned to undertake the analysis of present costs, expenses, and loss of benefits which are supported by society and related to the anthropogenic degradation of the marine environment. Besides opportunity costs ( i.e. loss of benefits due to environmental degradation), accounting costs can be separated in three categories:
- Mitigation costs: aimed at protecting human population against negative effects of environmental degradation. These costs refer to an action principle but do not directly address environmental quality.
- Costs related to positive action in favour of the environment: they refer to specific investments to improve biodiversity state (e.g. ecosystem restoration, technology changes)
- Transaction costs: aimed at improving coordination levels (e.g. data collection on biodiversity state and interactions with human activities, monitoring, control, communication)
These four categories of costs can be summarized by the following figure:
48
Figure 4: Overview of cost categories
The aim of this analysis is not to get monetary values for each cost, which could be wrongly aggregated, but to get an exhaustive view of socio-economic impacts of environmental degradation, in order to build a “toolbox” for future cost/benefits analyses.
The cost analysis would be organized in a series of degradation “themes” that include, for example, the following:
Marine litter Chemical compounds Microbial pathogens Oil spills Eutrophication Invasive species Degradation of natural resources
49
4.3 The Cost-based Approach
The approaches in 4.1 and 4.2 address the cost of degradation with a mixture of qualitative and quantitative analysis. An alternative approach is to look for an estimate of the current cost of degradation using only existing quantitative data on costs of measures currently implemented to prevent degradation of the marine environment. The main difference is that the cost based approach does not include a reference condition.
4.3.1 Objective of the analysis
By providing an overview of the current costs incurred by the various sectors this gives an indication of who is currently paying how much, and how the burden is shared among economic actors. This gives insight over the existing financing structure for the protection of the marine environment (in much a similar way as the cost recovery issue in Art. 5 of the Water Framework Directive gave insight in the existing financing structures for the WFD-related activities). Information on the financing structure can be useful for the remainder of the MSFD process, when the costs of the additional measures become clear, to be able to analyse who will be paying for these costs.
4.3.2 Suggested approach to the analysis
This approach is based on the assumption that current costs for measures to prevent environmental degradation would only have been made if the value of what is obtained (preventing degradation) is higher than the cost of the measures. In this way, current costs can be seen as a lower bound estimate for costs of degradation. This is the same kind of reasoning one could follow when trying to estimate the value of a statistical life: if a municipal council decides to install traffic lights, the value attached to prevented casualties should at least be as large as the costs made to install the traffic lights (in addition to congestion costs), otherwise the municipality would not have installed the light.
It is important to be clear about the source of the costs that are identified. One approach might therefore be to enumerate the individual measures that are considered to currently be in place and have a significant effect upon the marine environment. The Dutch example in the box below gives a few ideas, which include both land and sea-based measures.
50
Summary: The steps of the cost-based approach
1. Identify all current legislation that is intended to improve the marine environment2. Assess the costs of this legislation to the public and private sectors3. Assess the proportion of this legislation that can be justified on the basis of its effect on
the marine environment (as opposed to health or on-shore environmental effects)4. Add together costs that are attributable to protecting the marine environment from all
the different legislation you have assessed.
Summary: The steps of the cost-based approach
[1.] Identify all current legislation that is intended to improve the marine environment[2.] Assess the costs of this legislation to the public and private sectors[3.] Assess the proportion of this legislation that can be justified on the basis of its effect on
the marine environment (as opposed to health or on-shore environmental effects)[4.] Add together costs that are attributable to protecting the marine environment from all the
different legislation you have assessed.
At the most basic level, the costs of these measures need to be considered in terms of;
Whether they are on land or on sea Whether they are paid by the private sector or If they are paid by the public sector The time scales over which they are paid
Point 1: Land or Sea
It will be informative to consider such efforts as sewage nutrient management that affect the marine environment. This involves consideration of the costs of on-going measures to maintain good inland water quality as well as the improvements due to measures being taken within the Water Framework Directive (WFD). Other activities which occur inland include the activities in harbours, those relating to aquaculture and land reclamation.
The sea-based costs are broader and can include consideration of the variety of sectors that operate on the marine environment. For instance fishing, oil and gas extraction, sand mining, shipping and wind farms. Such sea-based activities are concerned with the costs of complying with regulations for shipping such as non-toxic anti-fouling paint, marine litter and safe and clean shipping. The costs of assessing the potential effects of activities such as wind farming can be significant, as can the costs of closing sand abstraction areas for environmental protection.
Point 2: Private Sector
Costs paid by the private sector need to be carefully considered. Costs to businesses might be assessed on the basis of changes in profits (surplus) because this figure effectively represents the real costs to society (i.e. a loss in profit is a cost and an increase in profit is a benefit). For example, gear restrictions may increase a firm’s cost but the changes in gear may also (positively or negatively) affect the yield (revenue).
Point 3: Public Sector
The costs to the public sector might come in several forms. There are the costs of subsidies to avoid degradation from fishing, i.e. to encourage the adoption of new equipment with less environmental impact, as well as the costs of carrying out measures to meet land-based activities, for example, under the WFD. A potentially significant element of costs could come from simply running the sections of the government which are concerned with avoiding degradation of the marine environment, and a useful unit to quantify this is the cost of a Full Time Employee (FTE).
Point 4: Timescales
In many cases, on-going projects may not actually be incurring any costs in 2010 so looking exclusively at costs incurred today could lead to a wrong estimate of the true costs. For example a wind farm can take up to seven years to get through the planning process. One approach might therefore be to take an average of these costs over the seven years.
51
Certainly, not all of the costs of the current measures that are identified will be the result of concerns about the marine environment. For example, land-based measures that relate to activities on land but which have effects on the marine environment may also be justified for the environmental improvements they create on land or in fresh water – limiting agricultural run-off through the Nitrates Directive (91/676/EEC) provides an example (Walker et al., 2010). It is therefore suggested that Member States adopt an approach to define the extent to which the measure is justified on the basis of its effects on the marine environment. For instance, in the Dutch approach in the box below, an assumption is made about the percentage of the total costs of the measure attributable to effects in the marine environment.
4.3.3 Issues to consider
As stated before, the cost-based approach focuses on the current public and private spending to prevent further degradation compared to the present situation. It is explicitly not intended to present benefits of future measures to achieve the MSFD, which is somewhat different from the previous two approaches.
Many of the costs of the current measures will be the result of concerns in other areas than the marine environment. For example, measures implemented by agriculture and wastewater treatment plants have resulted in a serious reduction in nutrient loads to the marine environment. How many of these measures that should be included in the analyses, is an important issue to consider when conducting the analysis of the cost of degradation.
Example: The Dutch approach
This approach focuses on the present situation and describes the cost of avoiding degradation.
Various types of costs currently incurred for preventing environmental degradation of the marine environment are included.
The sea-based measures which were considered were chosen because they were intended to, and have a significant effect upon the Dutch North Sea environment. Sand and shell mining site locations are considered, as are regulations regarding discharges of polluted water from oil and gas installations and the costs of producing Environmental Effect Reports (EERs) for wind farms. In terms of fisheries and aquaculture, costs of subsidies to fisheries were considered and limitations on cockle fisheries were considered. The effect of Natura 2000 areas on the fisheries sector is also documented but not included in current costs since it has not yet been implemented. Shipping was considered in terms of relevant contributions to the International Oil Pollution Compensation (IOPC) Fund, the costs of less environmentally damaging anti-fouling materials and other technical measures built into ships, harbour reception facilities for waste, beach cleaning and other waste disposal regulations. Ballast water measures were also considered. Other sea-based measures include restrictions on sea based dumping sites and measures to minimize the environmental impact of defence. The construction of the Maasvlakte II involves several measures which were considered. These include EER reporting, habitat compensation, monitoring of environmental effects, staff concerned with such issues at the port of Rotterdam and the imposition of areas where fishing will be restricted on the fishing industry. The final element of sea-based measures concerns the costs to the government of running, researching, monitoring and enforcing the various measures outlined above.
52
Land-based measures were chosen when they had a significant effect upon the North Sea and an appreciable proportion of the intention for implementing the measures can be attributed to protecting the Dutch North Sea environment. Land-based measures relate to the various activities on land which affect the marine environment. These include (to varying extents) sewage treatment plants as well as the various measures which limit the effects of agriculture and industry upon inland water quality.
The core of the cost based approach used in the Netherlands is a quantitative analysis of the (financial) costs that are currently annually spent on measures that are taken to realise and maintain the current state of the marine environment. This method can only calculate the cost of degradation to the extent that society is currently spending money to avoid degradation (public and private spending). Therefore, these costs can be considered to be a lower bound of the cost degradation.
In 2010, Walker et al used this approach as part of the preparation of the first round of the Initial Assessment. It analysed the costs incurred for a long list of both sea based and land based measures that were identified to contribute to the status of the marine environment in 2010. In 2015, the Dutch Programme of Measures for the MSFD was published. This made it possible to change to focus in the analysis towards the costs of measures mentioned in the Dutch Programme of Measures for the MSFD. As such, the costs calculated in this approach (can) now also cover the costs that contribute to reaching Good Environmental Status (GES). Where information is available on costs for other relevant measures not mentioned in the MSFD Programme of Measures, but also contributing to the quality of the Marine environment, these have also been included in the calculation. These include the costs to the government of various policies such as the Nitrates Directive (91/676/EEC) and the Water Framework Directive (2000/60/EC).
Costs are related to specific measures. These measures occur on land or sea. Therefore, data are split up into sea-based costs and land-based costs. The land-based measures make up the main share. Land-based measures are not purely intended for avoiding marine environmental degradation. This is accounted for by taking a certain percentage as relevant for the Dutch North Sea. For each type of land-based cost either 25% or 50% is taken to calculate the share that can be attributed to having an impact on the North Sea environment.
The categorisation used in the recent study by Strietman et al. (2017) is based on the uses and human activities in or affecting the marine environment as proposed by the Marine Strategy Regulatory Committee in November 2016.
A relatively large share of the total costs falls into the category ‘urban and industrial uses’. Measures within this category are related to several (high cost) land-based measures, such as sewage treatment. These measures mainly have an effect on inland water quality, but partially also on the North Sea environment (an example is treated sewage water that enters the sea through rivers). This is the reason why for these types of measures, only a proportion of the costs has been considered. Because the exact share of these effects on the Dutch North Sea environment is not known, a minimum of 5% and a maximum of 30% was chosen to have an effect (based on expert judgement). Most of the other categories have a much narrower cost range estimate. The relatively high costs of the category ‘urban and industrial uses’ in combination with the wide cost range applied also explains the relatively large minimum-maximum range in the total cost estimate.
The costs calculated in this study represent the lower bound of the actual cost of degradation. There are two reasons for this. First, this approach only calculates the cost of degradation to the extent that society is currently spending money to avoid degradation (and in this way contributing to Good Environmental Status/GES). The costs of potential additional (= not current) measures to fully avoid degradation are not taken into account. Second, for some measures, information about the costs was not available.
53
Source: Walker Strietman et al. (2010)2017).
4.4 Valuation methods applicable to each of the approaches
The approaches outlined in 4.1 and 4.2 use a range of types of valuation information. The approach in 4.3 uses a narrower range of quantitative data and easily available information on market valuation. The next chapter covers sources of data in more depth (chapter 5), but here it is discussed how to use broad types of valuation data that might be applied in each approach.
4.4.1 Valuation in qualitative, quantitative and monetary terms
4.4.2 Capturing the Total Economic Value (TEV) of an ecosystem service
Ecosystem services can give many benefits for different individuals, and it is important to try to capture all of these benefits. The Total Economic Value (TEV) framework provides a reference for different types of value that one may try to capture, and is a useful tool to demonstrate what an analysis of the cost of degradation is and is not including. The framework includes both economic and social considerations. To be useful for an analysis of the costs of degradation, the TEV framework could be applied on the change in ecosystem services following degradation, not as a total valuation of ecosystem services as such.
The TEV framework and the Millennium Ecosystem Assessment (MEA) framework for categorizing ecosystem services can be seen as complimentary. The TEV framework is a useful tool for exploring what types of values for each ecosystem service one is trying to elicit. This helps in determining the valuation methods required to capture these values. On an aggregated level these values consist of use values and non-use values. For further reference, see for example Defra (2007, p 30).
54
Costs and benefits can be expressed in monetary terms, but this is not a requirement to call an analysis a cost-benefit analysis. Describing the values qualitatively will in many circumstances be sufficient, though it would normally be desirable to quantify or monetize the degradation where the data is available and sufficiently good.
Costs and benefits can be expressed in monetary terms, but this is not a requirement to call an analysis a cost-benefit analysis. Describing the values qualitatively will in many circumstances be sufficient, though it would normally be desirable to quantify or monetize the degradation where the data is available and sufficiently good.
4.4.3 Qualitative and quantitative assessment
For the approach in 4.1, the analysis of the costs of degradation could be an assessment of what will happen to the ecosystem services if the BAU scenario is followed compared to the MSFD or another scenario. Such a description could be made clearer by presenting some relevant images of the different environmental statuses. It is also important to remember that a qualitative assessment should substantiate the possible consequences for human well-being in the society.
The assessments can be qualitative and quantitative in the sense that they can provide evidence of the types of ecosystem services that might be lost and the extent of that loss, without a monetization of that loss (e.g. Annex C in Defra (2010) weighs up the merits of qualitative, quantitative and monetised assessment). The assessments could for example consist of analyses of changes in stocks (capital and natural resource) that are likely to take place or have taken place due to degradation of the marine environment.
4.4.4 Valuation studies
Sometimes ecosystem services are subject to free trade and pricing on markets. It is in this case straightforward to use data on market behaviour for estimating demand and supply, and these relationships can in turn be used to estimate changes in consumer surplus and profits. However, a considerably more typical case for ecosystem services is that they are not traded and priced on any market. To be able to compute the economic value of environmental change influencing also such non-market ecosystem services, special valuation methods have been developed within environmental economics.
Monetary valuation is a method for capturing people’s valuation of the ecosystem services. In an economic sense, this is captured by people’s willingness to pay for the benefits. Since economic values are about trade-offs that individuals are willing to make, economic values depend on the individuals’ preferences, i.e. their more or less fixed opinion about how important different goods and services are for their wellbeing. The focus on individuals’ preferences in economics reflects an anthropocentrically ethical point of departure, and also the importance of the principle of consumer sovereignty, i.e. that every individual is the sole person who can judge what is good or bad for her. A discussion of such points of departure is beyond the scope of this Guidance document, but it should be noted that the view that economic values are determined by individuals’ preferences implies that the results from valuation studies are not more informed that the individuals themselves are (Daily et al. 2000). This fact has probably played an important role in the discussion about the reasonableness of economic valuation of environmental change.
Valuation methods fall broadly into two main categories: economic and non-economic valuation approaches. Non-economic valuation approaches tend to explore how opinions are formed or preferences expressed in units other than money.
There are a number of common valuation techniques; each comes with advantages and disadvantages. Market data, cost-based data (including use of abatement costs) and the
55
“production function approach” can elicit monetary values that have a strong foundation in robust data, but these methods lack the opportunity to express values that are not traded in any market. Choice modelling and contingent valuation (CV) can capture more of the total economic value of an ecosystem service (particularly non-use values), but the theoretical foundation for these analyses has been questioned by some economists21. A summary table of the pros and cons of various valuation techniques can be found in Defra (2007).
With this in mind, Member States should be clear about the limitations of any valuation studies they use.
4.5 Conclusion: choosing the most suitable approach
This chapter has set out different approaches to assess the cost of degradation and how each of these approaches can be used for subsequent work on MSFD. Member States and Regional Seas Conventions will need to decide upon their own approach to perform this analysis, and should not feel restricted to these approaches. To be able to choose the most appropriate approach it will be important to consider theoretical, practical and pragmatic issues. A few issues to consider are suggested below.
Each of the approaches to the cost of degradation will reveal information that is only part of the full cost of degradation, and it is important to be clear what your approach is and is not capturing. The ecosystem services approach attempts to describe the full cost of degradation over time, but is unlikely to achieve this due to limits to our knowledge, and because it requires looking into the future. The thematic approach attempts to describe the current cost of degradation, but again data limitations are likely to mean part of the analysis is purely qualitative. The cost-based approach to estimate the cost of degradation is well-grounded in robust sources of existing data, but since this approach focuses on the revealed values of the present state of the marine environment, it is not meant to provide information on the potential benefits of further measures to improve the marine environment. It is therefore important that Member States and Regional Seas Conventions understand how each approach might be useful to their work in the remainder of MSFD, and take this into account when they choose an approach.
Regardless of the approach chosen for the analysis, it is recommended that the analyses are transparent in the sense that they can be repeated and that any uncertainty is discussed.
21 See e.g. Carson et al. (2001) and Cummings and Harrison (1995) for some contributions to the discussion on CV methods.
56
5. POTENTIAL DATA SOURCES
5.1 Introduction
The purpose of this chapter is to assist Member States in the Initial Assessment and in further economic analysis related to the implementation of the Marine Strategy Framework Directive. The report identifies potentially useful data sources available in the EU and the regional levels. In addition, a selection of research programmes and projects focused on collecting and sharing relevant data are briefly introduced. Finally, examples of national data sources and applications are presented.
At the Member State level, the data needs are ultimately specific to the environmental problems being investigated. The most important drivers and pressures, and also the data needs, may be similar for Member States in one sea region, but are likely to differ between sea regions. Thus, the list of data sources is not meant to be exhaustive. Rather, the aim is to provide an overview on the types and magnitude of publicly available data.
The potential data sources are uploaded on WISE-m22. The links provided in this report probably represent only a small proportion of the statistical data available and research information published on the topic. A recently published impact assessment: ‘Marine Knowledge 2020. Marine data and observations for smart and sustainable growth’ presents the current situation and challenges in the creation of marine knowledge at the EU level. For the executive summary, see: https://webgate.ec.europa.eu/maritimeforum/node/1430 . The report can be obtained from: http://register.consilium.europa.eu/pdf/en/10/st13/st13455-ad01.en10.pdf
5.2 EU-level and international organizations
There are a number of EU-level organizations that gather and manage maritime and related economic data with the challenging aim of presenting it in a coordinated and coherent manner across all Member States. These statistics are helpful as they enable comparisons between countries. The primary datasets are collected nationally. Thus, requests for the original data should be directed to national institutions and researchers in charge of collecting the data.
5.2.1 DG MARE
The Directorate-General for Maritime Affairs and Fisheries (DG MARE) is the Commission department responsible for the implementation of the Integrated Maritime Policy for the European Union. The Commission’s vision and Integrated Maritime Policy is presented in the “Blue Book”. The Integrated Maritime Policy documents can be found from http://ec.europa.eu/maritimeaffairs/policy_documents_en.html. The Maritime Policy actions
22 https://water.europa.eu/marine, see section on the EEA below 57
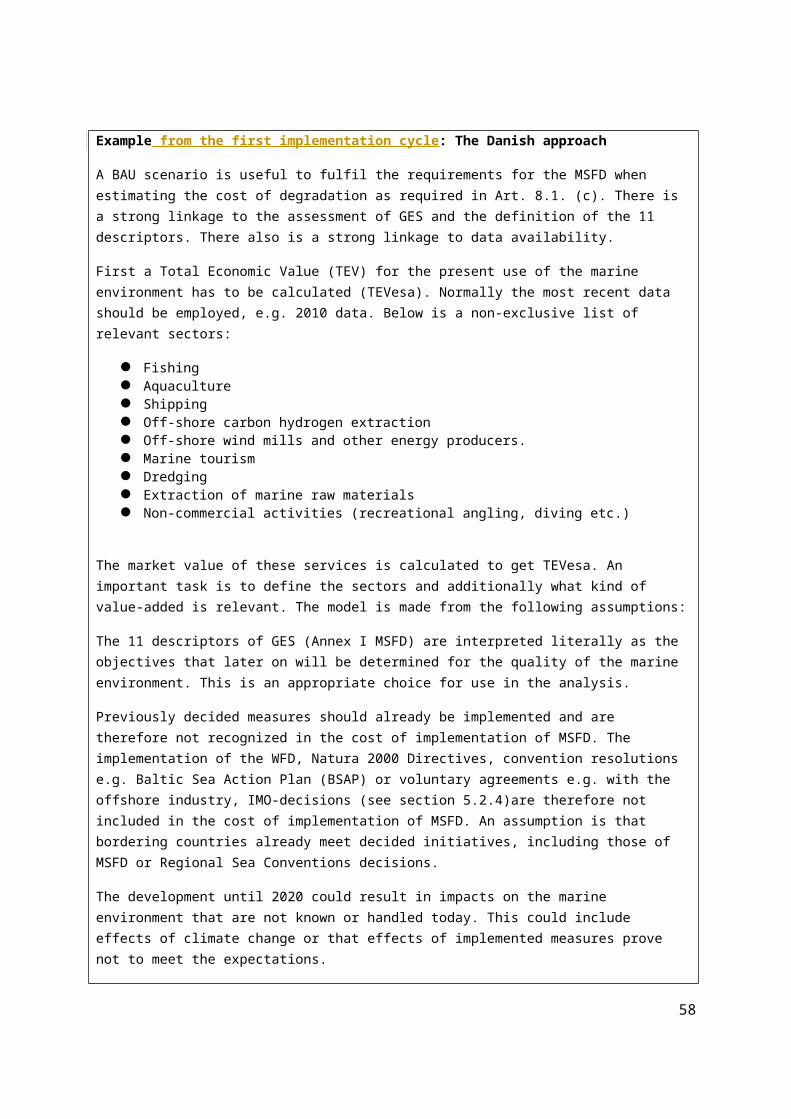
are described in http://ec.europa.eu/maritimeaffairs/mp_dev_en.html. The Integrated Maritime Policy Plan http://ec.europa.eu/maritimeaffairs/pdf/ActionPaper/action_plan_en.pdf set out in 2007 focuses on developing tools for integrated policy-making, maximizing the sustainable use of the oceans and seas and building knowledge and an innovation base for the maritime policy.
One of the initiatives set out in the action plan is the “European Marine Observations and Data Network” (EMODNET).on the DG MARE website23.. One of the initiatives pursued by DG MARE is the “European Marine Observations and Data Network” (EMODNET24). It aims at collecting, managing and sharing maritime data for multiple purposes, developing standards and validating and processing data for the national, sea-basin and European level. Maritime Knowledge 2020 is another, recently presented (Sept. 13, 2010) initiative to strengthen marine scientific search, to provide wide access to quality-checked and coherent marine data, and finally to provide a sound basis for management of the seas.
The European Atlas of the Seas (http://ec.europa.eu/maritimeaffairs/atlas/maritime_atlas/)25 provides versatile information about the geography, environmental pressures, economy (e.g. employment, production value of fisheries, aquaculture production), society (population, fisheries product consumption), transport, fishing quotas, fleet and catches. The target group for the Atlas of the Seas is wider than that of EMODNET. Some of the most relevant data sources from DG-Mare are uploaded on WISE-m.
5.2.2 European Environment Agency (EEA)
The European Environment Agency is an agency of the EU. Its task is to collect and share independent information on the environment. The EEA provides information for the purposes of developing, implementing and evaluating environmental and economic policies and also to the general public. The EEA has 32 Member States including 27 EU countries together with Iceland, Liechtenstein, Norway, Switzerland and Turkey.
PublicationsIn October 2017 the EEA launched the marine part of the Water Information System for Europe (WISE-Marine26), with the intention of making this the principal EU-wide data and information hub on issues around the marine environment.
Other publications, maps and statistical data are publicly available and loadable at the EEA web-site www.eea.europa.eu 27. The information is organized by topics. The issues of interest for the economic analysis of MSFD may be found under the environmental topics of: air pollution, chemicals, climate change, environment and health, land use, natural resources,
23 https://ec.europa.eu/maritimeaffairs/index_en
24 http://www.emodnet.eu/
25 http://ec.europa.eu/maritimeaffairs/atlas/maritime_atlas/ ; to be migrated to EMODnet
26 https://water.europa.eu/marine
27 www.eea.europa.eu 58
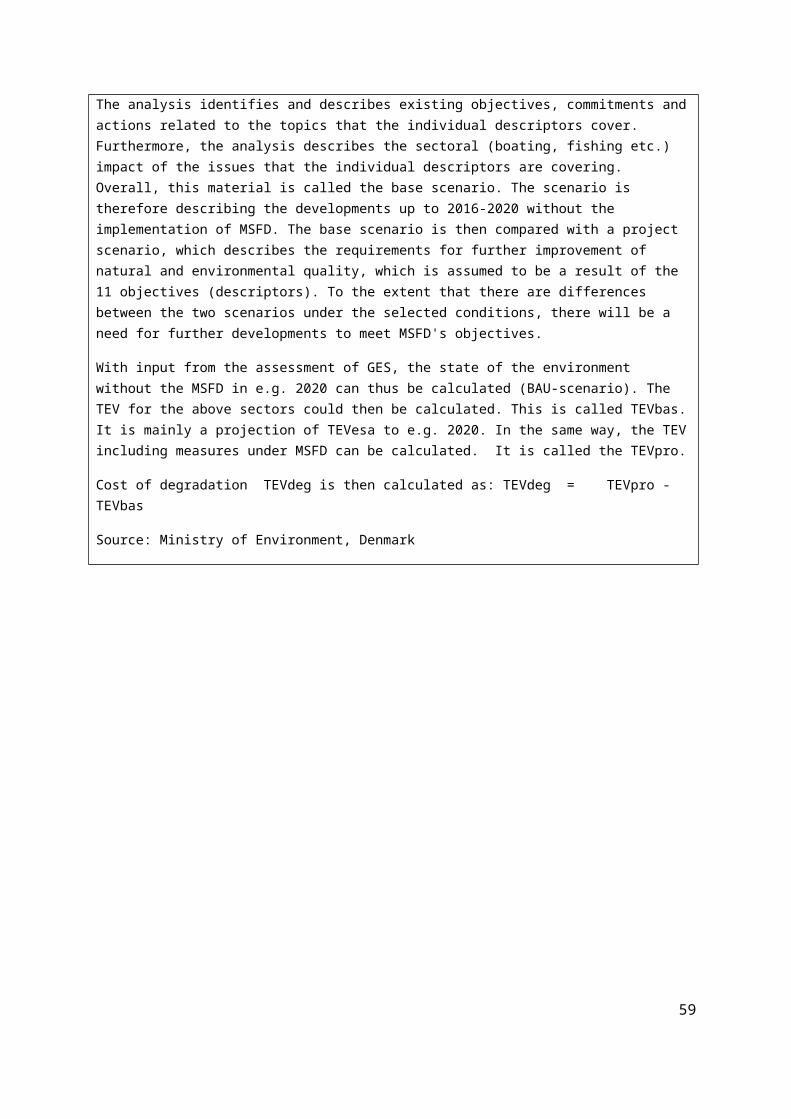
noise and water. The data is also sorted by economic sectors (e.g. agriculture, energy, fisheries, tourism and transport). A summary of the issues related to coastal areas and open seas can be found at: www.eea.europa.eu/themes/coast_sea .
In particular, the EEA reports on regular, annually updated marine/maritime indicators that could be relevant to the implementation of the MSFD. These indicators are listed below by titleupdated as part of the EEA annual update. A list with updated indicators and the websiteswebsite linking to the latest update and indicator factsheet are also providedis available on WISE-m.
[1.] Core set of indicators (CSI) on nutrients and chlorophyll in transitional, coastal and marine waters. (2 CSI indicators):
[i.] CSI 023: Chlorophyll in transitional, coastal and marine waters http://www.eea.europa.eu/data-and-maps/indicators/chlorophyll-in-transitional-coastal-and/chlorophyll-in-transitional-coastal-and-1
[ii.] CSI 021: Nutrients in transitional, coastal and marine waters http://www.eea.europa.eu/data-and-maps/indicators/nutrients-in-transitional-coastal-and/nutrients-in-transitional-coastal-and
[2.] Hazardous substances in marine organisms. 24 http://www.eea.europa.eu/data-and-maps/indicators/hazardous-substances-in-marine-organisms-2
[3.] Accidental oil spills from marine shipping and illegal discharges of oil at sea (2 indicators EN15 and EN14): http://www.eea.europa.eu/data-and-maps/indicators/en15-accidental-oil-spills-from-1 and http://www.eea.europa.eu/data-and-maps/indicators/en14-discharge-of-oil-from-1
[4.] CSI 034 on Fishing fleet capacity http://www.eea.europa.eu/data-and-maps/indicators/fishing-fleet-capacity/fishing-fleet-capacity-assessment-published-1
[5.] CSI 032 Status of marine fish stocks/stocks outside safe biological limits and catches by major species and areas. 33 (http://www.eea.europa.eu/data-and-maps/indicators/status-of-marine-fish-stocks/status-of-marine-fish-stocks-1
[6.] CSI 033 Aquaculture production. 36 http://www.eea.europa.eu/data-and-maps/indicators/aquaculture-production-1/aquaculture-production-assessment-published-feb-2009
[7.] CSI 022 Bathing water quality. 51 http://www.eea.europa.eu/data-and-maps/indicators/bathing-water-quality/bathing-water-quality-assessment-published-1
59
EEA marine/maritime indicators are currently under review. The aim is to add new indicators, increase their geographical coverage and/or modify them according to their relevance to current policy needs e.g. MSFD implementation. Further, all these indicators are also being updated as part of the EEA annual update, and when they are made public on the web under the ‘Coasts and seas’ section they will show data from 2008 or 2009. Similarly, all the graphs and supporting data on the topics covered by these indicators used for the EEA Report ‘The European environment – state and outlook 2010’ will appear on the EEA designated website following its launch (this Report is updated every 5 years, the current version was launched on 30 November 2010, cf. http://www.eea.europa.eu/soer ).
In addition, there are other EEA marine indicators that are not annually updated but used to fulfil specific, regular reporting needs. For example on climate change impacts (namely; Sea Surface Temperature, Sea level rise and Northward movement of fish and zooplankton), which are produced for the ‘Impacts of Europe’s changing climate’ (this is updated every 4 years, the current version is from 2008, http://www.eea.europa.eu/publications/eea_report_2008_4, and the next one will be in 2012). Further, the above-mentioned EEA Report ‘The European environment – state and outlook 2010’ contains indicators/data on marine invasive/alien species..
It is important to highlight that Member States provide the data on which the EEA indicators are built, either to the EEA via the European Environment Information and Observation Network (Eionet) or to international databases from where the EEA access it (see more on those below). This means that Member States should already be aware of this information as well as have it and other information available, including updates. So the value of highlighting this information here is to show other Member States or to help those in charge of carrying out the ‘Initial Assessment’ in a given Member State whom they should contact and what is available in their own country.
The water data centre http://www.eea.europa.eu/themes/water/dc provides the entry point for water-related data as part of the Water Information System for Europe (WISE). It contains the input (reporting mechanisms) and output (visualisation of results) for compliance information under several water directives (WFD, Bathing water, UWWT directive, etc.) as well as voluntary information as reported e.g. under the EEA regulation through the Eionet. WISE-Marine is under development as part of the implementation of MSFD reporting obligations and also as an indicator and assessment platform to complement EMODNET (data access).
The data are provided in the form of databases, graphs and digital maps (GIS applications). The focus is on freshwater resources, but some information related to the open seas is also available. Waterbase is the generic name given to the EEA databases on the status and quality of Europes rivers, lakes, groundwater bodies and transitional, coastal and marine waters, and on the quantity of Europe’s water. CORINE land cover maps and statistics on air pollutant emissions may prove to be useful when identifying the effects of land-borne pollution on the state of open seas.
60
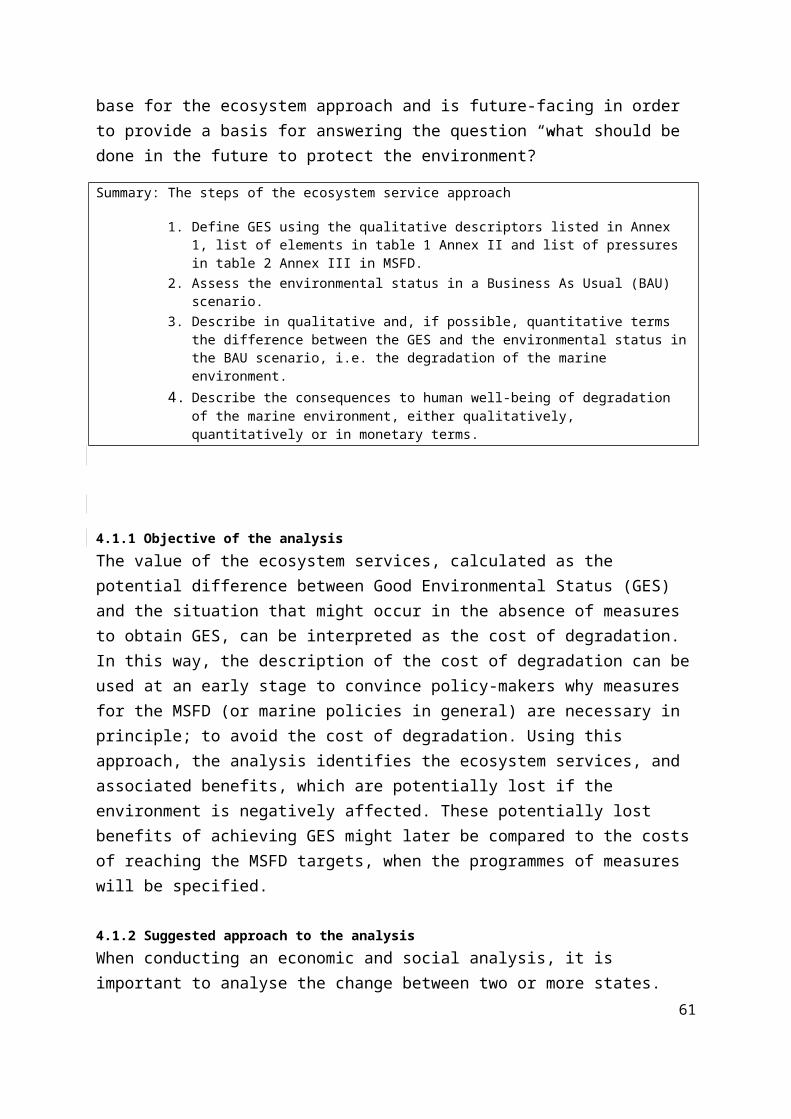
5.2.3 EUROSTAT
Eurostat (epp.eurostat.ec.europa.eu/portal/page/portal/eurostat/home) is a Directorate General of the European Commission and the statistical office of the European Union. Eurostat’s main role is to process and publish comparable statistical information on the European level to enable comparisons between countries and regions. Eurostat does not collect data. This is done in Member States by their statistical authorities. They verify and analyse national data and send them to Eurostat. Eurostat’s role is to consolidate the data and ensure data is comparable, using harmonized methodology. The data, methodologies and publications are in free to access on the Eurostat website. Eurostat offers a whole range of statistical information covering a wide array of fields. The main themes are:
general and regional statistics economy and finance (including national accounts and ESA 95 Input-Output tables) population and social conditions industry, trade and services agriculture and fisheries external trade transport environment and energy science and technology
Data sources more closely linked to economic and social analysis of marine areas:
National account and Input-Output tables
National accounts are compiled in accordance with the European System of Accounts 1995 (ESA 95), the EU manual for national accounts. The ESA 95 has established a compulsory transmission of tables of the input-output framework by the European Member States. The input-output system includes detailed information for a given year on production activities, supply and demand of goods and services, intermediate consumption, primary inputs and foreign trade. These tables show among other things:
The structure of the costs of production and the value-added, which is generated in the production process
The inter-dependencies of industries The flows of goods and services produced within the national economy The flows of goods and services with the rest of the world.
Environment
Eurostat provides statistics, indicators and meta-information on environmental pressures and the state of the environment. The data can be used in the development, implementation, monitoring and evaluation of EU environmental policy, in particular the Sixth Environment Action Program (6th EAP). This is done in close partnership with the EEA.
61
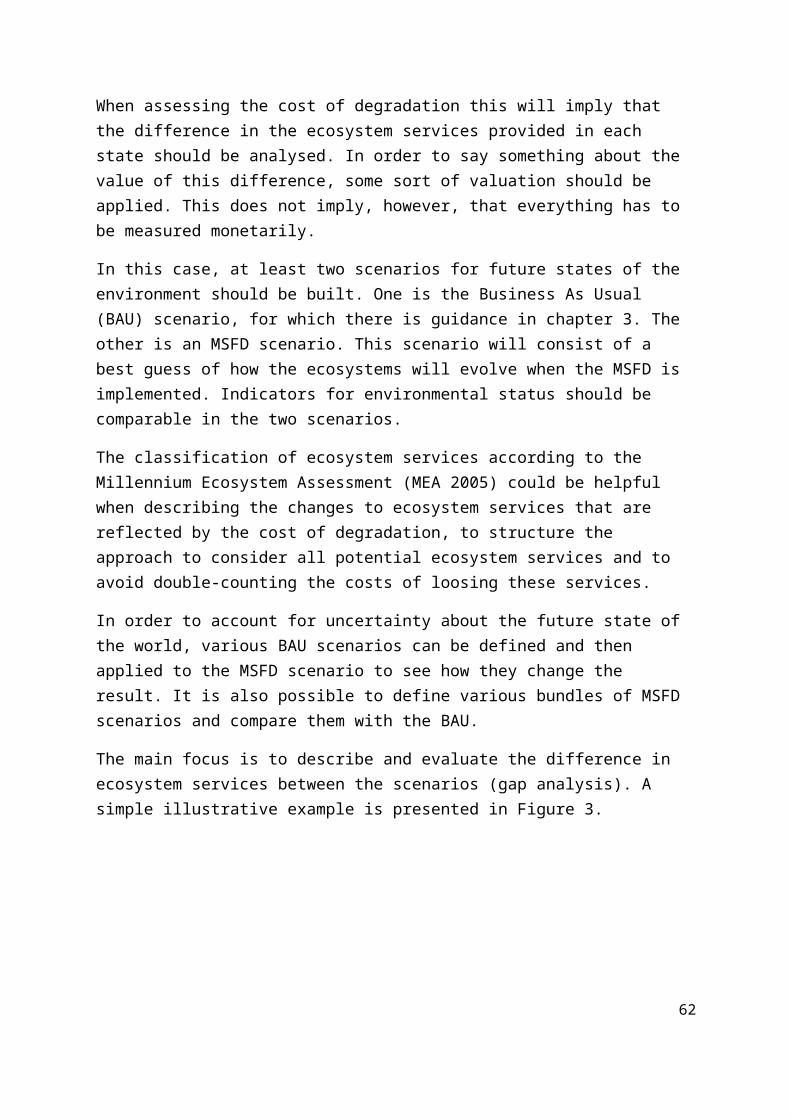
Maritime Policy statistics: Socio economic data for maritime regions and sectors
Following the presentation of the Commission vision for an Integrated Maritime Policy for the European Union and the Action Plan, Eurostat wasasked to lead an Action Group to examine the technical issue: "Improve socio-economic data for maritime sectors and maritime regions". The main tasks of the Action Group were: project monitoring, harmonization of the framework design (concept, definition), data source analysis. Between 2007 and 2009, two early studies were followed by the group: one was a compilation of existing data collected by Eurostat linked to the issue, the other on design of a database and dataset for structuring this information.
Furthermore, Eurostat has published articles on EU coastal regions (according to the definition proposed by the early studies):
June 2009, Statistic in Focus (SiF) 47/2009, Key figures for coastal regions and sea areas
July 2010, SiF 38/2010, portrait). An updated list of EU coastal regions October 2010, chapter 6 of the Pocketbook Agricultural statistics, agriculture in
coastal regions November 2010, chapter 14 of the Eurostat regional yearbook 2010, coastal regions On-going, SiF, Mediterranean and Black Sea basins
published articles are available at WISE-m. The production of data and indicatorindicators on a regular basis is still on-going and will depend on the needs expressed by the Commission and DGs.
Relevant links:
Eurostat web site, http://epp.eurostat.ec.europa.eu/portal/page/portal/eurostat/home Eurostat publication:
http://epp.eurostat.ec.europa.eu/portal/page/portal/publications/recently_published Eurostat data base:
http://epp.eurostat.ec.europa.eu/portal/page/portal/statistics/search_database Eurostat metadata:
http://epp.eurostat.ec.europa.eu/portal/page/portal/statistics/metadata National account (ESA95):
http://epp.eurostat.ec.europa.eu/portal/page/portal/esa95_supply_use_input_tables/introduction
Environment: http://epp.eurostat.ec.europa.eu/portal/page/portal/environment/introduction
Integrated Maritime Policy documents: http://ec.europa.eu/maritimeaffairs/policy_documents_en.html
Articles on EU coastal regions: http://epp.eurostat.ec.europa.eu/statistics_explained/index.php/EU_coastal_regions_statistics Weblinks to relevant EEA produced material are available at WISE-m.
5.2.4 International Maritime Organization (IMO)
62
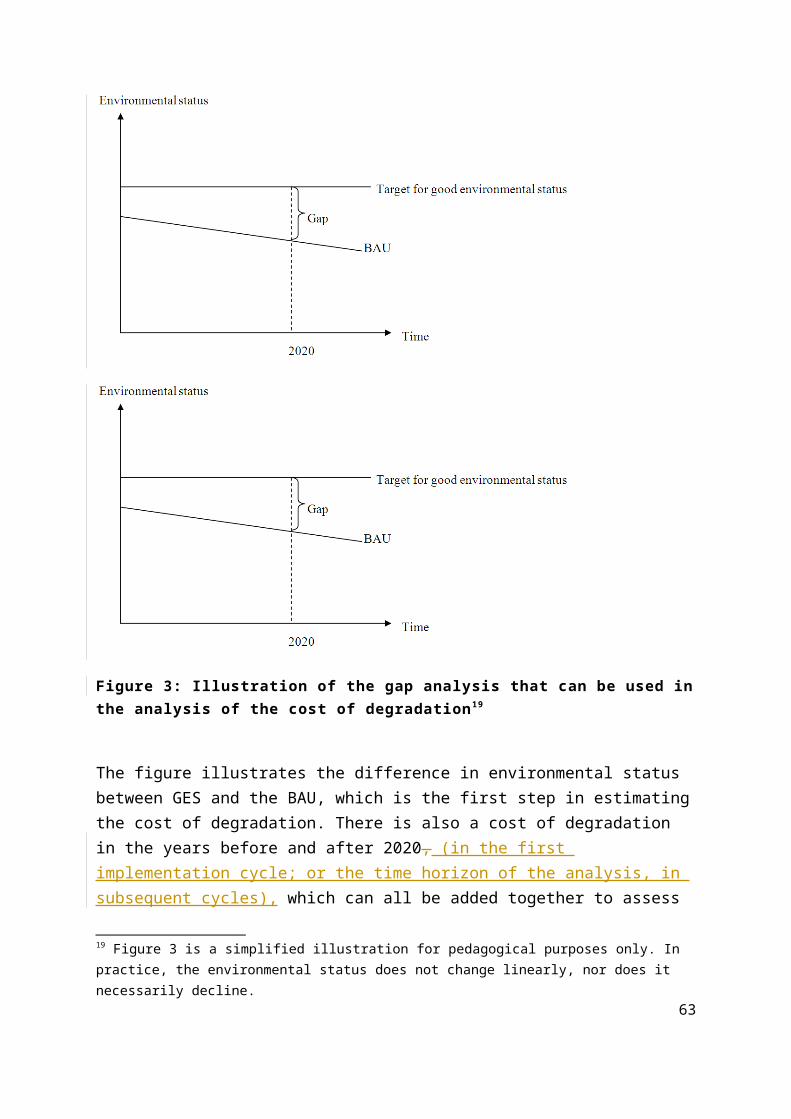
The International Maritime Organization (IMO) is the United Nations specialized agency with responsibility for the safety and security of shipping and the prevention of marine pollution by ships (see http://www.imo.org). The environmental topics include pollution prevention (e.g. oil, sewage, garbage, dumping of waters, port reception facilities), pollution response (response to spills, liabilities), ballast water management, anti-fouling systems and ship recycling.
IMO publications can be found from http://www.imo.org/Publications/Pages/Home.aspx. More detailed technical enquiries can be directed to the relevant national maritime Administration or to the flag Administration (see National contacts in http://www5.imo.org/SharePoint/mainframe.asp?topic_id=337) Links to other relevant organisations and companies are uploaded on WISE-m.
5.2.5 5.3. Other organizations sources of information There are a number of sources of data and companiesinformation that can be useful. Many of these are collected on WISE-m.
Other links: Related EU policies: DG Environment,
http://ec.europa.eu/dgs/environment/index_en.htmWater Framework Directive implementation reports can be found at: http://ec.europa.eu/environment/water/water-framework/implrep2007/index_en.htm Marine Nature 2000 reports are available at: http://ec.europa.eu/environment/nature/natura2000/barometer/index_en.htm
European Science Foundation: Marine Boardhttp://www.esf.org/research-areas/marine-sciences.html
Off-shore energy generation: European Wind Energy Association (EWEA), www.ewea.org
Ports: European Sea Ports Organization (ESPO), http://www.espo.be/Home.aspx Fisheries: International Council for the Exploration of the Sea (ICES ),
http://www.ices.dk Fisheries: Community Fisheries Control Agency (CFCA), http://cfca.europa.eu/ Fisheries and agriculture: Organisation for European Economic Cooperation (OECD),
http://www.oecd.org/topic/0,3699,en_2649_37401_1_1_1_1_37401,00.html Oil spills: European Maritime Safety Agency (EMSA), http://www.emsa.europa.eu/ Tourism: World Tourism Organization (WTO), http://www.unwto.org/index.php Tourism and other industries in general: Euromonitor International,
http://www.euromonitor.com/ Biodiversity: Convention on Biological Diversity, UN/UNEP, http://www.cbd.int/ Marine Spatial planning, UNESCO, http://www.unesco-ioc-marinesp.be/ Biodiversity: International Union for Conservation of Nature (IUCN),
http://www.iucn.org/about/work/programmes/marine/marine_about/ Navigation: The Marine Strategy Navigation Group (MSNG)
http://www.dredging.org/MSFD
See also Annex C for additional links to relevant literature and data sources.
63
5.3.1 5.3. Regional Seas conventionssea convention
The United Nations Environment Programme (UNEP) Regional Seas Programme was established in 1974 to address the degradation of the world’s oceans and coastal areas. The Regional Seas programmes (http://www.unep.org/regionalseas/programmes/default.asp) function through action plans that are underpinned with regional conventions. the four regional conventions: The Barcelona Convention, (http://ec.europa.eu/environment/water/marine/barcelona.htm).The Black Sea Conventions, (http://www.blacksea-commission.org)The Helsinki Commission or HELCOM (http://www.helcom.fi/)The OSPAR Convention (http://www.ospar.org). Various projects under the umbrella of the Regional Seas Programme have collected a large amount of data during the last decades. The Regional Seas Reports can be obtained from http://www.unep.org/regionalseas/publications/reports. Links to relevant project and data can be found on the WISE-m.
5.3.1 North-East Atlantic (OSPAR convention)
The OSPAR Convention (http://www.ospar.org) is the legal instrument guiding international cooperation on the protection of the marine environment of the North-East Atlantic. Work under the Convention is managed by the OSPAR Commission, made up of representatives of fifteen Governments (Belgium, Denmark, Finland, France, Germany, Iceland, Ireland, Luxembourg, The Netherlands, Norway, Portugal, Spain, Sweden, Switzerland and the United Kingdom) and of the European Commission, representing the European Union. The work of the OSPAR Commission is guided by the ecosystem approach to an integrated management of human activities in the marine environment. This is supported by a general obligation of Contracting Parties to apply the precautionary and the polluter pays principles, best available techniques and best environmental practice.
The 1992 OSPAR Convention contains a general obligation to collaborate in monitoring and assessment of the state of the marine environment. The Convention is implemented through the North-East Atlantic Environment Strategy which includes an overarching Part I on the implementation of the Ecosystem Approach and with five thematic strategies (Part II) on Biological Diversity and Ecosystems (e.g. protection of species and habitats, marine protected areas, management of human activities and ecological quality objectives), Eutrophication, Hazardous Substances, Offshore Oil & Gas Industry and Radioactive Substance. In addition the Joint Assessment and Monitoring Programme (JAMP) 2010-2014 sets out the basis on which the OSPAR Contracting Parties will work together in fulfilling the Convention’s obligations in monitoring and assessment over the 2010-2014 period. It is primarily orientated towards supporting the activities of Contracting Parties in respect of the
64
EU Marine Strategy Framework Directive. The JAMP 2010-2014 follows the JAMP 2003-2010 which delivered as an endpoint the holistic OSPAR Quality Status Report 2010.
The electronic version of the OSPAR Quality Status Report 2010 together with its suite of supporting thematic assessments is available at:
http://qsr2010.ospar.org/en/
All OSPAR publications are freely available from: http://www.ospar.org/v_publications/browse.asp?menu=00080800000000_000000_000000.
Information on the Joint Assessment and Monitoring Programme 2010-2014 (OSPAR Agreement 2010-4) is available at:
http://www.ospar.org/html_documents/ospar/html/10-04e_jamp_2010_2014.doc
5.3.2 Baltic Sea: Helsinki Commission (HELCOM)
The Helsinki Commission or HELCOM (http://www.helcom.fi/) is the governing body of the "Convention on the Protection of the Marine Environment of the Baltic Sea Area", or the Helsinki Convention. The Governments involved include Denmark, Estonia, Finland, Germany, Latvia, Lithuania, Poland, Russia and Sweden. HELCOM's main goal is to protect the marine environment of the Baltic Sea from all sources of pollution, and to restore and safeguard its ecological balance. The priorities are eutrophication, hazardous substances, transport, fisheries and biodiversity of marine and coastal areas. The HELCOM Baltic Sea Action Plan sets out guidelines to restore the good ecological status of the Baltic marine environment by 2021.
HELCOM has run coordinated joint monitoring programmes on the state of the marine environment and on pressures, such as nutrient and radioactive substance loads since the end of the 1970s. Based on its data, HELCOM has produced periodic assessments of the state of the Baltic Sea (1980, 1987, 1990, 1996, 2002 and 2003) and more recently thematic assessments (in 2009 on eutrophication and biodiversity and in 2010 on hazardous substances and maritime activities). The HELCOM Initial Holistic Assessment of the Ecosystem Health of the Baltic Sea 2003-2007 is the most recent and most comprehensive of HELCOM’s assessment products focusing on the state, pressures and economic analysis of the marine environment.
Relevant data sources:
HELCOM’s Data and Information Strategy states that when the Contracting Parties have not flagged the data with any restriction in the HELCOM databases it should be considered open. HELCOM databases are hosted e.g. by ICES from where data can be downloaded: http://ecosystemdata.ices.dk/
Information on the present and past HELCOM projects: http://www.helcom.fi/projects/on_going/en_GB/cover/
65
Publications: http://www.helcom.fi/publications/en_GB/publications/
Assessments and indicators: http://www.helcom.fi/BSAP_assessment/en_GB/main/ http://www.helcom.fi/BSAP_assessment/ifs/ifs2009/en_GB/cover/
Data, maps, links:http://www.helcom.fi/GIS/en_GB/HelcomGIS/
Other sources of data on the Baltic Sea region:
The Baltic Nest Institute (www.balticnest.org ) hosts a decision support system NEST aimed at adaptive management of environmental concerns in the Baltic Sea. The model and the related databases cover entire Baltic Sea and its drainage basins. The main focus is on eutrophication.
The Baltic Organisations Network for Funding Science (BONUS) represents several research funding organizations (including FP7) and finances multilateral research project. A link to the on-going projects can be found at: http://www.bonusportal.org/research_projects
The Baltic Sea Region GIS, Maps and Statistical database http://www.grida.no/baltic
5.3.3 Mediterranean Sea (Barcelona Convention)
The Convention for the Protection of the Marine Environment and the Coastal Region of the Mediterranean (Barcelona Convention) aims at assessing and controlling marine pollution, integrating the environment in social and economic development and at reducing land and sea-based pollution, amongst other tasks (see http://ec.europa.eu/environment/water/marine/barcelona.htm). The contracting parties are Albania, Algeria, Bosnia and Herzegovina, Croatia, Cyprus, Egypt, the European Union, France, Greece, Israel, Italy, Lebanon, Libya, Malta, Monaco, Montenegro, Morocco, Slovenia, Spain, Syria, Tunisia, and Turkey.
The major tool is the Mediterranean Action Plan (MAP). The activities are classified under the topics: sustainable development, land-based source of pollutants, maritime traffic, coastal management, and biodiversity. A marine environment status assessment for the Mediterranean is under preparation and will be available in 2011.
One source of information on fisheries in the Mediterranean Sea is the General Fisheries Commission for the Mediterranean (GFCM), http://www.gfcm.org/gfcm/en
5.3.4 Black Sea (Bucharest Convention)
The Commission on the Protection of the Black Sea against Pollution (the Black Sea Commission) is the intergovernmental body implementing the Convention on the Protection of the Black Sea Against Pollution (Bucharest Convention) and its Protocols (see
66
http://www.blacksea-commission.org). The Governments involved are Bulgaria, Georgia, Romania, the Russian Federation, Turkey, and Ukraine.
The Strategic Action Plan for the Environmental Protection and Rehabilitation of the Black Sea sets out four priority problems: eutrophication/nutrient enrichment; changes in marine living resources; chemical pollution (including oil); and biodiversity/habitat changes.
Relevant reports:
Strategic Action Planhttp://www.blacksea-commission.org/_bssap2009.asp
State of the Environmenthttp://www.blacksea-commission.org/_publ-SOE2009.asp
Implementation of the Strategic Action Plan for the Rehabilitation and Protection of the Black Sea, 2002 - 2007http://www.blacksea-commission.org/_publ-BSSAPIMPL2009.asp
http://www.blacksea-commission.org/_tda2008.asp
5.4 Programmes and projects
In the following section, short descriptions and links to There are a number of on-going projects are given. These projectsthat collect, manage, and share maritime data on European orand regional seas levels.
5.4.1 ODEMM
ODEMM (Options for Delivering Ecosystem-Based Marine Management) is a European FP7 project that aims to create a database on regional assessments of the environmental characteristics and the major marine sectors. One objective of the project is to “provide comprehensive knowledge base to support policy in order to develop a sustainable and integrated approach to the management of European marine ecosystems”. To this end, the project has created a meta-database of environmental assessment reports summarizing current knowledge based on environmental, ecological and socioeconomic issues or factors prepared for regional seas across Europe. Socio-economic data of primary industries that affect the marine environment are categorized by industry type (e.g. aquaculture, recreation, transport, ports) and by details of valuation (e.g. abatement costs, annual profits, gross value added and employment). In addition, the data are categorized by the four regional seas. Some regional seas are split into sub-regions. Data sources are provided as hyperlinks to the source. (http://www.liv.ac.uk/odemm/)
5.4.2 SeaDataNet
SeaDataNet manages a Marine Data Management Infrastructure for the management of large and diverse sets of data deriving from in situ and remote observation of the seas and oceans. The infrastructure links 40 national oceanographic data centres and marine data centres from
67
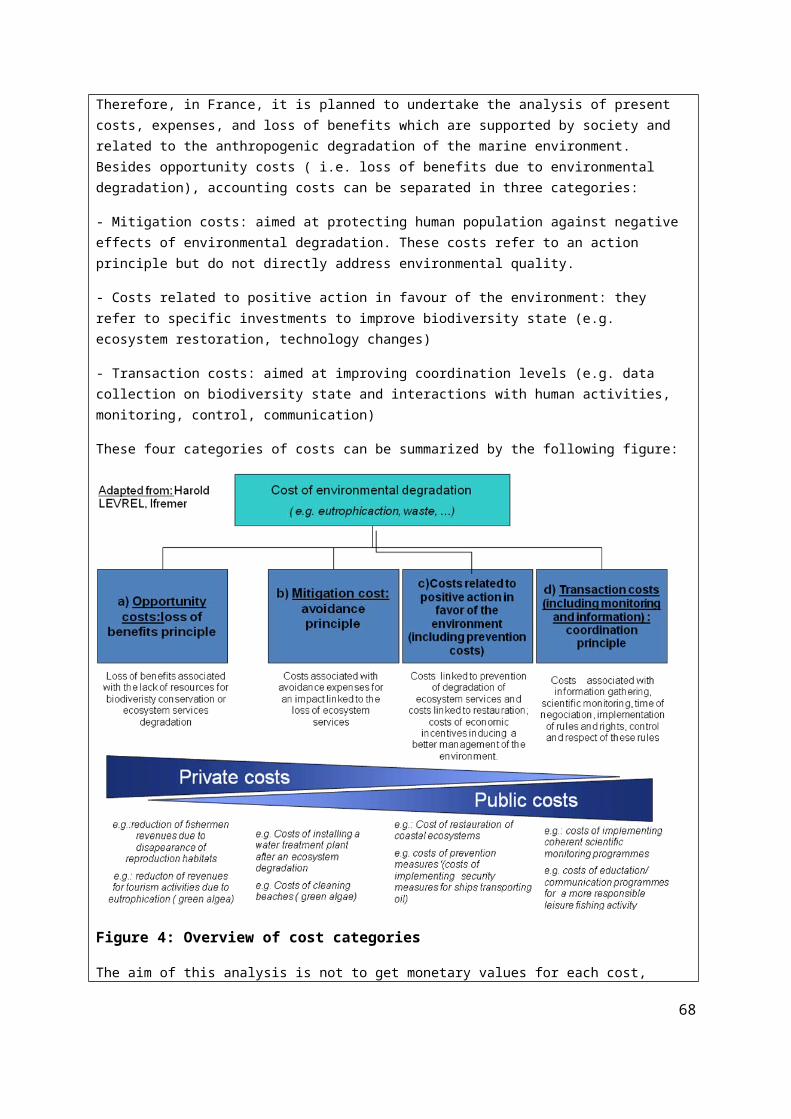
35 countries riparian to all European seas. A major objective is to provide an integrated and harmonised overview and access to these data resources, using a distributed network approach. The available products include animated maps for regional seas and various indicators reflecting the water quality. (http://www.seadatanet.org)
5.4.3 KnowSeas
KnowSeas (Knowledge-based Sustainable Management for Europe's Seas) is a FP7 project started in 2009. Its overall objective is to build a comprehensive scientific knowledge base and give practical guidance for the application of the Ecosystem Approach to the sustainable development of Europe’s regional seas. The work includes examining and modelling the causes and consequences of ecosystem change, costs and benefits and institutional and social aspects. KnowSeas will work on the two geographical scales: the Regional Sea Scale and Member State Economic Exclusive Zones. (http://www.knowseas.com)
5.4.4 Clamer
CLAMER (Climate Change Impacts on the Marine Environment: Research Results and Public Perception) is a FP7 project aiming to raise the awareness of European society and about the effects of climate change on the marine environment and their socio-economic consequences. The 18-month project started in April 2000 and aims at assessing and summarizing state-of-the art knowledge of results and public perceptions of climate change impacts on the marine environment, including the socio-economic consequences. (http://www.esf.org/research-areas/marine-sciences/framework-programme-activities/clamer.html)
5.4.5 Hermione
The HERMIONE (Hotspot Ecosystem Research and Man's Impact on European Seas) project is a three-year FP7 project started in 2009. It focuses on elaborating the ecosystem goods and services of deep-sea ecosystems. The study sites include the Arctic, North Atlantic and Mediterranean. (http://www.eu-hermione.net/)
5.4.6 Meece
MEECE (Marine Ecosystem Evolution in a Changing Environment) project is a European FP7 project that aims at using predictive models to consider the full range of drivers to explore the responses of the marine ecosystem in a holistic manner, rather than driver by driver as has been done in the past. MEECE explores the impacts of both climate drivers (acidification, light, circulation and temperature) and anthropogenic drivers (fishing, pollution, invasive species and eutrophication). (http://www.meece.eu/)
5.4.7 Sesame
The SESAME (Southern European Seas: Assessing and Modelling Ecosystem Changes) project is an international research project that incorporates a variety of disciplines to explore and study the ecosystem changes of the Mediterranean and the Black Seas A list with links to some of the most relevant projects, published as well as their surrounding environments. The
68
general scientific objectives of SESAME, supported by the European Commission, are to assess and predict changes in the Mediterranean and Black Sea ecosystems as well as changes in the ability of these ecosystems to provide goods and services. (http://www.sesame-ip.eu/)ongoing, is available on WISE-m. The list should not be seen as a total presentation of all relevant projects only but as information and better understanding on what kind of information that is available.
5.5 Some examples3.3 Recourse of national data sources and applications Slovenia
Slovenia is planning to use the following national data sources in their economic and social analyses:
Statistical Office of the Republic of Slovenia
Population
GVA
Employment
Sea and coastal water transport
Mariculture
Fishery
Tourism (Seaside Resorts)
Agriculture
Industry
Environmental Agency of the Republic of Slovenia
Use of marine environment
Quantity and payments for the use of marine environment
Point source pollution
Payments for point source pollution (environmental tax)
Ministry of the Environment and Spatial Planning of the Republic of Slovenia
Urban waste water treatment
Plans for realization of the Urban Waste Water Treatment Directive in coming years
Institute for Water of the Republic of Slovenia
Sea floods (Flood Directive)
The Netherlands
Statistics Netherlands and the National Institute for Integrated Water Management and Wastewater Treatment are working together on the development of an integrated river basin information system. This system is based on National Accounting Matrix, information about water flows (e.g. water extraction, wastewater discharge) and emissions of substances to water (e.g. nutrients, metals, other chemicals) linked
69
to economic activities. The level of aggregation is sub-river basin districts. The name of the system is National Accounting Matrix including Water Accounts (NAMWA).
By linking water and substance flows to economic flows, insight is gained into the relationship between physical water systems and the economy. The integration of physical and economic information also allows for the construction of integrated indicators. For instance, water use and emissions by various economic sectors can be related to economic indicators such as value-added and production value. The developed system provides information to policy-makers and water managers on the emission intensity of economic development in particular regions and/or sectors, and the effectiveness of environmental policies (e.g. decoupling of economic growth from environmental pressures).
For additional information, see http://www.helpdeskwater.nl/onderwerpen/water-ruimte/economische_aspecten/namwa/
70
There are a lot on useful information to be found from national work in regards to the MSFD. A resource list Experiences from previous national initial assessments and other national projects and reports is continuously collected and can be found on WISE-m.
.
REFERENCES
Brouwer, R., Schenau, S. and van der Veeren, R. (2005). Integrated River Basin Accounting and the European Water Framework Directive. Statistical Journal of the United Nations Economic Commission for Europe 22(2): 111-131.
Carson, R.T., N..E. Flores and N.F. Meade (2001), Contingent Valuation: controversies and Evidence, Environmental and Resource Economics 19, 173-210
Commission Decision 2010/447/EU of 1 September 2010 on criteria and methodological standards on Good Environmental Status of marine waters.
Council Directive 2000/60/EC of 23 October 2000 establishing a framework for community action in the field of water policy.
Council Directive 2008/56/EC of the European Parliament of 17 June 2008 establishing a framework for community action in the field of marine environmental policy (Marine Strategy Framework Directive).
Council Directive 91/271/EEC of 21 May 1991 concerning urban waste-water treatment.
Council Directive 92/43/EEC of 21 May 1992 on the conservation of natural habitats and of wild fauna and flora.
Council Directive 91/676/EEC of 12 December 1991 concerning the protection of waters against pollution caused by nitrates from agricultural sources.
Council Directive 2006/7/EC of 15 February 2006 concerning the management of bathing water quality and repealing Directive 76/160/EEC.
Council Directive 2009/147/EC of 30 November 2009 on the conservation of wild birds (codified version of Council Directive 79/409/EEC).
71
COWI (2010) Scoping study on the requirements for economic assessment in the Marine Strategy Framework Directive. Report to European Commission DG Environment.
Cummings R.G. and G.W. Harrison (1995), The Measurement and Decomposition of Non-use Values: A Critical Review, Environmental and Resource Economics (5): 225-247.
Daily, G.C. Soederqvist, T. Arrow, K. Dasgupta, P. Ehrlich, P.R. Folke, C. Jansson, A.M., Jansson, B.O. Levin, S. Lubchenco, J. Mäler, K.G. Starrett, D. Tilman, D. Walker, B., (2000) The value of nature and the nature of value. Science (289): 395–396.
Defra (Department for Environment, Food and Rural Affairs) (2007) An Introductory Guide to Valuing Ecosystem Services. London: Department of Food and Rural Affairs. Available at: http://www.defra.gov.uk/environment/policy/natural-environ/using/value.htm http:// www.defra.gov.uk/environment/policy/natural-environ/using/value.htm.
Defra (Department for Environment, Food and Rural Affairs) (2009) Scoping Study for Elements of the Marine Strategy Framework Directive Impact Assessment Evidence Base. London: Department for Environment, Food and Rural Affairs. Available at: http://www.defra.gov.uk/environment/marine/legislation/msfd.htm.
Defra (Department for Environment, Food and Rural Affairs) (2010), What nature can do for you. London: Department for Environment, Food and Rural Affairs. Available at: http://www.defra.gov.uk/environment/policy/natural-environ/documents/nature-do-for-you.pdf
Eftec and Enveco (14 October 2010) OSPAR Regional Economic and Social Assessment for the Marine Strategy Framework Directive – Draft work specification. MFD 0902. For Defra. 14 October 2010. DRAFT.
Folke, C. Carpenter, S. Walker, B. Scheffer, M. Chapin, T. and Rockström, J. (2010) Resilience Thinking: Integrating Resilience, Adaptability and Transformability. Ecology and Society 15(4): 20. Available at: http://www.ecologyandsociety.org/vol15/iss4/art20/ http://www.ecologyandsociety.org/vol15/iss4/art20/ .
Gunderson, L.H. Carpenter, S.R. Folke, C. Olsson, P. and Peterson, G. (2006) Water RATs (Resilience, Adaptability, and Transformability) in Lake and Wetland Social-Ecological Systems. Ecology and Society 11 (1): 16. Available at: http://www.ecologyandsociety.org/vol11/iss1/art16/.
HELCOM (Helsinki Commission) (2010) Ecosystem Health of the Baltic Sea – HELCOM Initial Holistic Assessment. Baltic Sea Environmental Proceedings No. 122. Helsinki: Helsinki Commission. Available at: http://www.helcom.fi.
72
MEA (Millennium Ecosystem Assessment) (2005) Ecosystems and human well-being: synthesis. Washington DC: Island Press.
Mäler, K-G., Aniyar, S. and Jansson, Å. (2009) Accounting for Ecosystems Environment Resource Economics (42): 39 – 51.
Pieters, A., and M. van Rossum (2014). Economic description of the North Sea for the Netherlands, 2005, 2008, 2010, 2011*. Statistics Netherlands, The Hague. https://www.noordzeeloket.nl/publish/pages/122745/economic_description_of_the_north_sea_for_the_netherlands_2005_2008_2010_2011_edition_2014_cbs_2014.pdf
Strietman, W.J., A.J. Reinhard, A.T. de Blaeij, B.W. Zaalmink (2017). The cost of degradation of the Dutch North Sea environment. https://www.noordzeeloket.nl/publish/pages/138544/the_cost_of_degradation_v_0_06_2018-015_strietman.pdf
Turner, R. Hadley, D. Luisetti, T. Lam, V. and Cheung, W. (2010) Socio-economic assessment within a marine strategy framework. London: Department for Environment, Food and Rural Affairs. Available at: http://www.defra.gov.uk http://www.defra.gov.uk .
Van der Veeren, R. Brouwer, R. Schenau, S. and Van der Stegen, R. (2004): NAMWA: A new integrated river basin information system. Available at: http://www.helpdeskwater.nl/water_en_ruimte/economische_aspecten/namwa/.Available at: https://www.helpdeskwater.nl/onderwerpen/wetgeving-beleid/nationaal/economische-aspecten/namwa/
Vuik, J. and Van Rossum, M. (2010). Economic description of the North Sea for the Netherlands. The Hague: Statistics Netherlands. Available after January 1st 2011 at: http://www.noordzeeloket.nl/overig/bibliotheek.asp... https://www.noordzeeloket.nl/publish/pages/122167/economic_description_of_the_north_sea_for_the_netherlands_5141.pdf
Walker, B. Holling, C.S. Carpenter, S.R. and Kinzig, A. (2004) Resilience, Adaptability and Transformability in Social–ecological Systems. Ecology and Society 9(2): 5. Available at: http://www.ecologyandsociety.org/vol9/iss2/art5.
Walker, A. N. Strietman, W. and Van Oostenbrugge, H. (2010) Analysis of the cost of avoiding degradation of the Dutch North Sea Environment. LEI-nota 10-151, The Hague: LEI, part of Wageningen UR. Availbale after January 1st 2011 at: http://www.noordzeeloket.nl/overig/bibliotheek.asp.https://www.noordzeeloket.nl/publish/pages/122326/the_current_cost_of_avoiding_degradation_of_the_dutch_north_sea_environment_lei_2010_836.pdf.Walker, A. N., K. Keller, A. J. Pieters (2017). Economic description of the Dutch North Sea and Coast: 2005, 2010, 2014. Statistics Netherlands, The
73
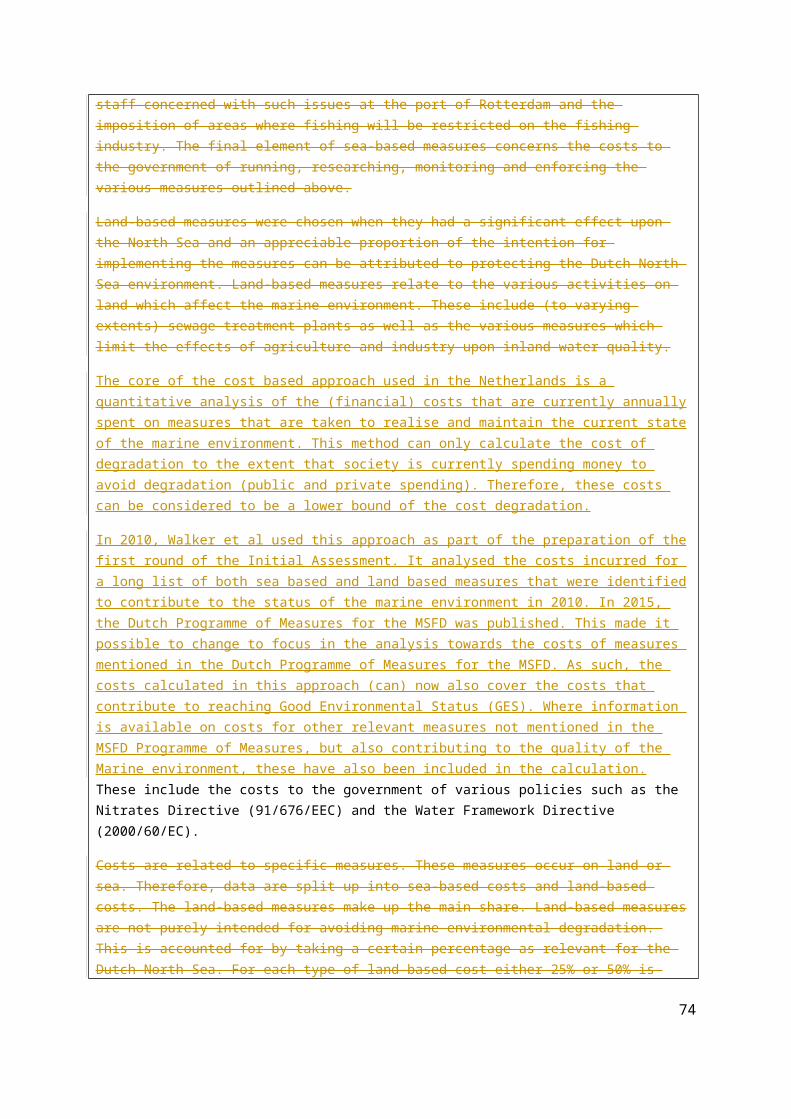
Hague. https://www.noordzeeloket.nl/publish/pages/138222/economic-description-of-the-dutch-north-sea-and-coast-2005-2010-2014.pdf
UK Marine Monitoring and Assessment Strategy (UKMMAS) community (2010) Charting Progress 2 - The state of the UK seas. Available online at: http://chartingprogress.defra.gov.uk/ http://chartingprogress.defra.gov.uk/
74
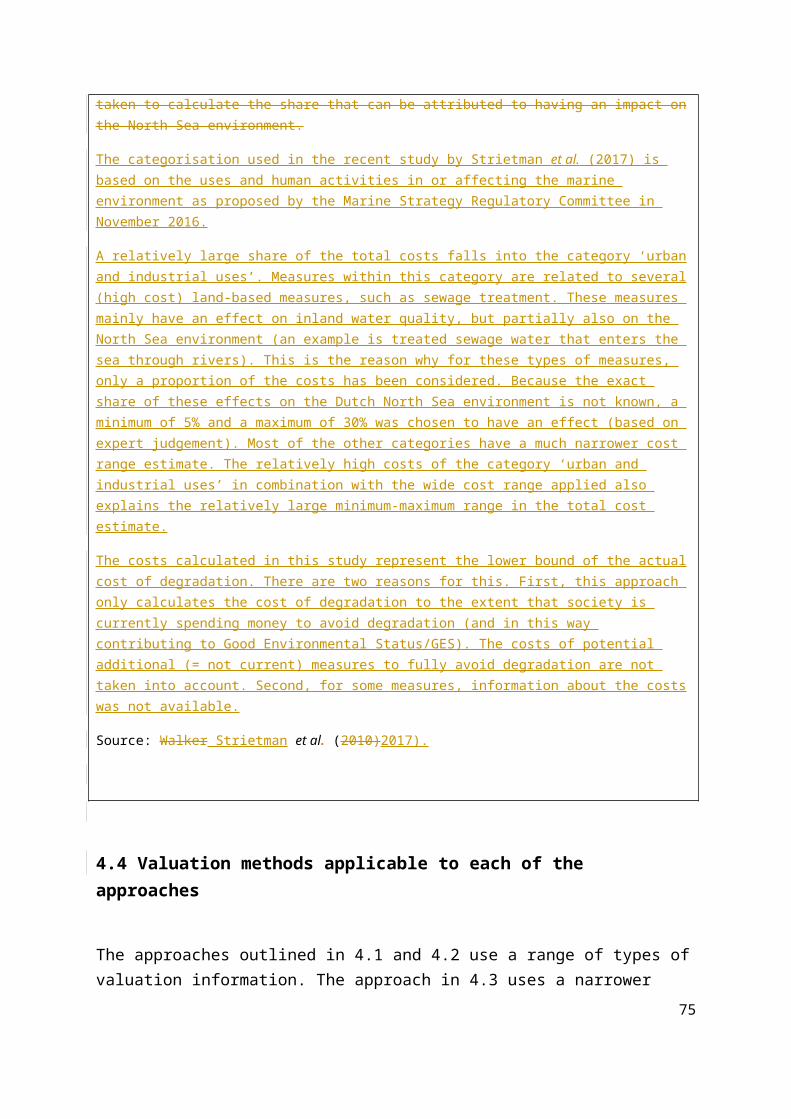
ANNEX A: SPATIAL, SECTORAL AND TEMPORAL ASPECTS
Since the value of different marine uses results from complex interactions taking place in multiple spatial and temporal scales, these aspects need to be considered in the analysis.
The spatial aspect
In order to do a an economic and social assessment the spatial aspect of the analysis need to be determined. First of all, there is a need to define the size of the ecosystem, that is, to define what ecosystem to be studied and the relevant borders of that system. Understanding the dynamics of the ecosystem is also vital, not only for describing future possible scenarios but also for finding the most effective measures.
“When it comes to ecosystems it is important to adopt some practical rule for bordering one ecosystem from another, even though it is likely that, given enough time, organisms in one water body can (and will) interact with organisms elsewhere on the planet (i.e. we have one global ecosystem) (Mäler et al 2009, p. 41). In conclusion, ecosystems studied need to be defined so that relevant ecological process are captured, while at the same time limiting it spatial scale so that it is workable within the analysis.
When setting the socioeconomic framework relevant for the chosen ecosystem, other spatial scales may be appropriate when, for example, identifying drivers, pressures and/or the policy response affecting that ecosystem. Certain drivers can be of international and global scale (e.g. International Maritime Organisation, IMO, regulations, international agreements, EU directives) while other can be addressed on a smaller scale (e.g. national legislation, regional legislation).
For marine waters, it is very common that sources/drivers are located far away from the area of the impact and consequent socioeconomic cost effects, implying that the appropriate geographical scale with regard to policy responses is larger than the water body itself and usually includes the whole drainage basin of the water body or even a larger area.
The sectoral aspects
In the analysis one must also determine what economic sectors to be included in order to address the consequences of the problem as well as the policy responses. To include all sectors effecting or being affected by the marine ecosystem services or all sectors affected by measures/policy instruments might not be practically possible or even justified. For practical reasons, focus might have to be restricted to capture the main sectors connected to the problem either as drivers or as those economic sectors affected by the impacts. The experience from the implementation of WFD could be reflected on with regard to identification of the drivers and of the sectors affected. General equilibrium models could be
75
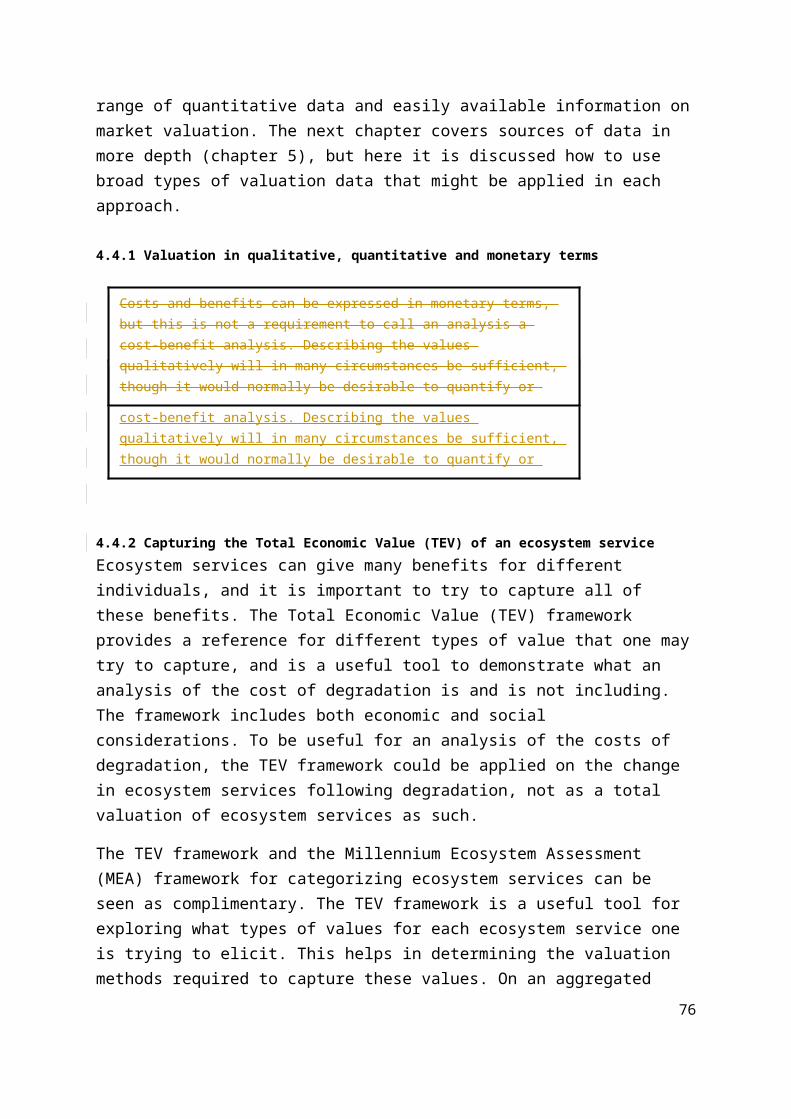
used in the economic and social assessment to address the overall effects on the economy of suggested measures/policy responses, if a partial analysis is judged to be too narrow.
The temporal aspect
The temporal aspect of the system approach addresses the following questions:
What are the dynamics of the system?
How do drivers, pressures, and states change over time?
The temporal scale of the socio-economic and environmental impacts of concern could be addressed by scenarios analysis. Understanding the dynamics of the ecosystem is vital in order to make scenarios as well as identify the appropriate policy responses. Understanding the dynamics will also give guidance regarding the time horizon used for the scenario. The changes of drivers, pressures and states over time will be an important input to the scenarios.
Several scenarios need to be described in the analysis since there are several possible future states, depending on different sets of assumptions and consequent conditions. A reference scenario (often referred to as business-as-usual) against which possible wanted alternative scenarios are compared should therefore be described. However, several reference scenarios might be needed depending on different beliefs with regard to where the future is heading. For example, there might be different assumptions regarding climate change.
“An alternative approach to scenario analysis would involve the comparison of an agreed BAU baseline scenario and outcomes against one or more scenarios, which change the baseline through the introduction of a set of policy measures. The implications of opting out various policy measures ‘on’ and ‘off’ could then be assessed.” (Turner et.al. 2010 p.15)
The same base year should be chosen within a specific analysis but can differ between different marine regions or problems analysed. The important thing is that the choice of base year and its motivation is transparent in the analysis.
In order to enable a comparison between cost and benefits taking place at different times in future, their values must be discounted. The discount rate used might have a significant impact on the outcome of the analysis, as it affects the value of future costs and benefits. Since benefits usually occur quite some time after measures are taken the temporal weight of these, given by the discount rate, will have a significant effect on the benefit side in a cost-benefit analysis. Since present values of future benefits becomes less the further ahead in the future they occur, assuming a positive discount rate, a hyperbolic discount rate is used in some cases. A hyperbolic discount rate implies a discount rate that is decreasing between different time periods (see table 1 below).
76
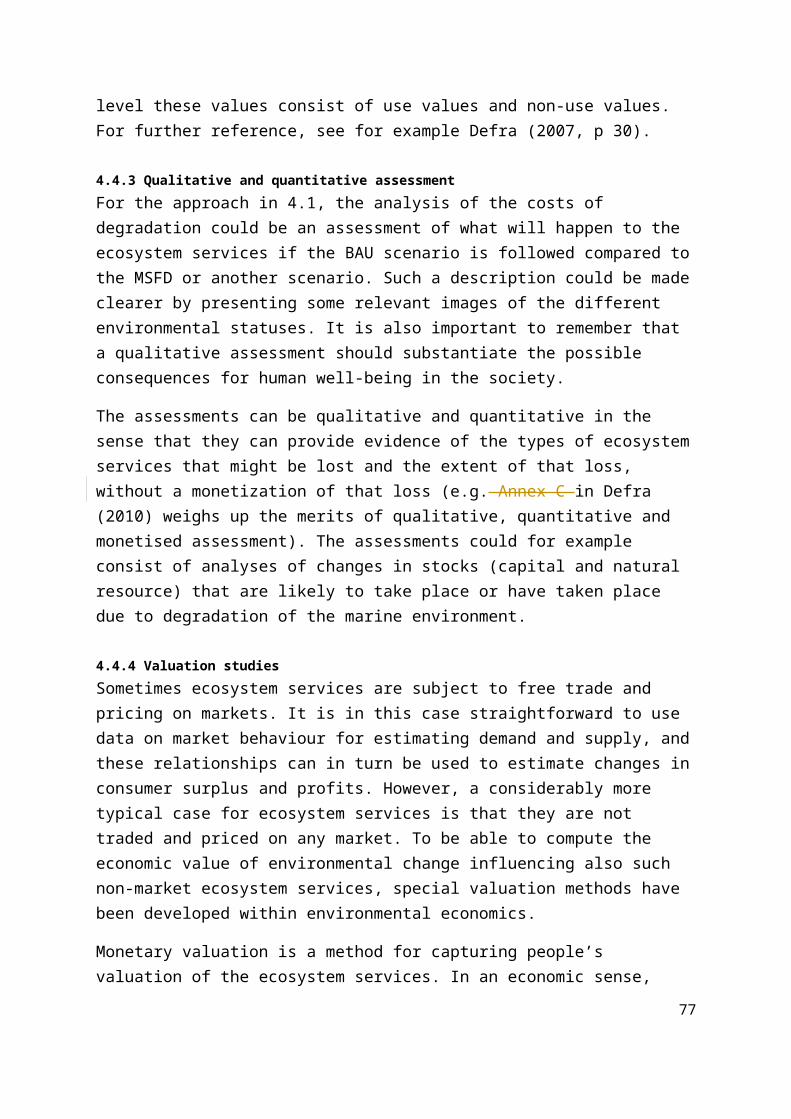
Table 1: example of hyperbolic discount rate
Time horiozon Discount rate
0-10 years 3 %
10-30 years 2 %
30 – 75 years 1%
>75 years 0.5%
By using a hyperbolic discount rate the benefits occurring far into the future are given a relatively larger weight, than if a constant discount rate had been used. This might be justified by the fact that uncertainty increases as the impacts of projects occur further into the future.
Since any level of discount rate used will be questioned, a sensitivity analysis with regard to the discount rate should be a natural part of any assessment, together with a motivation behind the discount rate used.
References:
Mäler, K-G, Aniyar, S and Jansson , Å. (2009) Accounting for Ecosystems Environment Resource Economics (42): 39-51
Turner, R. Hadley, D. Luisetti, T. Lam, V. and Cheung, W. (2010) Socio-economic assessment within a marine strategy framework. London: Department for Environment, Food and Rural Affairs. Available at: http://www.defra.gov.uk http://www.defra.gov.uk .
77
ANNEX B: LESSONS LEARNT FROM THE WATER FRAMEWORK DIRECTIVE
General experiences
Water Directors and Marine Directors have requested that links between the Water Framework Directive (WFD) economics and the Marine Strategy Framwork Directive (MSFD) economics should be ensured. As part of the preparation for a Common Implementation Strategy (CIS) ‘ad hoc’ activities in terms of a workshop on economic issues under the WFD, a questionnaire and follow-up interviews were undertaken to gather views regarding implementation experience of economic aspects of the WFD. Some of the main findings of the questionnaire of relevance for the Working Group on Economic and Social Assessment (WG ESA) are:
General findings from the questionnaire
The most challenging areas were pointed out by respondents to be Cost-Effectiveness Analysis (CEA) of measures and justification of disproportionate costs.
Most work was done by multidisciplinary teams at the local level implying that non-economists often undertook economic assessments.
Almost 50 percent of the replies stated that lack of integration of economic analysis into political and technical decision-making was problematic.
Views on CIS guidance documents in the questionnaire
A majority of the replies stated that guidance given had been used to perform economic analyses.
The WATECO28 guidance produced for the WFD have been most frequently used particularly in the beginning of the process, i.e. for the economic analysis of water use. At later stages, the ‘realities’ of water management reduced its usability.
Economic guidance documents have mainly been used to develop national guidance documents.
There are difficulties in usability of the economic guidance documents. In particular a lack of reader-friendliness, texts are too academic, they are not operational enough and there is a lack of practical advice on what to do.
28 European Commission (2003) Common Implementation Strategy for the Water Framework Directive (2000/60/EC) - Guidance document n.o 1 Economics and the environment - The implementation challenge of the Water Framework Directive. Produced by Working Group 2.6 – WATECO Luxembourg: Office for Official Publications of the European Communities. Available at: http://www.uicnmed.org/web2007/cdflow/conten/5/pdf/5_1_2/Published-Guidance-Doc/GU-1.PDF. http://www.uicnmed.org/web2007/cdflow/conten/5/pdf/5_1_2/Published-Guidance-Doc/GU-1.PDF.
78
The guidance on exemptions (WFD CIS guidance 2029) was considered most useful due to its operational nature.
Box 1. Country example: Lessons learned in the Netherlands
It is important to start with thorough preparations in time, with proper coordination of various activities, to have the right information available at the right time to substantiate the choices for the programmes of measures.
Considering difficulties implied with performing the required economic analysis it is to recommend to keep the analysis simple, as it already then will be difficult enough, especially given the limited time available.
This implies to focus on what is really required by the MSFD and on the needs of decision-makers (e.g. national parliament) needs. For example, this can can be to only develop indicators that are really needed to support decision-making.
What has been reported for the WFD can be used as a starting point for the reports for MSFD. There are e.g. similarities between the Article 5 requirements under the WFD and the ’economic analysis of the use of marine waters’ required by the MSFD and the use of these experiences can save time.
Although the WFD does provide a broad definition of what ‘water services” might include, it has been unclear which activities should be included. Similar difficulties with a common interpretation by countries may imply for the ‘cost of degradation’ under the MSFD.
National recommendations for (Social) Cost Benefit Analysis exists in the Netherlands but as they leave much open this has lead to cost-benefit analysis for the WFD performed in various ways depending on process phases and policy questions. Various challenges were related with this process but also yielded very positive results e.g. authorities and stakeholders at different scales collaborated which lead to effective measures being proposed and enabled an improved transparency. Given the importance of public participation in the MSFD this role of economic analysis is worthy of emulation for the MSFD.
For preparation and implementation of the Economic and Social Cost Benefit Analysis for the MSFD it is important to know well in advance what role the analysis will have in the decision making process, since this determines when the analysis must be completed and what (type of) information the analysis will have to present.
It is recommended to develop a database with uniform identified data on costs and effects of measures.
One of the main value added with the Wateco guidance was more the process towards this document than the final product itself e.g. referring to the development of an international network of economists which was helpful in reflecting, advising and thereby helping the performance of national economic analysis.
There were no standard economic criteria on how to assess disproportionate costs needed for the exemptions under the WFD, since this was seen as a political decision, supported by economic information. Therefore, it may be preferable to try to find out what economic information policy-makers might need.
29 European Commission (2009) Common Implementation Strategy for the Water Framework Directive (2000/60/EC) - Guidance Document No. 20 – Guidance document on exemptions to the environmental objectives. Luxembourg: Office for Official Publications of the European Communities. Available at: http://circa.europa.eu/Public/irc/env/wfd/library?l=/framework_directive/guidance_documents/documentn20_mars09pdf/_EN_1.0_&a=d.
79
Differences between WFD economics and MSFD economics as highlighted in the draft work specification on the OSPAR Regional Economic and Social Assessment for the MSFD30
The MSFD requirements for economic and social work have many similarities to the economic requirements of the Water Framework Directive (WFD). For example, for both Framework Directives, in general terms largely similar economic analyses are required. They involve similar terminology, such as ‘disproportionate costs’, and make similar requirements such as ‘cost-effectiveness analysis’ of potential measures. As a result there is existing literature and guidance from the WFD that can help inform economic and social analysis for the MSFD. For example discussion of how to interpret ‘disproportionate costs’ took a long time in the WFD implementation. MSFD can benefit from this and does not have to repeat the same discussions. Some other lessons from WFD experiences that are relevant to the MSFD are described in boxes below.
The MSFD’s economic requirements also have some key differences compared to the WFD, including:
Different geographical scales, with requirements for multi-lateral coordination (including of Economic and Social Assessment (ESA) reporting) across regional seas rather than political boundaries;
A more complex objective, with GES involving 11 descriptors with considerable overlaps both between the components of the descriptors and the measures that will assist with their delivery; and
More specific requirements for cost benefit analysis, for example as part of impact assessments in relation to new measures.
A further difference is that for a long time Good Ecological Status (under the WFD) did not have a detailed definition, so a lot of time was spent discussing what it should be and then what values the indicators should take. The details in the proposed indicators for the descriptors of the MSFD are an improvement on the WFD.
Perhaps one difference for some Member States between the ESA and the WFD’s Article 5 report (see Box 2) on water uses is the scale of analysis. The WFD reports generally relate to river basins within a given Member State’s geographical boundaries (although transboundary river basins exist). For the economic and social assessment under the MSFD, extensive multilateral cooperation across areas of sea is essential (political jurisdictions being secondary in many respects), and the MSFD therefore requires a coordinated report for regional seas. The importance of coordination differs geographically and therefore between pressures. For example, pressure in coastal zones may be a Member State issue, but pressures 30 Based on Eftec and Enveco (14 October 2010) OSPAR Regional Economic and Social Assessment for the Marine Strategy Framework Directive – Draft work specification. MFD 0902. For Defra. 14 October 2010. DRAFT.
80
in offshore areas will almost inevitably cut across political boundaries and therefore require a coordinated response.
Box 2. Lessons from Water Framework Directive Article 5 reports
The River Basin characterisation reports required under Article 5 of the WFD include an economic analysis of water use. The experience with these baseline economic reports, at least in some Member States, was that their contents were not as useful as was expected for informing subsequent actions because they were just ‘state of current activity’. As a result they did not provide significant support in some Member States for subsequent use of economics in implementation of the Directive (e.g. as an estimate of future baseline conditions or impacts on activities).
This could potentially be avoided in conducting the ESA for the MSFD. Member States need to coordinate economic and social inputs to the Directive’s implementation beyond the ESA itself. This is necessary in order to develop measures or incentives in a coordinated manner for regional seas, as measures within political boundaries are unlikely to be effective for delivering GES across regional sea. In addition, ESA requirements of the MSFD include analysis of the ‘cost of degradation’. This implies some analysis of changes to the marine environment (degradation being one state of the environment relative to another). Therefore the ESA will not just be a static analysis, and should include analysis of changes in a manner that is useful for subsequent economic analysis.
There are many lessons that can be drawn from the experience of the Article 5 reports in the WFD. The key lesson for the ESA required by the MSFD, at this stage in its planning, is to think ahead about the use of the ESA material in subsequent social and economic analysis work in the ongoing implementation of the Directive.
"NOTE: Further information is being sought on the use of WFD Art 5 reports in order to expand/refine this analysis”31.
Further lessons from the WFD relate to the analysis of social impacts (Box 3), the organisation of resources to under the work (Box 4), and the use of non-market valuation techniques (Box 5).
31 Eftec and Enveco (14 October 2010) OSPAR Regional Economic and Social Assessment for the Marine Strategy Framework Directive – Draft work specification. MFD 0902. For Defra. 14 October 2010. DRAFT.
81
Box 3. Lessons on social aspects from the WFD
The WFD does not include the phrase “social analysis”, however mentions phrases such as “social, environmental and economic effects...” (Article 9) and “social and economic development...” (Paragraph 12). The MSFD, on the other hand, requires Member States to conduct “economic and social analysis” (Article 8(1c)) in relation to the implementation of the Directive. So, when compared to the WFD, the MSFD further emphasises social analysis, it is still not fully developed or explained.
The social aspects of sustainability are often linked to equity, efficiency and empowerment of civil society. Thus, the social analysis of the Directive form the basis for the aspects of participation of the general public and specific stakeholders. Regarding this issue the WFD is clear “The success of this Directive relies on close cooperation and coherent action at Community, Member State and local level as well as on information, consultation and involvement of the public, including users.” (Paragraph 14). The WFD was adopted in 2000, implying 10 years of experience of the importance of general public and specific stakeholder participation. The issue has gained much attention in related research, publications, discussions and meetings. For instance, a comprehensive guidance document for the requirements of Article 14 in the WFD has been developed (see link below) by a working group in the European Commission and the research project HarmoniCOP has produced a handbook concerning participation in river basin management planning (see link below).
Member States have tackled these requirements in various ways; via public questionnaires, stakeholder forums, interactive websites etc. Some of the lessons learned are that public participation and stakeholder involvement need time and resources, that existing opportunities of communication channels should be used and that a focus on key groups to involve is desirable. The MSFD should be able to benefit from these lessons concerning stakeholder involvement in the implementation of the WFD. Many of the questions related to the MSFD correlates to issues in the WFD, as well as some of the boundaries and geographical areas.
Guidance document on Article 14 (WFD) http://www.eau2015-rhin-meuse.fr/fr/ressources/documents/guide_participation-public.pdf http:// www.eau2015-rhin-meuse.fr/fr/ressources/documents/guide_participation-public.pdf)
Harmoni-COP http://www.harmonicop.uos.de/Harmoni-COP http://www.harmonicop.uos.de/
82
Box 4. Lessons on ensuring resources available are in proportion to what is needed to carry out analysis
Following the adoption of the WFD, discussions began amongst Member States (through working groups) on the appropriate interpretation and methods required to fulfil the economic aspects of that Directive. This produced extensive guidance (e.g. WATECO and various CIS information sheets).
However, this guidance was produced at a time when other details of the WFD (e.g. definition of the scale of a water body and of reference conditions for Good Ecological Status) were still under development. When these details were complete, and the suggested economic guidance came to be implemented in Member States, adjustments were made to the planned approach to fit within the available resources of the competent authority. In some Member States, it was apparent that the competent authority did not possess enough economists to undertake the initial work on identifying cost-effective measures in each river basin.
The experience of the WFD suggests that even with sufficient staff in place, their training is an important factor in successful and efficient implementation of ESA for the MSFD. The WFD (and MSFD) are unusual as environmental Directives in that they have specific economic requirements. This has led to a lot of new methods and data, and multidisciplinary cooperation between disciplines which may not be used to working together, or may not be used to providing results in a way that will input to other analysis (in particular scientific evidence for ESA).
The WATECO guidance produced for the WFD took a long time to prepare and has been helpful for performing economic analysis. However, despite being one of the most easily accessible guidance documents around, it still requires a certain level of background knowledge from the target audience (e.g. economic valuation, CBA, CEA, stakeholder communication etc.).
Therefore, the lesson for the MSFD is that in planning the approach to the ESA, it is critical to take into account the likely scale of work required to implement the Directive and the resources available to undertake it.
Links to Guidance documents: http://ec.europa.eu/environment/water/water-framework/facts_figures/guidance_docs_en.htm http://ec.europa.eu/environment/water/water-framework/facts_figures/ guidance_docs_en.htm
83
Box 5. Lessons on using economic (non-market) valuation studies in WFD
Current work is prepared by Eftec for the European Commission in reviewing the use of non-market valuation studies in the WFD. Lessons drawn from its initial findings include:
1. Early indications are that River Basin Management Plans reviews show wide variety of detail and robustness across the non-market valuation studies used in the WFD.
2. Another early indication is that most Member States are unclear about what the ecosystem services approach is and how it can be used in RBMPs.
3. Baseline information was something that also took a lot of time to establish and not all stakeholders agreed with the official baseline information.
4. Some Member States did not use economic valuation studies at all in their WFD plans. Others used value transfer a lot. Value transfer in the case of MSFD will be even more limited – as both science and economic literature are missing.
5. The primary research that took place on economic valuation was generally static (over time and space). Recent developments in economic valuation methods mean that more dynamic analysis is possible (e.g. different baselines, distribution of values across space etc.).
6. In addition, earlier studies assumed linear relationships between economic value and environmental improvement (e.g. if an improvement is twice as much as another, its value is assumed to be twice as much too). But of course there are non-linearities – for example some research in the WFD context shows that people value improvements from bad to good much more highly than from good to better. Again MSFD can benefit from these developments.
7. A major part of the economic value of WFD improvements in water quality and quantity often come from use values. Hence in cases where these use values (market or non-market) are sufficient to show costs are not disproportionate, non-use values need not be expressed in monetary terms. With MSFD – in particular in offshore areas, use values may not be sufficient and hence quantification of non-use values may be desired. This may mean a bigger challenge for MSFD – bigger scientific uncertainties about the marine environment and how it may change in response to MSFD measures and uncertainties about economic benefits.
84
POMESA_18-2018-04
ANNEX C: LITERATURESource Title Time Relevance for economic concepts in task
1Geographic area covered in source
Comment
World Bank - FOA report
The Sunken Billion. The Economic Justification for Fisheries Reform
2009 1) Economic analysis of the use of those waters (partly only for fishery sector), 2) Cost of degradation (partly only for fishery sector), 3) Benefit analysis of marine waters goods and services (partly only for fishery production)
Global Estimates of the value of fishery which can be used for benefit transfer (world wide estimates). Compare the value of fishery at a sustainable level (optimal level) with the value of the actual catchments in the fishing sector. The difference between these two estimates expresses the loss of economic value of the fishery resources in the oceans. The estimated yearly loss is $50 billion due to overfishing. The quantitative results are only presented at an global aggregated level and not in unit prices. This estimate might be a useful input to estimate the cost of degradation in the initial assessment in MSFD.
TEEB The Economics of Ecosystems and Biodiversity study
2008/2009
There are relatively little specific on marine waters. No directly links to the economic terms from task I.
Global Focus on the need to make valuation of ecosystems. Contains examples of valuation and how these can be used in a political process. There is a framework for how valuation should be done.
Millennium Ecosystem Assessment
Current State & Trends Assessment/ Scenarios /Policy Responses
2005 No direct links to the economic terms from task I.
Global Definition of a baseline. Listing how to asses benefits of marine waters; including an identification and categorisation of the existing goods and services of ecosystems. This is an excellent platform for moving towards a more operational classification system that links changes in ecosystem services to changes in human welfare.
UNEP/WCMC and HERMES
Deep -sea biodiversity and ecosystems - A scoping report on their socio-economy, management and governance
2007 1) Economic analysis of the use of those waters, 2) Cost of degradation, 3) Benefit analysis of ecosystem functions
Global Re 1) Overview of human activities on deep sea (fishing, offshore oil and gas, mining, waste disposal, cable laying, pipeline laying, surveys and marine scientific research). Useful to identify sectors using the marine waters as input to the economic analysis of the use of those waters. Re2+3) Goods and services: Same categories of marine ecosystem goods and services as in Turner et al. (2009) and the Millennium Ecosystem Assessment (MA) + a good but non-exhaustive figure of goods an services in each category (p. 26), sea appears to be possibly the worst case for deriving monetary values. There are more results for use values such as the fishing sector and oil and gas extracted etc. since they are based on market prices but very limited monetary values for other goods and services. Reason: Limited knowledge of the deep sea affects our capacity to put values on ecosystems and their goods and services - see research gaps. There are some quantitative monetary values in this study on aggregated world wide level (e.g. food production from marine water, oil and gas wells, nutrient cycling function from worlds oceans). Research gaps: Conclude vast research gaps on the socioeconomic aspects of the deep sea (p. 69), gives a list of important research topics (a) Relationship between biodiversity, ecosystem functioning and the provision of goods and services, b) monetary and non-monetary valuation techniques and how they can be applied to deep sea goods and services, c) plausible future trends in economic activities for baseline, etc.).
WWF. (WWF Germany)
The Value of our Oceans - The Economic Benefits of Marine Biodiversity and Healthy Ecosystems
2008 1) Benefit analysis of TEV, 2) Cost of degradation, 3) Disproportionate costs, 4) Polluter should pay (change in TEV=damage)
Global Include many examples of quantitative monetary values of the benefits of the oceans. For example an estimate of the global value of the overall marine systems (ecosystem services). Furthermore there are examples of benefits and lost benefits (degradation) in each of these categories: 1) Tourism, recreation and leisure, 2) Feed the world (fish and aquaculture production), based drugs, cosmetic products etc.), materials and indirect products (fish meal and oil), coastal regions (marine flora and faunas natural protection off shore/coast, UK and Germany salt marshes values, wetlands) and Climate regulation (carbon storage service of the oceans)
Swedish EPA What's in the sea for me? Ecosystems
2009 1) Benefit analysis, 2) Cost-benefit analysis, 3) Cost of degradation, 4)
Baltic sea A synthesis of 1) analysis and descriptions of marine ecosystem services 2) Valuation of benefits of changes in marine ecosystems
85/92
POMESA_18-2018-04
Source Title Time Relevance for economic concepts in task 1
Geographic area covered in source
Comment
services provide by the Baltic Sea and Skagerrak
Disproportionate costs Assessments of costs and cost-benefits described, but not TEV. The assessment of ecosystem services indicates that several of these are under threat (10 out of 24); and that the food web, biodiversity and the resilience of the sea are among the services under threat. The conclusion on the synthesis is that it is socially optimal to end Baltic Sea eutrophication in line with BSAP objectives, the net benefits exceed €2 billion a year, but the assessment is uncertain building on a number of outdated results. Further, there are large differences throughout the Baltic.
Swedish EPA . Söderqvist T. & L. Hasselström (Eds)
The economic value of ecosystem services provided by the Baltic Sea and Skagerrak
2008 1) Benefit analysis, 2) Cost-benefit analysis, 3) Cost of degradation, 4) Disproportionate costs, 5) Economic analysis of the use of those waters
Baltic Sea WTP results are described, not TEV. valuation studies in the countries surrounding the Baltic Sea Description of related studies 3) background for potential benefit transfers using the summarised information of environmental focus, study population, valuation method, welfare measure and benefit estimates 4) description of knowledge gaps. 40 valuation studies and related studies have been gathered and described related to values of the Baltic Sea environment. The studies mainly cover eutrophication, fisheries, oil and marine debris and offshore location of windmill farms, most of them related to local regions and specific scenarios, only one study deals with the TEV of improvements of the Baltic marine environment as such. The studies show significant benefits of improving the marine environment, but a large part of the results are outdated, especially the only study dealing with the entire Baltic sea. A number of needs for new assessments are described in the conclusions.
Swedish EPA . Hasselström, L., Hasler, B., Martinsen, L., Pedersen, A.B., Petersen, L.K., Tukhanen, H., Kurki, K., Sievänen, T., Huhtala, A., Kowatsch, A., Vanags, A., Kaleja, A., Kalis, M., Semèniènè, D., Sceponaviciute, R., Daugintiene, S., Czajkowski, M., Markowska, A., Zygmunt, M., Zylich, T., Volchkova, N.
Tourism and recreation industries in the Baltic Sea area - How are they affected by the marine environmental state?
2008 1) Economic analysis of the use of those waters (qualitative descriptions)
Baltic sea Qualitative description of the implications and effects of the current marine environment for tourism, but no economic numbers. 1) Interview study of tourism managers and actors, tourists not included. 2) Tourism industries around the Baltic are unaffected by current marine environmental problems 3) Blue green algae most important nuisance 4) Indication that increased frequency of algae blooms might induce harm to the tourism industries, mentioned in Denmark, Sweden and Finland. No economic numbers.
Swedish EPA . Katarina Elofsson Swedish Agricultural University.
The costs of environmental improvements of the Baltic Sea dn Skagerrak. A Literature review.
2008 1) Cost effectiveness of programmes of measures
Baltic sea Total welfare economic costs and cost-effectiveness of measures for nutrient reductions to the Baltic Sea. Qualitative description of costs of reductions of oil spill, hazardous substances and invasive species management. The costs of 50 % reduction of nutrient loads to the Baltic lead are estimated to EUR 2.8 billion. The costs of the BSAP target are estimated to the interval 2.6 billion euro - 5 billion euro depending on the implementation. The costs of abatement of hazardous substances, oil spill and invasive species are described and results from studies in other parts of the world are described and commented.
Swedish EPA . Ing-Marie Gren. Swedish Agricultural University.
Costs and benefits from nutrient reductions to the Baltic Sea.
2008 1) Cost effectiveness of programmes of measures, 2) Cost -benefit of measures
Baltic sea Cost-benefit analysis of nutrient reductions to the Baltic Sea from different measure. Economic analysis. Net present value of BSAP targets (HELCOM). Cost-benefit analysis building on former valuation results from the 1990s, compared to results of cost-effectiveness analysis of different programme of measures for nutrient reduction. Net present values estimated with discount rates between 0 and 7%, net present values are positive for all of these.
HELCOM and NEFCO (COWI report)
Economic analysis of the BSAP with focus on
2007 1) Cost effectiveness of programmes of Baltic sea 1) Focus on cost effective measures to reduce eutrophication in the Baltic Sea. Used as input for the BSAP. 2) Focus on actions to reduce
86/92
POMESA_18-2018-04
Source Title Time Relevance for economic concepts in task 1
Geographic area covered in source
Comment
eutrophication measures nutrients from diffuse sources (farmland), waste water plants, airborne nutrients from e.g. energy and transport combustion. 3) Economic analysis approach incl. all costs to society, 4) Baseline description, 5) Overview of measures and scenarios analysed (p-free detergent scenario, sewage treatment scenario, agricultural scenario, 7) Results (at source level/country level and Baltic Sea level) ,8) Supplementary to the cost-effectiveness - a short overview of Benefits of the Baltic Seas goods and services
Schou J. et al Costs of nutrient reductions to the Baltic Sea
2006 1) Cost effectiveness of programmes of measures
Baltic sea Cost-effectiveness of nutrient abatement measures, costs of action. Total economic costs and unit costs per kg N. Cost-minimisation strategies for the 9 countries surrounding the Baltic Sea using a cost-minimisation model.
Söderquist T. Baltic Stern initiative. Stern initiatives for the Baltic sea- status and ongoing work
2009 1) Cost-effectiveness of programmes of measures, 2) Cost-benefit analysis, 3) Cost of no action of nutrient abatement
Baltic sea Ongoing network, no results yet. Linking Finnish, Danish and Swedish models, inlcluing cost-minimisation models and valuation studies. environmental issues not yet decided.
Wateco, European Communities
Guidance document No 1 on economics and environment
2003 Guideline for implemention of economic principles in the WFD, i.e. cost-recovery, costs of water use, cost-effectiveness, accounting for environmental and resource costs, assessments of disproportionate costs (exemptions).
EU Guideline defining economic methods and requirements, case studies and examples from European sites. WFD aims at improvements of groundwater, inland waters and coasts, and focus on abatement measures from land based activities, i.e. from other sources than the MSFD. Important guideline for MSFD because of methodological considerations and suggestions, but do not cover empirical unit cost estimates for abatement measures, environmental costs and benefits relevant for the MSFD. A large number of relevant case studies are described, and an annex provides practical advice.
European commission Common Implementation Strategy for the Water Framework Directive (2000/60/EC)- Guidance Document No. 20 - Guidance Document on Exemptions to the environmental Objectives. Technical Report 2009- 027
2009 Disproportionate costs EU General recommendations for Cost-Benefit ratios (C/B) in order to define when costs are disproportionate. Recommends also to look at affordability issues (ability to pay of those affected by the measures).
MPRA, Italy. Marin, G. Economic valuation of marine and coastal biodiversity in North Adriatic Sea: socio-economic situation of the area and benefit transfer
2009 Benefit analysis North Adriatic Sea (Mediterranean Sea)
Assessment of the monetary valuation of non-use values of marine and coastal biodiversity in North Adriatic Sea by using benefit transfer. In addition to assessments of non-use values, use values are assessed through market price analysis of economic activities.
Beaumont, Austen, Mangi & Townsend. Marine Pollution Bulletin. 56(3) 386-396.
Economic valuation for the conservation of marine biodiversity.
2008 1) Benefit analysis, 2) Cost of degradation, 3) Disproportionate costs
UK Valuation of marine ecosystem services and goods for assessments of costs of no-action, benefit valuation. Assessment of the economic value of marine biodiversity in the UK using market prices and values of non-market goods and services from contingent valuation studies. Clarifying the role of valuation in the management of marine biodiversity. 13 ecosystem services are described for valuation, and 8 of the 13 services are valued in monetary terms. The study concludes that a decline in UK marine biodiversity could result in an unpredictable change in the provision of goods and services, including reduced resilience and resistance to change. They also conclude that there are risks for declining marine environmental health, reduced fisheries potential, and loss of recreational opportunities. The study delivers results which can be used as information for optimal allocation of resources in marine management, based on information of the benefits and costs of no-
87/92
POMESA_18-2018-04
Source Title Time Relevance for economic concepts in task 1
Geographic area covered in source
Comment
action.
R. K. Turner, D. Hadley, T. Luisetti, V. W. Y. Lam and W. W. L. Cheung. (Report to OSPAR Working Group on Environmental Impact of Human Activities, commissioned by Defra, UK)
Socioeconomic assessment within a marine strategy framework -Draft version
Draft Final 2010
1) Economic analysis of the use of those waters, 2) Cost of degradation, 3) Cost effectiveness of programmes of measures, 4) Interpretations of socio-economic analysis (financial versus economic analysis), 5) Time perspective of economic analysis
North East Atlantic (e.g. North Sea, Celtic seas, Bay of Biscay etc.). (data general EU/global but literature study North East Atlantic countries)
Re 1) Annex 3 in this source is very useful for the economic analysis of the use of those waters, when it comes to the fishery sector. Annex 3 identifies key economic indicators in the fishery sector and translates them into concrete variables, and shows where to find data on each variable. It includes economic indicators at all levels of the dose-response relation. For each indicator is listed "variable", "unit of measurement", "level of aggregation" and most importantly the possible "Data sources". Indicators like "Fis catch/landings in tonnes", "Landed value in EUR", "Change in net revenue", "Change in jobs/employment", "investment in physical capital" etc. All are very useful fishery sector economy data for all the types of economic analysis required in MSFD , Re 2) This source helps identify the existing goods and services of ecosystems and group them into four categories, which is an excellent platform for moving towards a more operational classification system that links changes in ecosystem services to changes in human welfare. review of the economic analysis approaches used in OSPAR countries (p. 3+annex 4): Conclusion: 1) The approaches focus on human activities and the financial impacts associated with marine resource usage, while only a minority investigate the full economic implications. (p. 3).
2) They focus on marginal costs rather than marginal benefits (p. 62)
3) Need for international studies covering regional sea scale (e.g. studies for the North Sea similar to Baltic sea - benefits of reducing nutrient loads) (p. 62). 4) Need for studies on fisheries production for commercial and recreational use (p. 62)5) Need for studies about economic consequences of the ecological impacts of oil spill accidents (p. 62)
6) Need for studies on costs of non-action should be estimated (p. 62)
7) New studies should focus on the integration between natural sciences (studying ecological conditions) and economics/social sciences measuring welfare consequences of those conditions),
Re 5) Indicates that the full economic analysis could not be completed before the 15'th of July 2012 and therefore not in the first cycle of the Initial Assessment. This again indicates that the economic analysis will not play a major role until the next cycle of the marine strategies (July 2018 for the Initial Assessment, etc.). It also indicates that it will be valuable to carry out initial economic analysis at whatever level is possible since it builds the structure and identifies data needs for the later comprehensive economic analysis - interpreted as next/second cycle of the marine strategies.
Nunneri, C., Windhorst, W., Turner, R. K., Lenhart, H. In Ecological Indicators 7 (2007) 776-792
Nutrient emission reduction scenarios in the North Sea: An abatement cost and ecosystem integrity analysis
2007 1) Cost effectiveness of programmes of measures, 2) Cost -benefit of measures, where benefits is measured in ecological risk reduction
EU /Southern North Sea
Implementation costs of measures for combating eutrophication, N and P effects (kg) and the corresponding reductions in ecological risk in the sea (inability to provide support function, goods and services) . Based on three case studies (Humber/UK, the Rhine/Germany/Netherlands, Elbe/Czech Republic/Germany) dealing with nutrient emission reduction to the southern North Sea. for each case area and total: total economic costs of measures (million Euro), Unit costs of measures (Million Euro/inhabitant or capita) and reduced ecological risk (0;100). measures very aggregated results at case study level and only divided into wetland creation, diffuse sources, point source reduction and not specific unit cost for each type of measure in these categories. further background information/reports.
Ledoux, L. and Turner, R.K. Ocean and Coastal Management,
Valuing ocean and coastal resources: A review of practical
2002 1) Benefit analysis of ecosystem functions Global 1) overview of valuation methodologies relating to ecosystem functions. 2) Overview of practical examples in annex A (converted to dollars using PPP to be comparable) 3) Conclusion: bias towards
88/92
POMESA_18-2018-04
Source Title Time Relevance for economic concepts in task 1
Geographic area covered in source
Comment
45:583-616. examples and issues for further actions.
studies focusing on recreational benefits (especially beaches not included in MSFD) and located in USA. 4) Results: in comparable unit prices which make benefit transfer possible. For example there is the biodiversity value (variety of habitats and species): 35,4-181 ($2000) per person per year (world wide interval) and several country specific values in annex A
European Commission funded research project (funded by the EC’s Framework 7 Programme). Implemented by a consortium of 30 partners from 15 countries.
Knowledge-based sustainable management for Europe’s seas (KnowSeas)
2009, on-going
1) Benefit analysis of ecosystem functions, 2) Cost of degradation
EU No results yet, since the project has just started. The project had its inception meeting in May 2009 and the first scientific workshop will be held in April 2010. It is important to be aware of the future results from this project since it has a specific focus on modelling the impacts on human welfare caused by ecosystem state changes and to examine the benefits, costs and social acceptance of policy actions. Information about the purpose of the project and expected deliveries in the future: 1) KnowSeas involves a consortium of 30 partners from 15 countries, bringing together natural and social scientists with extensive experience in the marine environment. KnowSeas is unique in that it will operate on two geographical scales: Regional Sea Scale and Member State Economic Exclusive Zone (EEZ) scale.2) In particular, criteria for assessing costs and benefits of management actions are poorly developed in the complex marine environment where multiple uses and management conflicts are common.3) There is a strong need for a “joined up” systems approach between natural and social science that delivers the knowledge base to support management for sustainable seas. 4) Will deliver tools to assist policy makers and regulators with the practical application of the Ecosystem Approach. One of the deliveries will be "Assessment of the benefits of European marine ecosystems goods and services and the costs of human induced changes".5) The project is divided into four Themes and 10 Work Packages. Work package 4 is about "Analysis of costs and benefits". Identify the full range of benefits (TEV) as far as allow and otherwise identify shortcomings in existing datasets. That means that no new valuation studies will be undertaken in this project.
ANNEX D: MEMBERS OF THE WG ESAName First name Country Organisation e-mail address Schwaiger Karl Austria Lebensministerium [email protected]Überreiter Ernst Austria Lebensministerium [email protected]
Van Gaever Saskia Belgium
Marine Environment Service of the Belgian Federal Public Service Health, Food Chain Safety and Environment, FOD Volksgezondheid, Veiligheid van de Voedselketen en Leefmilieu [email protected]
De Smet Lieven Belgium ARCADIS Belgium nv, [email protected] Annemie Belgium ARCADIS Belgium nv, [email protected]
Hadjichristoforou Myroula Cyprus
Marine Environment Division, Department of Fisheries and Marine Research (DFMR), Ministry of Agriculture, Natural Resources and Environment [email protected]
Wallach Torben Denmark Ministry of Environment, Denmark [email protected]
89/92
POMESA_18-2018-04
Villmann Agnes Estonia Ministry of Environment of Estonia [email protected]ömmann Sulev Estonia Ministry of the Environment [email protected]ömmann Tea Estonia SEI Tallinnn [email protected]äinen Kari Finland MTT Agrifood Research Finland, Economical Research [email protected] Markku Finland Ministry of Environment [email protected] Anni Finland MTT Agrifood Research Finland, Economical Research [email protected] Laure France Ministry of Ecology, France [email protected]
Ganne Odile FranceMinistry of Ecology, France, DG de l'aménagement, du logement, et de la nature [email protected]
Paillet Jerome France Agence des Aires Marines Protégés [email protected] Mahé France Agence des Aires Marines Protégés [email protected] Alexandre France Ministry of Ecology, France [email protected]
Buchs Ann Kathrin GermanyNiedersächsisshes Ministerum für Umwelt und Klimaschutz [email protected]
Imhoff Heike GermanyBundesministerium für Umwelt, Naturschutz und Reaktorsicherheit [email protected]
Nolte Nico Germany Federal Maritime and Hydrographic Agency, Germany [email protected] Jörg Germany Umweltbundesamt [email protected] Pantelis Greece Head of Protection Directorate [email protected] Phoebe Greece DIEES, Athens University of Economics and Business [email protected]
Kovacs Peter HungaryMinistry of Environment and Water, River Basin Management and Water Protection Department [email protected]
Meacle Mary IrelandDepartment of the Environment, Heritage and Local Government [email protected]
Montanaro
Oliviero
Italy
Director of the Xth Division, DG Nature Protection, Ministero dell'Ambiente e Tutela del Territorio e del Mare [email protected]
Dalla CostaMaria
ItalyISPRA (Institute for Environmental Protection and Research) [email protected]
Bebris Rolands Latvia Ministry of the Environment of the Republic of Latvia [email protected]
Girkontaite Ingrida LithuaniaWater Division, Environmental Quality Department, Ministry of Environment of the Republic of Lithuania [email protected]
Saliba Stephen Malta Malta Environment and Planning Authority (MEPA) [email protected] Claudine Malta Malta Environment and Planning Authority (MEPA) [email protected] Frédéric Netherlands Rijkswaterstaat Waterdienst [email protected] der Veeren Rob Netherlands Rijkswaterstaat Waterdienst [email protected] Jan-Erik Norway Climate and pollution agency [email protected] Marianne Norway Climate and pollution agency [email protected] Ida Norway Climate and pollution agency [email protected] Hans Norway Climate and pollution agency [email protected] Marianne Norway Climate and pollution agency [email protected] Przemyslaw Poland Chief Inspectorate for Environmental Protection [email protected] Tereza Portugal Portuguese Agency for the Environment [email protected] Alexandru Romania NIMRD [email protected]
Grcar Gabrijela SloveniaMinistry of Environment and Spatial Planning, Environment Directorate [email protected]
Peterlin Monika Slovenia Institute for Water of the Republic of Slovenia [email protected] Špela Slovenia Institute for Water of the Republic of Slovenia [email protected]
Puyol AP Spain Ministry of the Environment and Rural and Marine Affairs [email protected],
Buceta J SpainMinistry of the Environment and Rural and Marine Affairs [email protected]
Maceira Alejandro SpainSpanish Ministry of the Environment and Rural and Marine Affairs [email protected]
90/92
POMESA_18-2018-04
Ericsdotter Siv Sweden Stockholm Resilience Centre, Sweden [email protected] Katrin Sweden WSPGroup [email protected] Kerstin Sweden Swedish Environment Protection Agency (SEPA) [email protected] Elisabet Sweden Swedish Environment Protection Agency (SEPA) [email protected] Henrik Sweden Stockholm Resilience Centre, Sweden [email protected] Kevin United Kingdom Marine Scotland [email protected] Kirsty United Kingdom Department for Environment, Food and Rural AffairsStamp Philip United Kingdom Department for Environment, Food and Rural Affairs [email protected] Emma United Kingdom Department for Environment, Food and Rural Affairs [email protected] Naomi United Kingdom Department for Environment, Food and Rural Affairs [email protected] Jonathan United Kingdom Department for Environment, Food and Rural Affairs [email protected] Christopher United Kingdom Department for Environment, Food and Rural Affairs [email protected] Regional Sea Conventions
Luisa Maria Barcelona /MAP [email protected]
Iliev KirilBucharest Black Sea [email protected]
Velikova VioletaBucharest Black Sea [email protected]
Korpinen Samuli HELCOM [email protected] Sebastian OSPAR [email protected]
Sauzade Didier UNEP/MAPBleu Plan Regional Activity Centre of the UNEP's Mediterranean Action Plan [email protected]
Ravenel Hugues UNEP/MAPBleu Plan Regional Activity Centre of the UNEP's Mediterranean Action Plan [email protected]
Hema Tatiana UNEP/MAPUnited Nations Environment ProgrammeMediterranean Action Plan (UNEP/MAP) [email protected]
Stakeholder organisation
Clay Nicola CEDA Central Dredging Organisation [email protected] Anna CEDA Central Dredging Organisation [email protected]
Sutter Renaat de CEDA/ MSNG Central Dredging Organisation / Marine Strategy Navigation Group [email protected]
Pickaver Alan EUCC Coastal and Marine Union [email protected]
Lamaison Mélanie EBCD European Bureau for Conservation and Development
Dachicourt Bruno ETF European Transport Workers' Federation [email protected]
Willemsen Albert ICOMIA / MSNGInternational Council of Marine Industry Associations / Marine Strategy Navigation Group [email protected]
Cieniewizc Mirna MSNG Marine Strategy Navigation Group [email protected] Annabel OGP International Association of Oil and Gas Producers [email protected] Vera Seas at risk [email protected] EC and its scientific technical support
UnitBerrozpe Carlos Commission DG Envrionment, Marine unit [email protected] Sif Commission DG Envrionment, Marine unit [email protected] Anita Commission DG Environment, Water unit [email protected] Inger Commission DG Environment, Water unit [email protected]
91/92
POMESA_18-2018-04
JohanneDeswaef Gaelle Commission DG Environment, Water unit [email protected] Iain Commission DG MARE unit C1 [email protected] Hermina Commission DG MARE [email protected] Jan-Olavi Commission DG MARE [email protected] Gelabert Eva EEA EEA Agency EU [email protected] Manuel EEA Ecologic Institute [email protected] Max EEA Ecologic Institute [email protected] Trine EEA European Environment Agency [email protected]
Persons contributing to the WG ESA work through presentations and other contributions to the Guidance DocumentCollet Isabelle Eurostat
Cooper PhilipUniversity of Bath, UK
Dickie Ian Eftec, UK
Hull Stephen
ABP Marine Environmental Research Ltd, UK
Laamanen Maria HelcomMeiner Andrus EEARogers Stuart CEFASSoutokorva Åsa Enveco, SwedenVon Breugel Christina COWI, Denmark
92/92