Guidance for Assessing and Remediating Vapor Intrusion in ... · Figure C- 3: Sample Locations for...
91
Guidance for Assessing and Remediating Vapor Intrusion in Buildings March 2010 Environmental Cleanup Program 700 NE Multnomah St. Suite 600 Portland, OR 97232-4100 www.oregon.gov/DEQ DEQ is a leader in restoring, maintaining and enhancing the quality of Oregon’s air, land and water. Phone: 503-229-5696 800-452-4011 Fax: 503-229-6762
Transcript of Guidance for Assessing and Remediating Vapor Intrusion in ... · Figure C- 3: Sample Locations for...

Guidance for Assessing and Remediating Vapor Intrusion in Buildings
March 2010
Environmental Cleanup Program 700 NE Multnomah St. Suite 600 Portland, OR 97232-4100
www.oregon.gov/DEQ
DEQ is a leader in restoring, maintaining and enhancing the quality of Oregon’s air, land and water.
Phone: 503-229-5696 800-452-4011
Fax: 503-229-6762

This document provides information and technical assistance to the public and to employees of the Department of Environmental Quality regarding DEQ’s Cleanup Program. The information in this document should be interpreted and used in a manner consistent with Oregon’s environmental cleanup laws and implementing rules. DEQ guidance does not constitute rulemaking by the Environmental Quality Commission and may not be relied upon to create a right or benefit, substantive or procedural, enforceable at law or in equity, by any person. DEQ may take action at variance with this document
Documents can be provided upon request in an alternate format for individuals with disabilities or in a language other than English for people with limited English skills. To request a document in another format or language, call DEQ in Portland at 503-229-5696, or toll-free in Oregon at 1-800-452-4011, ext. 5696; or email [email protected].

Guidance for Assessing and Remediating Vapor Intrusion in Buildings
I. ACKNOWLEDGEMENTS The following Department of Environmental Quality staff participated in the development of this guidance:
Bruce Gilles Robert Hood Henning Larsen Ann Levine Mike Romero Seth Sadofsky Paul Seidel Rebecca Wells-Albers
Additional review was provided by: DEQ technical staff and stakeholders
II. DISCLAIMER This document provides information and technical assistance to the public and employees of the Department of Environmental Quality regarding the Department's cleanup program. The information should be interpreted and used in a manner that is fully consistent with the state's environmental cleanup laws and implementing rules. This document does not constitute rulemaking by the Environmental Quality Commission, and may not be relied upon to create a right or benefit, substantive or procedural, enforceable in law or equity, by any person, including the Department. The Department may take action at variance with this guidance.
III. APPROVAL
This guidance document has been approved for use by the Department of Environmental Quality Land Quality Division.
Department of Environmental Quality
Land Quality Division
Page i
Date J. ir;.10
March 25, 2010, 2010
dlomont
Text Box
Guidance for Assessing and Remediating Vapor Intrusion in Buildings
Oregon Department of Environmental Quality March 25, 2010
Page ii
Table of Contents 1. Introduction ................................................................................................................. 1
2. Summary of Process .................................................................................................... 3
3. Vapor Intrusion Investigation Guidelines ................................................................... 7
3.1 Vapor Intrusion Pathway Investigation Planning ................................................. 9
3.1.1 Bounding the Vapor Intrusion Investigation Area ...................................... 11
3.1.2 Sample Density and Location ..................................................................... 11
3.1.3 Soil Gas Sampling Strategies ...................................................................... 12
3.1.4 Timing and Frequency of Sampling ............................................................ 13
3.1.5 Analytical Methods ..................................................................................... 13
3.2 Recommended Field Procedures ........................................................................ 15
3.2.1 Soil Gas Procedures .................................................................................... 15
3.2.2. Sub-Slab Vapor Procedures ........................................................................ 16
3.2.3. Indoor Air Sampling .................................................................................... 17
3.2.4. Outdoor (Ambient) Air Sampling ............................................................... 18
3.2.5. General Field QA/QC ...................................................................................... 19
4. Risk-Based Evaluation .............................................................................................. 21
4.1 Data Reduction Techniques at Vapor Intrusion Sites ......................................... 21
4.2 Applicability of UCL Calculations ..................................................................... 21
4.3 Exposure Units ................................................................................................... 22
4.4 Documenting Statistical Analyses of Vapor Data .............................................. 22
4.5 Soil Vapor Risk-Based Concentrations .............................................................. 22
4.6 Interpretation of Indoor Air Results ................................................................... 23
4.6.1 Temporal Variability ................................................................................... 24
4.6.2 Comparison to RBCs ........................................................................................ 24
4.6.3 Comparing Indoor VOC Concentrations to Outdoor Ambient Levels ....... 25
4.6.4 Using Other Lines of Evidence ................................................................... 26
4.6.5 Unit Conversions ......................................................................................... 26
4.6.6 Risk Determinations Based on Indoor Data ................................................ 26
5. Vapor Intrusion Mitigation ........................................................................................ 27
5.1 Removal and Remedial Actions ......................................................................... 27
5.2 Remedial Actions ............................................................................................... 27
5.3 Engineering and Institutional Controls ............................................................... 27
5.4 Performance Monitoring of Selected Controls ................................................... 28
5.5 Professional Registrations and Certifications ..................................................... 28
Appendix A: Determination of Screening Level Attenuation Factors and Soil Vapor Risk-Based Concentrations
Guidance for Assessing and Remediating Vapor Intrusion in Buildings
Oregon Department of Environmental Quality March 25, 2010
Page iii
A.1 Introduction ............................................................................................................. A-1
A.1.1 Sub-Slab Vapor and Indoor Air ......................................................................... A-1
A.1.2 Sub-Slab Vapor and Concentration Attenuation ............................................... A-3
A 2. Attenuation Factors for Chlorinated Compounds ................................................... A-4
A 2.1. EPA Database Derived Sub-Slab Vapor Attenuation Factors ...................... A-4
A.2.2 Literature-Derived Sub-Slab Attenuation Factors ........................................ A-6
A.2.3 Consideration of Confounding VOC Sources ............................................... A-6
A.2.4 Selection of a reference percentile ................................................................ A-7
A.2.5 Summary and Recommendations ................................................................. A-7
A.2.6 Occupational Attenuation Factors ................................................................. A-8
A.2.7 Sub Slab Vapor vs. Soil Vapor ..................................................................... A-9
A.2.8 Attenuation for Petroleum Hydrocarbons ..................................................... A-9
Appendix B: Heating Oil Tank Program Guidance for Assessing and Remediating Vapor Intrusion in Residential Buildings
B.1 Introduction ............................................................................................................. B-1
B.2 Variations from Vapor Intrusion Guidance ............................................................. B-1
B.3 Heating Oil Tank Vapor Intrusion Case Study ....................................................... B-3
Appendix C: Industrial Case Studies
C.1: Case Study 1 ............................................................................................................ C-1
Petroleum Release from Underground Storage Tank...................................................... C-1
C.2: Case Study 2 ............................................................................................................ C-4
Assessing Risk at a Commercial Building ...................................................................... C-4
C.2.1 Background and Site History ........................................................................ C-4
C.2.2 Underground Storage Tank Decommissioning ............................................. C-4
C.2.3 Initial Remedial Investigation Work ............................................................. C-4
C.2.4 Vapor Control System Installation ................................................................ C-5
C.2.5 Finalizing Remedial Investigation and Feasibility Study ............................. C-5
C.3: Case Study 3 ........................................................................................................... C-9
Assessing Risk at a Commercial Building ...................................................................... C-9
C.3.1 Site Description ............................................................................................. C-9
C.3.2 Initial Vapor Sampling .................................................................................. C-9
C.3.3 Vapor Sampling for Risk Assessment .......................................................... C-9
C.3.4 Risk Characterization .................................................................................. C-10
C.3.5 Further Actions ........................................................................................... C-10
Appendix D: References and Web Links
Appendix E: Building Survey Form
Appendix F: Public Comment Responsiveness Summary

Guidance for Assessing and Remediating Vapor Intrusion in Buildings
Oregon Department of Environmental Quality March 25, 2010
Page iv
List of Figures Figure 1: Vapor Intrusion Investigation Process ................................................................. 4 Figure 2: The US EPA Data Quality Objectives Process .................................................... 7 Figures A-1 & A-2: Sub-Slab Vapor vs. Indoor Air ....................................................... A-2 Figure A-3: Attenuation Factor vs. Sub-Slab Vapor……………………………………A-5 Figure A-4: Attenuation vs. Sub-Slab (High Range Vapor) ........................................... A-7 Figure A-5: Attenuation vs. Sub-Slab Vapor (Commercial Properties) ......................... A-9 Figure A-6: Attenuation vs. Petroleum Vapor Overlying Groundwater ....................... A-10 Figure A-7: Chlorinated Vapor Overlying Groundwater……………………...………A-11 Figure B- 1: Single Sampling Point for HOT Site .......................................................... B-2 Figure C- 1: Vapor Sampling Locations at Commercial Building .................................. C-8
Figure C- 2: Sampling Locations for 1st Phase of Sub-slab Vapor Sampling .............. C-11
Figure C- 3: Sample Locations for 2nd Phase of Sub-slab Vapor Sampling ................ C-12 List of Tables Table 1: Influences on Sampling Density ........................................................................ 11
Table 2: Sampling Density in Commercial Buildings ..................................................... 12
Table 3: Vapor Intrusion Sampling and Analysis Methods ............................................. 14

Guidance for Assessing and Remediating Vapor Intrusion in Buildings
Oregon Department of Environmental Quality March 25, 2010
Page v
List of Acronyms
CAP Corrective Action Plan COC Chemical of Concern COI Chemical of Interest COPC Chemical of Potential Concern CSM Conceptual Site Model DEQ Department of Environmental Quality DQO Data Quality Objective EE/CA Engineering Evaluation and Cost Estimate EPA Environmental Protection Agency EPC Exposure Point Concentration FS Feasibility Study GC/MS Gas Chromatography/Mass Spectrometry HVAC Heating, Ventilation and Air Conditioning LOF Locality of Facility HOT Heating Oil Tank LUST Leaking Underground Storage Tank MRL Method Reporting Limit OAR Oregon Administrative Rules OSHA Occupational Safety and Health Administration PAHs Polynuclear Aromatic Hydrocarbons; also Polycyclic Aromatic Hydrocarbons PID Photo-ionization Detector QA/QC Quality Assurance/Quality Control RBC Risk-Based Concentration RBCsi Risk-Based Concentration for vapor intrusion from soil RBCso Risk Based Concentration for vapor in outdoor air from soil RBCwi Risk-Based Concentration for vapor intrusion from groundwater RSL Risk Screening Level SAP Sampling and Analysis Plan SIM Selective Ion Monitoring SLV Screening Level Value SVOC Semi-Volatile Organic Compound TCE Trichloroethylene or Trichloroethene TPH Total Petroleum Hydrocarbons UCL Upper Confidence Limit UST Underground Storage Tank VI Vapor Intrusion VOC Volatile Organic Chemical WRD Water Resources Department

Guidance for Assessing and Remediating Vapor Intrusion in Buildings
Oregon Department of Environmental Quality March 25, 2010
Page 1
1. Introduction
The Oregon Department of Environmental Quality (DEQ) prepared this guidance to help responsible parties, environmental professionals, and DEQ project managers make appropriate risk-based decisions about vapor intrusion into indoor air at environmental cleanup and Underground Storage Tank (UST) cleanup sites when the Conceptual Site Model (CSM) shows the potential for vapor intrusion. This guidance document addresses long-term risk from chronic exposure. Risks of explosion or other acute exposure hazard should be addressed immediately, and are not within the scope of this guidance document.
Past DEQ guidance relied heavily on predictive models of vapor migration to determine Risk-Based Concentrations (RBCs) for vapor intrusion from soil and groundwater. This guidance supersedes previous DEQ guidance (DEQ 2003) for the assessment of the vapor intrusion pathway, and supplements other applicable guidance developed by US Environmental Protection Agency (EPA) (US EPA 2002a) and the Interstate Technology & Regulatory Council (ITRC 2007) by providing specific information on what data are required to assess vapor intrusion risks in Oregon. Additional data may be necessary to make site-specific decisions.
DEQ acknowledges variations in vapor-intrusion terminology between the agency’s Cleanup, Leaking Underground Storage Tanks, and Heating Oil Tanks programs. DEQ has included all appropriate terms in critical areas of the guidance document such as in the Flow Chart in Figure 1. Questions about specific program terminology should be directed to DEQ staff in the respective programs.
Vapor intrusion is the migration of Volatile Organic Compounds (VOCs) from the subsurface into buildings. VOCs are compounds or chemicals with a Henry’s law constant greater than 10-5 atm-m3-mol-1, and include products such as gasoline, diesel, and solvents. Certain pesticides, Polynuclear Aromatic Hydrocarbons (PAHs), and other semivolatile organic compounds (SVOCs) may have sufficient volatility and toxicity to pose a vapor intrusion risk. (Note: DEQ is conducting an ongoing evaluation of certain SVOCs to refine the list of compounds potentially posing vapor intrusion risks.)
If there are, or are likely to be, buildings within 100 feet of a VOC source area of contaminated soil or within 100 feet of a VOC groundwater plume contaminated above DEQ’s published RBCs, soil gas data will be needed to assess vapor intrusion risk. See Appendix B for distance requirements for residential heating oil tanks.
Outdoor or ambient air commonly has detectable levels of VOCs, sometimes exceeding ambient air RBCs. The largest sources of these contaminants are engine exhaust, fuel storage facilities, and emissions from commercial/industrial activities. Because outdoor air typically makes up from 99% to 99.99% of indoor air, ambient VOC levels tend to represent the minimum or baseline concentrations measured in indoor air.
Buildings also can have interior sources that emit VOCs. These include building materials, paints, dry cleaned clothes, cosmetics, tobacco smoke, and oil furnaces. It is best to inventory such sources and if possible, remove them prior to sampling indoor air. If an interior VOC source cannot be removed and it may interfere with the vapor intrusion analysis, additional air samples can be collected to better assess the source’s influence on indoor air quality. Alternatively, it may be

Guidance for Assessing and Remediating Vapor Intrusion in Buildings
Oregon Department of Environmental Quality March 25, 2010
Page 2
helpful to limit the analysis of indoor air samples to the list of chemicals detected in soil gas.
In an occupational setting, where a Chemical of Interest (COI) for a site is in commercial use, indoor air data may not be useful for vapor intrusion assessments. That’s because the RBCs used by DEQ are typically orders of magnitude lower than OSHA’s occupational exposure limits, so that VOCs released during daily operations may overwhelm and obscure the contributions resulting from vapor intrusion. Under these circumstances, risk determinations will be based primarily on subsurface data.
This guidance document is organized into the following sections:
Section 2: Outlines the decision framework for a vapor intrusion pathway evaluation (Steps 1 and 2 of the Data Quality Objectives (DQO) process).
Section 3: Describes the key elements of a CSM, data quality objectives development, and investigation framework (Steps 3 and 4 of the DQO process).
Section 4: Describes methods to determine whether remedial action is necessary to mitigate vapor intrusion risks (Steps 5, 6 and 7 of DQO process).
Section 5: Describes vapor intrusion mitigation strategies.

Guidance for Assessing and Remediating Vapor Intrusion in Buildings
Oregon Department of Environmental Quality March 25, 2010
Page 3
2. Summary of Process
This guidance presents a framework for vapor intrusion investigations, adapted from EPA’s 7-step DQO development process (US EPA 1994). A full discussion of the DQO process is beyond the scope of this document but a summary is presented in Section 3. The DQO process is not limited to analytical quality assurance and reporting limits, but must include systematic project planning to ensure that data collected will meet project objectives (US EPA 2006). Without systematic planning, your risk analysis may be ambiguous or inconclusive, possibly leading to additional sampling, increased cost and project delays. This guidance describes appropriate soil gas, sub-slab vapor, and indoor air investigations, including setting DQOs, sampling, interpreting data, reporting, and implementing Quality Assurance/Quality Control (QA/QC) procedures. Recommended procedures or methods described in other publications may be referenced rather than reiterated in this guidance. Citations for referenced documents and links to many of them are included in Appendix D.
A good CSM helps determine the need for a vapor intrusion investigation. Appendix B of the ITRC vapor intrusion guidance (ITRC 2007) includes a checklist for this pathway. The CSM will guide the development of DQOs for vapor intrusion investigations. This section, and Figure 1 below, applies when the CSM indicates the potential for vapor intrusion (VI) exposures, and the risk of explosion and acute exposure hazards have been ruled out or addressed.

Guidance for Assessing and Remediating Vapor Intrusion in Buildings
Oregon Department of Environmental Quality March 25, 2010
Page 4
1. Is groundwater contaminated with VOCs2
above RBCwi3?
2. Is source area soil
contaminated with VOCs
above RBCsi3?
3. Collect sub-slab and/or soil gas samples and screen against RBCs3
4. Are concentrations
of sub-slab and/or soil gas above RBCs3?
5. Are concentrations of sub-slab and/or
soil gas below Hot Spot levels?
6. Collect indoor air samples
Rule out vapor intrusion pathway for
sub-slab and/or soil gas for current & future
uses
7. Are indoor air results
conclusive and below RBCs3?
Rule out vapor intrusion pathway for
groundwater for current and future
uses
9. Complete FS4 for Remedial Action or EE/CA5 for Removal Action
Yes Yes
No
Yes
8. Rule out current exposure, retain future uses in CSM1.
Yes
CSM1 for source area(s) and plume area(s) show potential for vapor intrusion for current and/or future uses
No
Yes
No
No
Rule out vapor intrusion pathway for
soil for current & future uses
No
Removal or remedial action is possible at any stage.
1. CSM = Conceptual Site Model 2. VOC = Volatile Organic Chemical 3. RBC = Risk-Based Concentrations 4. FS = Feasibility Study 5. EE/CA = Engineering
Evaluation/Cost Analysis 6. CAP = Corrective Action Plan
9. Complete FS4 for Removal or Remedial Action, or CAP6 for LUST cleanup.
Additional data can be collected if existing data is inadequate for decision.
Figure 1: Vapor Intrusion Evaluation Process Flow Chart Figure 1: Vapor Intrusion Investigation Process

Guidance for Assessing and Remediating Vapor Intrusion in Buildings
Oregon Department of Environmental Quality March 25, 2010
Page 5
Figure 1, Boxes 1 and 2: Compare source area vadose zone soil and shallow groundwater concentrations to DEQ RBCs for soil (RBCsi) and groundwater (RBCwi) for protection of indoor air. If the source area is inaccessible or unidentified, go to box 3.
The rate of chemical diffusion out of groundwater is controlled by contaminant concentrations at the water-soil interface (water table). Thus only groundwater data representative of this zone should be compared to the RBCwi to evaluate the potential for vapor intrusion. DEQ provides RBCs for soil and groundwater based on default assumptions and modeling as described previously (DEQ 2003). Evaluate both individual constituents and Total Petroleum Hydrocarbon (TPH) concentrations, when present at the site.
When screening VI risk from exposure to petroleum contamination, please refer to the Calculating RBCs for Total Petroleum Hydrocarbons spreadsheet of the on-line version of the RBDM guidance document for updated soil and groundwater RBCs for gasoline and diesel. These screening levels supersede those presented in Appendix A of the version of the guidance published September 22, 2003. Additionally, screening criteria based on results of VPH and EPH analyses are included in the on-line version of the RBDM document to address exposure to TPH products, wastes and mixtures for which generic screening levels have not been established. These criteria are presented in footnote 3 of the Calculating RBCs for Total Petroleum Hydrocarbons spreadsheet.
• If groundwater VOC concentrations are below RBCwi, additional soil gas investigation is not warranted for this release mechanism for either current or future use of the property.
• If groundwater VOC concentrations in the source or plume area exceed RBCwi, it indicates vapors released from groundwater may pose an unacceptable risk for current or potential future building occupants and a soil gas investigation is warranted.
• If soil VOC concentrations in the source area are below RBCsi and is consistent with other site information, additional soil gas investigation is not warranted for this release mechanism.
• If soil VOC concentrations in the source area exceed RBCsi, additional soil gas investigation is warranted.
Figure 1, Box 3: Conduct a soil gas investigation.
• Collect sub-slab vapor data whenever possible. Sub-slab vapor data have the strongest correlation to, and are the best predictor of, vapor intrusion into existing buildings (see Appendix A).
• Soil gas sampling is appropriate for areas where new construction is reasonably likely, and for areas adjacent to existing buildings where sub-slab sampling is not feasible.
• Crawlspace samples may be collected in buildings constructed without a slab.
Figure 1, Box 4: Evaluate sub-slab and soil gas data to determine if concentrations exceed sub-slab or soil gas RBCs.
• If sub-slab or soil gas VOC concentrations clearly do not exceed RBCs, additional investigation is not warranted.
• If VOC concentrations exceed RBCs, proceed to box 5.

Guidance for Assessing and Remediating Vapor Intrusion in Buildings
Oregon Department of Environmental Quality March 25, 2010
Page 6
Figure 1, Box 5: Evaluate indoor air concentrations.
• If sub-slab or soil gas VOC concentrations are below hot spot levels, complete indoor and ambient air sampling; or optionally, conduct a removal, remedial action or corrective action in lieu of additional investigation (box 9).
• If VOC concentrations exceed hot spot levels, proceed to box 9.
Figure 1, Box 6: Conduct indoor air sampling, unless the same chemical is currently in use in the building. Ambient (outdoor) air sampling is also necessary to evaluate whether a Chemical of Concern (COC) in ambient air could confound indoor air results. If the COC is in current use in the building or ambient concentrations exceed RBCs, make decisions based on subsurface data with appropriate attenuation factors.
Figure 1, Box 7 & 8: Evaluate indoor and ambient air sampling results, considering both seasonal variability and site conditions that may promote vapor migration through preferential pathways.
• If indoor air VOC concentrations are below RBCs, rule out current exposure but retain future potential exposure in the CSM.
• If VOC concentrations exceed RBCs, compare to ambient levels. • If indoor air VOC concentrations exceed RBCs or are inconclusive, complete an FS for a
remedial action or a CAP for a LUST cleanup. Alternatively, collect additional data.
Figure 1, Box 9: Complete an FS for a removal or remedial action evaluation or a CAP if unacceptable risk cannot be ruled out. In any case, at sites with hot spot concentrations or free product, take prompt action to protect the health of building occupants.

Guidance for Assessing and Remediating Vapor Intrusion in Buildings
Oregon Department of Environmental Quality March 25, 2010
Page 7
3. Vapor Intrusion Investigation Guidelines
The ITRC vapor intrusion guidance (ITRC 2007) includes detailed descriptions of site screening (Section 2) and site investigation (Section 3 and Appendix D). This section presents additional information specific to Oregon, including a summary of the DQO process as it applies to VI planning, investigations and field procedures (Sections 3.1 and 3.2 below).
Document the CSM for the facility and develop DQOs according to EPA guidance (US EPA 1994).
Figure 2 shows the DQO process, with descriptions following.
Figure 2: The US EPA Data Quality Objectives Process
DQO Step 1: State the Problem: The problem statement summarizes the preliminary CSM and serves as the framework for evaluating the VI pathway.
Example Problem Statement: “A release from a waste-oil UST containing benzene and the chlorinated solvent trichloroethylene (TCE) occurred to soil and groundwater next to the main production building at the facility. The release was discovered during the decommissioning of the tank, based on visual and olfactory evidence, waste profiling of the tank contents, and confirmation soil samples. The former tank was 30 feet from the property boundary, which abuts a commercial strip mall with second floor apartments. Soil and groundwater contamination at the facility may pose unacceptable exposure risks to site workers through direct contact or migration of vapors from the subsurface into indoor air. Off-site workers and residential populations may also be at risk if contaminants have migrated to nearby structures at significant levels. Both benzene and TCE are known or suspected human carcinogens.”

Guidance for Assessing and Remediating Vapor Intrusion in Buildings
Oregon Department of Environmental Quality March 25, 2010
Page 8
DQO Step 2: Identify the Decision Does VI pose an unacceptable risk that requires remediation? This question must be answered for each potentially complete exposure pathway and exposure unit, e.g., each current or potential future building within the Locality of the Facility1 (LOF). The portion of the LOF attributable to VI corresponds to the subsurface area where VOC levels currently exceed soil gas RBCs, or will exceed RBCs in the future if no action is taken.
DQO Step 3: Identify Inputs to the Decision Identify the kinds of sampling and analysis needed to evaluate the significance of a potentially complete exposure pathway. Site-specific data needed to evaluate VI pathways may include:
1. Measurements of VOCs in soil and or groundwater within the exposure unit. 2. Measurements of VOCs in soil gas within the fill or native soil below existing buildings
and/or within the pore space of vadose zone soil. 3. Measurements of VOCs in indoor or outdoor air.
Defining DQOs in Steps 2 and 3 should precede the development of a Sampling and Analysis Plan (SAP), which specifies details of sampling and analytical methods and reporting limits, and the number, type, and location of samples. DQO Step 4: Define the Study Boundaries The LOF defines the study area boundaries and may extend beyond the property line of the source property. The LOF may contain several separate VI exposure units (current and/or future buildings), depending on proximity of the release to buildings or likely migration patterns of groundwater or soil gas. DEQ typically expects VI evaluations at sites where current and likely future buildings are within 100 feet of a source area of contaminated soil or groundwater exceeding DEQ’s RBCs.
DQO Step 5: Define the Decision Rule Use the generic VI RBCs for soil and groundwater, soil gas, and air as the threshold criteria to evaluate potential exposure pathway risks. Oregon’s soil vapor RBCs are based on EPA’s compiled empirical data (US EPA 2008b), as described in Section 4 and Appendix A of this document. Previous DEQ guidance (DEQ 2003) describes adjustments to model parameters to create site-specific soil and groundwater RBCs. DEQ no longer accepts these site-specific model adjustments. Instead, use the soil and groundwater RBCs for preliminary screening, followed by soil vapor and corroborating site-specific evidence, as described in Section 2. Describe subsequent actions to be considered and taken if criteria are exceeded.
Example: Boxes 1- 2 in the vapor intrusion flowchart (Figure 1) define the decision rules for deciding if groundwater and soil are contaminated to a level that warrants further investigation of the VI pathway. The evaluation requires comparison of soil and/or groundwater data against generic RBCs. Reliable decision making requires LOF characterization data that permits accurate estimates of concentrations to compare to RBCs, or use maximums as described in Section 4. If data are not adequate for this purpose, it’s appropriate to return to DQO development (Steps 1 through 4).
DQO Step 6: Managing Decision Errors In VI investigations, as in other types of exposure pathway evaluations, two types of decision error
1 See OAR 340-122-115(34) for LOF definition

Guidance for Assessing and Remediating Vapor Intrusion in Buildings
Oregon Department of Environmental Quality March 25, 2010
Page 9
are possible:
• False Negative: A determination that a pathway poses no unacceptable risks when, in fact, the risks are unacceptable.
• False Positive: A determination that a pathway poses unacceptable risks when, in fact, the risks are acceptable.
Generally, using conservative2 RBCs prevent false negatives. Other strategies to prevent false negatives are comparing RBCs to maximum site concentrations and using conservative estimators of a mean. Overall, a properly designed investigation that captures all significant contamination information is the best method to prevent false negatives.
A phased site investigation approach can minimize the chance of false positives. Simple, conservative CSMs can be progressively refined through additional data collection and site characterization, providing more accurate predictions of risk. Accordingly, this guidance document promotes iterative investigations, with an increasing level of detail and information at each phase of investigation.
DQO Step 7: Optimize the Study Design Identify the most effective data collection approach that will achieve the DQOs. Include sample numbers, media, locations, analytes, and DQO-specific detection limits.
3.1 Vapor Intrusion Pathway Investigation Planning
A VI investigation should address all potential vapor exposure pathways/receptors within the LOF. Oregon Administrative Rule (OAR) 340-122-0115 (35) defines LOF as:
"Locality of the facility" means any point where a human or an ecological receptor contacts, or is reasonably likely to come into contact with, facility-related hazardous substances, considering:
(a) The chemical and physical characteristics of the hazardous substances;
(b) Physical, meteorological, hydrogeological, and ecological characteristics that govern the tendency for hazardous substances to migrate through environmental media or to move and accumulate through food webs;
(c) Any human activities and biological processes that govern the tendency for hazardous substances to move into and through environmental media or to move and accumulate through food webs; and
(d) The time required for contaminant migration to occur based on the factors described in subsections (35)(a) through (c) of this rule.
A good CSM should include the components found in Appendix B of the ITRC vapor intrusion guidance (ITRC 2007). As indicated previously, a good CSM will guide DQO development. Site-specific data needed for VI pathway risk assessment may include:
2 Conservative is a term frequently used in risk assessment practice that means uncertainties with respect to exposure potential and toxicity have been addressed by assuming that both intensity of exposure and toxicity are at the “high-end” of plausible values. These combined assumptions result in risk-based values that when not exceeded, allow confident decisions of no unacceptable risks.

Guidance for Assessing and Remediating Vapor Intrusion in Buildings
Oregon Department of Environmental Quality March 25, 2010
Page 10
• Measurements of VOCs in soil gas within fill and/or native soils below existing buildings.
• Measurements of VOCs in groundwater beneath or in the vicinity of potentially affected buildings or future buildings.
• Measurements of VOCs in indoor, outdoor air, or soil. • Measurements of ambient VOCs (i.e., unrelated to the release) that may contribute to
VOCs measured at the facility. • Measurement of VOCs in preferential migration pathways such as subsurface utility
corridors.
The first two measurements above will provide the initial basis for decision-making at most sites.
Subsurface vapor sampling is the most important element of a VI field investigation. For smaller sites, a single phase of work may be adequate to establish VI potential, while larger sites can require multiple phases of vapor sampling to fully define an area of concern and accurately characterize its risks. Individual sampling plans should be based on the site CSM, and the broader investigation should accomplish the following objectives:
1. Characterize contaminant levels in VOC source areas and delineate the 3-dimensional extent and magnitude of subsurface vapor contamination exceeding RBCs;
2. Determine vapor concentrations near currently occupied buildings and in likely locations of future buildings; and
3. Refine the CSM regarding contaminant sources, transport pathways, and rates and causes of attenuation.
Considerations in developing a sampling plan include:
• Known sources and type(s) of VOC contamination • Extent and magnitude of soil and groundwater contamination • Subsurface geologic and hydrogeologic conditions • Locations and types of existing buildings, future buildings, utilities, and other developed
components of the site • Weather conditions • Potential for natural biodegradation of contaminants
VI investigations may incorporate temporary soil gas sampling points, permanent soil gas monitoring wells, passive vapor implants (for example the Gore™ Module), and sub-slab samples. Soil gas samples differ from sub-slab samples based on depth; they are typically collected approximately 5 ft below slabs, foundations, or the soil surface. In contrast, sub-slab samples are collected in soil or sub-grade drainage layers immediately beneath (< 6 inches) the slab foundation. Passive vapor implants, which provide semi-quantitative data, are typically used for reconnaissance sampling and may be deployed at a range of depths to evaluate the need for quantitative vapor sampling. DEQ does not consider data from passive vapor implants suitable for assessing risk or a substitute for soil gas/sub-slab samples.
For some sites, the initial phase of VI sampling may be conducted in a reconnaissance mode where sample locations are based on a pre-determined grid. However, most VI investigations will follow the approach typically taken to delineate soil and groundwater contamination – by characterizing conditions near the sources of contamination, then moving progressively outward to define the

Guidance for Assessing and Remediating Vapor Intrusion in Buildings
Oregon Department of Environmental Quality March 25, 2010
Page 11
boundaries of the vapor plume where contaminant levels exceed screening levels. For larger sites, DEQ expects isopleth concentration maps showing the subsurface distribution of vapor levels. For smaller sites, plan- and cross-sectional views displaying the data may be sufficient.
3.1.1 Bounding the Vapor Intrusion Investigation Area An important objective of a VI investigation is to delineate the extent and magnitude of the vapor plume and the area where subsurface vapor levels exceed generic soil gas/sub-slab RBCs. Due to the lateral diffusion and advection of vapors in the subsurface, the vapor plume may extend beyond soil and groundwater plume boundaries. While many factors affect the extent of lateral vapor migration initially, the VI pathway should initially be considered a potential threat for all current or potential future buildings located within 100 feet of a soil or groundwater plume which is defined here as soil or groundwater contamination exceeding VI RBCs. (See Appendix B for distance requirements at home Heating Oil Tank (HOT) sites.) For shallow, biodegradable, or relatively small sources of VOC contamination, the initial soil vapor testing may be focused closer to the source as the 100-ft distance is likely overly conservative. For sites with deeper, larger contaminant sources or where sources are intersected by utilities or other preferential transport pathways, the distance may need to be increased. As an investigation progresses, the results of soil gas sampling will be used to establish site-specific boundaries for areas with VI concerns.
3.1.2 Sample Density and Location To control uncertainty and reduce the chance of decision error in a site investigation, consider collecting more samples from an exposure unit. Sampling may also need to be iterative to increase confidence in vapor plume characterization. As a general rule, the greater the heterogeneity in a particular exposure unit, the more samples are required for accurate characterization.
The number or density of vapor sampling points depends on building size, proximity to sources, the scale of soil and groundwater impacts, heterogeneity in subsurface conditions, and the purpose of the data collection. See Table 1 below for a brief discussion of these factors and their influence on a sampling program.
Table 1: Influences on Sampling Density
Factor Influence on Sampling Program Rationale Near Primary Spill/Release Area Increased Sample Density Soil contamination, or free product can
produce heterogeneous contaminant distribution; high concentrations can result in a disproportionately large influence on indoor air quality.
Large Scale Site Reduced Sample Density Groundwater as the primary VOC source tends to be more homogeneous than soil sources; contaminant concentrations within larger plumes are more spatially uniform.
Reconnaissance Sampling Mode Reduced Sample Density Lower precision required. Primary objective is to define geographic area of concern, not assess risk/compliance.
Geologic Heterogeneity Increased Sample Density VI migration rates are sensitive to soil properties, and additional samples are needed to define subsurface variability.
Increasing Building Size Reduced Sample Density Conditions tend to be more homogenous in larger commonly ventilated spaces.

Guidance for Assessing and Remediating Vapor Intrusion in Buildings
Oregon Department of Environmental Quality March 25, 2010
Page 12
When evaluating VI potential beneath single-family residences, collect at least two samples. Collect one sample from beneath the center of the home and the second between the center of the structure and the wall of the building nearest the source of contamination, except at HOT sites (see Appendix B for more detail). The exchange of air near the margins of building foundations can locally decrease soil and sub-slab vapor levels. To obtain the most representative results, collect vapor samples at least 3 feet inside foundation edges. Additional samples should be collected near utility trenches (i.e., vapor transport) that intersect plumes of contamination. For commercial buildings, see Table 2 below.
Table 2: Sampling Density in Commercial Buildings
Building Size Sample Density Minimum Number of Samples Less than 1,000 ft2 NA* 2 1,000 ft2 -10,000 ft2 One per 1,500 ft2 3 Greater than 10,000 ft2 One per 2,500 ft2, or as otherwise
determined through consultation with DEQ
7
*NA = Not Applicable Soil gas sampling is appropriate for areas where future building construction is reasonably likely, and for areas adjacent to existing buildings where sub-slab sampling is not feasible. Reconnaissance sampling may be appropriate for open or undeveloped areas, to evaluate variability within a large vapor plume, and to determine the plume boundary. Under these circumstances, soil vapor samples should be spaced on 50-100 ft. centers, with denser sampling in suspected source areas.
3.1.3 Soil Gas Sampling Strategies If the buildings are slab-on-grade construction, collect and analyze shallow sub-slab soil gas for known or suspected contaminants and their breakdown products. In the absence of concrete slabs (common for single-family residences in Oregon) or in cases where the site is being evaluated for future construction, collect soil vapor from a greater depth. Some considerations when developing a soil gas sampling strategy include:
• Soil vapor concentrations tend to be higher directly beneath buildings than in surrounding areas (Abreu and Johnson 2005). To determine potential vapor intrusion risks, sample directly beneath buildings whenever feasible.
• To avoid the effects of barometric pumping (the movement of gases into and out of the vadose zone in response to changes in atmospheric pressure) and atmospheric mixing, collect soil gas samples in open areas from 5 feet or more below the ground surface. If adequate sampling depth is not feasible, DEQ may apply a lower attenuation factor to interpret risks from soil gas collected outside of the building footprint.
• Collect soil gas samples in the vadose zone above the capillary fringe, and avoid areas of water saturation.
• For sub-slab samples, consult the Draft EPA Guidance (US EPA 2006b). • Subsurface conditions at some sites may require alternative strategies. Examples include
areas with shallow bedrock, shallow groundwater, or homes with “wet basements.” Under these or similar circumstances, an investigation may need to bypass soil gas sampling and move directly to indoor air sampling.
• Please see Appendix B for the recommended assessment approach at HOT sites.
Guidance for Assessing and Remediating Vapor Intrusion in Buildings
Oregon Department of Environmental Quality March 25, 2010
Page 13
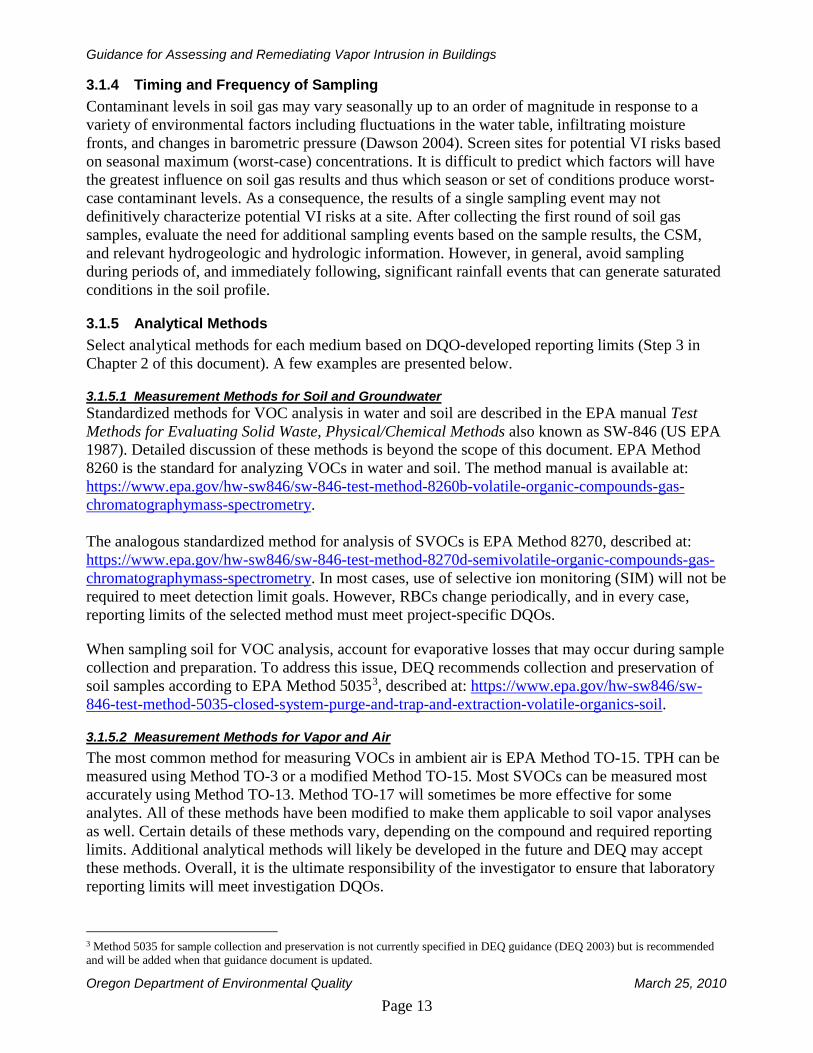
3.1.4 Timing and Frequency of Sampling Contaminant levels in soil gas may vary seasonally up to an order of magnitude in response to a variety of environmental factors including fluctuations in the water table, infiltrating moisture fronts, and changes in barometric pressure (Dawson 2004). Screen sites for potential VI risks based on seasonal maximum (worst-case) concentrations. It is difficult to predict which factors will have the greatest influence on soil gas results and thus which season or set of conditions produce worst-case contaminant levels. As a consequence, the results of a single sampling event may not definitively characterize potential VI risks at a site. After collecting the first round of soil gas samples, evaluate the need for additional sampling events based on the sample results, the CSM, and relevant hydrogeologic and hydrologic information. However, in general, avoid sampling during periods of, and immediately following, significant rainfall events that can generate saturated conditions in the soil profile.
3.1.5 Analytical Methods Select analytical methods for each medium based on DQO-developed reporting limits (Step 3 in Chapter 2 of this document). A few examples are presented below.
3.1.5.1 Measurement Methods for Soil and Groundwater Standardized methods for VOC analysis in water and soil are described in the EPA manual Test Methods for Evaluating Solid Waste, Physical/Chemical Methods also known as SW-846 (US EPA 1987). Detailed discussion of these methods is beyond the scope of this document. EPA Method 8260 is the standard for analyzing VOCs in water and soil. The method manual is available at: https://www.epa.gov/hw-sw846/sw-846-test-method-8260b-volatile-organic-compounds-gas-chromatographymass-spectrometry. The analogous standardized method for analysis of SVOCs is EPA Method 8270, described at: https://www.epa.gov/hw-sw846/sw-846-test-method-8270d-semivolatile-organic-compounds-gas-chromatographymass-spectrometry. In most cases, use of selective ion monitoring (SIM) will not be required to meet detection limit goals. However, RBCs change periodically, and in every case, reporting limits of the selected method must meet project-specific DQOs.
When sampling soil for VOC analysis, account for evaporative losses that may occur during sample collection and preparation. To address this issue, DEQ recommends collection and preservation of soil samples according to EPA Method 50353, described at: https://www.epa.gov/hw-sw846/sw-846-test-method-5035-closed-system-purge-and-trap-and-extraction-volatile-organics-soil.
3.1.5.2 Measurement Methods for Vapor and Air The most common method for measuring VOCs in ambient air is EPA Method TO-15. TPH can be measured using Method TO-3 or a modified Method TO-15. Most SVOCs can be measured most accurately using Method TO-13. Method TO-17 will sometimes be more effective for some analytes. All of these methods have been modified to make them applicable to soil vapor analyses as well. Certain details of these methods vary, depending on the compound and required reporting limits. Additional analytical methods will likely be developed in the future and DEQ may accept these methods. Overall, it is the ultimate responsibility of the investigator to ensure that laboratory reporting limits will meet investigation DQOs.
3 Method 5035 for sample collection and preservation is not currently specified in DEQ guidance (DEQ 2003) but is recommended and will be added when that guidance document is updated.

Guidance for Assessing and Remediating Vapor Intrusion in Buildings
Oregon Department of Environmental Quality March 25, 2010
Page 14
Low detection limits are usually required to evaluate a 10-6 excess cancer risk at the exposure point. As an example, the current TCE residential RBC for vapor inhalation is 0.027 µg/m3, and the occupational RBC is 0.14 µg/m3. The TO methods must concentrate analytes from a large sample volume, followed by Gas Chromatography/Mass Spectrometry (GC/MS) analysis either in scan or SIM mode to reach sufficiently low detection limits. SIM may be appropriate when the analytes of interest are known. Select the analytical method based on which compounds are present, their relevant decision criteria (i.e., RBCs), and the expected concentrations and reporting limits for each method.
Each laboratory analyzing samples by method TO-13, TO-15 or TO-17 must follow the methods described in EPA/625/R-96/010b (US EPA 1999), as updated.
See Table 3 below for a summary of recommended analytical methods for sampling media described above, including the benefits and limitations of each.
In some investigations it will be desirable to collect additional information on gases such as oxygen, nitrogen, carbon dioxide or methane in soil gas to understand potential for biodegradation of contaminants. These gases are measureable by standard US EPA methods and additional details will not be provided in this document.
Table 3: Sample Preservation and Analysis Methods
Media Name Description Benefits Limitations Soil EPA Methods
5035 and 8260
Method 5035 is a sampling/preservation protocol and 8260 is the standard method of analyzing VOCs.
Method 5035 is the recommended way to sample soils for VOCs.
Soil sampling may miss source zones, particularly for halogenated VOCs.
Groundwater EPA Method 8260
Low-Flow purge and sample methods are preferred. Method 8260 is the standard VOC analysis.
Defines groundwater plume.
In some cases. This method may miss SVOCs that may be COCs.
Vapor EPA Method TO-3/TO-3 Modified for TPH
A vacuum canister or Tedlar® Bag is used to collect a sample of gas for laboratory analysis by gas chromatography
Effective for C5-C10 hydrocarbons and TPH
Only useful for petroleum hydrocarbons; care must be taken for QA/QC.
Vapor EPA Method TO-13
A pump is used to send a specified volume of air through a puff cartridge and XAD resin media.
Lower detection limits for naphthalene and diesel range hydrocarbons.
Must use a pump to collect sample.
Vapor EPA Method TO-15 Scan or SIM
A vacuum canister with flow controller is used to collect a sample of gas for laboratory analysis by GC/MS.
Quantitative, can reach low detection limits if SIM certified, less expensive if low detection limits are not required.
Useful for VOCs and some SVOCs; care must be taken for QA/QC.
Vapor TO-17 An adsorbent tube is exposed to a known volume of gas.
Low detection limits on SVOC measure diesel range hydrocarbons.
Must use a pump to collect sampler.
Vapor Passive samplers (i.e., Gore™ Module)
A large survey is commonly done to determine spatial distribution of vapor.
Easy to install and provides good spatial coverage; many compounds possible.
Not applicable to Risk Assessment unless using other quantitative methods because passive samplers determine mass, not concentration.

Guidance for Assessing and Remediating Vapor Intrusion in Buildings
Oregon Department of Environmental Quality March 25, 2010
Page 15
3.2 Recommended Field Procedures
Recommended field methods and procedures for soil gas, sub-slab vapor, indoor air, and outdoor (ambient) air sampling are described below. While DEQ recognizes that different practitioners will employ various methods based on their experience and equipment, it is DEQ’s expectation that due care will be taken to ensure sample integrity and data quality. The procedures recommended here may be varied or changed depending on site-specific conditions or emerging technologies and methodologies. In all cases, the methodologies used in the field must be thoroughly described and documented in the work plan and the final report accompanying the sampling results. At a given site, it is important to use the same methods and procedures at all sampling locations throughout the investigation. 3.2.1 Soil Gas Procedures Soil gas sampling point installations may be permanent or temporary. Collect soil gas samples within the vadose zone, above the capillary fringe. When screening for risk at buildings with crawlspaces or for future construction, DEQ recommends collecting soil gas samples from at least 5 feet below grade. Under special circumstances, other depths may be appropriate. Please discuss any variation in sampling depth or procedures with your DEQ project manager in advance. The following procedures should be included in any sampling protocol:
a. Advance the soil gas sampling point to the necessary depth using direct push technology, or manual probes if site conditions permit.
b. Fit soil gas sampling points with inert, impermeable tubing (e.g., Teflon®, Nylaflow®, PEEK™ or stainless steel) of the appropriate size. Some compounds may require the use of a specific type of tubing because of problems with permeability or adsorption. Avoid polyethylene tubing for VOC sampling, as it is particularly subject to this kind of interference (Hayes et al 2006).
c. Let the system equilibrate at least 20-30 minutes for temporary borings, and 48 hours for permanent installations or augured holes.
d. Prior to collecting the sample, purge a minimum of two volumes (i.e., total volume of the sampling point, tube and sand-pack). Purging can be accurately completed using a graduated syringe and a 3-way valve. This will ensure that samples are representative of subsurface vapors. Do not over purge, this can lead to breakthrough or collecting samples from an unknown volume.
e. Test the sampling point for leaks, either by covering the sampling point and filling an enclosure with a tracer gas (i.e., helium) and testing the tubing where the collection device (usually a Summa canister) will be placed for the tracer gas. Alternatively, if field detectors and a tracer gas analyzer are not available, rags soaked in an inert VOC (not a suspected contaminant and able to be analyzed by TO-15 methods) may be placed around the top of the boring and tubing connectors. If using the second method, compounds selected for leak testing should be reportable by the laboratory, not be used on site, and not interfere with Method Reporting Limits (MRLs). Isopropanol may work in many cases. Be sure to check in with the DEQ project manager and/or laboratory prior to sampling to resolve any questions about a proposed leak detection compound. For on-site leak detection, more than 5% contribution from leakage of ambient air should be considered unacceptable and fittings should be adjusted, the hole resealed, or, if necessary, the hole should be abandoned and a new sample site should be installed.

Guidance for Assessing and Remediating Vapor Intrusion in Buildings
Oregon Department of Environmental Quality March 25, 2010
Page 16
f. Note the initial vacuum gauge reading and sampling start time, and record both on the chain-of-custody form.
g. Collect a sample by attaching the top end of the tubing to the canister valve, and monitoring the vacuum gauge to check progress of canister filling.
h. Close the canister valve after the required time to collect an adequate volume of soil gas, or when the vacuum gauge indicates that the canister is almost full4 (not <5 psi), or when sufficient sample volume has been collected. Record the elapsed sampling time and the final pressure onto the reporting form and chain of custody form. Consult with the laboratory supplying the canisters to obtain the vacuum gauge readings corresponding to an acceptable canister volume. Do not exceed a sample collection rate of 200 ml/min.
i. If the soil gas sampling point is a permanent installation, a protective casing should be set around the point tubing and grouted in place to the top to minimize infiltration of water or outdoor air, as well as to prevent accidental damage. The construction of any such permanent sampling point must also ensure that the sampling interval is adequately sealed off from both casing and external surface air. To help preserve the integrity of vapor samples, all permanent sampling points (both soil gas and sub-slab) should be fitted with a stop-cock/valve. This allows sample tubing to be attached to the well head without opening the well, and prevents ambient air from flooding the vapor well installation and diluting vapor samples.
j. Investigators should follow all appropriate reporting requirements of Oregon Water Resources Department. See Oregon Administrative Rule (OAR) 690-240 for requirements for geotechnical holes. Reporting requirements are provided in OAR 690-240-0035.
3.2.2. Sub-Slab Vapor Procedures Sub-slab sampling is designed to characterize the nature and extent of soil gas contamination immediately beneath a building with a basement foundation or slab-on-grade construction. Sub-slab sampling should generally follow the guidance outlined by the draft Standard Operating Procedure (SOP) for Installation of Sub-Slab Vapor Probes and Sampling Using EPA Method TO-15 to Support Vapor Intrusion Investigations, (US EPA 2006) and Section 3.2.1 above. Several main points are outlined below:
Advice on sample location is found in Section 3.1 above. Use the same technique to construct sub-slab sampling points at all sampling locations, to minimize possible discrepancies.
a) Drill a hole through the floor slab and into the sub-slab material, using a rotary hammer drill or other device.
b) Fit soil gas sampling probes with inert, impermeable tubing (e.g., Teflon®, PEEK™, Nylaflow®, or stainless steel) of the appropriate size. Some compounds may require specific types of tubing because of problems with permeability or adsorption. As mentioned above, avoid the use of polyethylene tubing for VOC sampling.
4 If using a Tedlar bag, collect sample until bag is ¾ full.
Guidance for Assessing and Remediating Vapor Intrusion in Buildings
Oregon Department of Environmental Quality March 25, 2010
Page 17
c) Insert a vapor sampling point into the material immediately below the slab.
d) Add coarse sand or glass beads to cover the point tip.
e) Seal the boring at the surface with grout, cement or other non-VOC-containing and non-shrinking products to prevent infiltration of ambient air. Allow at least 30 minutes for equilibration of subsurface conditions before sampling, this will usually be easily accommodated by waiting for the seal to dry.
f) Prior to collecting the sample, purge a minimum of two volumes (i.e., total volume of the sampling point, tube and sand pack), using a graduated syringe and a 3-way valve. This will ensure that samples are representative of subsurface vapors.
g) Test the sampling point for leaks as described in Section 3.2.1 above.
h) Collect a sample as described in Section 3.2.1 above.
i) Close the canister valve and record the final canister pressure on the chain of custody and sample sheets after collecting an adequate volume of soil gas, and submit the canister for laboratory analysis. Consult with the laboratory supplying the canisters to obtain the vacuum gauge readings corresponding to an acceptable sample volume for each canister.
3.2.3. Indoor Air Sampling Indoor air investigations usually require collection and analysis of air samples (Mass DEP 2002). The specific sampling and analytical methods may vary, depending on the DQOs for the investigation, particularly the required detection and reporting limits. In many cases EPA’s TO-15 SIM method will be needed to achieve project DQOs. If an indoor air investigation is necessary, then the study should be designed to best differentiate the effects of vapor intrusion from other indoor and ambient sources, which may include many site-specific issues which are not explicitly included in this guidance.
a. At a minimum, follow these general guidelines when selecting which buildings to sample for indoor air:
• Buildings where elevated concentrations of contaminants were measured in sub-slab vapor samples or from adjacent soil gas probes.
• Buildings in which measurements with field equipment (e.g., Photo-Ionization Detector (PID)) showed elevated levels of VOCs, suggesting possible VI risks.
b. Two weeks prior to collecting indoor samples, evaluate the physical layout and conditions of the building to be investigated. The purpose of this pre-sampling inspection is to identify conditions that may affect or interfere with the proposed sampling, and, where possible, to provide temporary mitigation of those conditions. Complete the building survey form included in Appendix E of this guidance during the inspections. This will allow time to request cooperation from building occupants to alter building usage if needed, and alert them to the sampling event. This will also provide adequate time to minimize potential background sources prior to sampling. Include the completed survey form with indoor air sampling results, as well as details of what modifications the occupants were requested to make and to what extent they complied with the request.

Guidance for Assessing and Remediating Vapor Intrusion in Buildings
Oregon Department of Environmental Quality March 25, 2010
Page 18
c. DEQ will generally require a minimum of two indoor air sampling rounds during differing seasonal conditions. Collect samples over a 24-hour period for residential buildings, and over an 8-hour period (corresponding to the normal work day) for commercial buildings. This requires use of a special low-flow precision regulator; consult your laboratory for details.
d. Obtain instructions for using the Summa canister and regulator and for collecting the sample from the canister supplier or laboratory. Place the Summa canister sample port in the breathing zone, approximately three to five feet from the floor. Collect the sample from the center of the room in the lowest level of the structure (e.g., basement or ground floor) near the suspected source and from the main floor if this is different from the lowest level.
e. Collect samples with doors and windows closed to minimize the contribution of outside air. It is also useful to collect a sample directly from a point of suspected vapor entry such as a sump or other enclosed space to better define the potential route of entry and the maximum concentrations. An outdoor, ambient air sample should also be collected at the same time and using the same sampling method as the indoor air sample (see below). In general, 24-hour (or 8-hour) indoor air samples should be collected in the following manner:
Place a Summa canister in the appropriate sampling location.
• Record the start time and initial vacuum gauge reading on the Air Sampling Form and Chain-of-Custody form.
• Affix a flow controller to the canister prior to sampling. The flow controller must be pre-set by the laboratory to collect the sample over a 24-hour (or 8-hour) period.
• Open the valve on the canister to begin sample collection. • After approximately 24 (or 8) hours, close the valve on the canister and record the time and
ending vacuum pressure on the Air Sampling Form and on the Chain-of-Custody form. • Ship or transport the canister(s) and flow controller(s) to the laboratory.
f. In addition, site-specific high-risk situations may warrant collecting indoor air samples prior to characterizing subsurface soil gas or sub-slab sampling. Examples of such situations may include the following:
• High readings are obtained in a building when screening with field equipment (e.g., an organic vapor meter, or an explosimeter) and the source is unknown.
• Soil or groundwater beneath the building is contaminated and the building is prone to flooding (e.g., sump pit overflows), so that subsurface vapor sampling is not feasible.
• Residents or workers complain of frequently smelling petroleum or other types of vapors that field instruments have failed to detect.
3.2.4. Outdoor (Ambient) Air Sampling When collecting indoor air data, background levels of VOCs in outdoor air should also be determined. Sources such as automobile exhaust, service stations, dry cleaning operations and numerous other activities and industries elevate VOCs levels in outdoor air, often to levels exceeding ambient air risk-based concentrations (Dawson and McAlary, 2009). Accordingly, any investigation of VOCs in indoor should attempt to quantify the contributions from outdoor air. In addition, elevated ambient VOCs, even if not the COIs of a particular study, may impact laboratory

Guidance for Assessing and Remediating Vapor Intrusion in Buildings
Oregon Department of Environmental Quality March 25, 2010
Page 19
reporting limits for COPCs due to matrix interference.
When an indoor air investigation is planned pursuant to the decision flow chart (Figure 2), include site-specific information on ambient background concentrations in the study design.
Collect outdoor air samples to characterize site-specific ambient conditions whenever indoor air samples are collected. The timing of the sampling can be important as VOC levels in ambient air vary diurnally. Also, it can take several hours for the air inside a building to be fully exchanged with and replaced by outdoor air. While the sampling period of indoor and outdoor samples should be identical in length, one strategy to improve their comparability and reduce errors resulting from the equilibration lag time is to begin collecting the outdoor air sample 1-2 hours prior to collecting indoor air samples. Depending on site-specific conditions, it may be useful to collect outdoor samples from several parts of the site and several different times to establish backgrounds for COCs; please consult with your DEQ project manager.
a. Collect outdoor air samples from a representative upwind location, away from wind obstructions (e.g., trees or buildings), and at a breathing-zone height (3 to 5 feet). A representative sample is one that is not biased toward obvious sources of volatile chemicals (e.g., automobiles, lawn mowers, chemical storage tanks, gasoline stations, industrial facilities, etc.).
b. Document conditions during outdoor air sampling to help interpret sampling results:
• Draw outdoor plot sketches that include the building site, area streets, outdoor air sample locations, location of potential interferences (e.g., major streets, gasoline stations, factories, lawn mowers, etc.), north arrow, and GPS location.
• Consider barometric pressure on the day of sampling and for the 3 days preceding the sampling event. This data need not be measured as part of the investigation if there is a nearby weather station with accessible data, but may be helpful for interpreting data.
• Record weather conditions (e.g., precipitation, indoor and outdoor temperature, wind conditions).
• Record any pertinent observations such as odors, field instrument readings, and significant activities in the vicinity (e.g., operation of heavy equipment, heavy traffic volume on nearby streets, nearby operating dry cleaners).
3.2.5. General Field QA/QC Take extreme care during all aspects of sample collection to minimize sampling error and ensure high quality data. Sampling team members should avoid actions that can cause sampling interference (e.g., fueling vehicles, using permanent marking pens, smoking, and wearing freshly dry-cleaned clothing or fragrances).
Follow appropriate QA/QC protocols for sample collection and laboratory analysis, such as use of certified clean sample devices, meeting sample holding times and temperatures, chain-of-custody, etc. Deliver samples to the analytical laboratory as soon as possible after collection. Laboratory procedures must be followed for field documentation (sample collection information/locations), chain of custody, field blanks, field sample duplicates and laboratory duplicates, as appropriate.
Maintain a field sample log sheet summarizing the following:

Guidance for Assessing and Remediating Vapor Intrusion in Buildings
Oregon Department of Environmental Quality March 25, 2010
Page 20
• sample identification; • sample location; • date and time of sample collection; • sampling depth; • sampling height (indoor or outdoor); • identity of samplers; • sampling methods and devices; • purge volumes and devices used; • starting and ending vacuum (pressure) of the Summa canister recorded on the chain-
of-custody and sampling forms; • apparent moisture content (dry, moist, saturated, etc.) of the sampling zone; • type of soil present in the sampling zone (e.g., clay, sand, gravel, etc.); and • chain-of-custody records to track samples from sampling point to analysis.
If sampling indoor air, determine status of HVAC system and any relevant data available on pressure differentials.
Guidance for Assessing and Remediating Vapor Intrusion in Buildings
Oregon Department of Environmental Quality March 25, 2010
Page 21
4. Risk-Based Evaluation
This section describes how to perform a risk-based evaluation consistent with OAR 340-122-084. Results from the VI investigation are part of the site-wide risk assessment that evaluates all potential exposure pathways at the site. If soil vapor levels exceed Hot Spot concentrations [OAR 340-122-0115(32)(b)], more immediate action is required to protect indoor air quality and building occupants.
4.1 Data Reduction Techniques at Vapor Intrusion Sites Standard risk estimation methods require a single statistical estimator of the arithmetic mean concentration in any media, consistent with OAR 340-122-084(1)(f). With respect to soil gas, because of the heterogeneities in subsurface media, variability between and potentially limited accessibility of soil vapor sampling locations, using site data to develop a mean concentration of soil vapor underlying an exposure unit can be difficult. Moreover, soil gas investigations sample a small fraction of the volume of soil vapor under a building, creating uncertainty in representativeness of analytical results5. Therefore, a statistical estimator of the mean is used, rather than the mean from the samples, to avoid underestimating the true mean concentration in the soil vapor. While estimating a mean concentration is preferred, it may be necessary to use maximum concentrations or sample-by-sample evaluations at many sites. Whether using the mean or maximum, the site must be adequately characterized to cover the range of concentrations present, to avoid underestimating risks. Make sure to anticipate and account for the use of either an estimator of mean OR a maximum during project/DQO planning (see Section 3). Typically, being able to use estimates of the mean will require a minimum of 8-10 samples for each unit requiring a decision (see Section 4.2). Uncertainty can be addressed by applying statistical methods that calculate “error bars” or confidence limits that expand or contract around the arithmetic mean, based on factors such as the number of samples, variability and range of concentrations observed, data distribution, and the desired level of confidence (probability that an Upper Confidence Limit or UCL encompasses the true mean). EPA has written extensive guidance and developed software to calculate UCLs for a variety of data distributions (i.e. normal, lognormal, non-parametric; US EPA 2002b). Many commercially available software packages are available that are acceptable to estimate mean and upper confidence limits on mean concentrations for risk assessment. Because it offers multiple statistics and addresses non-detected values, DEQ recommends using the most current version of the EPA supported public domain software ProUCL to calculate appropriate UCLs (U.S. EPA 2007). 4.2 Applicability of UCL Calculations Due to the data requirements for UCL calculations, statistical analyses of subsurface vapor data typically will be limited to commercial and industrial sites. EPA guidance recommends a minimum of 8-10 discrete samples for UCL calculations on data sets with a more predictable distribution (parametric type) and a minimum of 10-15 samples for less predictable distributions (non-parametric type). Sites with fewer data points should use the maximum concentration in the risk assessment.
5 At most VI sites, risks will be assessed based on the analysis of less than 0.02% of the soil vapor beneath a building (six liters of soil gas samples collected from upper 3 feet of soil beneath a 1,000 sq ft building). This results in significant uncertainty that the full range of concentrations are represented and that true spatial variability has been characterized. This is why simple arithmetic means, or spatially weighted averages based on arithmetic means (i.e. Thiessen Polygon), are not appropriate.

Guidance for Assessing and Remediating Vapor Intrusion in Buildings
Oregon Department of Environmental Quality March 25, 2010
Page 22
Subsurface vapor concentrations vary both spatially and temporally; UCL calculations can only address one source of variability at a time. While it is typically important to know how seasonal changes affect subsurface vapor levels, UCL calculations usually analyze spatial distribution of contaminant levels as the variable. Valid UCL calculations of subsurface vapor concentrations require all data in a set to be collected within days or weeks of each other. When soil vapor data from several depths are available, the data from the near subsurface (i.e., 4-5 feet bgs) should be used. In some circumstances deeper samples may be considered, but the near subsurface is the preferred depth.
4.3 Exposure Units On developed properties, a site may have more than one structure, or a large internally partitioned building with each building or partitioned area representing a separate exposure unit. In these cases, it is important to delineate the data points that will be used in the assessment for each exposure unit. DEQ recommends treating portions of buildings served by separate Heating, Ventilation and Air Conditioning (HVAC) systems or where ventilation is limited or isolated as separate exposure units. Some sites assessed for vapor intrusion risks may be partly or completely undeveloped – with the expectation of future development. DEQ may consider such sites to have potential vapor intrusion risk if individual data points exceed vapor intrusion RBCs. However, it is also possible to perform a statistical analysis of subsurface data as described above if the location of future buildings is known and individual exposure units can be delineated.
4.4 Documenting Statistical Analyses of Vapor Data In reports that include statistical analyses of vapor data, include both data tables and graphical displays of data distributions. DEQ recommends using EPA ProUCL or similar statistical software for this purpose. Include the summary of raw statistics, the program’s analysis of data distributions, and its recommended method of UCL calculation in the report. DEQ also recommends figures identifying each individual exposure unit along with the data set used to evaluate potential vapor intrusion within each unit. 4.5 Soil Vapor Risk-Based Concentrations This section describes the derivation of screening level RBCs to use for either sub-slab vapor data or soil vapor data collected outside the footprint of a building. These are derived from DEQs air RBCs by applying attenuation factors between the subsurface, where VOCs are measured, to the indoor air breathing zone. As with other RBCs, these derived RBCs vary by exposure scenario (i.e., residential, urban residential and occupational). See Appendix A for details of how DEQ developed the soil vapor RBCsv. DEQ’s air RBCs are consistent with US EPA’s inhalation methodology and Regional Screening Levels (RSLs, at https://www.epa.gov/risk/regional-screening-levels-rsls and U.S. EPA 2009). When RBCs for a site-specific volatile compound are not available in DEQ’s chemical-specific spreadsheet, they may be derived using the spreadsheet provided with DEQ’s 2003 guidance, or from US EPA RSLs, and applying Equation 1 below (DEQ 2003). DEQ has selected default attenuation factors of 200 residential properties and 1,000 for commercial properties, respectively (see Appendix A).

Guidance for Assessing and Remediating Vapor Intrusion in Buildings
Oregon Department of Environmental Quality March 25, 2010
Page 23
RBCsv RBCair * AF [1]
where:
RBC sv = Risk-based concentration in soil vapor6 medium, ug/m3 RBCair = Risk-based concentration in air medium, ug/m3 (DEQ 2003). AF = Attenuation Factor (unitless)
Please note that updates to the underlying RBCAir for a specific compound will change the VI RBCSV value for that compound. As new toxicity information becomes available, EPA updates toxicity values used to calculate their RSLs, and DEQ in turn uses the updated values to revise its RBCs. Therefore, be sure to use the latest values in DEQs chemical-specific spreadsheet available from http://www.oregon.gov/deq/tanks/Pages/Risk-Based-Decision-Making.aspx. As with other RBCs, exceedance of these values by a low order does not automatically demonstrate unacceptable risk. Conversely, if soil vapor data indicate acceptable risk and were collected in accordance with an approved work plan designed to meet project objectives, DEQ is likely to determine that risks by the assessed pathway are indeed acceptable. If indoor air and/or soil gas data exceed RBC values, further investigation may be necessary in accordance with study objectives (see Section 3). If VOC concentrations exceed RBCs by more than two orders of magnitude, building occupants may be at significant risk, and prompt removal or remedial actions are called for.
When indoor air and/or soil gas data collected during VI investigations marginally exceed (<1 order of magnitude) generic RBCs, consider these items to determine the need for further assessment:
• Round the data to the appropriate significant figure. • Evaluate performance criteria for the analytical method. Specifically, what is the margin of
error associated with the analytical method? • Compare constituent ratios (comparing subsurface and indoor air values) to determine if
other sources are contributing to indoor air concentrations. • Collect samples in opposite seasons (i.e. spring and fall) to account for variations in
barometric pressure and advection (see Section 4.6.1).
4.6 Interpretation of Indoor Air Results Indoor air sampling is the most direct method of measuring VOC exposures at VI sites. In cases where very high levels of contamination are present or the contamination has a unique character, the data can provide relatively quick confirmation of VI impacts. However, for most sites, simply detecting these chemicals inside a building is not definitive evidence of VI. Many of the VOCs encountered at VI sites are common contaminants in ambient outdoor air and may also have other sources inside buildings, such as vehicle exhaust, dry cleaned clothes, craft supplies, home improvement supplies, or personal care products (Dawson and McAlary 2009). These other sources can confound analysis of indoor data, and make it difficult to distinguish actual VI contributions. To reduce the frequency of false positives (see Section 3, DQO Step 6), DEQ does not recommend indoor air sampling until other information indicates a potential VI risk. While sometimes definitive, indoor air data should be considered just one line of evidence in a broader VI evaluation.
6 Applicable to either sub-slab vapor or soil vapor taken outside of building footprint, in accordance with an approved site-specific work plan.
Guidance for Assessing and Remediating Vapor Intrusion in Buildings
Oregon Department of Environmental Quality March 25, 2010
Page 24
VOC concentrations in the environment are highly variable, and collecting enough data to thoroughly understand and predict their temporal and spatial distribution can be costly. To compensate for these inherent uncertainties, indoor air sampling plans should target the most vulnerable areas of buildings during worst-case conditions. Developing appropriate sampling plans and accurate interpretations of indoor air data depends on an understanding of the sources and environmental factors that influence VOCs levels in the environment.
4.6.1 Temporal Variability VOC levels in ambient air can vary greatly over time. They fluctuate diurnally due to the ebb and flow of automobile traffic and commercial activity, and as a result of atmospheric heating and cooling cycles, air pressure changes and wind speed. These fluctuations and their impact on the data analysis can be dampened by collecting time-integrated samples. The time period that a sample is collected over should reflect the exposure scenario being evaluated. For residential properties, it is assumed an occupant will be present 24 hours/day; therefore, the samples should also be collected and integrated over a 24 hour period. For occupational settings, the sampling period should coincide with the hours of operation, typically 8 hours/day. EPA estimates indoor air undergoes a complete exchange every 1-2 hours. To account for the lag time in equilibration between indoor and outdoor air VOC levels, outdoor sampling may begin approximately 1-2 hours before collection of indoor air samples, and continue for the same exposure duration as the indoor samples.
Rates of VI are affected by both short term and seasonal changes in weather conditions. Changes in barometric pressure associated with the arrival of weather fronts can move gases into or out of the vadose zone. This phenomenon, known as “barometric pumping,” enhances VI rates as low pressure systems arrive, and decreases rates when transitioning to higher pressure. Wind is another condition that can enhance VI rates by depressurizing a building relative to the underlying soil, causing more vapors to enter the building from the subsurface. To account for these influences, collect and record local barometric pressure and wind-speed data over the 3 days before and during an indoor air sampling event.
Seasonal conditions also have a significant effect on VI rates. During winter months, heated air rises within the structure and exits through the upper floors and roof. This produces a “stack effect” that reduces indoor air pressure, draws in soil gas, and increases VI rates. In addition, saturation of soils surrounding a building can also enhance and focus the exchange of soil gases beneath a building. Maximum VI impacts are therefore most likely in late winter and early spring. To account for seasonal variability, DEQ expects at least two indoor air sampling events, to represent the annual range of conditions. For seasonal climate conditions in much of Oregon, it is ideal if one sampling event occurs during the late summer - early fall and another during late winter - early spring. Depending on the results, additional sampling may be necessary to make a risk determination.
4.6.2 Comparison to RBCs When evaluating VI risks from indoor samples, compare concentrations from each exposure unit to DEQ’s published ambient air RBCs. Residential RBCs should be applied at residential properties, schools, daycares and other locations where children have a long-term presence. At commercial/industrial properties, occupational RBCs are the relevant screening levels (Note: OSHA occupational exposure limits do not apply to environmental contamination.) Compare RBCs to the maximum concentrations detected in indoor air unless there are enough samples to perform a statistical analysis on the data. If indoor concentrations are below RBCs for all sampling events, DEQ presumes that VI is not causing unacceptable risks for existing building occupants and uses.
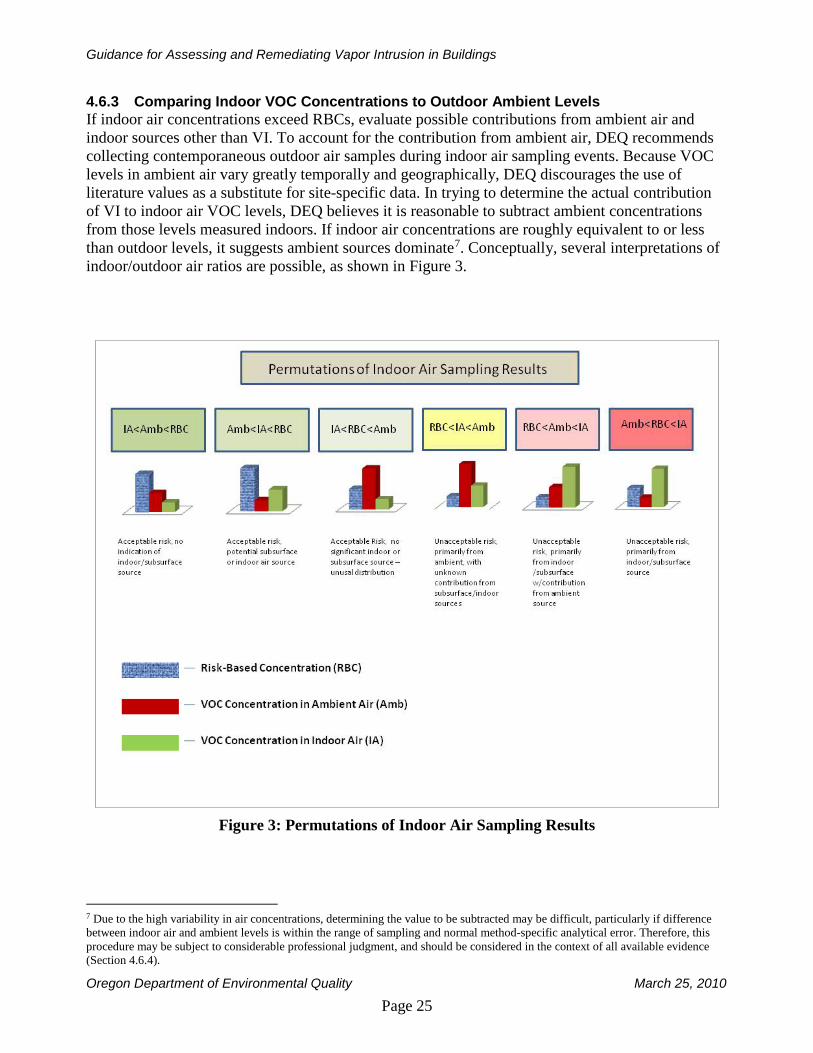
Guidance for Assessing and Remediating Vapor Intrusion in Buildings
Oregon Department of Environmental Quality March 25, 2010
Page 25
4.6.3 Comparing Indoor VOC Concentrations to Outdoor Ambient Levels If indoor air concentrations exceed RBCs, evaluate possible contributions from ambient air and indoor sources other than VI. To account for the contribution from ambient air, DEQ recommends collecting contemporaneous outdoor air samples during indoor air sampling events. Because VOC levels in ambient air vary greatly temporally and geographically, DEQ discourages the use of literature values as a substitute for site-specific data. In trying to determine the actual contribution of VI to indoor air VOC levels, DEQ believes it is reasonable to subtract ambient concentrations from those levels measured indoors. If indoor air concentrations are roughly equivalent to or less than outdoor levels, it suggests ambient sources dominate7. Conceptually, several interpretations of indoor/outdoor air ratios are possible, as shown in Figure 3.
Figure 3: Permutations of Indoor Air Sampling Results
7 Due to the high variability in air concentrations, determining the value to be subtracted may be difficult, particularly if difference between indoor air and ambient levels is within the range of sampling and normal method-specific analytical error. Therefore, this procedure may be subject to considerable professional judgment, and should be considered in the context of all available evidence (Section 4.6.4).

Guidance for Assessing and Remediating Vapor Intrusion in Buildings
Oregon Department of Environmental Quality March 25, 2010
Page 26
4.6.4 Using Other Lines of Evidence Consider all relevant factors and lines of evidence when making any VI determinations. These include: Comparing VOC Composition of Soil Gas to Indoor Air At sites with VOC releases, typically multiple VOCs will be present in soil gas. A comparison of the soil gas composition to that of indoor air can assist in identifying VI impacts. Comparisons of VOC ratios, the occurrence, concentration and ratio of degradation daughter products, or the occurrence of chemicals unique to the hazardous substance release can be useful in assessing the source of VOCs (Ginevan 2007; Feenstra 2006). Due to variability in the spatial distribution of subsurface VOCs and variability in analytical methods, this line of evidence alone may not be definitive.
Spatial Distribution of VOCs Sources of indoor air contamination can be inferred by examining the spatial distribution of VOCs. Proximity to subsurface sources and limited air circulation tend to result in basements having the highest vapor intrusion impacts in a building. A distinct concentration gradient from lower to higher floors in a building can be evidence of VI. The absence of such a gradient, or higher concentrations in upper levels of the building, suggests that ambient air or indoor sources are dominating VOC concentrations, unless the ventilation system provides good air mixing throughout the building.
Correlation to Meteorological Conditions When reviewing the results of multiple indoor air sampling events, consider the prevailing meteorological conditions during each event. Peak indoor air VOC levels corresponding to anticipated worst-case conditions suggest that VI is controlling indoor air concentrations. Using Radon as a Tracer Gas In theory, radon gas should be a reliable tracer for estimating attenuation rates of sub-slab vapors across a building foundation. Although not specifically recommended by DEQ, subsurface and indoor radon measurements can provide another line of evidence for evaluating VI potential.
4.6.5 Unit Conversions Many laboratories will report gas analytical results in units of parts per billion by volume (ppbv), although they may also report in units of analyte mass per volume of air (e.g., micrograms per cubic meter, ug/m3). Results reported in units of ppbv need to be converted to ug/m3 prior to completing the risk analysis, since RBCs are presented in these units.
4.6.6 Risk Determinations Based on Indoor Data • If the subsurface VOC contribution to indoor air VOC levels exceeds air RBCs, then there is
an unacceptable current and future risk to building occupants and corrective action, removal and/or remediation are necessary.
• If soil gas or sub-slab vapor concentrations exceed RBCs, but the subsurface contribution to indoor VOC levels is below air RBCs, current VI risks are acceptable.
• If ambient levels exceed RBCs, they become the de-facto compliance level for mitigation or remediation of indoor air.

Guidance for Assessing and Remediating Vapor Intrusion in Buildings
Oregon Department of Environmental Quality March 25, 2010
Page 27
5. Vapor Intrusion Mitigation
The exceedance of DEQ’s RBCs for sub-slab, soil gas and/or indoor air samples may require VI mitigation and controls. There are several types of mitigation approaches, commonly including the sealing of floor joints and cracks, passive or active sub-slab depressurization, HVAC system modifications, impermeable building foundation membranes, soil vapor extraction, soil venting and source removal techniques such as soil excavation or in-situ treatment. Common radon mitigation techniques may also be effective in certain situations. More than one of these techniques in combination may be needed to fully mitigate VI risk. Mitigation and remedial actions should be based on a sound CSM and environmental data.
DEQ does not recommend specific mitigation or remedial techniques, but instead asks for an appropriate evaluation (CAP or FS) and a remedy proposal for its review and approval. U.S. EPA Engineering Forum Issue Paper: Indoor Air Vapor Intrusion Mitigation Approaches (US EPA 2008a – see https://www.epa.gov/vaporintrusion/indoor-air-vapor-intrusion-mitigation-approaches) presents a comprehensive discussion of mitigation.
5.1 Removal and Remedial Actions A removal action (OAR 340-122-0070) such as active controls or source removals should be employed if COCs in VI-relevant soil, groundwater, or air samples exceeds Hot Spot concentrations as defined in (OAR) 340-122-0115 (32). This can occur while on-going site investigations continue and the feasibility of a long term remedial action is evaluated. Passive controls and mitigation techniques may be appropriate for contamination below hot spot levels.
Consider long-term compatibility with future remedial actions for the site when evaluating removal actions. Perform periodic monitoring to ensure that removal measures continue to be effective. DEQ should have the chance to approve a performance monitoring plan prior to implementation of the removal action.
5.2 Remedial Actions Remedial actions for VI typically include cleanup of contaminant sources and can only be implemented after completing a thorough site investigation and feasibility evaluation. Other remedial actions for media not directly related to VI should evaluate the impact these actions may have on the VI pathway prior to implementation, and vice versa.
5.3 Engineering and Institutional Controls Engineering and institutional controls are mechanisms for managing exposure risks when contaminant sources are left in place.
Oregon Administrative Rules OAR 340-122-0115(23) defines “Engineering Control” as “…a remedial method used to prevent or minimize exposure to hazardous substances, including technologies that reduce the mobility or migration of hazardous substances….” Engineering controls can be either removals or remedial actions for VI, and may include modifications to HVAC systems, vapor venting systems, soil vapor extraction systems, or other building modifications.
OAR 340-122-0115(33) defines “Institutional Control” as “…a legal or administrative tool or action taken to reduce the potential for exposure to hazardous substances. Institutional controls may include but are not limited to, use restrictions, environmental monitoring requirements, and site access and security measures.” These could have many applications at VI sites, such as

Guidance for Assessing and Remediating Vapor Intrusion in Buildings
Oregon Department of Environmental Quality March 25, 2010
Page 28
preventing residential uses when VI levels exceed residential RBCs but do not pose unacceptable risks in a commercial/industrial scenario.
Typical mechanisms to ensure that controls are maintained include Easements and Equitable Servitudes, Deed Restrictions, and Prospective Purchaser Agreements. DEQ’s 1998 Guidance for Use of Institutional Controls addresses the implementation of controls as a long term VI remedy. When controls are part of the remedy, include a schedule for performance monitoring and reporting to DEQ, to ensure the controls’ long-term protectiveness. Sites that rely on institutional or engineering controls remain listed on the DEQ confirmed release list and inventory as required in OAR 340-122-0078(3).
5.4 Performance Monitoring of Selected Controls Verification of the performance and effectiveness of a selected VI mitigation technique or remedial action is critical for long-term risk management. Define performance objectives in the remedy selection process, and develop clear and obtainable DQOs. In this way, metrics to measure performance can be selected and implemented in the performance monitoring schedule. Seasonal fluctuations of soil vapor concentrations should be fully understood prior to the selection of remedial performance objectives. An EPA Engineering Bulletin entitled Indoor Air Vapor Intrusion Mitigation Approaches contains a good discussion of performance monitoring.
5.5 Professional Registrations and Certifications Regulations governing the practices of Engineering and Geology are defined in ORS 672, OAR 820 and OAR 809, and must be followed when submitting reports and system design documents to DEQ. DEQ must ensure that engineering and geological work related to environmental investigations and remedial designs complies with applicable Oregon laws and regulations.

Appendix A: Determination of Screening Level Attenuation Factors and Soil Vapor Risk-Based Concentrations
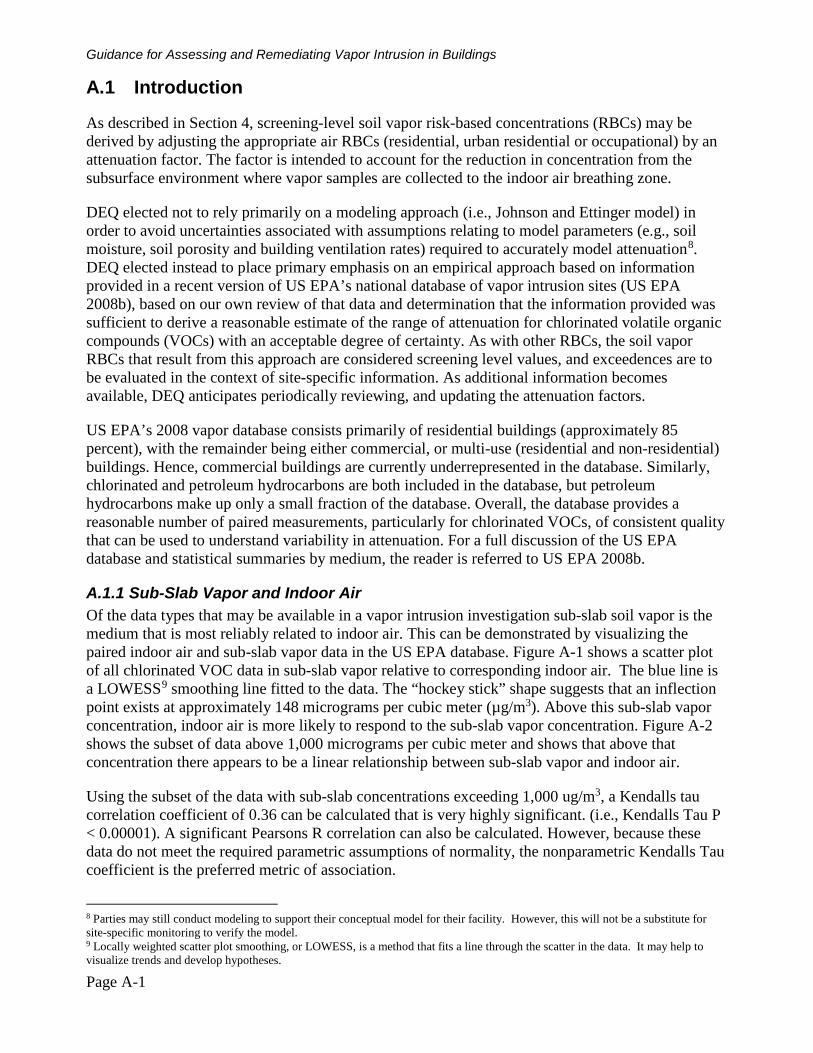
Guidance for Assessing and Remediating Vapor Intrusion in Buildings
Page A-1
A.1 Introduction
As described in Section 4, screening-level soil vapor risk-based concentrations (RBCs) may be derived by adjusting the appropriate air RBCs (residential, urban residential or occupational) by an attenuation factor. The factor is intended to account for the reduction in concentration from the subsurface environment where vapor samples are collected to the indoor air breathing zone.
DEQ elected not to rely primarily on a modeling approach (i.e., Johnson and Ettinger model) in order to avoid uncertainties associated with assumptions relating to model parameters (e.g., soil moisture, soil porosity and building ventilation rates) required to accurately model attenuation8. DEQ elected instead to place primary emphasis on an empirical approach based on information provided in a recent version of US EPA’s national database of vapor intrusion sites (US EPA 2008b), based on our own review of that data and determination that the information provided was sufficient to derive a reasonable estimate of the range of attenuation for chlorinated volatile organic compounds (VOCs) with an acceptable degree of certainty. As with other RBCs, the soil vapor RBCs that result from this approach are considered screening level values, and exceedences are to be evaluated in the context of site-specific information. As additional information becomes available, DEQ anticipates periodically reviewing, and updating the attenuation factors.
US EPA’s 2008 vapor database consists primarily of residential buildings (approximately 85 percent), with the remainder being either commercial, or multi-use (residential and non-residential) buildings. Hence, commercial buildings are currently underrepresented in the database. Similarly, chlorinated and petroleum hydrocarbons are both included in the database, but petroleum hydrocarbons make up only a small fraction of the database. Overall, the database provides a reasonable number of paired measurements, particularly for chlorinated VOCs, of consistent quality that can be used to understand variability in attenuation. For a full discussion of the US EPA database and statistical summaries by medium, the reader is referred to US EPA 2008b.
A.1.1 Sub-Slab Vapor and Indoor Air Of the data types that may be available in a vapor intrusion investigation sub-slab soil vapor is the medium that is most reliably related to indoor air. This can be demonstrated by visualizing the paired indoor air and sub-slab vapor data in the US EPA database. Figure A-1 shows a scatter plot of all chlorinated VOC data in sub-slab vapor relative to corresponding indoor air. The blue line is a LOWESS9 smoothing line fitted to the data. The “hockey stick” shape suggests that an inflection point exists at approximately 148 micrograms per cubic meter (µg/m3). Above this sub-slab vapor concentration, indoor air is more likely to respond to the sub-slab vapor concentration. Figure A-2 shows the subset of data above 1,000 micrograms per cubic meter and shows that above that concentration there appears to be a linear relationship between sub-slab vapor and indoor air.
Using the subset of the data with sub-slab concentrations exceeding 1,000 ug/m3, a Kendalls tau correlation coefficient of 0.36 can be calculated that is very highly significant. (i.e., Kendalls Tau P < 0.00001). A significant Pearsons R correlation can also be calculated. However, because these data do not meet the required parametric assumptions of normality, the nonparametric Kendalls Tau coefficient is the preferred metric of association.
8 Parties may still conduct modeling to support their conceptual model for their facility. However, this will not be a substitute for site-specific monitoring to verify the model. 9 Locally weighted scatter plot smoothing, or LOWESS, is a method that fits a line through the scatter in the data. It may help to visualize trends and develop hypotheses.

Guidance for Assessing and Remediating Vapor Intrusion in Buildings
Page A-2
3,269,01722,02614810.007
1,808
148
12
1
0.08
0.007
Subslab Vapor (ug/m3)
Indo
or A
ir (
ug/m
3) SubSlab Vapor vs. Indoor Air
Figure A-1: Sub-Slab Vapor vs. Indoor Air
Figure A-2: Sub-Slab Vapor vs. Indoor Air (where sub-slab vapor exceeds 1,000 ug/m3)
3,269
,017
1,202
,604
442,4
13
162,7
54
59,87
4
22,02
68,1
032,9
801,0
96
2,980
403
54.5
7.4
1
0.135
Sub Slab Vapor (ug/m3)
Indo
or A
ir (
ug/m
3)
Subslab Vapor vs Indoor Air

Guidance for Assessing and Remediating Vapor Intrusion in Buildings
Page A-3
As shown in Figures A-1 and A-2, sub-slab vapor is a reasonable and statistically significant predictor of impacts to indoor air, and the risk of impacts to indoor air increase as the sub-slab vapor concentration increases. Accordingly, DEQ is using sub-slab vapor as a primary line of evidence in vapor intrusion investigations. As described elsewhere in this document, other lines of evidence may be used and are recommended in many cases, but DEQ may not consider a vapor investigation conclusive in the absence of subsurface vapor data.
A.1.2 Sub-Slab Vapor and Concentration Attenuation Attenuation factors may be defined as the ratio of the chemical concentration in the subsurface medium over the concentration in indoor air (Equation A-1). Alternatively, attenuation can be presented as the inverse (indoor air over soil vapor). In most of the published literature, including US EPA 2008b, attenuation factors are presented as decimal fractions, as the indoor air concentration over the subsurface concentration. In this appendix, attenuation is represented as shown in equation A-1, since whole numbers are more intuitive than decimal fractions, and DEQ believes this presentation is more easily understood. The soil vapor medium may be either sub-slab vapor or soil vapor collected outside the footprint of an existing building.
ia
svvi C
C AF = [A-1]
where:
AFvi = Attenuation factor between soil vapor and indoor air, unitless Csv = Concentration in soil vapor medium, ug/m3 Cia = Concentration in indoor air, ug/m3
Once the attenuation factor has been determined, a soil vapor RBC may be derived from an indoor air RBC by extrapolation as shown in equation A-2.
RBCsv = RBCair * AFvi
[A-2]
where:
RBCsv = Risk-based concentration in soil vapor medium, ug/m3 RBCair = Risk-based concentration in air medium, ug/m3 AFvi = Attenuation Factor (unitless)
The appropriate air RBC is based on the exposure scenario at the site under investigation. It may be residential, urban residential or occupational.

Guidance for Assessing and Remediating Vapor Intrusion in Buildings
Page A-4
A 2. Attenuation Factors for Chlorinated Compounds
US EPA provides a preliminary evaluation of attenuation factors in the documentation provided with the database (US EPA 2008b). They considered data quality, spatial and temporal variability, and how background concentrations in indoor air influence attenuation factors. They also provided statistical summaries of attenuation factors from each of the subsurface media to indoor air. Significant conclusions by US EPA included the following:
• The influence of background sources of VOCs in indoor air on the calculated attenuation factors was apparent and should be considered;
• The range of variability in attenuation factors span several orders of magnitude, and thus sampling to appropriately represent subsurface vapor sources is recommended; and
• Distributions of attenuation factors are generally consistent with the conceptual model of vapor intrusion.
US EPA presents the median attenuation factors for soil and sub-slab vapor as 100 and 200, respectively (US EPA 2008b, page 12). Given the high variability in the database, these values are essentially the same. Because, as noted by US EPA, many of these values are under the influence of background sources in indoor air, and overall variability is high, DEQ performed additional analysis and interpretation to select appropriate generic attenuation factors and account for the influence of confounding sources of VOCs in indoor air.
A 2.1. EPA Database Derived Sub-Slab Vapor Attenuation Factors To consider attenuation from sub-slab vapor DEQ extracted all sub-slab data, and associated attenuation factors from the US EPA database for chlorinated compounds, and calculated summary statistics. Because of the high variability, it was necessary to plot these data on logarithmic scales. These data are shown below.

Guidance for Assessing and Remediating Vapor Intrusion in Buildings
Page A-5
Figure A-3: Attenuation Factor vs. Sub-Slab Vapor
As described by US EPA, attenuation factors were highly variable, spanning several orders of magnitude. Of the media represented in the database, the sub-slab vapor attenuation factors are the least variable, with most values ranging over only two orders of magnitude as shown in Figure A-3. Figure A-3 also demonstrates the influence of background sources in indoor air on the attenuation factors. If concentration of vapor in indoor air was attributable solely to advection from the subsurface medium, Figure A-3 would be expected to appear as a horizontal line across the chart, since advection should be independent of subsurface concentration.
Visually, Figure A-3 does not obviously show the flattening effect at and above an attenuation factor of 1,000, although it is present based on the high density of data points in this region of the figure. The diminished visual flattening effect may be attributable to relatively fewer data points in the higher sub-slab vapor concentration range. Macdonald and Wertz (2007) show the flattening effect clearly in their published figures.
The theoretical basis for this effect can be shown in equation A-3.
+
=
QbQss
CssCcs
1 Cindoor
Css [A-3]
where:
Css = Sub-slab soil vapor concentration Cindoor = Indoor air vapor concentration Ccs = Confounding VOC vapor sources Qss = Sub-slab soil vapor flow into the building QB = Net flow rate of air into and out of the building
1,000
,000
100,0
00
10,00
01,0
001001010.10.0
1
100,000
10,000
1,000
100
10
1
0.1
0.01
Subslab vapor (ug/m3)
Att
enua
tion
Fac
tor
Attenuation Factor vs. Subslab Vapor
Average 35210th 68025th 22250th 3375th 3.290th 1.1Percentile AF Value

Guidance for Assessing and Remediating Vapor Intrusion in Buildings
Page A-6
As shown by equation A-3, theoretical attenuation is a function of both flow rates and subsurface or confounding sources. When sub-slab concentration reaches a sufficiently high level, then advection becomes the dominant mechanism governing vapor attenuation, which remains relatively constant. Thus, the empirical data shown in Figure A-3 appear to confirm the theoretical relationship in equation A-3. Both suggest that for sub-slab vapor the zone of attenuation between 100 and 1,000 is where the influence of background confounding sources recedes and advection begins to dominate.
A.2.2 Literature-Derived Sub-Slab Attenuation Factors Data presented by Macdonald and Wertz (2007) provide a relevant point of reference, since it includes some of the same data included in the US EPA database and considers the influence of background concentrations in the data set. Conclusions from this case study found that the ratios of sub-slab soil gas to indoor air were typically greater than 100 to 1. In order to determine what attenuation might be, absent the influence of a confounding source in indoor air, Macdonald and Wertz sorted the data into low and high range groups by applying a factor of 100 to an estimate of the 75th percentile background concentration. Sub-slab values that exceeded this level were assigned to a high concentration subset. Macdonald and Wertz report for residential sites in the high range group attenuation factors range from a 10th to 90th percentiles10 of 120 to 1,000 with a 50th percentile of 350. Therefore, that published case study identifies the critical attenuation range of interest approximately between 100 and 1,000.
By comparison to the overall EPA database, the 10th and 25th percentile values reported by Macdonald and Wertz for their high range data (120 and 190) are comparable to the median values for soil gas and sub-slab vapor, respectively, reported by US EPA (US EPA 2008b, page 12). Because these median values include the entire US EPA data set, including values at the low end of the concentration range, it is likely that values in this percentile range are under the influence of confounding VOC sources, as can be seen by inspection of Figure A-3.
A.2.3 Consideration of Confounding VOC Sources To further consider the influence of confounding VOC sources on attenuation factors, DEQ extracted the high concentration range data for separate analysis. Rather than use a multiplier on the estimate of background, as done by MacDonald and Wertz, we selected sub-slab data with concentrations of 1,000 µg/m3 as a separation point, since based on visual inspection of Figures A-3 and A-4, this appears to be a location where most of the associated attenuation factors would be less affected by confounding sources in indoor air. Figure A-4 displays this subset of the data.
10 In this appendix the percentiles are inverted relative to what was reported by MacDonald and Wertz, 2007. This was done so that high percentiles (e.g., 75th to 90th) correspond to more conservative (i.e., lower) attenuation factors that reflect less attenuation. Higher percentiles are often used to represent “upper-bound” exposure factors and this presentation may be more intuitive to many readers.

Guidance for Assessing and Remediating Vapor Intrusion in Buildings
Page A-7
1,000,000100,00010,0001,000
100,000
10,000
1,000
100
10
Subslab Vapor Concentrations >1,000 ug/m3
Att
enua
tion
Fac
tor
Attenuation vs. Subslab (High Range Vapor)
Average 1,55810th 3,32425th 1,34850th 51675th 19690th 125Percentile AF Value
Figure A-4: Attenuation vs. Sub-Slab (High Range Vapor)
Figure A-4 illustrates that even for this relatively high concentration range subset of the data, attenuation results are quite variable. Summary statistics are quite similar to those published by Macdonald and Wertz 2007, with the 90th and 75th percentiles in the same range as median values reported by US EPA for soil and sub-slab vapor. The 50th percentile value of 516 is approximately the mid-point of the attenuation range of interest between 100 and 1,000.
A.2.4 Selection of a reference percentile When selecting which percentile should serve as a point of reference for determining attenuation to derive generic soil vapor RBCs, the factors considered included:
1. Regulatory management goals, given the high variability observed; and, 2. Range of influence of confounding VOC sources in indoor air.
Both sub-slab vapor concentration and the attenuation factors themselves appear to be lognormally distributed, therefore, all the plots in this appendix are logarithmically transformed. The best estimator of central tendency for lognormal distributions is a geometric mean or median value. Selection of this value would represent the attenuation that would be interpreted as most likely to occur. Approximately one-half of the sites might be expected to have greater attenuation and one half less. In order to ensure a confident decision making, DEQ selected the 75th percentile of the data as our target for an attenuation factor. This ensures that is unlikely that attenuation will be under-predicted at most sites for a screening level evaluation.
A.2.5 Summary and Recommendations • US EPA 2008 reports attenuation factors are extremely variable, and median values from the
entire database from sub-slab vapor and soil vapor are 200 and 100, respectively.

Guidance for Assessing and Remediating Vapor Intrusion in Buildings
Page A-8
• Based on theoretical relationships, and supported by empirical data, attenuation values at and below approximately 100 are strongly influenced by confounding VOC sources in indoor air.
• The attenuation factors appear log-normally distributed, and high percentiles extend into the range influenced by background sources in indoor air.
• A target of the 75th percentile was selected to ensure confidence in decision making in screening level evaluations; the 75th percentile value from Figure A-4 is 196. Similarly, the 25th percentile value from Macdonald and Wertz (2007) from residential sites was 190.
Based on the foregoing considerations, DEQ extrapolates from the 75th percentile estimate in Figure A-4, and rounding to a single significant digit, DEQ selects 200 as a generic attenuation factor for VOCs at residential properties.
A.2.6 Occupational Attenuation Factors As previously described, the US EPA database consists primarily of residential sites, and thus, it is more difficult to make conclusions about commercial or industrial properties on this basis. Nevertheless, DEQ extracted all chlorinated solvent data and attenuation factors for properties not identified as residential from the database. We screened for vapor concentrations exceeding 1,000 ug/m3 to screen out influence of background VOC sources, and plotted the data in Figure A-5. Because this data is quite limited, it is difficult to infer definitive differences between commercial and residential buildings on this basis alone. However, the data are consistent with the concept that attenuation in commercial buildings is somewhat higher than in residential buildings (Figure A-5).
Cases studies are available comparing model results with empirical indoor air data for commercial buildings. While case studies cannot be readily generalized to the universe of properties, they can provide an indication of likely differences. For example (Lawless and Wozniak. 2004 and Berry-Spark et al. 2004) found that, with the HVAC system operating, the Johnson and Ettinger model-derived attenuation factors were generally within an order of magnitude, or within the range, of the observed attenuation factors. Thus, there are at least some cases suggesting that the Johnson and Ettinger model can estimate indoor air concentrations at large commercial buildings when model assumptions that incorporate site specific parameters, such as the air exchange rates are included.
Because increased air exchange rates result in a greater attenuation of VOCs in indoor air, and many industrial and commercial buildings have HVAC systems that increase these exchange rates, it is reasonable to infer a greater degree of attenuation at these types of properties. Furthermore, this concept is consistent with the limited available data (Figure A-5). In consideration of these factors, DEQ has elected to use a factor of 1,000 to represent attenuation in commercial buildings.
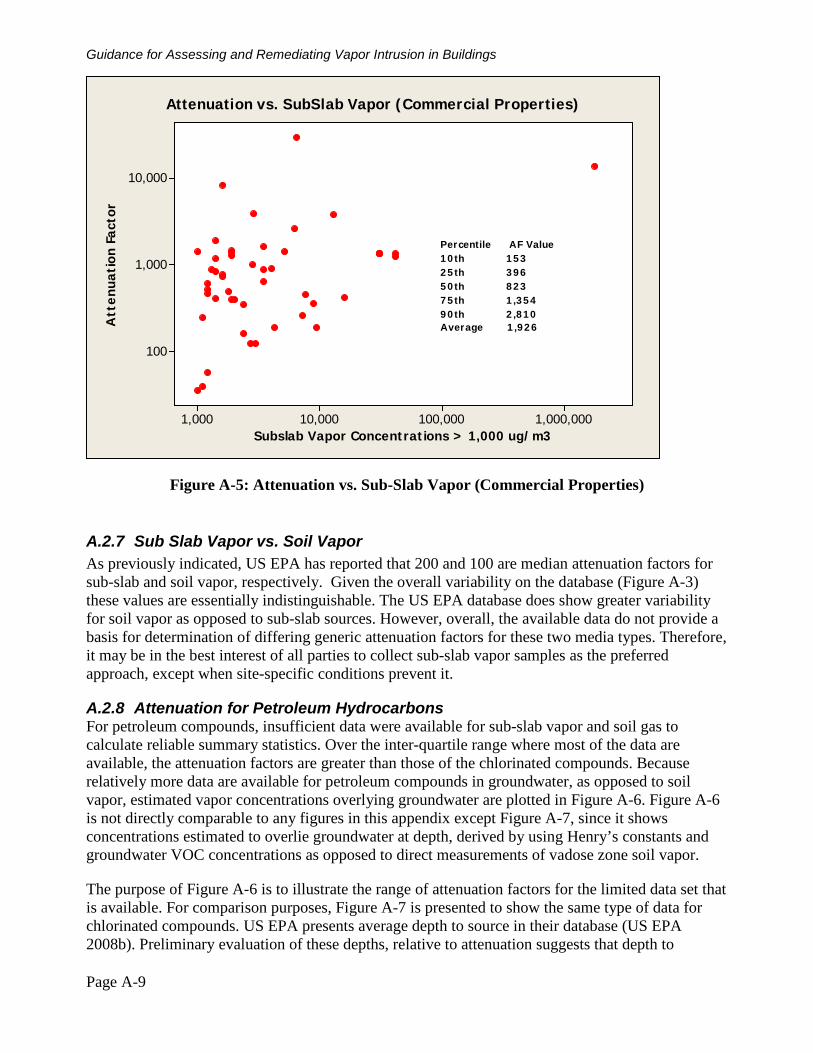
Guidance for Assessing and Remediating Vapor Intrusion in Buildings
Page A-9
1,000,000100,00010,0001,000
10,000
1,000
100
Subslab Vapor Concentrations > 1,000 ug/m3
Att
enua
tion
Fac
tor
Attenuation vs. SubSlab Vapor (Commercial Properties)
Average 1,92690th 2,81075th 1,35450th 82325th 39610th 153Percentile AF Value
Figure A-5: Attenuation vs. Sub-Slab Vapor (Commercial Properties)
A.2.7 Sub Slab Vapor vs. Soil Vapor As previously indicated, US EPA has reported that 200 and 100 are median attenuation factors for sub-slab and soil vapor, respectively. Given the overall variability on the database (Figure A-3) these values are essentially indistinguishable. The US EPA database does show greater variability for soil vapor as opposed to sub-slab sources. However, overall, the available data do not provide a basis for determination of differing generic attenuation factors for these two media types. Therefore, it may be in the best interest of all parties to collect sub-slab vapor samples as the preferred approach, except when site-specific conditions prevent it.
A.2.8 Attenuation for Petroleum Hydrocarbons For petroleum compounds, insufficient data were available for sub-slab vapor and soil gas to calculate reliable summary statistics. Over the inter-quartile range where most of the data are available, the attenuation factors are greater than those of the chlorinated compounds. Because relatively more data are available for petroleum compounds in groundwater, as opposed to soil vapor, estimated vapor concentrations overlying groundwater are plotted in Figure A-6. Figure A-6 is not directly comparable to any figures in this appendix except Figure A-7, since it shows concentrations estimated to overlie groundwater at depth, derived by using Henry’s constants and groundwater VOC concentrations as opposed to direct measurements of vadose zone soil vapor.
The purpose of Figure A-6 is to illustrate the range of attenuation factors for the limited data set that is available. For comparison purposes, Figure A-7 is presented to show the same type of data for chlorinated compounds. US EPA presents average depth to source in their database (US EPA 2008b). Preliminary evaluation of these depths, relative to attenuation suggests that depth to

Guidance for Assessing and Remediating Vapor Intrusion in Buildings
Page A-10
groundwater is a significant factor, with attenuation increasing with depth (data not shown). No attempt was made in this appendix to adjust for depth to groundwater or other factors. It is recommended that soil vapor data from the relevant shallow interval be used for risk evaluation, while deeper vapor samples could be used to assess attenuation from depth.
While the limited data set for petroleum compounds is not adequate to be conclusive, a comparison of figures A-6 and A-7 suggests that attenuation for petroleum compounds is highly variable but may be a factor of 10 to perhaps as much as a factor of 100 greater than that estimated for chlorinated compounds. This observation is consistent with what is known about biodegradation of petroleum hydrocarbons in the subsurface- particularly in an aerobic vadose zone. For example, literature reports suggest that attenuation for petroleum compounds is increased by a factor of 10 or more based on biodegradation between the source and receptor locations (Fisher et. al. 1996; Davis 2006; Sanders and Hers 2006).
Sub-slab vapor samples reflect the influence of biodegradation that has occurred in the subsurface from the source area to sampled location beneath a building slab, and advection into indoor air space is presumed to be the mechanism for transport from the sub-slab into a building. Insufficient information is available to allow DEQ to develop a generic attenuation factor specific to petroleum compounds in sub-slab vapor, separate from the factors used for chlorinated compounds. DEQ will use the same generic attenuation factors for both chlorinated VOCs and petroleum products of 200 for residential properties and 1,000 for commercial properties. Site-specific conditions (e.g., source located at depth under a clean oxic vadose zone) may result in greater levels of attenuation. This possibility will be left for site-specific investigations, as appropriate.
10,000,0001,000,000100,00010,000
1,000,000
100,000
10,000
1,000
100
Petroluem Vapor Concentration (ug/m3)
Att
enua
tion
Fac
tor
Attenuation vs. Petroleum Vapor Overlying Groundwater
Average 253,64310th 729,50125th 277,76150th 77,16075th 25,67190th 2,136Percentile AF Value
interquartile range.277,000 to illustrate theapproximately 26,000 andReference lines set at
Figure A-6: Attenuation vs. Petroleum Vapor Overlying Groundwater

Guidance for Assessing and Remediating Vapor Intrusion in Buildings
Page A-11
10,000,0001,000,000100,00010,0001,00010010
10,000,000
1,000,000
100,000
10,000
1,000
100
10
Chlorinated Vapor Concentration (ug/m3)
Att
enua
tion
Fac
tor
Attenuation vs. Chlorinated Vapor Overlying Groundwater
Average 140,88610th 98,25425th 37,40950th 10,91275th 3,13390th 899Percentile AF Value
interquartile range.37,000 to illustrate theapproximately 3,000 andReference lines set at
Figure A-7: Chlorinated Vapor Overlying Groundwater

Appendix B: Heating Oil Tank Program Guidance for Assessing and Remediating Vapor Intrusion in Residential Buildings

Page B-1
B.1 Introduction
The Oregon Department of Environmental Quality’s Heating Oil Tank (HOT) Program has developed this specific guidance for assessing the risk associated with the Vapor Intrusion (VI) into indoor air pathway for HOT sites. Assessing the VI risk associated with HOT sites is unique and different from many Cleanup and Leaking Underground Storage Tank Program sites in that:
• The product characteristics are well known and less volatile than gasoline or solvents. • The depth and pattern of the typical HOT release is well known, and generally extends
under only a portion of the building foundation. • The source of contamination (the leaking HOT) is frequently located immediately adjacent
to the foundation of the residence or habitable structure. • Due to the proximity of the source of contamination to the home foundation, excavation of
source material is not always feasible without jeopardizing the structural integrity of the building.
• Many residential lots, particularly in the Portland metropolitan area, are no more than 50 feet wide making access difficult for excavation of contaminated source material.
B.2 Variations from Vapor Intrusion Guidance
In order to address the issues frequently encountered at HOT cleanup sites, the following guidance has been developed to assess the VI risk associated with remaining levels of contaminants in the subsurface. This HOT VI guidance should be used as a supplement to the VI Guidance presented in the main body of this document. A checklist is presented at the end of this Appendix and should be submitted with certified reports that involve soil gas and/or indoor air sampling. Variations from the guidance, specific to the HOT Program, are outlined below:
Sections 1 and 2: As presented in the VI Guidance, a VI pathway assessment will be necessary if an assessment or abatement action identifies a release of a contaminant at a facility at concentrations that exceed DEQ generic RBCs for soil or groundwater (Section 2.0).
Follow the steps outlined in sections one and two of the VI assessment process, with the exception of step 5 in Section 2.1 of the flowchart, when assessing the risk associated with the VI pathway at a HOT site. Step 5 of the flow chart, regarding “hot spot” criteria is addressed through the requirement for the removal of free product to the maximum extent practicable per OAR 340-122-0235.
Step nine refers to the completion of an FS, or feasibility study for a Remedial Action, or an EE/CA or Engineering Evaluation/Cost Analysis for a Removal Action. If contaminated soil was removed to the maximum extent practicable prior to conducting vapor sampling at the site, then an engineering control, possibly combined with an institutional control, may be required for the site if soil vapor and/or indoor air levels exceed applicable RBCs. Consult with a DEQ HOT Program representative prior to the installation of any engineering controls (vapor barrier or sub-slab depressurization system for example) or filing an institutional control.
Section 3: 3.1.1 -For the purposes of assessing the VI risk at HOT sites, the investigation area includes any
Guidance for Assessing and Remediating Vapor Intrusion in Buildings
Page B-2
structure within 30 feet of the contaminant plume. These parameters vary from Section 3.1.1 of the VI guidance, which requires assessing all structures within 100 feet of the contaminant plume. For the majority of residential HOT VI assessments, properly installed and leak tested temporary soil gas sampling points will be adequate to characterize the site.
3.1.2-Depending on the extent of soil and/or groundwater impact, the size of the habitable structures, the highest remaining concentrations of contaminants, and other site-specific factors, the number of HOT soil gas sampling points may vary from the VI guidance. In some circumstances, collecting one soil gas sample may be appropriate to determine compliance.
If one soil gas sample is to be collected, the sample should be collected between the center of the home and the edge of the contaminant plume. For instance, if the footprint of the home is 50 feet wide and the contaminant plume is located immediately adjacent to the structure with a lateral extent of 5 feet beneath the home, the soil gas sample should be collected 10 feet from the center of the home and 10 from the edge of the contaminant plume (see Figure B-1, below).
Figure B- 1: Single Sampling Point for HOT Site If an offsite residence or commercial structure is located within 30 feet of the contaminant plume, then a soil gas sample must also be collected either on the property line between the source area and the offsite structure, or as close as possible to the foundation of the offsite structure. Depending on site conditions, more than one soil gas sample may need to be collected from the site. Deviations from the sampling protocol may be required for the following situations: 1) a deep contaminant plume or 2) a shallow contaminant plume that does not extend beyond the vertical depth of the basement slab.
Follow the directions for appropriate sample depths, purge volumes, leak detection, and sample collection techniques, as provided in the main body of this VI guidance, and provide documentation for all samples collected at your site. Please contact DEQ’s HOT Program (1-800-742-7878 or [email protected]) with any questions you have regarding site-specific conditions or sampling approach.
5 feet
Property Line
Residence
Center of Home
50 feet
Collect Soil Gas Sample Here
25 feet
HOT and Contaminant Plume
10 feet 10 feet

Guidance for Assessing and Remediating Vapor Intrusion in Buildings
Page B-3
3.2.3 – 3.2.4 – For habitable structures that have a crawlspace under the entire footprint of the structure, air samples may be collected from the crawlspace provided that the following conditions are met:
• The crawlspace area must be sealed off completely for a minimum of 3 days prior to collecting the sample in the crawlspace.
• An upgradient background sample must be collected in conjunction with the crawlspace air sample and, if appropriate, a pre-sampling questionnaire be completed (as per VI guidance).
• The detection limit for the contaminant(s) of concern is at or below appropriate RBCs for indoor air. No attenuation factor is allowed for ambient air in the crawlspace so the air concentration detected in the sample collected from the crawlspace is the air concentration that is presumed to be present in the living space of the structure. Due to the potential for ambient concentrations of COC being present above RBCs, the HOT Program encourages five foot depth soil gas sample collection at the location(s) discussed in Section 3.1.2 for crawlspace dwellings.
B.3 Heating Oil Tank Vapor Intrusion Case Study
Site Setting: The site consisted of a residential property located in an urban setting. The residential lot was approximately 0.12 acres and surrounded by residential, urban residential and commercial properties. There are no habitable structures, besides the site residence, within 30 feet of the contaminant plume. The residence had approximately 2,012 ft2 of habitable space within three floors of living area. A crawlspace and basement are present in equal square footage beneath the residence.
Site History: A below ground HOT was decommissioned by removal in 2006. A release of heating oil to subsurface soils and shallow groundwater was documented during decommissioning activities. Approximately 10.5 tons of soil was removed from the HOT source area with approximately 353 yd3 of contaminated soil remaining in the source area. The lateral extent of remaining soil contamination was approximately 60 feet in diameter on the long axis and approximately 40 feet in diameter on the short axis.
Conceptual Site Model: Site assessment sampling indicated that elevated levels of total petroleum hydrocarbon, diesel (TPH-Dx), volatile organic compounds (VOCs), and polycyclic aromatic hydrocarbons (PAHs) were present in subsurface soils and groundwater. Therefore, the VI pathway from soil and/or groundwater contamination was evaluated for current and future residential receptors at the site.
Groundwater: Groundwater was present at approximately 15’ below the ground surface. Although groundwater sampling conducted at the site showed elevated levels of VOCs and PAHs, all concentrations of these contaminants were below applicable generic RBCs for all exposure pathways of concern. Applying Step 1 in Figure 1, contaminants in groundwater do not exceed RBCs for residential receptors. Soil: Site assessment soil sampling documented elevated levels of total petroleum hydrocarbon, diesel (TPH-Dx) up to 18,300 ppm remaining on the property. Corresponding constituent analysis showed benzene at 0.24 ppm and ethylbenzene at 15.6 ppm.

Guidance for Assessing and Remediating Vapor Intrusion in Buildings
Page B-4
The following contaminant concentrations were documented in the soil sample collected from the presumed highest level of remaining contamination at the site:
Table B- 1 Soil (mg/kg)
Constituent Exposure Point Concentration
Residential RBCs11
Benzene 0.24 0.080 Ethylbenzene 15.6 0.82 TPH-Dx 18,300 >Max12
Applying Step 2 of the VI flowchart (Figure 2), the TPH constituent concentration for benzene and ethylbenzene exceeds the generic RBC for the VI pathway to indoor air thereby triggering a soil gas investigation (Step 3 in Figure 2) or additional remediation. Soil Gas: Due to the extent of the subsurface contamination, temporary soil gas points were installed to a depth of five feet below the ground surface at three locations at the site. An ambient air sample was collected up-wind of the source area and in the crawlspace of the home. As benzene and ethylbenzene were the only contaminants present in soil above the generic RBCs for the VI indoor air pathway, they were sampled at the site. Although the soil RBC for TPH-Dx for the VI pathway is >MAX, TPH-Dx was analyzed in soil gas and ambient air samples due to the extent of remaining petroleum contaminated soil. Soil Gas-1 was located immediately adjacent to the source area and the residence. Soil Gas- 2 was located approximately 20 feet downgradient of the source area, still within the contaminant plume, immediately adjacent to the foundation of the residence. Soil Gas-3 was located approximately 35 feet downgradient of the source area, on the edge of the contaminant plume. The following concentrations were documented in soil gas samples:
Table B- 2 Sampling Results Screening Levels Soil Gas-
1 (ug/m3) Soil Gas-2 (ug/m3)
Soil Gas-3 (ug/m3)
Crawlspace (ug/m3)
Outdoor Ambient (ug/m3)
Residential RBC – soil gas (ug/m3)
Residential RBC –air inhalation (ug/m3)
Benzene 2,400 0.48 0.40 1.4 0.47 62 0.31 Ethylbenzene 210 150 110 1.3 0.98 190 0.97 TPH-Dx 520,000 nd nd nd nd 26000 130
nd = Analyte not detected Applying Step 4 of the VI flowchart, the contaminants of concern were present above generic RBCs in soil gas and ambient air crawlspace sample locations. Step 5 of the flow chart was addressed by the requirement for the removal of free product to the maximum extent practicable as per OAR 340-122-0235. Steps 6 and 7 of the VI flowchart were addressed with the ambient air sample collected from the crawlspace of the home during the soil gas sampling event. Contaminant concentrations from the crawlspace sample were found to be above indoor air RBCs for the VI pathway for benzene and ethylbenzene, and above ambient background concentrations as measured upwind of the site. 11 RBCs - The Volatilization to Air Exposure Pathway RBC as presented in Table 2.4 of DEQ 2003. 12 >Max – The constituent RBC for this pathway is greater than 100,000 mg/kg. The Department believes it is highly unlikely that such concentrations will ever be encountered.
Guidance for Assessing and Remediating Vapor Intrusion in Buildings
Page B-5
In lieu of additional sampling, the responsible party submitted plans for an engineering control to mitigate the VI risk to indoor air at this site. The suggested control was an active radon mitigation system along with a vapor barrier in the crawlspace. The engineering control plans were stamped by a professional engineer, as required by Oregon Revised Statute 627.002 et seq., and submitted for DEQ review and approval. Due to the extent of remaining soil contamination (353 yd3) and the remaining levels of contaminants present in the subsurface, a deed restriction was required for the property to ensure the proper operation and maintenance of the engineering controls. The deed restriction can be removed once contaminant levels drop below the RBCs.

Guidance for Assessing and Remediating Vapor Intrusion in Buildings
Page B-6
HOT Program Vapor Intrusion Checklist
Please check all that are applicable to your site and submit with certification report
Soil Gas/Sub-Slab Sampling
Appropriate sample location(s) o ½ way between center of home and edge of contaminant plume o If offsite residence within 30 feet of edge of contaminant plume, between
contaminant plume and offsite residence Sampling method and analysis appropriate for site?
o TO-15 - BTEX o Modified TO-15 Low for Naphthalene, BTEX o TO-17 for TPH-Dx, BTEX, and Naphthalene o Other (please
explain)_________________________________________________________________________________________________________________
Appropriate sample container (check all applicable) o Summa Canister (TO-15, Modified TO-15 low, etc) o Sorbent Tube (TO-17)
Appropriate tubing? o PEEK™ o Teflon® o Stainless Steel o Other (please
explain)_____________________________________________________ Appropriate sample depth(s)?
o Sub-Slab (basement or slab-on-grade construction): just below slab (usually no more than six inches)
o Soil Gas: Five feet below the ground surface Appropriate seal for soil gas borehole and/or sub-slab sampling point
o Indicate type of seal used:______________________________ Appropriate equilibration time allowed? (Minimum of 30 minutes from when the probe is
installed and when purge, leak check, and sampling is conducted). Appropriate purging prior to sample collection?
o Minimum of two purge volumes o Indicate how sample train was
purged:_____________________________________________________ Appropriate flow rate?
o Less than 200 mL/minute for TO-15 o Low flow vacuum pump set at 50 ml/minute for TO-17 analysis
Appropriate leak detection? If using 2-Propanol, no more than 10% leak allowed. o Type of leak detection used:___________________________________________
Appropriate sample time and volume?

Guidance for Assessing and Remediating Vapor Intrusion in Buildings
Page B-7
Vapor Intrusion Checklist (continued)
o TO-15, appropriate starting and ending pressure (usually a drop of 20 mm Hg) o TO-17, usually 500 mL of air required to pass over sampling media for appropriate
detection limits
Indoor Air Sampling (this includes air samples collected from the crawlspace of a residence)
Indoor Air Questionnaire completed? (Appendix G of the ITRC Vapor Intrusion Guidance Document presents an example: http://www.itrcweb.org/Documents/VI-1.pdf)
Appropriate sampling method and analysis? Appropriate indoor air sample collection time (The HOT Program requires indoor air
samples to be collected over a 24 hour period of time)
No attenuation factor is allowed for ambient air samples collected from the crawlspace of a habitable structure. If conducting air sampling, detection limits must be at or below applicable Inhalation RBCs.

Appendix C: Industrial Case Studies

C.1: Case Study 1
Petroleum Release from Underground Storage Tank Site Setting: The subject property is currently used for occupational purposes and is located in an urban neighborhood of mixed residential and commercial development. The two closest properties within the block are a multi-story commercial building to the southeast, and a single-family residence to the south and west. Surrounding blocks include commercial facilities toward the north, east, and west. The area to the south is outside the bounds of delineation and the risk-based evaluation for this cleanup. The current and future receptors for this site are residents and occupational workers, since the known plume is within 100 feet of commercial and residential structures.
Site History: A gasoline tank was decommissioned by removal on the industrial part of the site, and a release was documented from piping at the bottom of the tank.
Conceptual Site Model: Subsurface investigation revealed significant concentrations of gasoline, which posed a potential exposure risk from soil and groundwater to nearby current and future residents, current and future occupational workers; and soil exposure to future construction and excavation workers.
Groundwater: A groundwater investigation was completed via sampling of temporary well points and three permanent monitoring wells. Groundwater is about 38-43 feet below ground surface (bgs), hence the groundwater exposure pathway was not included in the excavation scenario.
Table C- 1
Groundwater Concentrations µg/L Constituent Exposure Point
Concentration Residential RBCwi
13 Occupational RBCwi
Benzene 3,750 190 2,800
Ethylbenzene 1,650 490 7,400
Applying Step 1 in the decision point flowchart in Figure 1, page 4 of this document, petroleum constituent concentrations in groundwater exceed benzene risk-based concentrations (RBCs) for residents and for occupational workers, and the ethylbenzene RBC for residents.
Soil: Soil sampling results are summarized in Table C-2, below.
Table C- 2 Soil Concentrations mg/Kg Constituent Exposure Point
Concentration Residential RBCsi
Occupational RBCsi
Benzene 28 0.080 1.2
Ethylbenzene 92 0.82 12
1,2,4 trimethylbenzene 285 82 1,000
TPH 6,900 140 so=80,000; si=>MAX
13 Risk-Based Concentration for vapor intrusion from groundwater

Guidance for Assessing and Remediating Vapor Intrusion in Buildings
Page C-2
Applying Step 2 of the decision point flowchart in Figure 1, petroleum constituent concentrations exceed RBCs for both receptor groups for benzene, ethylbenzene, and 1,2,4-timethylbenzene RBC for residents. TPH also exceeds the generic gasoline RBC for residential exposure.
From the results of the investigations, soil and groundwater concentrations exceed RBCs triggering the soil gas investigation in step 3 in Figure 1.
Soil Gas: Temporary soil gas points were installed on the industrial and adjacent residential properties. Samples were collect at shallow and intermediate depths on the industrial property and at shallow depth on the residential property. Three quarterly sampling events were conducted. In intermediate samples, up to 12,000,000 micrograms/meter cubed (µg/m3) of TPH-Gx were detected (RBCs: 142,000 µg/m3 and 2,800,000 µg/m3). In the shallow samples up to 2,300,000 µg/m3 of TPH-G were detected, also. The overall shallow sampling results exhibited much lower concentrations than intermediate ranging between 8,800 ug/m3 and the 2,300,000 ug/m3. Results on the adjacent residence (shallow soil gas point, only) were below DEQ screening levels (TPH-Gx ranged between 360 ug/m3 & 550 ug/m3 and benzene ranged between 2.8 ug/m3 & 3.6 ug/m3).
Table C- 3 Vapor Sampling µg/m3 Constituent Residential
Exposure Point Concentration
Occupational Exposure Point Concentration
Residential RBC si
Occupational RBCsi
Shallow Shallow Intermediate Benzene 3.6 98,000 250,000 62 1,600
Ethylbenzene 13 <500 <4,700 190 4,900
Xylenes 88 7,200 <4,700 21,000 440,000
1,2,4 trimethylbenzene 42 <560 <5,300 1,500 31,000
TPH-Gx 550 2,300,000 12,000,000 142,000 2,800,000
Proceeding to Step 4 in Figure 1, results on the industrial property indicated concentrations exceed DEQ soil gas screening levels for TPH. Results on the adjacent residential property were below DEQ screening levels. Permanent soil gas points, clustered shallow and intermediate, were installed on the industrial property.
Step 5 in figure 1, the high concentrations of TPH on the industrial property indicates the presence of free product. Free product gasoline meets the definition of hot spot in OAR 340-122-0115(32)(b). Oregon Administrative Rule 340-122-0217(1)(b)requires that any free product be removed to the maximum extent practicable. Free product removal was initiated to addresses the statutory preference for treatment of hot spots (OAR 465.315(d)(E).
From this point forward, the Responsible Party has the option to go directly to remedial actions (step 9) or complete further investigations. Similar chemicals were in use in the building and indoor air sampling (step 6) was ruled out. Thus, steps 7 and 8 do not apply. A corrective action plan was developed and remedial actions were initiated to complete step 9. A low flow air sparging and vapor extraction system was installed. Additionally, the site is being treated with chemical compound injection events to stimulate enhanced bioremediation.

Guidance for Assessing and Remediating Vapor Intrusion in Buildings
Page C-3
During remedial activities, quarterly soil gas and groundwater monitoring was conducted. Following system shut down, compliance soil, groundwater and vapor sampling continued from existing sampling points and a couple of additional temporary well points to verify contaminant plume reduction. Quarterly compliance soil gas sampling was used to assess concentration rebound effects and determine compliance for the indirect exposure pathways of vapor intrusion into buildings.

Guidance for Assessing and Remediating Vapor Intrusion in Buildings
Page C-4
C.2: Case Study 2
Assessing Risk at a Commercial Building
This case study describes a vapor intrusion pathway study and includes decision-making criteria that should be considered in developing and implementing investigation and cleanup options for a facility with a large locality of facility (LOF).
C.2.1 Background and Site History The VI Facility is in an area of predominately industrial and commercial development, with some urban residential development. The property was developed as a bulk fuel and chemical storage facility in the 1950s/1960s. Operations included product blending, packaging, and storage. Product storage was initially in underground storage tanks (USTs) containing gasoline, diesel, fuel oil, petroleum solvents, ketone solvents, and alcohols. Facility expansion occurred in the 1980s. Product storage was switched to above ground tanks (ASTs) and the USTs were decommissioned. One group of ASTs stored chlorinated solvents, including perchloroethene (PCE), from the 1960s until 1991. The tank farm, now located within a concrete-lined secondary containment system, is still in operation and has 18 tanks ranging in size from 8,000 to 12,000 gallons, storing fuels and non-chlorinated solvents.
C.2.2 Underground Storage Tank Decommissioning The former USTs were decommissioned by removal in 1990 under oversight of DEQ’s Leaking Underground Storage Tank Program. Extensive petroleum and solvent contamination were found in soil during the decommissioning. A large volume of contaminated soil was left in place due to risk of damage to installed transfer piping that would have been undermined. The soil left in place, as well as other locations (floor and walls of excavations), were not adequately characterized for solvent contamination.
C.2.3 Initial Remedial Investigation Work In the mid 2000s, the site entered DEQ’s Voluntary Cleanup Program and initiated a Remedial Investigation/Feasibility Study (RI/FS) with oversight by DEQ’s Environmental Cleanup Program. The RI/FS work included sampling and laboratory analysis of soil, groundwater, and air for petroleum and solvent chemicals released at the site.
Both petroleum hydrocarbon and chlorinated solvent-related constituents have been detected in site soil and groundwater. Soil contamination is limited in lateral extent to the VI Facility property. Groundwater is found at a depth of 60 feet below ground surface (bgs). PCE is the most significant contaminant detected in groundwater. A dissolved-phase plume of PCE extends approximately 1,500 feet downgradient of the VI Facility at levels exceeding DEQ’s risk-based concentration (RBCs) for vapor intrusion (Figure C-1).
Initially, soil gas samples were collected at four on-site and two off-site locations to assess potential vapor intrusion. On-site, PCE levels in soil gas ranged from 26,000 ug/m3 – 640,000 ug/m3, while the two off-site points detected PCE at 100,000 ug/m3 and 1,700,000 ug/m3. The levels detected at four of the six sample locations exceeded 100x the occupational soil gas RBC for PCE of 2,100 ug/m3, thus constituting “hot spots” of contamination and requiring immediate action. In response, removal measures were taken to mitigate vapor intrusion at the most vulnerable buildings.
Concurrent with these actions, an expanded soil gas investigation was implemented to further

Guidance for Assessing and Remediating Vapor Intrusion in Buildings
Page C-5
evaluate the vapor intrusion pathway. As part of the expanded soil gas investigation, a total of 13 permanent soil-gas monitoring wells were installed in grid-like array spaced approximately 75-150 feet apart. Four vapor monitoring wells were installed on the property, while nine wells were installed next to eight separate buildings on adjacent properties. Permanent soil gas monitoring wells were chosen over temporary points, anticipating future sampling events and the need to track remedial system performance and progress. Soil gas monitoring points are illustrated in Figure C-2.
Sampling of vapor monitoring wells on the VI Facility property confirmed the presence of high levels of PCE previously observed in temporary well points. In wells on neighboring properties, PCE was detected at concentrations ranging from 54 ug/m3 to 79,000 ug/m3. Based on these sampling results, the LOF was expanded to the north and west of the VI Facility property. The new wells did not complete the delineation of the LOF, rather it indicated a third phase of investigation would be necessary to define the geographic area with VI problems. The results also indicated vapor levels likely exceeded soil gas RBCs at distances greater than 100 feet from soil and groundwater sources. This suggested that the default assumption of the VI pathway being incomplete beyond 100 feet from contaminant sources is not valid at this site.
Appropriate seal for soil gas borehole and/or sub-slab sampling point, and source strength and depth of contamination are two factors that likely contribute to the high degree of lateral diffusion/advection of vapors observed at the site. Indoor and outdoor air samples from the site were collected concurrent with the soil gas monitoring. Outdoor samples collected at locations outside the known vapor plume were below the detection limit of 0.029 ug/m3- while at two sampling points centrally located within the plume PCE was detected in ambient air at 1.5-1.6 ug/m3. The data suggests that outdoor volatilization is potentially a complete exposure pathway. Onsite, indoor air sampling revealed PCE at 8.6-82 ug/m3 (note: VI in this area was being actively mitigated). In offsite buildings, the levels ranged from 2.8-200 ug/m3(Figure C-2). At 200 ug/m3, the impact to the offsite warehouse located northwest of the facility property is also considered a hot spot of contamination requiring immediate mitigation to protect the health of workers in the building. Elevated PCE levels (>10x RBC) were also detected in indoor air at several other buildings, where mitigation alternatives are being evaluated.
C.2.4 Vapor Control System Installation An interim sub-slab depressurization system was installed to reduce potential risks associated with solvent vapors entering the on-site and adjacent office buildings with elevated PCE concentrations (Box 4 in the decision point in flow chart). Based on the application of DEQ’s Guidance for Managing Hazardous Substance Air Emissions From Remedial Systems (DEQ 2006), the interim system was designed with activated carbon off-gas treatment based on modeling indicating system emissions would pose an unacceptable implementation risk (PCE concentrations in recovered soil vapors ranged from 65,000 ug/m3 to 100,000 ug/m3). The PCE recovery rate for the interim system was approximately 1 lb/day, indicating system operation would require significant carbon usage and associated maintenance and monitoring costs for the interim system. In addition, system monitoring indicated PCE concentrations in recovered vapors was increasing with time. This information, along with the results of the soil gas plume delineation discussed above, were key considerations in additional site characterization for the RI/FS and final remedial strategies for the site.
C.2.5 Finalizing Remedial Investigation and Feasibility Study Based on the large source area on the VI Facility, the interim vapor control system provided only minor control of the vapor intrusion hot spot, requiring development of a more comprehensive

Guidance for Assessing and Remediating Vapor Intrusion in Buildings
Page C-6
remedy for the site (Box 9 of the decision point flow chart in Figure 2). It is anticipated that a large SVE system with components and/or influence extending to offsite properties will be an element of the final remedy to address current and future VI risks. In addition, indoor air monitoring and a more detailed vapor intrusion study for each structure where soil gas is present above soil gas RBC but below hot spot levels would be needed to conclusively determine the extent of off-site vapor controls necessary and the urgency/timing for mitigating a confirmed exposure in the interim period (Boxes 5 & 9 of the decision point flow chart in Figure 2).
At this stage of the project, subsurface sampling has been conducted primarily to define the geographic area with VI concerns (LOF), locate hot spots of contamination and areas requiring remediation, and to identify buildings where indoor air sampling should be conducted. Given the large geographic area occupied by the site, the coarse grid of sample locations is sufficient for these purposes. However, as discussed in the guidance, sample number and density would need to be increased to evaluate risk and demonstrate compliance at individual buildings within the LOF. Factors that were considered in selecting a sampling approach that used a coarse grid of external monitoring points as opposed to intensive subsurface sampling beneath each structure included the following:
• Time to negotiate access for soil gas monitoring beneath each structure; • Time to complete surveys for each structure to identify potential internal sources of TCE
that confound the test results; • Installation and testing of over 50 soil gas wells for at least two events to assess seasonal
effects; • Analytical testing of samples; • Data validation and management, and data reduction for each of the structures; and • The high likelihood that remediation will be conducted to reduce subsurface vapor levels.
The implementation of the work listed above would require significant time and financial resources. The cost for the detailed vapor intrusion investigation was estimated to exceed $500,000 and take approximately 18 months. DEQ and VI Facility owner, therefore, agreed to proceed with completion of the FS for the onsite hot spot (Box 9, Figure 2).
The final remedy is likely to include a robust soil vapor extraction system designed to fully capture vapors throughout the VI Facility and in-situ treatment of groundwater source area on-site. Given the mass of contamination present, the remedy will include treatment of VOC emissions from the remedial system. Performance monitoring for the remedy for the vapor pathway will also include pressure measurements monthly and semi-annual soil gas sampling from the existing soil gas monitoring network.

Guidance for Assessing and Remediating Vapor Intrusion in Buildings
Page C-7
Figure C- 1: Soil and Groundwater Contamination

Guidance for Assessing and Remediating Vapor Intrusion in Buildings
Page C-8
Figure C- 2: Vapor Sampling Locations at Commercial Building

Guidance for Assessing and Remediating Vapor Intrusion in Buildings
Page C-9
C.3: Case Study 3
Assessing Risk at a Commercial Building
This case study describes a hypothetical site where a release of TCE has impacted groundwater beneath a portion of a manufacturing (Box 1 of the decision point flow chart in Figure 2). However, due to the size of the facility and the localized nature of the vapor impacts, it is not clear the conditions represent a significant human health risk to employees working in the building. This case study illustrates how exposure units may be defined and data analysis used, to evaluate potential current and future vapor intrusion risks.
C.3.1 Site Description The structure is approximately 30,000 sq ft and built with a slab-on-grade foundation directly over native soils. Internally, it has been partitioned into manufacturing, storage, and office areas with restrooms. The primary HVAC system services the manufacturing and storage areas, while the office and restrooms are ventilated by separate HVAC systems. Water lines and sanitary sewer lines run beneath the slab and may influence the distribution of vapors. There is no domestic or commercial use of groundwater in the vicinity of the site, and monitoring indicates the TCE soil vapor plume is stable at concentrations exceeding the soil gas RBC of 140 ug/m3
.
C.3.2 Initial Vapor Sampling Based on groundwater data, the presumed source of the TCE is the former vapor degreaser. The initial phase of vapor sampling (VP-1 through VP-5) focused on this area with an additional sample collected near the sanitary sewer line and one within the building but distant from the source (Box 3 of the decision point flow chart in Figure 2). The results of the sampling indicate the occupational soil gas/sub-slab screening level for TCE is exceeded at four of the five sample locations (Box 4 of the decision point flow chart in Figure 2). However, sample PI-5 suggests the area exceeding screening levels may be limited to the northern portion of the building. The limited sampling indicates a potential risk; however, it does not adequately define the area exceeding soil gas screening levels and is insufficient to perform statistical analyses. The building owner could develop a plan to remediate the site or choose to refine the conceptual site model and risk assessment.
C.3.3 Vapor Sampling for Risk Assessment Based on the results of the initial vapor sampling, the site owner decided to conduct a second phase of vapor sampling to refine the conceptual site model and to enable a statistical evaluation of the risk to his employees. For assessing risk, the building has been divided into three exposure units based on internal partitions, building ventilation, and location of utilities. The primary focus of the sampling is the main manufacturing area with additional sampling in other decision units to complete the site characterization. The results of the sampling are presented in Table C-4.

Guidance for Assessing and Remediating Vapor Intrusion in Buildings
Page C-10
C.3.4 Risk Characterization Potential Current Risks The subject building is a commercial structure, and an attenuation factor of 1000 is applied to the sub-slab vapor data to predict exposure point concentrations within the building. A review of Table C-4 shows that acceptable risk levels from exposure to TCE were exceeded in exposure unit 1 based on both a maximum measured concentration and on the 90% UCL on the mean. (Note: Under most circumstances, risks can be evaluated using an estimation of the 90% UCL in lieu of the maximum concentration when eight or more vapor samples have been collected from within the same exposure unit.) The acceptable risk level from exposure to TCE was also exceeded in exposure unit 2 based on the maximum detected concentration of 230 ug/m3, and was not exceeded in exposure unit 3. The acceptable risk level from exposure to PCE was not exceeded in any exposure unit.
Potential Future Risks Future risks must be evaluated based on point-point comparisons of data to the applicable RBC rather than comparing UCLs to RBCs. This is because the location and dimensions of a future building (future exposure units) relative to the occurrence of contamination on the property is unknown.
C.3.5 Further Actions Concentrations exceed soil gas RBCs for TCE but are below the corresponding hot spot threshold of 10,000 ug/m3. The facility needs to conduct indoor air sampling to determine current TCE exposures, and either remediate the contamination, or use engineering controls to mitigate the vapor intrusion risk.

Guidance for Assessing and Remediating Vapor Intrusion in Buildings
Page C-11
Reception
OfficeArea
Semi-enclosed work stations
Vapor Degreaser
Solvent UST
Restrooms
W
W
W
SS
SS
Figure A-1 Sample Locations for 2nd Phase of Sub-slab Vapor Sampling
VP-1
VP-2VP-3
Main Manufacturing Area
Storage Area
40 ft
ss
TCE Plume exceeding 110 ug/l GW RBC
PCE GW Plume exceeding 1300 GW RBC ug/l
(3800, 4900)
(950,1400)(1600, 2100)
(40, 65)VP-4
VP-5(100, 140)
VP-1 Sub-slab Vapor Sample Location (80, 60) TCE, PCE Conc. (ug/m3)
Figure C- 3: Sampling Locations for 1st Phase of Sub-Slab Vapor Sampling

Guidance for Assessing and Remediating Vapor Intrusion in Buildings
Page C-12
hReception
OfficeArea
Semi-enclosed work stations
Vapor Degreaser
Solvent UST
Restrooms
W
W
W
SS
SS
Figure A-2 Sample Locations for 2nd Phase of Sub-slab Vapor Sampling
MM-1 MM-3MM-2
S-1
MM-4MM-5
MM-7
MM-6
MM-8 MM-9
MM-11MM-10
MM-12MM-13
S-2
O-3
O-1
Main Manufacturing Area
Storage Area
40 ft
O-2
ss
RR-1
EU-1
EU-2
EU-3
(3000, 3900)
(1,700, 2,300)
(350, 480)
(1100,, 1,250) (45, 110)
(80, 60)(170, 180)
(30,15 )
(20, 30)
(<10, 25)
(<10, 25)
(<10, 15)
(10, 25)
(90, 230)
(110. 180)
(80, 60)
(70, 380)
(30, 90)
(20, 40)
(80, 60) TCE, PCE Conc. (ug/m3)
Extent of TCE Vapor Plume >100 ug/m3
Extent of PCE Vapor Plume >1900 ug/m3
MM-1 Sub-slab Vapor Sample Location
Figure C- 4: Sample Locations for 2nd Phase of Sub-Slab Vapor Sampling

Guidance for Assessing and Remediating Vapor Intrusion in Buildings
Page C-13
Table C- 4
Phase 2 – Soil Vapor Data Sample
ID Decision
Unit PCE
(ug/m3) TCE
(ug/m3) Sample
ID Decision
Unit PCE
(ug/m3) TCE
(ug/m3) MM-1 1 3900 3,000 MM-10 1 30 20 MM-2 1 1,250 1,100 MM-11 1 25 <10 MM-3 1 110 45 MM-12 1 25 <10 MM-4 1 2,300 1,700 MM-13 1 15 <10 MM-5 1 180 170 O-1 2 230 90 MM-6 1 60 80 O-2 2 180 110 MM-7 1 480 350 O-3 2 60 80 MM-8 1 15 30 SS-1 3 90 40 MM-9 1 25 20 SS-2 3 40 20
Summary Statistics Exposure unit
Minimum (ug/m3)
Maximum (ug/m3)
Mean (ug/m3)
90% UCL (ug/m3)
Soil Gas RBC1 (ug/m3)
Exceeds Acceptable Risk?
1 TCE <10 3900 502 1127 140 Y PCE 15 3000 647 1395 1900 N 2 TCE 80 110 93 N/A 140 Y PCE 60 230 157 N/A 1900 N 3 TCE 20 40 30 N/A 140 N PCE 40 90 65 N/A 1900 N 1 As of the date of guidance development. Consult DEQ’s online table of RBCs for current soil gas screening levels http://www.oregon.gov/deq/tanks/Pages/Risk-Based-Decision-Making.aspx
Appendix D: References and Web Links

Guidance for Assessing and Remediating Vapor Intrusion in Buildings
Page D-1
Abreu, L.D.V. and P.C. Johnson. 2005. Effect of Vapor Source−Building Separation and Building Construction on Soil Vapor Intrusion as Studied with a Three-Dimensional Numerical Model, Environ. Sci. Technol., 39 (12), pp 4550–4561
Berry-Spark, K., T. McAlary, N. Bice, and M. DeFlaun. 2004. Empirical and Modeled Alpha Factors at Two Vapor Intrusion Sites. Presented at the Modeling Vapor Attenuation; Workshop, 20th Annual International Conference on Soils, Sediments and Water, University of Massachusetts at Amherst. October 2004.
Davis, R. 2006. Vapor Attenuation in the subsurface from petroleum hydrocarbon sources; An update and discussion on the ramifications of the vapor intrusion risk pathway. LUSTline Bulletin 52. May 2006.
Dawson, H.E. 2004, Statistical Evaluation of Attenuation Factors at Lowry Air Force Base, CO. Presentation at the US EPA Modeling Vapor Intrusion Workshop, AEHS, Amherst Conference on Contaminated Soils. Amherst, MA.
Dawson, H., E. and T. McAlary. 2009. A compilation of statistics for VOCs from post-1990 indoor air concentration studies in North American residences unaffected by subsurface vapor intrusion. Groundwater Monitoring and Remediation. (29):1 pp.60-69.
DEQ, 2003. Risk-based decision making for the remediation of petroleum contaminated sites. Oregon Department of Environmental Quality, September 22nd 2003. http://www.oregon.gov/deq/tanks/Pages/Risk-Based-Decision-Making.aspx.
DEQ, 2006. Guidance for Managing Hazardous Substance Air Emissions from Remedial Systems. Oregon Department of Environmental Quality, January 2006. http://www.oregon.gov/deq/FilterDocs/GuidanceManageingHazAirDischarge.pdf.
Feenstra, S. 2006. Use of logarithmic scale correlation plots to represent contaminant ratios for evaluation of subsurface environmental data. Environmental Forensics; 7. pp. 175-185.
Fischer, M.L., Bentley, A.J., Dunkin, K.A., Hodgson, A.T., Nazaroff, W.W., Sextro, R.G. and J.M. Daisey. 1996. Factors affecting indoor air concentrations of volatile organic compounds at a site of subsurface gasoline contamination. Environmental Science and Technology, 30 pp. 2948-2957.
Ginevan. M.E. 2007. Statistical tool for ratio data. Chapter 6 in: Introduction to environmental forensics. 2nd. edition. Muphy, B.L. and R.D. Morrison eds. Elsevier
Hayes, H.C., D.J. Benton, and N. Kahn. 2006. Impact of Sampling Media on Soil Gas Measurements. A&WMA “Vapor Intrusion – The Next Great Environmental Challenge – An Update”. September 13 – 15, 2006. Los Angeles, CA. http://www.airtoxics.com/literature/AirToxicsAWMA2006.pdfHiggins, J.J. 2004. Introduction to Modern Nonparametric Statistics. Duxbury Advanced Series. Carolynn Crocket ed. Thompson Brooks/Cole.
ITRC (Interstate Technology & Regulatory Council). 2007. Vapor Intrusion Pathway: A Practical Guideline. VI-1. Washington, D.C.: Interstate Technology & Regulatory Council, Vapor Intrusion Team. www.itrcweb.org.

Guidance for Assessing and Remediating Vapor Intrusion in Buildings
Page D-2
Lawless, C. and A. Wozniak. 2004. Case Study of Modeled and Observed TCE Attenuation from Groundwater to Indoor Air. Presented at the Modeling Vapor Attenuation Workshop, 20th Annual International Conference on Soils, Sediments and Water, University of Massachusetts at Amherst. October 2004.
Macdonald G.J. and W.E. Wertz. 2007. PCE, TCE and TCA vapors in sub-slab soil gas and indoor air: A case study in upstate New York. Groundwater Monitoring and Remediation. (27):4 pp.86-92
Mass DEP. 2002. Indoor Air Sampling and Evaluation Guide. Massachusetts Department of Environmental Protection. April 2002.
Sanders P.F. and I. Hers. 2006. Vapor Intrusion in Homes Over Gasoline Contaminated Groundwater in Stafford, New Jersey. Groundwater Monitoring and Remediation. (26):1 pp.63-72.
US EPA. 1987 -3rd ed. Test Methods for Evaluating Solid Waste, Physical/Chemical Methods also known as SW-846. https://www.epa.gov/hw-sw846.
US EPA. 1999. Compendium of Methods for the Determination of Toxic Organic Compounds in Ambient Air – Second Edition. EPA/625/R-96/010b. National Risk Management Research Laboratory. https://www3.epa.gov/ttnamti1/files/ambient/airtox/tocomp99.pdf.
US EPA 2000. Data Quality Objectives Process for Hazardous Waste Site Investigations. (EPA QA/G-4HW): EPA/ 600/R-00/007. US Environmental Protection Agency, Washington D.C. January 2000. https://www.orau.org/ptp/PTP%20Library/library/EPA/QA/g4.pdf.
US EPA. 2002a. Draft Guidance for Evaluating the Vapor Intrusion to Indoor Air Pathway from Groundwater and Soils (Subsurface Vapor Intrusion Guidance). Office of Solid Waste and Emergency Response. November 2002.
US EPA. 2002b. Calculating Upper Confidence Limits for Exposure Point Concentrations at Hazardous Waste Sites. OSWER 9285.6-10, Office of Solid Waste and Emergency Response. Washington, D.C. https://www.epa.gov/sites/production/files/2016-03/documents/upper-conf-limits.pdf.
US EPA. 2006a. Systematic Planning: A Case Study for Hazardous Waste Site Investigations. US EPA Office of Environmental Information. EPA/240/B-06/004. February 2006. https://www.epa.gov/quality/systematic-planning-case-studies. US EPA. 2006b. Draft Standard Operating Procedure (SOP) for Installation of Sub-Slab Vapor Probes and Sampling Using EPA Method TO-15 to Support Vapor Intrusion Investigations. EPA, Ada, OK.
US EPA. 2007. ProUCL Version 4.00.04 User Guide. EPA/600/R-07/038. U.S. Environmental Protection Agency. Office of Research and Development, Washington DC, April, 2007. https://www.epa.gov/sites/production/files/2015-03/documents/proucl_v4.00.04_tech.pdf.
US EPA. 2008a. Indoor Air Vapor Intrusion Mitigation Approaches. US EPA Engineering Forum Issue Paper. EPA 600-R-08-115, October 2008. https://www.epa.gov/vaporintrusion/indoor-air-vapor-intrusion-mitigation-approaches.
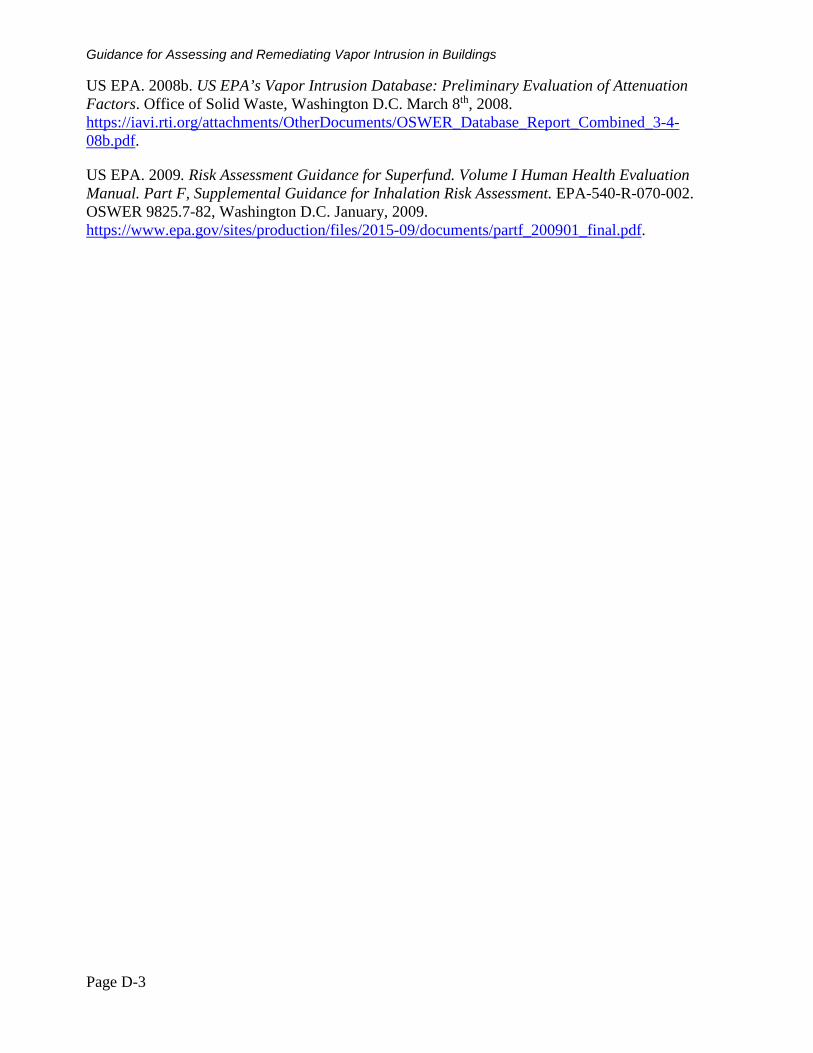
Guidance for Assessing and Remediating Vapor Intrusion in Buildings
Page D-3
US EPA. 2008b. US EPA’s Vapor Intrusion Database: Preliminary Evaluation of Attenuation Factors. Office of Solid Waste, Washington D.C. March 8th, 2008. https://iavi.rti.org/attachments/OtherDocuments/OSWER_Database_Report_Combined_3-4-08b.pdf.
US EPA. 2009. Risk Assessment Guidance for Superfund. Volume I Human Health Evaluation Manual. Part F, Supplemental Guidance for Inhalation Risk Assessment. EPA-540-R-070-002. OSWER 9825.7-82, Washington D.C. January, 2009. https://www.epa.gov/sites/production/files/2015-09/documents/partf_200901_final.pdf.

Guidance for Assessing and Remediating Vapor Intrusion in Buildings
Page E-1
Appendix E: Building Survey Form

Guidance for Assessing and Remediating Vapor Intrusion in Buildings
Page E-1
Complete this form for each building involved in indoor air testing
Preparer’s Name: __________________ Date/Time Prepared: _____________________ Preparer’s Affiliation: ___________________ Work Phone:________________________ Purpose of Investigation: ___________________________________________________ 1. OCCUPANT:
Interviewed: Y/N Last Name:______________________First Name:_________________________ Address:___________________________________________________________ County:___________________________________________________________ Home Phone:____________________ Alternate Phone:____________________ Number of Occupants/persons at this location:____________________________ Age of Occupants:___________________________________________________
2. OWNER OR LANDLORD: (Check if same as occupant_____) Interviewed: Y/N Last Name:_________________________ First Name:______________________ Address:___________________________________________________________ County:___________________________________________________________ Home Phone:______________________ Alternate Phone:__________________

Guidance for Assessing and Remediating Vapor Intrusion in Buildings
Page E-2
3. BUILDING CHARACTERISTICS:
Type of Building: (Circle appropriate response) Residential School Commercial/Multi-use Industrial Church Other:________________________
If the property is residential, type? (Circle appropriate response) Ranch 2-Family 3-Family Raised Ranch Split Level Colonial Cape Cod Contemporary Mobile Home Duplex Apartment House Townhouse/Condos Modular Log Home Other:__________________ If multiple units, how many?________________________________________________ If the property is commercial, type? Business Type(s)____________________________________________________ Does it include residences (i.e., multi-use)? Y/N If yes, how many?________ Other characteristics: Number of floors______________ Building age__________________________ Is the building insulated Y/N? How air tight? Tight / Average / Not Tight
4. AIRFLOW Use air current tubes or tracer smoke to evaluate airflow patterns & qualitatively describe:
Airflow between floors ______________________________________________________________________________________
______________________________________________________________________________________
______________________________________________________________________________________
Airflow near source ______________________________________________________________________________________
______________________________________________________________________________________

Guidance for Assessing and Remediating Vapor Intrusion in Buildings
Page E-3
Outdoor air infiltration ______________________________________________________________________________________
______________________________________________________________________________________
Infiltration into air ducts ______________________________________________________________________________________
______________________________________________________________________________________
5. BASEMENT & CONSTRUCTION CHARACTERISTICS (Circle all that apply) a. Above grade construction: wood frame concrete stone brick b. Basement type: full crawlspace slab other_______ c. Basement floor: concrete dirt stone other_______ d. Basement floor: unsealed sealed covered with _______________________________ e. Concrete floor: unsealed sealed sealed with ________________________________ f. Foundation walls: poured block stone other___________________________________________ g. Foundation walls: unsealed sealed sealed with ______________________ h. The basement is: wet damp dry moldy i. The basement is: finished unfinished partially finished j. Sump present? Y / N k. Water in sump? Y / N not applicable Basement/Lowest level depth below grade:_____________________________(feet) Identify potential soil vapor entry points & approximate size (e.g., cracks, utility ports, drains)

Guidance for Assessing and Remediating Vapor Intrusion in Buildings
Page E-4
________________________________________________________________________ ________________________________________________________________________ 6. HEATING, VENTING & AIR CONDITIONING (Circle all that apply) Type of heating system(s) used in this building: (circle all that apply – note primary) Hot air circulation Heat pump Hot water baseboard Space heaters Steam radiation Radiant floor Electric baseboard Wood stove Outdoor wood boiler Other_____________________________________________________________ The primary type of fuel used is: Natural gas Fuel oil Kerosene Electric Propane Solar Wood Coal Domestic hot water tank fueled by:_____________________________________ Boiler/furnace located in: Basement Outdoors Main Floor Other_______________ Air conditioning: Central air Window units Open windows Heat Pump None Are there air distribution ducts present? Y / N Describe the supply & cold air return ductwork & its condition where visible, including whether there is a cold air return & tightness of duct joints. Indicate the locations on the floor plan diagram.
________________________________________________________________________________________________
________________________________________________________________________________________________
________________________________________________________________________________________________

Guidance for Assessing and Remediating Vapor Intrusion in Buildings
Page E-5
________________________________________________________________________________________________
7. OCCUPANCY
Is basement/lowest lever occupied? Full-time Occasionally Seldom Almost never Level General use of each floor (e.g., familyroom, bedroom, laundry, workshop, storage) Basement:_______________________________________________________________ 1st Floor_________________________________________________________________ 2nd Floor_________________________________________________________________ 3rd Floor_________________________________________________________________ 4th Floor_________________________________________________________________ 8. FACTORS THAT MAY INFLUENCE INDOOR AIR QUALITY a. Is there an attached garage? Y / N b. Does the garage have a separate heating unit? Y / N NA c. Are petroleum-powered machines or vehicles stored in the garage (e.g., lawnmower, ATV, car) Y/N Please specify ______________________________________ d. Has the building ever had a fire? Y / N When___________________ e. Is a kerosene or unvented gas space heater present? Y / N Where & Type?_____________________________________________________ f. Is there a workshop or hobby/craft area? Y / N Where & Type?____________________ g. Is there smoking in the building? Y / N Frequency?________ h. Have cleaning products been used recently? Y / N When & Type?______ i. Have cosmetic products been used recently? Y / N When & Type?______ j. Has painting/staining been done in the last 6 months? Y / N Where & When?____________________________________________________ k. Is there new carpet, drapes or other textiles? Y / N Where & When?____

Guidance for Assessing and Remediating Vapor Intrusion in Buildings
Page E-6
l. Have air fresheners been used recently? Y / N When & Type?______ m. Is there a kitchen exhaust fan? Y / N If yes, where vented?________________________________________________ n. Is there a bathroom exhaust fan? Y / N If yes, where vented?________________________________________________ o. Is there a clothes dryer? Y / N If yes, is it vented outside? Y / N p. Has there been a pesticide application? Y / N When & Type?______ Are there odors in the building Y / N If yes please describe:________________________________________________ Do any of the building occupants use solvents or volatile chemicals at work? Y / N (e.g., chemical manufacturing or laboratory, auto mechanic or auto body shop, painting, fuel oil delivery, boiler mechanic, pesticide applicator, cosmetologist, carpet installer) If yes, what type of solvents are used? __________________________________ If yes, are their clothes washed at work? Y / N Do any of the building occupants regularly use or work at a dry-cleaning service? (circle appropriate response) Yes, use dry-cleaning regularly (weekly) Yes, use dry-cleaning infrequently (monthly or less) Yes, work at a dry-cleaning service No Unknown Is there a radon mitigation system for the building/structure? Y / N Date of Installation:__________________________________________________ Is the system active or passive? Active/Passive 9. WATER & SEWAGE Water Supply: Public water Drilled well Driven well Dug well Other:________________________________________________ Sewage Disposal: Public sewer Septic tank Leach field Dry well Other:________________________________________________ 10. RELOCATION INFORMATION (for oil spill residential emergency)

Guidance for Assessing and Remediating Vapor Intrusion in Buildings
Page E-7
a. Provide reasons why relocation is recommended:______________________ ________________________________________________________________________ b. Residents choose to: remain in home relocate to friends/family relocate to hotel/motel c. Responsibility for costs associated with reimbursement explained? Y / N d. Relocation package provided & explained to residents? Y / N

Guidance for Assessing and Remediating Vapor Intrusion in Buildings
Page E-8
11. FLOOR PLANS Draw a plan view sketch of the basement & first floor of the building. Indicate air sampling locations, possible indoor air pollution sources and PID meter readings. If the building does not have a basement, please note. Basement:
Guidance for Assessing and Remediating Vapor Intrusion in Buildings
Page E-9
First Floor:

Guidance for Assessing and Remediating Vapor Intrusion in Buildings
Page E-10
Second Floor:

Guidance for Assessing and Remediating Vapor Intrusion in Buildings
Page E-11
12. OUTDOOR PLOT
Draw a sketch of the area surrounding the building being sampled. If applicable, provide information on spill locations, potential air
contamination sources (industries, gas stations, repair shops, landfills, etc), outdoor air sampling location(s) & PID meter readings.
Also indicate compass direction, wind direction & speed during sampling, the locations of the well & septic system, if applicable, &
a qualifying statement to help locate the site on a topographic map.

Guidance for Assessing and Remediating Vapor Intrusion in Buildings
Page E-12
13. PRODUCT INVENTORY FORM
Make & Model of field instrument used:______________________________________________
List specific products found in the residence that have the potential to affect indoor air quality.
Location Product
Description
Size
(units)
Condition* Chemical Ingredients Field
Instrument
Reading
(units)
Photo**
Y / N
*Describe the condition of the product containers as Unopened (UO), Used (U), or Deteriorated (D) ** Photographs of the front & back of the product containers can replace the hand written list of chemical ingredients. However, the photographs must be of good quality & ingredient labels must be legible.

Guidance for Assessing and Remediating Vapor Intrusion in Buildings
Public Comment Responsiveness Summary, December 2009 Page F-1
Appendix F: Public Comment Responsiveness Summary

Guidance for Assessing and Remediating Vapor Intrusion in Buildings
Public Comment Responsiveness Summary, December 2009 Page F-2
Department of Environmental Quality
Public Comment Responsiveness Summary Draft Guidance for Assessing and Remediating Vapor Intrusion in Buildings
The Department of Environmental Quality (DEQ) provided an informal opportunity for interested parties to comment on the DEQ draft Guidance for Assessing and Remediating Vapor Intrusion in Buildings, from September 15 to October 30, 2009. DEQ issued an invitation to comment through DEQ’s e-mail subscription system to the Cleanup and Tanks Programs interested parties’ contacts lists, and posted information on the DEQ Web site. An information meeting with a conference call option was held on October 1, 2009. DEQ received comments from 16 parties. Many of the comments were relatively minor, focusing on recommendations, editorial corrections or clarifications. Several significant areas of concern were identified by DEQ in review of the comments. This document provides responses to the issues raised as they relate to DEQ’s proposed evaluation framework, criteria, and decision-making process outlined in the guidance document. Issue 1: Several parties raised concerns that the proposed guidance dictated a prescriptive process for screening vapor intrusion pathway and prohibits development of site-specific modification of the generic risk-based concentrations (RBCs). The comments further suggested that the guidance is based on too many simple decision rules that, if closely followed, would lead to poor risk-management decisions resulting in DEQ requiring corrective action where vapor intrusion is not actually happening. Response: DEQ has been using the Risk-Based Decision Making for the Remediation of Petroleum-Contaminated Site (RBDM) since 1999. The RBDM allows derivation of site-specific risk-based concentrations (RBCs) for soil and water, based on site conditions. As allowed in the RBDM, a number of parties have proposed site-specific RBCs by modifying the Johnson & Ettinger (J&E) vapor intrusion model input parameters to produce modeling results to show vapor intrusion risks were insignificant. In practice, however, parties often based these modifications on empirical data from other facilities (e.g. soil moisture content), and refused to collect site-specific empirical data such as analysis of indoor air samples to verify J&E modeling results. The guidance establishes a straight-forward investigation framework to evaluate vapor intrusion at sites with releases of volatile organic compounds to the environment. The guidance sets forth clear expectations that site-specific monitoring is required to adequately evaluate the vapor intrusion

Guidance for Assessing and Remediating Vapor Intrusion in Buildings
Public Comment Responsiveness Summary, December 2009 Page F-3
pathway. Contrary to the comments, the process will lead to improved and more-defensible risk-management decisions and does not dictate corrective action where vapor intrusion risk does not exceed cleanup standards. Issue 2: Several parties commented that the emphasis on soil gas methodology is not warranted and recommended allowing both empirical and theoretical approaches to evaluating vapor intrusion risk. Response: DEQ developed the guidance framework based on our experience that soil gas monitoring is a far more reliable approach to evaluating vapor intrusion into buildings. This approach is also consistent with US EPA research and ITRC guidance. As noted above, J&E modeling has been used as a sole line of evidence by some responsible parties, that vapor intrusion is not occurring to a degree that pose unacceptable risk, without subsequent verification that the modeling results were accurate and reliable.
Issue 3: Several parties commented on the use of a 100 foot buffer zone from a volatile organic compound (VOC) source for triggering assessment of vapor intrusion. The comments suggested smaller buffer zones similar to DEQ’s current guidelines in the RBDM or allowing lines of evidence approach to defining the vapor intrusion evaluation area.
Response: DEQ specified a 100-foot buffer zone in the guidance to ensure that vapor intrusion investigations are initiated where building occupants may be at risk of exposure. The soil gas monitoring results, developed as part of the investigation, are used to refine the area where soil gas concentrations may pose an unacceptable risk for vapor intrusion. Soil gas monitoring between the VOC source and the structure can be used to eliminate a structure from more detailed building-specific evaluation. For example, if a source exists on one property and an adjacent property has a building located within 100 feet, further investigation of that structure could be excluded based on soil gas sampling along the property line showing VOC concentrations in soil gas below generic soil gas RBCs.
Issue 4: One commenter suggested that where a facility is actively using the VOC in their operations that DEQ allow deferring implementation of vapor controls when the facility is meeting OSHA health and safety standards. Remediation would be required when the facility is no longer in operation and land use changes.
Response: The guidance does not preclude DEQ deferring an action at a facility where the vapor intrusion pathway might contribute to indoor air concentrations for chemicals in use at the facility. However, DEQ would not defer vapor mitigation measures on structures for 3rd party properties and structures that are not subject to the OSHA standards. For example, gasoline stations are often located in mixed-use areas where residential structures or off-site commercial buildings are within 100 feet of a leaking underground storage tank. Vapor controls would be required for adjacent buildings where vapor intrusion risk exists, irrespective of whether DEQ deferred certain on-site soil vapor controls for the station.

Guidance for Assessing and Remediating Vapor Intrusion in Buildings
Public Comment Responsiveness Summary, December 2009 Page F-4
Issue 5: One commenter questioned the continued use of DEQ’s generic vapor intrusion RBCs for soil and groundwater and noted US EPA (2002) and ITRC (2007) recommendations that concluded that there is insufficient scientific support for this procedure.
Response: In the course of development of the guidance, DEQ considered rescinding the soil and groundwater generic RBCs for vapor intrusion. Eliminating the generic soil and groundwater RBCs would have the net effect of requiring soil gas monitoring at all facilities where a release of VOCs occurred.
After careful consideration, we determined that DEQ’s generic RBCs were sufficiently conservative for initial screening of the vapor intrusion pathway at a facility. The conditions used by DEQ for the soil and groundwater RBCs assumed sand soil matrix with low organic carbon and moisture content, shallow groundwater conditions, and a relatively small structure.
Issue 6: Comments were provided suggesting that the use of a generic attenuation factor to derive generic soil gas RBCs was inappropriate because the data analysis provided in Appendix A of the document clearly show that soil gas is a poor predictor of indoor air concentrations. The commenters further noted that the current application of models such as the Johnson and Ettinger vapor intrusion model may be better predict indoor air concentrations than conservative attenuation factors.
Response: DEQ believes and has stated in the guidance that sub-slab vapor is a better predictor of indoor air, relative to other data types, and as previously noted, parties were not generally willing to verify modeling results through indoor air monitoring.
Parties may still conduct J&E modeling to support the conceptual site model for their facility. However, this will not be a substitute for site-specific monitoring. Likewise, the presence of VOCs in soil gas exceeding the generic RBC does not necessarily mean that indoor air concentrations will exceed air RBCs. In those circumstances where indoor air sampling shows that the attenuation rate is greater than the 200 or 1000 used in the guidance, no further action may be protective for that structure, but that building-specific attenuation factor would not apply to other buildings within the locality of facility.
Issue 7: Several commenters questioned the application of the hot spot concept to soil gas in the evaluation process; that its use appears to be inconsistent with Oregon Administrative Rules (OARs), and available data suggest that the decision rule is inappropriate as its use may require a party to design a potentially useless remedial action.
Response: DEQ disagrees that the application of the term hot spots for soil gas is inconsistent with OARs, as the definition applies to all environmental media. DEQ believes that concentrations of contaminants in soil gas at prescribed hot spot levels has a significant potential to migrate into indoor air at levels creating exposure conditions that exceed hot spot criteria. It is possible that levels of vapor in soil exceeding hot spot concentrations may not produce concentrations in indoor air exceeding hot spot levels at any specific site. However, as the

Guidance for Assessing and Remediating Vapor Intrusion in Buildings
Public Comment Responsiveness Summary, December 2009 Page F-5
subsurface concentration increases, the likelihood of vapor intrusion contributing to indoor air increases as well. When levels in subsurface are significantly elevated, the need for remedial action is correspondingly also elevated, which is why the guidance directs expedited development of vapor mitigation measures.
The guidance does not preclude the collection of additional site-specific data concurrent with the FS or corrective action development. Based on the graphical data illustrations in Appendix A of the guidance, the likelihood that indoor air would exceed RBCs is very high. By extension then, the likelihood DEQ is requiring a party to spend money on vapor control options that wouldn’t be needed to adequately protect building occupants is quite low.
Issue 8: A commenter asked if DEQ considers engineering controls as treatment for hot spots. Response: DEQ considers engineering controls that remove mass from the subsurface (e.g. radon mitigation systems that remove soil vapor) as remediation systems.