Guam Visitors Bureau · PDF fileQtr1 (Oct16-Dec16) Qtr2 (Jan17-Mar17) Qtr3 (Apr17-Jun17) Qtr4...
120
Guam Visitors Bureau Hong Kong Visitor Tracker Exit Profile & Market Segmentation Report FY2017 QTR.4 (JULY - SEPT 2017) Prepared by: Anthology Research Information contained herein is the property of the Guam Visitors Bureau. The use of this information, in part or in whole, shall require written permission from the Guam Visitors Bureau.
Transcript of Guam Visitors Bureau · PDF fileQtr1 (Oct16-Dec16) Qtr2 (Jan17-Mar17) Qtr3 (Apr17-Jun17) Qtr4...

Guam Visitors BureauHong Kong Visitor Tracker Exit Profile
& Market Segmentation Report
FY2017
QTR.4 (JULY - SEPT 2017)
Prepared by: Anthology ResearchInformation contained herein is the property of the Guam Visitors
Bureau. The use of this information, in part or in whole, shall require
written permission from the Guam Visitors Bureau.

Background and Methodology
• All surveys were partially interviewer administered, as well as
self-administered. Upon completion of the surveys,
Anthology’s professional Chinese speaking interviewers
double-checked each questionnaire for consistency and
completeness, while the respondent is present.
• A total of 122 departing Chinese visitors were randomly
interviewed at the Guam A.B. Wonpat International Airport’s
departure and waiting areas.
• The margin of error for a sample of 122 is +/- 8.87 percentage
points with a 95% confidence level. That is, if all Chinese
visitors who traveled to Guam in the same time period were
asked these questions, we can be 95% certain that their
responses would not differ by +/- 8.87 percentage points.
2

Objectives
• To monitor the effectiveness of the Hong Kong
seasonal campaigns in attracting Chinese visitors,
refresh certain baseline data, to better understand
the nature, and economic value or impact of
each of the targeted segments in the Hong Kong
marketing plan.
• Identify significant determinants of visitor
satisfaction, expenditures and the desire to return
to Guam.
3

Key Highlighted Segments
• The specific objectives were:
– To determine the relative size and expenditure behavior of
the following market segments:
• FITs (Q7)
• Honeymoon (Q5A)
• Family (Q6)
– To identify the most significant factors affecting overall
visitor satisfaction.
– To identify (for all Chinese visitors) the most important
determinants of on-island spending
4

Key Highlighted Segments
Qtr1 (Oct16-
Dec16)
Qtr2 (Jan17-
Mar17)
Qtr3 (Apr17-
Jun17)
Qtr4 (Jul17-
Sept17)
FITs 85% 62%
Family 60% 66%
Honeymoon 5%
0
0.1
0.2
0.3
0.4
0.5
0.6
0.7
0.8
0.9
5

SECTION 1
PROFILE OF RESPONDENTS

Marital Status
Married71%
Single29%
7

Marital status – FY2017 Tracking
56%
71%
44%
29%
0
0.1
0.2
0.3
0.4
0.5
0.6
0.7
0.8
Qtr1 (Oct16-Dec16) Qtr2 (Jan17-Mar17) Qtr3 (Apr17-Jun17) Qtr4 (Jul17-Sept17)
Married Single
8

Marital status – Key Segments
9

Age
6%
58%
22%
9%5%
0%
10%
20%
30%
40%
50%
60%
70%
18-24 25-39 40-49 50-59 60+
MEAN = 37.18
MEDIAN = 36
10

Age – FY2017 Tracking
Qtr1 (Oct16-
Dec16)Qtr2 (Jan17-Mar17) Qtr3 (Apr17-Jun17) Qtr4 (Jul17-Sept17)
MEAN 33.16 37.18
MEDIAN 31 36
0
5
10
15
20
25
30
35
40
45
50
11

Age – Key Segments
12

Annual Household Income
23%
31%
19%
24%
1% 2%
0%
5%
10%
15%
20%
25%
30%
35%
EXCHANGE RATE HKD 7.81=$1
13

Annual Household Income –
Key Segments
14

Travel Party
15
47%
29%
22%20%
14%
7%4%
2%
0%
5%
10%
15%
20%
25%
30%
35%
40%
45%
50%

Travel Party - Children
3%
9%
18%
5%
0%
5%
10%
15%
20%
25%
0-2 Years old 3-6 Years old 7-11 Years old 12-18 Years old
29% TRAVELING WITH A CHILD
16

Trips to Guam
First time84%
Repeat16%
17

Trips to Guam – FY2017 Tracking
91%84%
9%16%
0
0.1
0.2
0.3
0.4
0.5
0.6
0.7
0.8
0.9
1
Qtr1 (Oct16-Dec16) Qtr2 (Jan17-Mar17) Qtr3 (Apr17-Jun17) Qtr4 (Jul17-Sept17)
First Repeat
18

Trips to Guam – Key Segments
19

Length of Stay
6%
23%
71%
0%
10%
20%
30%
40%
50%
60%
70%
80%
90%
100%
One to two nights Three nights Four or more nights
MEAN NUMBER OF NIGHTS = 4.29
MEDIAN NUMBER OF NIGHTS = 4
20

Length of Stay – FY2017 Tracking
Qtr1 (Oct16-Dec16) Qtr2 (Jan17-Mar17) Qtr3 (Apr17-Jun17) Qtr4 (Jul17-Sept17)
MEAN 4.89 4.29
MEDIAN 5 4
0
1
2
3
4
5
6
7
8
21

Length of Stay – Key Segments
22

Occupation – Top Responses (10%+)
36%
25%
0%
5%
10%
15%
20%
25%
30%
35%
40%
Company: Non-mgr Professional/ Specialist
23

SECTION 2
TRAVEL PLANNING

Organized Group Tour
25
Organized Group Tour
16%
No84%

Organized Group Tour– Tracking
26
Qtr1 (Oct16-
Dec16)
Qtr2 (Jan17-
Mar17)
Qtr3 (Apr17-
Jun17)
Qtr4 (Jul17-
Sept17)
Organized Group Tour 9% 16%
0
0.05
0.1
0.15
0.2
0.25
0.3
0.35
0.4

Travel Arrangements- Sources
27
32%30%
25%
12%
0%
5%
10%
15%
20%
25%
30%
35%
Online 3rd Party
travel site
Direct - air/ hotel Trvl Agt/ Co-
specializing pkg
tours
Online travel
agent/ Co-
specializing pkg
tours

Travel Arrangements- Sources
28
Qtr1 (Oct16-
Dec16)
Qtr2 (Jan17-
Mar17)
Qtr3 (Apr17-
Jun17)
Qtr4 (Jul17-
Sept17)
Online travel agent 5% 12%
Trvl Agt/ Co- Pkg Tour 10% 25%
Online 3rd Party 42% 32%
Direct Air/ Hotel 43% 30%
0
0.1
0.2
0.3
0.4
0.5
0.6

Prepaid Pkg Trip
29
Prepaid Pkg54%
No46%

Prepaid Pkg Trip
30
Qtr1 (Oct16-
Dec16)
Qtr2 (Jan17-
Mar17)
Qtr3 (Apr17-
Jun17)
Qtr4 (Jul17-
Sept17)
Prepaid Pkg Trip 37% 54%
0
0.1
0.2
0.3
0.4
0.5
0.6
0.7
0.8
0.9
1

Accommodations (Top Responses)
13%11% 10% 9%
7%5%
5.25
4.15
5.00
3.73
4.33
3.33
1.00
2.00
3.00
4.00
5.00
6.00
0%
5%
10%
15%
20%
25%
30%
35%
Fiesta Resort Hilton
Guam
Resort
PIC Westin
Resort
Private
Home-
Friend/
Relative
Sheraton
Laguna
Stayed At Length of Stay
31

Travel Motivation (Top Responses)
7%
7%
9%
11%
12%
14%
15%
21%
23%
24%
63%
0% 10% 20% 30% 40% 50% 60% 70%
Married/ Wedding
Career Cert
Price
Safe
No Visa
Recommendation
Scuba
Water sports
Relax
Shopping
Natural beauty
32

Travel Motivation – Key Segments
33

SECTION 3
EXPENDITURES

Prepaid Expenditures
• $2,205.63 = overall mean average prepaid
expense (for entire travel party size) by
respondent
• $1,058.48 = overall mean average per person
prepaid expenditures
EXCHANGE RATE HKD 7.81=$1
35

Prepaid Entire Travel Party – FY2017
Tracking
Qtr1 (Oct16-Dec16) Qtr2 (Jan17-Mar17) Qtr3 (Apr17-Jun17) Qtr4 (Jul17-Sept17)
MEAN $1,977.61 $2,205.63
MEDIAN $1,542.00 $1,536.00
0
500
1000
1500
2000
2500
3000
36

Prepaid Per Person– FY2017 Tracking
Qtr1 (Oct16-Dec16) Qtr2 (Jan17-Mar17) Qtr3 (Apr17-Jun17) Qtr4 (Jul17-Sept17)
MEAN $1,138.13 $1,058.48
MEDIAN $964.00 $854.00
0
500
1000
1500
37

Prepaid Per Person– Key Segments
38

Prepaid Expenses by Category – MEAN
Entire Travel Party
$1,632.31
$1,802.97
$928.19 $914.21
$307.70
$57.50
$184.66
$478.45
$752.61
$0.00
$200.00
$400.00
$600.00
$800.00
$1,000.00
$1,200.00
$1,400.00
$1,600.00
$1,800.00
$2,000.00
Air/ Hotel
pkg
Air/
Hotel/
Meal pkg
Air Only Hotel
Only
Hotel/
Meal
F&B Hotel Ground
Trans-
China
Ground
Trans-
Guam
Optional
Tour
Other
39

Prepaid– FY2017 TrackingAirfare & Accommodation Packages
Qtr1 (Oct16-Dec16) Qtr2 (Jan17-Mar17) Qtr3 (Apr17-Jun17) Qtr4 (Jul17-Sept17)
MEAN $1,312.87 $1,632.31
MEDIAN $900.00 $1,184.00
0
500
1000
1500
2000
2500
3000
40

Prepaid– FY2017 TrackingAirfare & Accommodation W/ Meal Packages
Qtr1 (Oct16-Dec16) Qtr2 (Jan17-Mar17) Qtr3 (Apr17-Jun17) Qtr4 (Jul17-Sept17)
MEAN $1,473.54 $1,802.97
MEDIAN $1,221.00 $1,428.00
0
500
1000
1500
2000
2500
3000
3500
4000
41
Prepaid– FY2017 TrackingAirfare Only
Qtr1 (Oct16-Dec16) Qtr2 (Jan17-Mar17) Qtr3 (Apr17-Jun17) Qtr4 (Jul17-Sept17)
MEAN $560.33 $928.19
MEDIAN $386.00 $608.00
0
500
1000
1500
42

Prepaid– FY2017 TrackingAccommodations Only
Qtr1 (Oct16-Dec16) Qtr2 (Jan17-Mar17) Qtr3 (Apr17-Jun17) Qtr4 (Jul17-Sept17)
MEAN $693.10 $914.21
MEDIAN $450.00 $461.00
0
200
400
600
800
1000
1200
1400
1600
43

Prepaid– FY2017 TrackingAccommodations w/ Meal Only
Qtr1 (Oct16-Dec16) Qtr2 (Jan17-Mar17) Qtr3 (Apr17-Jun17) Qtr4 (Jul17-Sept17)
MEAN $1,391.39
MEDIAN $964.00
0
200
400
600
800
1000
1200
1400
1600
44

Prepaid– FY2017 TrackingFood & Beverage in Hotel
Qtr1 (Oct16-Dec16) Qtr2 (Jan17-Mar17) Qtr3 (Apr17-Jun17) Qtr4 (Jul17-Sept17)
MEAN $366.78 $307.70
MEDIAN $199.00 $128.00
0
200
400
600
800
1000
45

Prepaid– FY2017 TrackingGround Transportation – Hong Kong
Qtr1 (Oct16-
Dec16)
Qtr2 (Jan17-
Mar17)
Qtr3 (Apr17-
Jun17)
Qtr4 (Jul17-
Sept17)
MEAN $43.87 $57.50
MEDIAN $28.00 $38.00
0
10
20
30
40
50
60
70
80
90
100
110
120
130
140
150
46

Prepaid– FY2017 TrackingGround Transportation - Guam
Qtr1 (Oct16-
Dec16)
Qtr2 (Jan17-
Mar17)
Qtr3 (Apr17-
Jun17)
Qtr4 (Jul17-
Sept17)
MEAN $189.26 $184.66
MEDIAN $129.00 $128.00
0
50
100
150
200
250
300
47
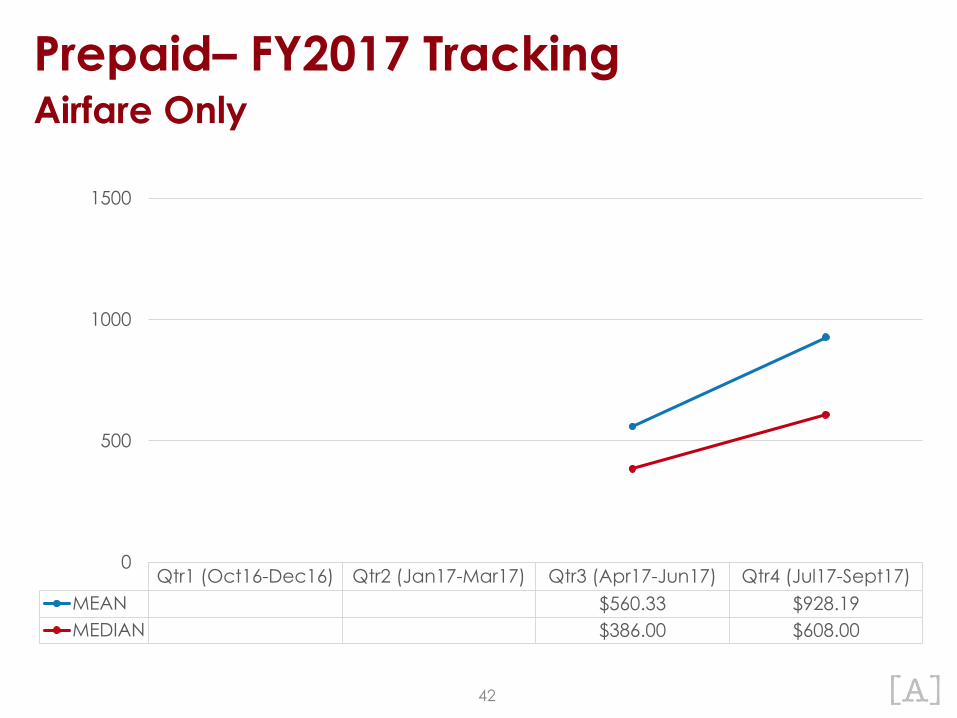
Prepaid– FY2017 TrackingOptional tours/ Activities
Qtr1 (Oct16-Dec16) Qtr2 (Jan17-Mar17) Qtr3 (Apr17-Jun17) Qtr4 (Jul17-Sept17)
MEAN $500.12 $478.45
MEDIAN $386.00 $384.00
0
100
200
300
400
500
600
700
800
900
1000
48

On-Island Expenditures
• $1,240.69 = overall mean average prepaid
expense (for entire travel party size) by
respondent
• $708.05 = overall mean average per person
prepaid expenditures
49

On-Island Entire Travel Party –
FY2017 Tracking
Qtr1 (Oct16-Dec16) Qtr2 (Jan17-Mar17) Qtr3 (Apr17-Jun17) Qtr4 (Jul17-Sept17)
MEAN $2,827.64 $1,240.69
MEDIAN $1,309.00 $1,000.00
0
250
500
750
1000
1250
1500
1750
2000
2250
2500
2750
3000
3250
3500
50

On-Island Per Person – FY2017 Tracking
Qtr1 (Oct16-
Dec16)
Qtr2 (Jan17-
Mar17)
Qtr3 (Apr17-
Jun17)
Qtr4 (Jul17-
Sept17)
MEAN $1,775.08 $708.05
MEDIAN $750.00 $500.00
0
250
500
750
1000
1250
1500
1750
2000
51

On-Island Per Person – Key Segments
52

Per Person MEAN expenditures – FY2017 Tracking
On-Island/ Prepaid
Qtr1 (Oct16-
Dec16)Qtr2 (Jan17-Mar17) Qtr3 (Apr17-Jun17) Qtr4 (Jul17-Sept17)
On-Island $1,775.08 $708.05
Prepaid $1,138.13 $1,058.48
0
250
500
750
1000
1250
1500
1750
2000
53

On-Island Per Day Spending – FY2017 Tracking
MEAN
Qtr1 (Oct16-
Dec16)Qtr2 (Jan17-Mar17) Qtr3 (Apr17-Jun17) Qtr4 (Jul17-Sept17)
Per Person $375.07 $185.64
Travel Party $611.20 $315.34
0
100
200
300
400
500
600
700
800
54

On-Island Expenses by Category – MEAN
Entire Travel Party
$65.09
$109.68
$213.73$224.21
$283.11
$233.63
$123.40$112.59
$0.00
$50.00
$100.00
$150.00
$200.00
$250.00
$300.00
F&B Hotel F&B Fast
Food/
Conv
Store
F&B
Restaurant
Optional
Tour
Gift- Self Gift-
Others
Local
Trans
Other
55

On-Island – FY2017 TrackingFood & Beverage - Hotel
Qtr1 (Oct16-
Dec16)
Qtr2 (Jan17-
Mar17)Qtr3 (Apr17-Jun17)
Qtr4 (Jul17-
Sept17)
MEAN $109.44 $65.09
0
25
50
75
100
125
150
56

On-Island – FY2017 TrackingFood & Beverage – Fast Food/ Convenience Store
Qtr1 (Oct16-Dec16) Qtr2 (Jan17-Mar17) Qtr3 (Apr17-Jun17) Qtr4 (Jul17-Sept17)
MEAN $164.76 $109.68
0
25
50
75
100
125
150
175
200
57

On-Island – FY2017 TrackingFood & Beverage – Restaurant/ Drinking Est Outside Hotel
Qtr1 (Oct16-Dec16) Qtr2 (Jan17-Mar17) Qtr3 (Apr17-Jun17) Qtr4 (Jul17-Sept17)
MEAN $398.63 $213.73
0
50
100
150
200
250
300
350
400
450
500
58

On-Island – FY2017 TrackingOptional tour/ Activities
Qtr1 (Oct16-Dec16) Qtr2 (Jan17-Mar17) Qtr3 (Apr17-Jun17) Qtr4 (Jul17-Sept17)
MEAN $526.02 $224.21
0
50
100
150
200
250
300
350
400
450
500
550
600
59

On-Island – FY2017 TrackingGift/ Souvenir – Self/ Companion
Qtr1 (Oct16-
Dec16)
Qtr2 (Jan17-
Mar17)Qtr3 (Apr17-Jun17) Qtr4 (Jul17-Sept17)
MEAN $242.41 $283.11
0
100
200
300
400
500
600
700
60

On-Island – FY2017 TrackingGift/ Souvenir – Friends/ Family
Qtr1 (Oct16-Dec16) Qtr2 (Jan17-Mar17) Qtr3 (Apr17-Jun17) Qtr4 (Jul17-Sept17)
MEAN $165.03 $233.63
0
100
200
300
400
500
61

On-Island – FY2017 TrackingLocal Transportation
Qtr1 (Oct16-Dec16) Qtr2 (Jan17-Mar17) Qtr3 (Apr17-Jun17) Qtr4 (Jul17-Sept17)
MEAN $181.76 $123.40
0
50
100
150
200
250
300
62

On-Island – FY2017 TrackingOther Not Included
Qtr1 (Oct16-
Dec16)
Qtr2 (Jan17-
Mar17)Qtr3 (Apr17-Jun17) Qtr4 (Jul17-Sept17)
MEAN $98.18 $112.59
0
100
200
300
400
500
63

TOTAL (On-Isle + Prepaid) Expenditures
Per Person
• $1,766.54 = overall mean average prepaid
expense by respondent/ Per Person
64

TOTAL Per Person Expenditures –
FY2017 Tracking
Qtr1 (Oct16-
Dec16)
Qtr2 (Jan17-
Mar17)
Qtr3 (Apr17-
Jun17)
Qtr4 (Jul17-
Sept17)
MEAN $2,913.21 $1,766.54
MEDIAN $2,035.00 $1,484.00
0
250
500
750
1000
1250
1500
1750
2000
2250
2500
2750
3000
3250
3500
65

TOTAL Per Person Expenditures –
Key Segments
66

GUAM AIRPORT EXPENDITURE –
FY2017 Tracking
Qtr1 (Oct16-Dec16) Qtr2 (Jan17-Mar17) Qtr3 (Apr17-Jun17) Qtr4 (Jul17-Sept17)
MEAN $76.36 $104.34
0
50
100
150
200
67

SECTION 4
VISITOR SATISFACTION
BEHAVIOR
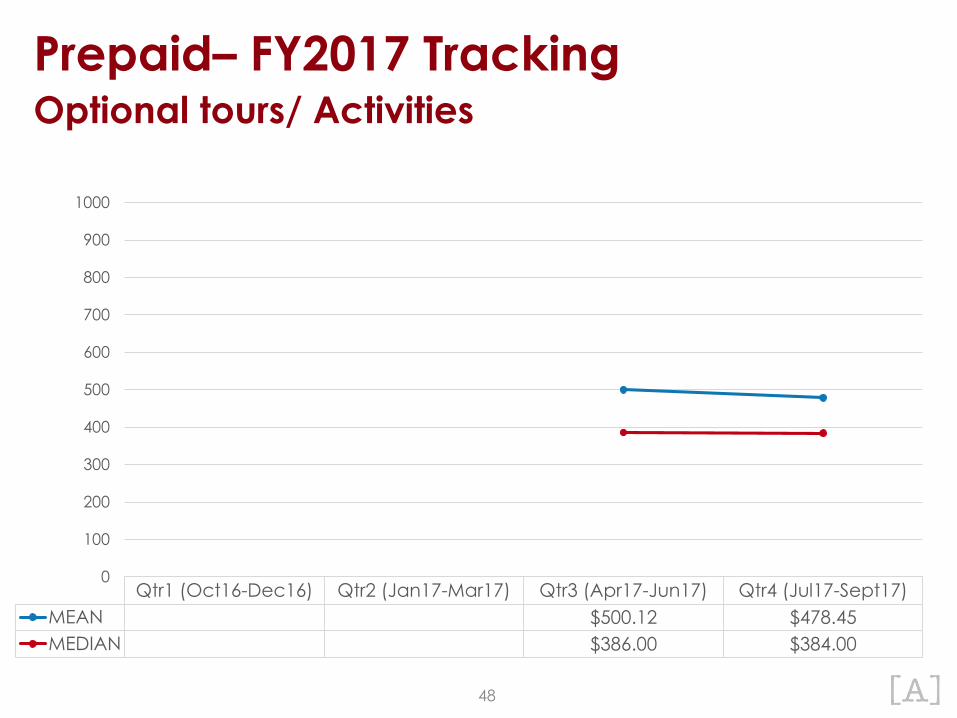
OVERALL SATISFACTION
13%
20%
5.56 5.62
0
1
2
3
4
5
6
7
0
0.1
0.2
0.3
0.4
0.5
0.6
Qtr1 (Oct16-
Dec16)
Qtr2 (Jan17-
Mar17)
Qtr3 (Apr17-Jun17) Qtr4 (Jul17-
Sept17)
Very Satisfied (Top Box) MEAN (7pt Scale)
69

Positive Aspect of Trip
70
2%
3%
3%
4%
7%
10%
10%
16%
20%
25%
0% 5% 10% 15% 20% 25% 30%
Safety
Shopping
Event- Fam/Fr
Event- Self
Climate
Pkg tour/ activity
Friendly/ Warm ppl
Natural beauty
Relaxing
Beach/ Ocean

Negative Aspect of Trip
71
2%
3%
4%
5%
5%
6%
7%
8%
25%
29%
0% 5% 10% 15% 20% 25% 30% 35%
Accommodations
Ground Trans
Food- quality
Food- variety
Traffic
Language
Activities/ Attractions
Local culture
Expensive/ Cost
Nothing

Guam was better than expected
27%
32%
5.64 5.60
0
1
2
3
4
5
6
7
0
0.1
0.2
0.3
0.4
0.5
0.6
Qtr1 (Oct16-
Dec16)
Qtr2 (Jan17-
Mar17)
Qtr3 (Apr17-Jun17) Qtr4 (Jul17-
Sept17)
Strongly agree MEAN (7pt Scale)
72

I had no communication problems
34% 35%
5.88 5.76
0
1
2
3
4
5
6
7
0
0.1
0.2
0.3
0.4
0.5
0.6
Qtr1 (Oct16-
Dec16)
Qtr2 (Jan17-
Mar17)
Qtr3 (Apr17-Jun17) Qtr4 (Jul17-
Sept17)
Strongly agree MEAN (7pt Scale)
73

I will recommend Guam to friends
38%36%
5.81 5.73
0
1
2
3
4
5
6
7
0
0.1
0.2
0.3
0.4
0.5
0.6
Qtr1 (Oct16-
Dec16)
Qtr2 (Jan17-
Mar17)
Qtr3 (Apr17-Jun17) Qtr4 (Jul17-
Sept17)
Strongly agree MEAN (7pt Scale)
74

Sites on Guam were attractive
31%34%
5.62 5.51
0
1
2
3
4
5
6
7
0
0.1
0.2
0.3
0.4
0.5
0.6
0.7
0.8
0.9
1
Qtr1 (Oct16-
Dec16)
Qtr2 (Jan17-
Mar17)
Qtr3 (Apr17-Jun17) Qtr4 (Jul17-
Sept17)
Strongly agree MEAN (7pt Scale)
75

I plan to visit Guam again
25%
32%
5.25 5.37
0
1
2
3
4
5
6
7
0
0.1
0.2
0.3
0.4
0.5
0.6
0.7
0.8
Qtr1 (Oct16-
Dec16)
Qtr2 (Jan17-
Mar17)
Qtr3 (Apr17-Jun17) Qtr4 (Jul17-
Sept17)
Strongly agree MEAN (7pt Scale)
76

Not enough night time activities
11% 12%
4.574.93
0
1
2
3
4
5
6
7
0
0.1
0.2
0.3
0.4
0.5
Qtr1 (Oct16-
Dec16)
Qtr2 (Jan17-
Mar17)
Qtr3 (Apr17-Jun17) Qtr4 (Jul17-
Sept17)
Strongly agree MEAN (7pt Scale)
77

Tour guides were professional
18%
25%
5.135.38
0
1
2
3
4
5
6
7
0
0.1
0.2
0.3
0.4
0.5
0.6
Qtr1 (Oct16-
Dec16)
Qtr2 (Jan17-
Mar17)
Qtr3 (Apr17-Jun17) Qtr4 (Jul17-
Sept17)
Strongly agree MEAN (7pt Scale)
78

Tour drivers were professional
23%27%
5.32 5.52
0
1
2
3
4
5
6
7
0
0.1
0.2
0.3
0.4
0.5
0.6
0.7
0.8
Qtr1 (Oct16-
Dec16)
Qtr2 (Jan17-
Mar17)
Qtr3 (Apr17-Jun17) Qtr4 (Jul17-
Sept17)
Strongly agree MEAN (7pt Scale)
79

Taxi drivers were professional
22% 22%
5.31 5.31
0
1
2
3
4
5
6
7
0
0.1
0.2
0.3
0.4
0.5
0.6
0.7
0.8
Qtr1 (Oct16-
Dec16)
Qtr2 (Jan17-
Mar17)
Qtr3 (Apr17-Jun17) Qtr4 (Jul17-
Sept17)
Strongly agree MEAN (7pt Scale)
80

Taxis were clean
21%24%
5.48 5.38
0
1
2
3
4
5
6
7
0
0.1
0.2
0.3
0.4
0.5
0.6
0.7
0.8
Qtr1 (Oct16-
Dec16)
Qtr2 (Jan17-
Mar17)
Qtr3 (Apr17-Jun17) Qtr4 (Jul17-
Sept17)
Strongly agree MEAN (7pt Scale)
81

Guam airport was clean
22%
32%
5.53 5.68
0
1
2
3
4
5
6
7
0
0.1
0.2
0.3
0.4
0.5
0.6
0.7
0.8
Qtr1 (Oct16-
Dec16)
Qtr2 (Jan17-
Mar17)
Qtr3 (Apr17-Jun17) Qtr4 (Jul17-
Sept17)
Strongly agree MEAN (7pt Scale)
82

GENERAL SATISFACTION
31% 31%
13%
5.495.76
4.75
0.00
1.00
2.00
3.00
4.00
5.00
6.00
7.00
0%
10%
20%
30%
40%
50%
60%
70%
80%
Ease of getting
around
Safety walking at
night
Price of things on
Guam
Very Satisfied (Top Box) MEAN (7pt Scale)
83

GENERAL SATISFACTION –Quality/ Cleanliness
44%
62%52% 53% 54%
47%41%
6.03 6.27 6.15 6.19 6.16 5.98 5.74
0.00
1.00
2.00
3.00
4.00
5.00
6.00
7.00
0%
10%
20%
30%
40%
50%
60%
70%
Very Satisfied (Top Box) MEAN (7pt Scale)
84

ACCOMMODATIONS –OVERALL SATISFACTION
15%
24%
4.975.32
0
1
2
3
4
5
6
7
0
0.1
0.2
0.3
0.4
0.5
0.6
Qtr1 (Oct16-
Dec16)
Qtr2 (Jan17-
Mar17)
Qtr3 (Apr17-Jun17) Qtr4 (Jul17-
Sept17)
Very Satisfied (Top Box) MEAN (7pt Scale)
85

ACCOMMODATIONS –Satisfaction by Category
20%
28%
14%
23%
14%20%
37% 35%
16%
5.27 5.515.03
5.344.99
5.305.69 5.67
5.12
0.00
1.00
2.00
3.00
4.00
5.00
6.00
7.00
0%
5%
10%
15%
20%
25%
30%
35%
40%
Very Satisfied (Top Box) MEAN (7pt Scale)
86

DINING EXPERIENCE (Outside Hotel) –Satisfaction by Category
17%
24%21%
25%
38% 38%
18%
5.355.58 5.48 5.56
5.83 5.85
5.32
0.00
1.00
2.00
3.00
4.00
5.00
6.00
7.00
0%
5%
10%
15%
20%
25%
30%
35%
40%
Furnishings Cleanliness Food-
Quality
Food-
Quantity
Staff Service Value
Very Satisfied (Top Box) MEAN (7pt Scale)
87

Shopping Malls/ Stores (Top Responses)
76%71%
53%50%
40% 40%36%
26% 24% 23%
0%
10%
20%
30%
40%
50%
60%
70%
80%
DFS
Galleria
ABC
Store
K-Mart Macys Guam
Premium
Outlet
Ross Micro
Mall
Tumon
Sands
JP Super The
Plaza
88

SHOPPING - SATISFACTION
21% 20%
5.33 5.22
0.00
1.00
2.00
3.00
4.00
5.00
6.00
7.00
0%
10%
20%
30%
40%
50%
60%
QUALITY VARIETY
Very Satisfied (Top Box) MEAN (7pt Scale)
89

OPTIONAL TOUR PARTICIPATION –
FY2017 Tracking
86%
75%
0
0.1
0.2
0.3
0.4
0.5
0.6
0.7
0.8
0.9
1
Qtr1 (Oct16-Dec16) Qtr2 (Jan17-Mar17) Qtr3 (Apr17-Jun17) Qtr4 (Jul17-Sept17)
90
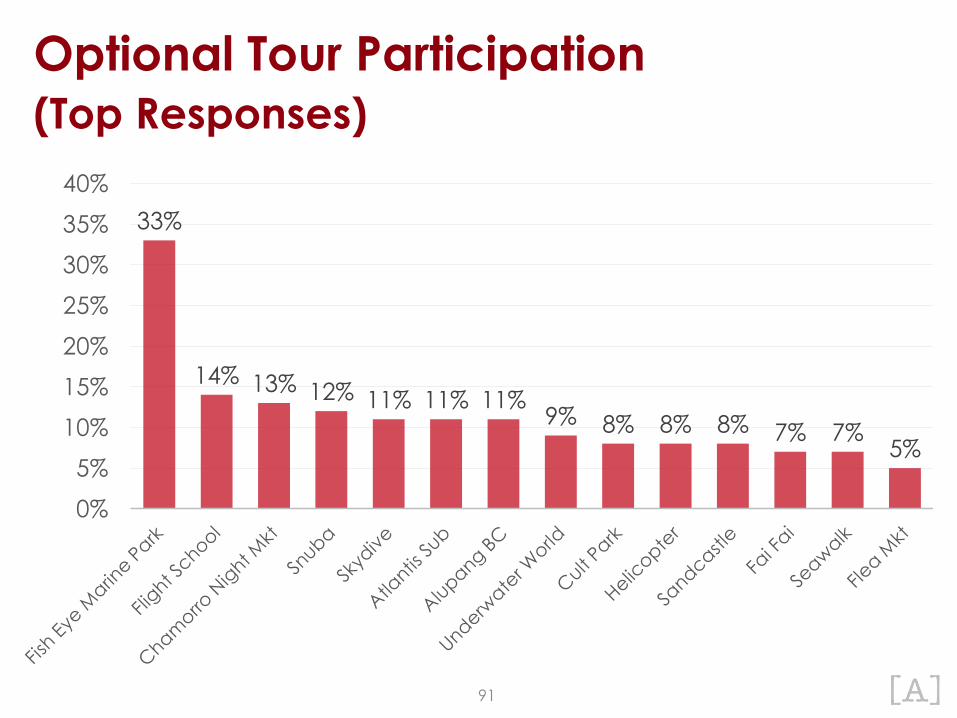
Optional Tour Participation
(Top Responses)
33%
14% 13% 12% 11% 11% 11%9% 8% 8% 8% 7% 7%
5%
0%
5%
10%
15%
20%
25%
30%
35%
40%
91

Optional Tour Satisfaction
Top Responses only - Participation (10%+)
25%
53%
6%
27%
62%
31%38%
5.48
6.12
4.88
6.07 6.155.77
6.23
0.00
1.00
2.00
3.00
4.00
5.00
6.00
7.00
0%
10%
20%
30%
40%
50%
60%
70%
80%
90%
100%
Fish Eye
Marine
Park
Flight
School
Chamorro
Night Mkt
Snuba Skydive Atlantis
Sub
Alupang
BC
Very Satisfied (Top Box) MEAN (7pt Scale)92

DAY TOUR - SATISFACTION
33%
27%
5.84 5.68
0.00
1.00
2.00
3.00
4.00
5.00
6.00
7.00
0%
10%
20%
30%
40%
50%
60%
70%
80%
QUALITY VARIETY
Very Satisfied (Top Box) MEAN (7pt Scale)
93

NIGHT TOUR - SATISFACTION
16% 16%
5.25 5.10
0.00
1.00
2.00
3.00
4.00
5.00
6.00
7.00
0%
10%
20%
30%
40%
50%
60%
QUALITY VARIETY
Very Satisfied (Top Box) MEAN (7pt Scale)
94

Activities Participation (Top Responses)
84%
66%61%
57%
48%
31%27%
18%15% 14%
0%
10%
20%
30%
40%
50%
60%
70%
80%
90%
95

SECTION 5
PROMOTIONS

INTERNET- GUAM SOURCES OF
INFORMATION
76%
21% 20% 18%
6%
0%
10%
20%
30%
40%
50%
60%
70%
80%
Search
Engines
Blogs Social
Networks
Forums Q&A Sites
97

INTERNET- SOURCES OF INFORMATION
Things to do on Guam
51%48%
18% 17%14%
11% 10%6%
3%
0%
10%
20%
30%
40%
50%
60%
98

INTERNET- SOURCES OF INFORMATION
GVB
42%
37%
13% 13%
7% 7%5% 5%
0%
5%
10%
15%
20%
25%
30%
35%
40%
45%
99

TRAVEL MOTIVATION
43%
37%
16%12% 10% 8%
3%
0%5%
10%15%20%25%30%35%40%45%50%
100

PRE-ARRIVAL
SOURCES OF INFOMATION
79%
30%
15%9% 9% 7% 5% 5% 4%
0%
10%
20%
30%
40%
50%
60%
70%
80%
90%
100%
101

PRE-ARRIVAL
SOURCES OF INFORMATION –
Key Segments
102

ONISLE
SOURCES OF INFOMATION
49%
30%27%
18%13% 13% 12%
9% 7% 6%3% 3%
0%
10%
20%
30%
40%
50%
60%
70%
103

ON-ISLE
SOURCES OF INFORMATION –
Key Segments
104

SECTION 6
FUTURE TRAVEL TO GUAM

Will security screening/ immigration at
Guam Airport impact future travel to
Guam?Yes21%
No79%
106

What would it take to make you stay
an extra day on Guam?
34%
28%24%
20% 19%
7%4%
0%
5%
10%
15%
20%
25%
30%
35%
40%
107

FUTURE TRAVEL CONCERNS
65%
27% 26%
19%16%
2% 2%
0%
10%
20%
30%
40%
50%
60%
70%
108

SECTION 7
GUAM CULTURE

EXPERIENCED-
CHAMORRO/ HAFA ADAI SPIRIT
55%
30% 30%28% 27%
17%
0%
10%
20%
30%
40%
50%
60%
Beaches Live music Socializing
w/ locals
Night Market
event
Did NOT
experience
Chamorro
cuisine
110

EXPERIENCED-
OTHER CULTURAL ACTIVITY/EVENTS
61%
25% 25%20% 20%
7%
0%
10%
20%
30%
40%
50%
60%
70%
Two Lovers Pt Chamorro
Cultural
Entertainment
Did NOT
experience
Chamorro
Village
Guam
Museum
Valley of the
Latte
111

SOURCES OF INFORMATION-
CULTURAL ACTIVITY/EVENTS
57%
39%
28%26%
4%2%
0%
10%
20%
30%
40%
50%
60%
Internet Travel
agency
Travel
guides/
brochures
Family/
Friends
Hotel staff Newspaper/
Magazine
112
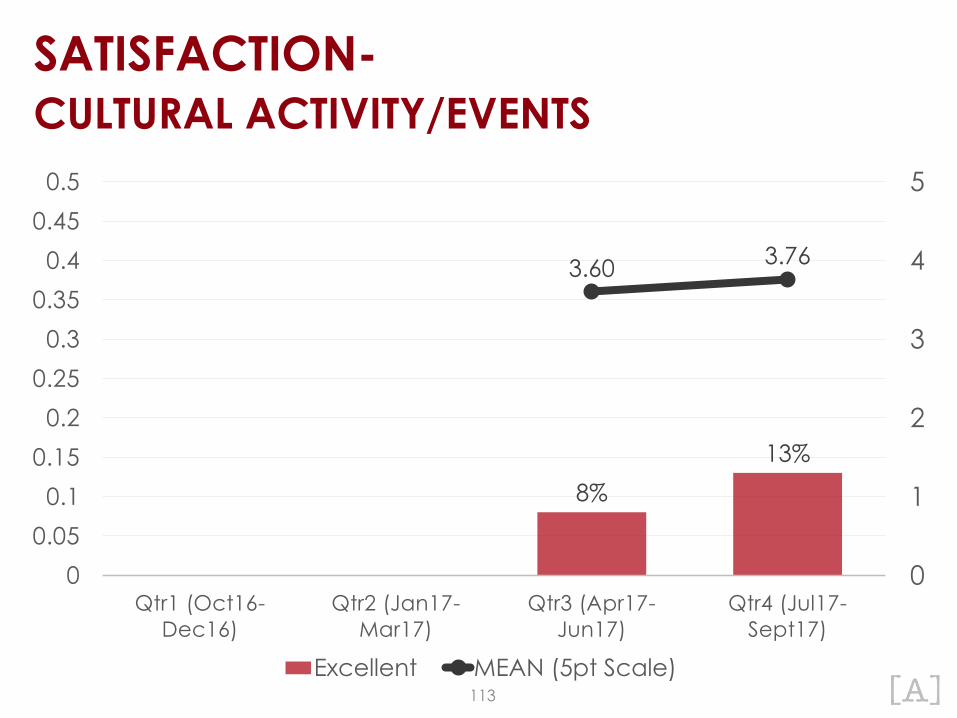
8%
13%
3.603.76
0
1
2
3
4
5
0
0.05
0.1
0.15
0.2
0.25
0.3
0.35
0.4
0.45
0.5
Qtr1 (Oct16-
Dec16)
Qtr2 (Jan17-
Mar17)
Qtr3 (Apr17-
Jun17)
Qtr4 (Jul17-
Sept17)
Excellent MEAN (5pt Scale)
SATISFACTION-
CULTURAL ACTIVITY/EVENTS
113

OBSTACLES-
CULTURAL ACTIVITY/EVENTS
39%
26% 26%
19%
0%
5%
10%
15%
20%
25%
30%
35%
40%
45%
Scheduling Did not know
where
Did not want to Unaware
114

ADVANCED STATISTICS

Analysis Technique
• Dependent variables: total per person on island
expenditure and overall satisfaction (numeric)
• Independent variables are satisfaction with
different aspects of trip to Guam (numeric).
• Use of linear stepwise regression to derive
predictors (drivers) of on-island expenditure and
overall satisfaction, Since both the independent
and dependent variables are numeric.
• This determines the significant (p=<.05)drivers
and the percentage of the dependent variables
accounted for by each significant predictor and
by all of them combined.
116

Drivers- Overall Satisfaction
117
Comparison of Drivers of Overall Satisfaction, 3rd, 4th Qtr. and Overall
3-4 Qtr. 2017
Drivers:
2nd Qtr 3rd Qtr.
Combined
3-4 Qtr.
2017
rank rank rank
Quality & Cleanliness of beaches & parks
Ease of getting around
Safety walking around at night
Quality of daytime tours 1
Variety of daytime tours 1
Quality of nighttime tours
Variety of nighttime tours
Quality of shopping 3 3
Variety of shopping
Price of things on Guam
Quality of hotel accommodations
Quality/cleanliness of air, sky
Quality/cleanliness of parks 2
Quality of landscape in Tumon
Quality of landscape in Guam
Quality of ground handler 1 2
Quality/cleanliness of transportation vehicles
% of Per Person On Island Expenditures
Accounted For 51.6% 38.3% 41.9%
NOTE: Only significant drivers are included.

Drivers of Overall Satisfaction
• Overall satisfaction with the Hong Kong visitor’sexperience on Guam is driven by one significantfactor in the 4th Quarter 2017 Period. It is:
– Quality of ground handler.
• With this factor the overall r2 is .383 meaning that38.3% of overall satisfaction is accounted for bythis factor.
118

Drivers – On-Isle Expenditures
119
Comparison of Drivers of Per Person On Island Expenditure, 3rd, 4th
Qtr. and Overall 3-4 Qtr. 2017
Drivers:
3rs Qtr 4th Qtr.
Combined
3-4 Qtr.
2017
rank rank rank
Quality & Cleanliness of beaches & parks
Ease of getting around
Safety walking around at night
Quality of daytime tours
Variety of daytime tours
Quality of nighttime tours
Variety of nighttime tours
Quality of shopping
Variety of shopping
Price of things on Guam
Quality of hotel accommodations
Quality/cleanliness of air, sky
Quality/cleanliness of parks
Quality of landscape in Tumon
Quality of landscape in Guam
Quality of ground handler
Quality/cleanliness of transportation vehicles
% of Per Person On Island Expenditures
Accounted For 0.0% 0.0% 0.0%
NOTE: Only significant drivers are included.

Drivers of On-Isle Expenditures
• Per Person On Island Expenditure of Hong Kongvisitors on Guam is driven by no significantfactors in the 4th Quarter 2017 period
120