GRUPO PESTANA SGPS - cdnpestana.azureedge.net · in the destinations and in the main motivation of...
67
ENGLISH GRUPO PESTANA SGPS
Transcript of GRUPO PESTANA SGPS - cdnpestana.azureedge.net · in the destinations and in the main motivation of...
ENGLISH
GRUPO PESTANA SGPS

GR
UPO
PE
STA
NA
SG
PSM
anag
emen
t Rep
ort F
inan
cial
Sta
tem
ents
YEA
R-E
ND
ED
Dec
embe
r 31s
t 200
7
IND
EX

GRUPO PESTANA SGPS MANAGEMENT REPORT FINANCIAL STATEMENTS
04
05- Individual and Consolidate Management Report
06- Introdution08- The Fiscal Year 2006 - General Enviroment12- The Consolidated Universe of Grupo Pestana, S.G.P.S. in 200618- Grupo Pestana - S.G.P.S., S.A., Individual Financial Statements19- Profit Distribution Proposal - Liabilities to the State and Social Security20- The Future21- Relevant Facts already occurred in 2007 - Thanks
22- Consolidated Balance Sheet
23- Grupo Pestana SGPS, SA.- Consolidated Balance Sheet25- Consolidated Profit and Loss Statement by Nature26- Consolidated Profit and Loss Statement by Functions27- Consolidated Cash-flows Statement
28- Notes to the Consolidated Financial Statements
29- Introduction30- Basis of Consolidation - Consolidated Companies32- Companies Excluded from the Consolidated Financial Statements - Other Financial Investements % of Owned Share Greater than 10% - Average Number of Employees - Appropriate and Fair Presentation33- Consolidation Differences34- Depreciation of Consolidation Differences - Guarantees Provided35- Basis of Presentation and Accounting Principles38- Exchange Rates Used - Fixed Assets Movement39- Movements in Adjustments40- Debts to Third Parties (more than 5 years) - Debts to Third Parties covered by Real Warrantees - Sales and Services Rendered by Bussiness Area and Geographical Market41- Differences between the Accounting and Tax Results - Wages of Board Menbers42- Fixed Revaluation of Tangible Assets43- Consolidated Statement of Financial Results - Consolidated Statement of Extraordinary Results44- Movements in ProvisionsFinancial Leases - Financial Leases
45- Financial Statements
46- Balance Sheet48- Profit and Loss Statement by Nature49- Profit and Loss Statement by Functions50- Cash-flows Statements
51- Notes to the Financial Statements
52- Introduction - Comparability with Previous Years54- Taxation - Avarage Number of Employees55- Fixed Asset Movements56- Group and Associated Companies57- Debts to Third Parties (more than 5 years) - Guarantees Provided - Increase in Share Capital - Companies Holding More than 20% of Share Capital - Movements in Shareholders Equity58- Statement of Financial Results - Statement of Extraordinary Results59 - Other Relevant Information
61- Report and Opinion of the Statutory Auditor
63- Auditor Report Consolidated Financial Statements
65- Auditor Report Individual Financial Statement
IND
IVID
UAL
AND
CON
SOLI
DAT
EDM
anag
emen
t Rep
ort
GRUPO PESTANA SGPS MANAGEMENT REPORT FINANCIAL STATEMENTS
06
FISCAL YEAR 2007In the terms of the Law, we have the honour to submit for your appreciation and approval the Board of Directors’ management Report and the individual and consolidated financial statements as of and for the year-ended 31 December 2007.
1. INTRODUCTIONGrupo Pestana - S.G.P.S., S.A. (Grupo Pestana SGPS or the Company) was created in December of 2002 following the reorganization process established for the companies held by the Pestana family.
Beyond simplifying the Group structure and making it more understandable, pasted 5 years of activity we can say that this reorganization allowed, throughout the organization by geographical areas and by nature of the business of the different companies, to:
■ define correct global financing policies for the Group and for the different business and geographical areas;
■ apply economic efficiency, financial and commercial criteria’s to the business structure having in the mind not only the actual business development, but also to the investments outlined meanwhile;
■ obtain operational synergies needed to improve the businesses competitiveness and, therefore, become better prepared to face the actual globalization circumstances.

GRUPO PESTANA SGPS MANAGEMENT REPORT FINANCIAL STATEMENTS
07
The 2007 consolidated financial statements include the following companies:

GRUPO PESTANA SGPS MANAGEMENT REPORT FINANCIAL STATEMENTS
08
2. THE FISCAL YEAR 2007 GENERAL ENVIRONMENT
The world economy had, in 2007, a positive year at a global level (estimated growth of 5,2%), despite very different intensities depending on the world regions and on the different countries. Thus the positive signs were more noticed in the emerging economies – BRIC – Brazil, Russian, India and China (average growth around 8% with China reaching a rate of more than 11%) than in the historically more developed economies – USA, Japan and European Union (average growths between 0,25% and 2,5%).
On the side of the economically most developed countries, the USA came again to slow down, getting the situation worse as the year was ending, and Japan, although with positive growth, did not confirm the signs that would suppose a stronger recovery in relation to the previous year. Also the Euro zone exhibited a slow down in the economic growth and the signs of concern became worse as the year-end was closer.
The economies included in EMU – European Monetary Union had a growth of around 2,6% (comparing to 2,8% in the previous year) and only the United Kingdom shown a positive trend, as the growth in 2007 was estimated in 3,1% against the 2,8% registered in 2006.
In 2007 Spain shown a growth of 3,8%, one of the highest in Euro zone, stimulated by the internal demand and, once again, leveraged by the construction and real estate sectors.
Despite being under control, the inflation rate shown a slight increase trend, which causes a rise in interest rates of the European Central Bank (ECB) that had continuity in the first months of this year. In opposition to this rise, in the USA, due to the backdrop of economic slow down, the FED had reduced its reference interest rate in 1% during 2007 (from 5,25% to 4,25%) reducing, thus, to 25 basis points the difference to the ECB’s rates (4% at the end of 2007).
For this scenario contributed significantly the oil prices boost, whose Brent barrel price climbed from 57.21 to 93.89 US dollars during 2007. We point out that this trend continues in the first months of 2008 together with the general rise in prices of raw materials and of basic food products. In the Euro zone this prices rise was partly compensated by the appreciation of the Euro against the Dollar (10,68% in 2007) which exchange rate on 31 December 2007 was US $1.4688 per Euro.
In 2007 the Portuguese economy had a modest but positive trend. It is estimated that the GDP has
GRUPO PESTANA SGPS MANAGEMENT REPORT FINANCIAL STATEMENTS
09
grown 1.9% (against 1,2% in 2006), and the budget deficit reached the 2,5% finally decreasing under the 3% limit imposed by UE to all Euro zone. As positive signs there is still the investment recovery +2,6% (first positive value in the last 3 years) and the exports growing +7%, which was once again higher than the imports growth. As negative signs we had the continuous growing of unemployment, which should have reached the 8% at the year-end, and the maintenance of very high indebtedness levels, either by the Government either by the companies and households, indicating that Portugal and the Portuguese’s still live above its possibilities.
Perspectives
The year 2008 began with great turbulence. To the global inflationary pressure, caused by the ongoing climbing in oil prices (which has been beating successive records) and by the prices of raw materials and basic food products, overlapped the financial sector crisis. This crisis, which began in the US Sub-prime market, has been spreading to all financial system, and, in a chain reaction, has affected the construction and real estate sectors, important to the majority of western economies.
Thus, in the actual context, coexist economies with huge financial resources but with dubious efficiency in the rational application of these resources (countries that sell oil) and emerging economies still growing at significant rates but with lower social indicators with the most advanced economies that struggle with the verge of a crisis. By their side, in order to reverse the actual negative trend, these economies need to make large reforms, being that many of these needed reforms mean diminishing in some social benefits that have been created over the years of economic growth, which, naturally, is not well accepted by the people and creates an environment of instability and conflict.
Tourism Sector
The Tourism sector, Grupo Pestana core business, had in 2007 a good year. At a global level, the demand increased once again very positively in the trend of which happened in previous years (between 1995-2006 the world-wide tourism has grown an average of +5,0% per year), and also in the trail of what is foreseen to the next years (for the next years, WTO – World Tourism Organization expects an annual average growth of +4,0%). The socioeconomic changes that occurred in the life conditions of the most advanced economies are not unrelated with this expected growth. The creation and then the enlargement of the vacations period, the enlargement of the retirement period due to a reduction on the age limit, the better remuneration’s conditions either in the active age either in the retirement period, the information society that enabled the people’s curiosity for the world or the nowadays lifestyle, are all factors that strongly contribute to the need of spending time on holidays becoming a basic need and not superfluous. It is clear that the economic environment influences a greater or lesser spending in holidays, but its neediness is no longer questioned by a large portion of developed countries population.
GRUPO PESTANA SGPS MANAGEMENT REPORT FINANCIAL STATEMENTS
10
However, if the demand had sustainable growth, it is also true that has become more challenging and sophisticated. The nowadays Tourist is aware of his rights, requires a greater satisfaction level of his needs that are often specific and has a bigger capacity to change its type of purchase. Varies in the commercial channels, in the ways that uses to travel, in the destinations and in the main motivation of each vacations period.
Given that, the industry itself had also a quite innovation. First of all in the air transport, where the business model set up by the “Low Cost” companies has made that the average price of the air tickets has fallen considerable, leveraged by greater competition between the airlines due to the “Open Air” policy. In the distribution channels have also registered significant changes. If, on one hand, there has been a trend to concentrate the traditional “Tour Operatours” (in the end of 2006 the first four players on the European market were reduced to two through a merger process), on the other hand, the level of competition has increased due to the internet sales. This phenomenon made possible the emergence of new tour operators based on web channels and allowed the “disintermediation” of the purchase process, turning much easier the communication between the final costumer and the companies that want to sell the touristic product – Hotels, entertainment companies, etc.. Therefore, the sector became much more competitive forcing companies to improve their efficiency and effectiveness levels. Better business strategies are needed nowadays, engaging more and better products offerings, providing greater value to the client and increasing the productivity levels through better qualifications of the employees, and obtaining bigger synergies and scale economies. This phenomenon explains, in part, the concentration trend that is seen in the sector and that is a consequence of the market
players’ reduction, which themselves become bigger as they buy the small and inefficient companies around them, that don’t keep up the pace with the market’s competitiveness. This competition is also enhanced by the bet that many countries or regions are doing in the creation and growth of new touristic destinations. Countries or regions until recently regarded as nonexistent or even considered as impossible to operate in the tourism sector, appear on the market with new and innovative products and with very aggressive promotional campaigns supported by massive public investments. The traditional destinations face a new challenge that can be won only through the quality of service and the culture of tourism that their experience gives them and that they have to transform into higher value for their customers.
The public/private partnership in Tourism is furthermore increasingly urgent. Not only in the institutional promotion of the Tourist Destination but also in other areas traditionally in the scope of the public intervention but that are essential to the quality and international competitiveness of the destination. This includes public policies on territory planning, environment, transportation and its infrastructures, health, public security, entrance visas, management of cultural spaces and of the historical and cultural heritage, beyond other specific of each destination. For that purpose, it is necessary an effective partnership with the private economic agents, which are the main players of this industry. This public/private partnership is fundamental not only for the definition of the destination strategy, but also for its concretization. As such, the integrated management of a touristic destination with shared responsibilities between the different sectors of the public policy and, between these and the private sector, is a key factor to reach good levels of competitiveness in the global market.

GRUPO PESTANA SGPS MANAGEMENT REPORT FINANCIAL STATEMENTS
11
In Portugal the performance of the tourism sector in 2007 was positive. In the key Touristic regions it was verified growth in demand and improvement in product’s selling conditions. In Algarve, as in previous years, the recovery continued and, for many companies, it was the best Tourism year. In Madeira there was also a significant rise in demand that, together with the temporary closure of some units for renewals, lead to a significant improvement in some companies’ results, especially those of our Group. Also the Lisbon area, because of the publicity and increase in the demand occurred in the second semester of 2007 pushed by the Portuguese Presidency of the European Union, had a good evolution comparing with the previous homologous period, of which benefited, in first hand, the upper category units.
However, serious structural problems still affect the Tourism sector in Portugal, which weakens its position in the context of aggressive international competition.
Some of these structural problems, most of them carried forward from the past, include:
■ Lack of territory planning, that is verified in the existing urban chaos in some touristic regions, in the deficient cleanness of public touristic zones, in the lack of tourism signalization and in the deficient landscape environment;
■ The difficulty to fit the new touristic projects under the scope of greater plans of conservation and handling of the cultural, historical and natural patrimony, which complicates and delays, many times, the development of new initiatives;
■ The weak secondary roads network, inclusive in some of the most important national touristic zones;
■ The labour legislation that does not attend the specific needs of an extremely seasonal activity, not allowing, at a time of extreme global competition, the optimization of the companies’ operations;
■ The comparatively insufficient promotion that Portugal makes of its destinations, contrasting with neighbour countries and other destinations that, all around the world, strongly invest to turn the Tourism a significant component of their GDP;
■ The little professional attitude towards the tourist in some units, as restaurants, hotels, stores and other services, many times motivated by a wrong perception of the importance and potentiality of this sector for the Portuguese economy.
Although some recent improvements, due to the present importance that Tourism has, and that will be able to have in the Portuguese economy, we can say that Portugal still misses a true “Tourism culture”.
For 2008 there are clear signals of a slowdown in the growth rate that the sector has been experiencing, especially in the western countries economies, which are the ones that most influences the Grupo Pestana, SGPS performance. The oil prices climb, the crisis in the financial markets, the effects of speculation on raw materials and food products markets and the economic slowdown, creates a recession atmosphere of which Tourism is not immune. However, fortunately for this sector’s players, the interest in traveling and meeting new destinations or live new experiences still strongly remain.

GRUPO PESTANA SGPS MANAGEMENT REPORT FINANCIAL STATEMENTS
12
Introduction
In the activity of the Group companies, the following investments should be pointed out:
■ Deep renewal of the Pestana Casino Park Hotel in Funchal, which reopened in March 2007 after 8 months of temporary closure.
■ Continuation of construction works of the Group’s future hotels in Porto Santo, Caracas and Sao Tome which have openings planned, by this order, for the first half of 2008.
■ Starting the construction of the future Pestana Chelsea Bridge in London and the launch of the new product Pestana Investhotel for selling part of that unit.
■ Start the large renewal of the Pestana D. João II in Algarve, with its temporary closure.
■ Continuation of the construction of the future Pestana Promenade in Funchal with opening planned for the beginning of 2009.
■ The remodelling of four “Pousadas” -Manteigas, Valença, Ourém and Caniçada in Gerês, following
the global up-grade effort to these physical structures under Group’s management.
■ Continuation of construction works in the new “Pousada” of Viseu and “Palácio do Freixo” in Porto.
■ The launch of Pestana Residence, new Group division for the touristic real estate segment.
■ Start-up the new e-learning application with the goal of increasing the skills of Group employees.
■ The launch of SRM – Purchases web-site common to all Group in Portugal, with the objective to improve savings and gain larger synergies.
■ Merge of the travel agencies Intervisa and Viva Travel in the company Intervisa Solutions, having agencies in Lisbon, Porto, Funchal and Algarve.
Therefore, the Group continued its organic growth process following its strategy of enhancement of the two brands under Group’s management: “Pestana Hotels & Resorts” and “Pousadas de Portugal”. This strategy aims to turn the Pestana Group into a
3. THE YEAR 2007 FOR THE CONSOLIDATED UNIVERSE OF GRUPO PESTANA – S.G.P.S.

GRUPO PESTANA SGPS MANAGEMENT REPORT FINANCIAL STATEMENTS
13
player even more competitive in a highly globalised and aggressive environment.
This strategy has three foundations:
■ Horizontal integration which means the expansion of the Group core business – Tourism Hotels. Therefore, the Group experience in the Traditional Hotels Business and in “Time Sharing” has been extended to other tourist destinations and to complementary sectors as Touristic Real Estate. Following this process, in 2007 were launched two new products – Investhotel in United Kingdom and the Pestana Residence in Portugal and Brazil.
■ Vertical Integration – this strategic concept consists in the businesses diversification within the chain of value. The diversification was reached through activity in other tourism sub-sectors, namely in the touristic animation – management of Casinos, thematic parks, golf courses, leisure real estate and in the touristic operation/distribution, in Portugal and abroad. The rational of this process was, on one hand, to create distribution channels where the Group could have a significant influence to reduce the dependence levels from the great players of this market, and, on the other hand, to develop, downstream to the hotels business, operations that could allow it to increase the attractiveness of hotels’ products, being able to present to the market more complete products.
■ Projects Flexibility – in contrast to other growing processes, the new units adapted to their locations. Homogeneous service standards are a constant, but products and concepts are adapted to the customers’ expectations regarding the tourist destinations where the investments are located, following the principle: importance of delivering special attention to the needs and desires of our customers.
The fulfilment of the Pestana Group vision – To grow with strength and passion in the five Continents – has been allowing the Group to enlarge its services to a
growing number of costumers. Even the costumers that are faithful to our products have been changing throughout these 36 years of history. They are better informed, have more options and are more demanding and sophisticated. Our activity must be developed in order to satisfy their needs and interests and, therefore, the adherence to change and innovation is crucial to conquer the confidence of these customers and to establish long term relationships.
Achieving this goal, we will be able to consolidate our business and to have a sustained development.

GRUPO PESTANA SGPS MANAGEMENT REPORT FINANCIAL STATEMENTS
14
Results obtained in 2007 by Geographical Area
TURNOVER GOP (1)
Amount Δ 2007/2006 Amount Δ 2007/2006
2007 2006 2007 2006
Madeira 83,3 72,4 +15,1% 37,4 29,6 +26,3%
Algarve 52,3 60,0 -12,8% 20,7 23,3 -11,2%
Gr. Lisboa Porto 63,4 57,2 +10,8% 13,8 9,9 +39,4%
Internacional 11,7 10,7 +9,3% 4,1 3,0 +36,7%
210,7 200,3 +5,2% 76,0 65,8 +15,5%
Amounts in Million EURO
Geographical Area
(1) G.O.P. – Gross Operational Profit – is the EBITDA of each hotel excluding the shared services administrative costs and the Administration accounts.
Naturally, the good tourist year of 2007 reflected in the results. This good performance follows the trend of a positive year observed in 2006. When compared to 2006, the turnover increased 10,4 million EURO, corresponding to a GOP increase of 10,2 million EURO. These figures represent the good cost management by the Group, since the change of turnover is almost equal to the change in GOP.
Also the Group’s operational “Leverage” was very good, getting closer of 3. In geographical terms, the profitability increased is not generalized only because of Algarve. And even in this geographic area the negative variation only occurred in the real estate segment, originated in an excellent year of 2006 that can not be repeated, also because lack of inventories for sale, in 2007.
The profitability increased at significant rates in all other geographic areas, even in Madeira, which is the Group’s main region representing almost half
of the operational profitability, the growth was of 26.3%, which is very substantial.
The International Area has grown once again, although this value does not represent all the presence of the Group Pestana outside Portugal, since the Brazil’s operation, the most valuable international operation, and also, since 2006, the Mozambique area, are outside the consolidation perimeter of the Grupo Pestana - SGPS, S.A..
If these two operations were included under this perimeter, in 2007, the International Area Turnover would be higher in approximately 40 million EURO and the GOP in approximately 11 million EURO. It should be noted that he region of Great Lisbon and Porto, which includes the ”Pousadas de Portugal” and was the area with higher growth, managed to increase its profitability once again, which is being done on a sustained basis since 2003.
GRUPO PESTANA SGPS MANAGEMENT REPORT FINANCIAL STATEMENTS
15
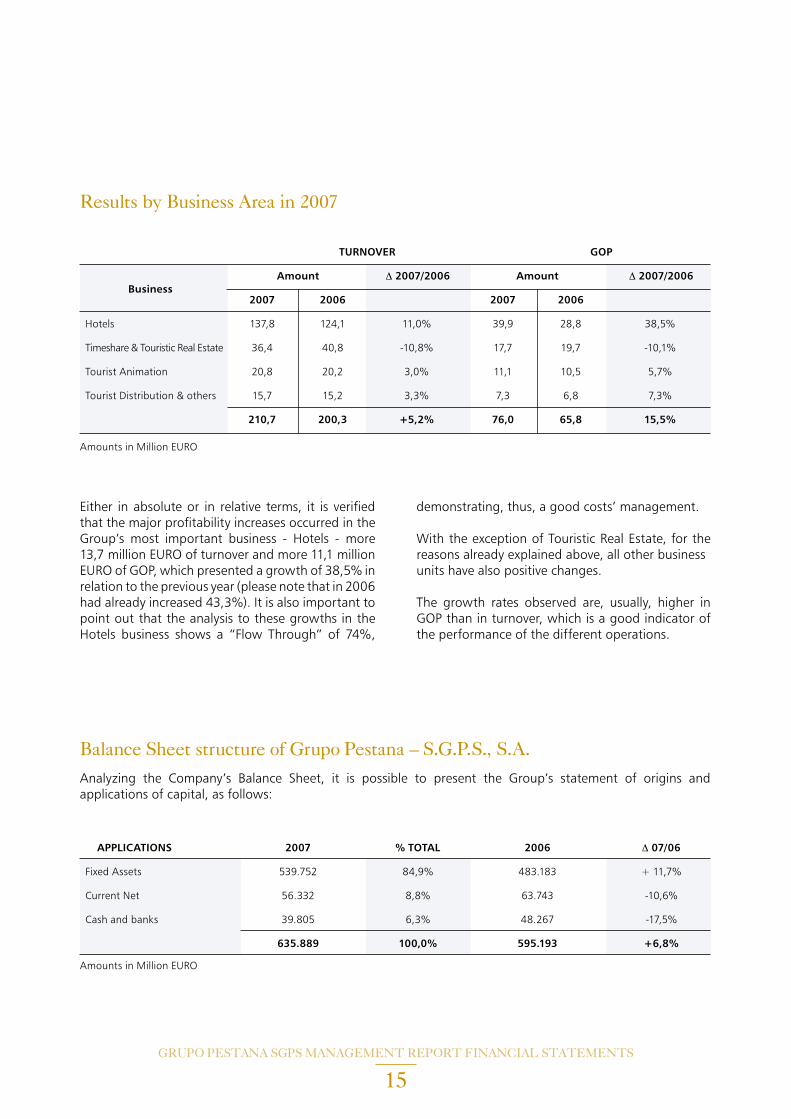
Results by Business Area in 2007
TURNOVER GOP
Amount Δ 2007/2006 Amount Δ 2007/2006
2007 2006 2007 2006
Hotels 137,8 124,1 11,0% 39,9 28,8 38,5%
Timeshare & Touristic Real Estate 36,4 40,8 -10,8% 17,7 19,7 -10,1%
Tourist Animation 20,8 20,2 3,0% 11,1 10,5 5,7%
Tourist Distribution & others 15,7 15,2 3,3% 7,3 6,8 7,3%
210,7 200,3 +5,2% 76,0 65,8 15,5%
Amounts in Million EURO
Business
Either in absolute or in relative terms, it is verified that the major profitability increases occurred in theGroup’s most important business - Hotels - more 13,7 million EURO of turnover and more 11,1 million EURO of GOP, which presented a growth of 38,5% in relation to the previous year (please note that in 2006 had already increased 43,3%). It is also important to point out that the analysis to these growths in the Hotels business shows a “Flow Through” of 74%,
demonstrating, thus, a good costs’ management.
With the exception of Touristic Real Estate, for the reasons already explained above, all other businessunits have also positive changes.
The growth rates observed are, usually, higher in GOP than in turnover, which is a good indicator of the performance of the different operations.
Balance Sheet structure of Grupo Pestana – S.G.P.S., S.A.
APPLICATIONS 2007 % TOTAL 2006 Δ 07/06
Fixed Assets 539.752 84,9% 483.183 + 11,7%
Current Net 56.332 8,8% 63.743 -10,6%
Cash and banks 39.805 6,3% 48.267 -17,5%
635.889 100,0% 595.193 +6,8%
Amounts in Million EURO
Analyzing the Company’s Balance Sheet, it is possible to present the Group’s statement of origins and applications of capital, as follows:

GRUPO PESTANA SGPS MANAGEMENT REPORT FINANCIAL STATEMENTS
16
ORIGINS 2007 % TOTAL 2006 Δ 07/06
Shareholder’s equity 223.260 35,1% 220.375
Minority interests 77.584 12,2% 69.358
Debts to Shareholders 6.663 1,1% 11.886
Shareholder’s equity or Equivalent 307.507 48,4% 301.619 +2,0%
Provisions for risks and charges 408 0,1% 398
Financial liabilities – medium / long term 185.722 29,2% 159.382
Total Permanent Capital 493.637 77,6% 461.399 +7,0%
Financial liabilities – short term 86.276 13,6% 82.140
Accruals and deferrals 55.977 8,8% 51.654
635.889 100,0% 595.193 + 6,8%
Balance Sheet structure of Grupo Pestana – S.G.P.S., S.A.
Amounts in Million EURO
The Capital Applications comprise mainly Fixed assets, representing more than 85% of the total. This Fixed assets weight reflects the Company’s core business – Hotels – and the strategic option to hold the propriety of the majority of the operated units. This option, which is not aligned with the policy that has been followed in the last years by other hotels chains, which prefer to concentrate in the units’ management leaving the property to another type of companies or investors, implies, on one hand, a slower growth in terms of number of units and beds managed, but, on the other hand, turns the Company’s Balance Sheet stronger giving sustainability to the growth achieved.
The Balance Sheet strength can also be evaluated by the Financial liabilities/Fixed assets ratio, which is 50,4%, and by the weight of permanent capital, which is 77,6%.
The partial securitisation of the assets, mainly the Fixed assets, keeping them under the Group’s management, a very common operation in tourism companies and already tested by the Group in some units, would allow to liquidate all the financial liabilities. Indeed, the value of fixed assets is almost twice the total of financial liabilities and fixed assets contain significant potential capital gains since its majority is booked at acquisition cost.
At last, we stress that medium and long term financial liabilities, in its majority, bear interests at fixed rates.
GRUPO PESTANA SGPS MANAGEMENT REPORT FINANCIAL STATEMENTS
17
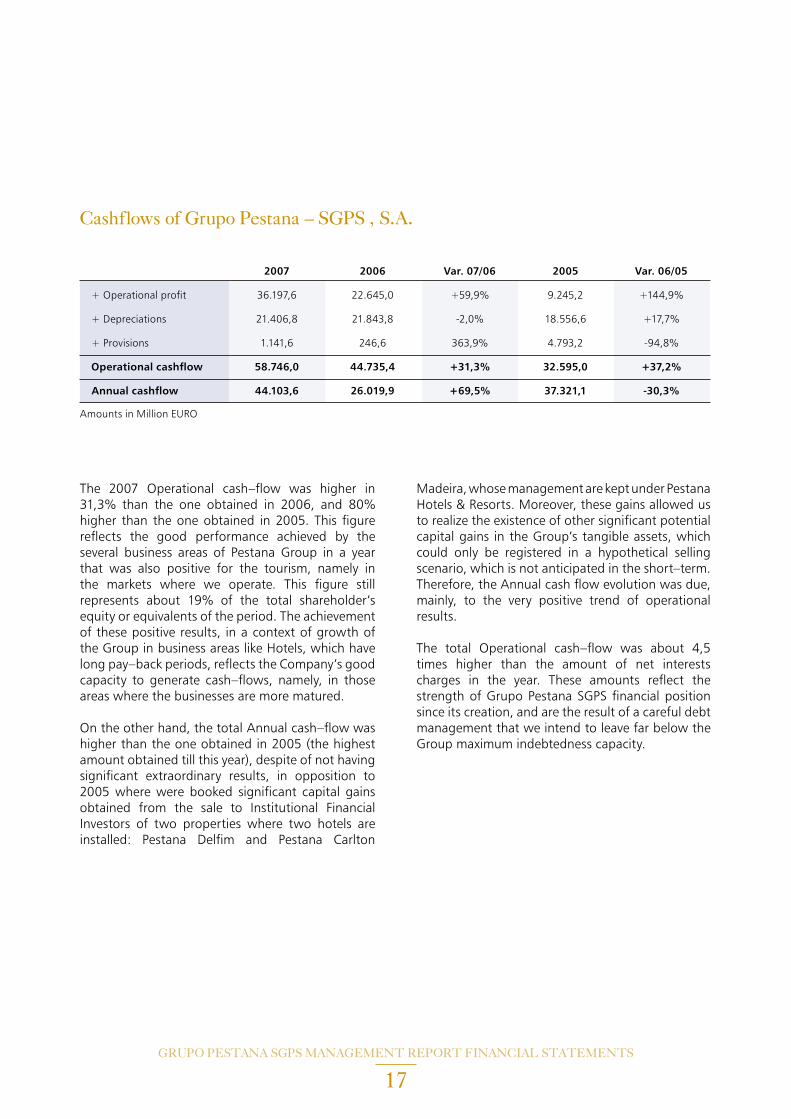
Cashflows of Grupo Pestana – SGPS , S.A.
2007 2006 Var. 07/06 2005 Var. 06/05
+ Operational profit 36.197,6 22.645,0 +59,9% 9.245,2 +144,9%
+ Depreciations 21.406,8 21.843,8 -2,0% 18.556,6 +17,7%
+ Provisions 1.141,6 246,6 363,9% 4.793,2 -94,8%
Operational cashflow 58.746,0 44.735,4 +31,3% 32.595,0 +37,2%
Annual cashflow 44.103,6 26.019,9 +69,5% 37.321,1 -30,3%
Amounts in Million EURO
The 2007 Operational cash–flow was higher in 31,3% than the one obtained in 2006, and 80% higher than the one obtained in 2005. This figure reflects the good performance achieved by the several business areas of Pestana Group in a year that was also positive for the tourism, namely in the markets where we operate. This figure still represents about 19% of the total shareholder’s equity or equivalents of the period. The achievement of these positive results, in a context of growth of the Group in business areas like Hotels, which have long pay–back periods, reflects the Company’s good capacity to generate cash–flows, namely, in those areas where the businesses are more matured.
On the other hand, the total Annual cash–flow was higher than the one obtained in 2005 (the highest amount obtained till this year), despite of not having significant extraordinary results, in opposition to 2005 where were booked significant capital gains obtained from the sale to Institutional Financial Investors of two properties where two hotels are installed: Pestana Delfim and Pestana Carlton
Madeira, whose management are kept under Pestana Hotels & Resorts. Moreover, these gains allowed us to realize the existence of other significant potential capital gains in the Group’s tangible assets, which could only be registered in a hypothetical selling scenario, which is not anticipated in the short–term. Therefore, the Annual cash flow evolution was due, mainly, to the very positive trend of operational results.
The total Operational cash–flow was about 4,5 times higher than the amount of net interests charges in the year. These amounts reflect the strength of Grupo Pestana SGPS financial position since its creation, and are the result of a careful debt management that we intend to leave far below the Group maximum indebtedness capacity.

GRUPO PESTANA SGPS MANAGEMENT REPORT FINANCIAL STATEMENTS
18
The Company’s activity, from an individual perspective, is acting as a holding company and during 2007 the following operations can be highlighted:
■ increase up to 80,96% the share capital in Pestana Inversiones, a Spanish entity;
■ add to 1,81% in share capital of SALVOR, S.A.;
■ merger of Viva Travel with Intervisa in the new Intervisa – Travel Solutions, SA, losing our company the majority of the share capital;
■ follow–on the effort of centralized treasury management policy, in order to improve efficiency in the usage of the Group’s cash positions.
The Company’s individual financial statements present total assets of Euro 282.324.398,48 and shareholders’ equity of Euro 182.172.467,96, including a net income for the year of Euro 12.703.044,17. The liabilities, amounting to approximately 100 million
EURO, include 43,4 million EURO of bank loans and 53,5 million EURO of cash–pooling applications made by group companies in the holding, of which approximately 30 million EURO are applied by Grupo Pestana SGPS in other companies of Pestana Group.
The 2007 net income was mainly due to the application of the equity method in the accounting of affiliated companies, by the goodwill depreciations, of acquisitions carried out in the past, and by interests charges related with the financing of these acquisitions. The great evolution of net income is due to the good operational performance showed in 2007 by the different business units.
4. INDIVIDUAL FINANCIAL STATEMENTS OF GRUPO PESTANA SGPS
5. PROFIT ALLOCATION PROPOSAL
As a consequence of the previously mentioned facts and considering the Company’s economical and financial position, we propose the following allocation of the 2007 net income, amounting to Euro 12.703.044,17:
6. LIABILITIES TO THE STATE AND SOCIAL SECURITY
The universe of the consolidated companies has its situation regularized with the State and with the Social Security.
Legal reserve €640.000,00
Retained earnings €12.063.044,17
GRUPO PESTANA SGPS MANAGEMENT REPORT FINANCIAL STATEMENTS
20
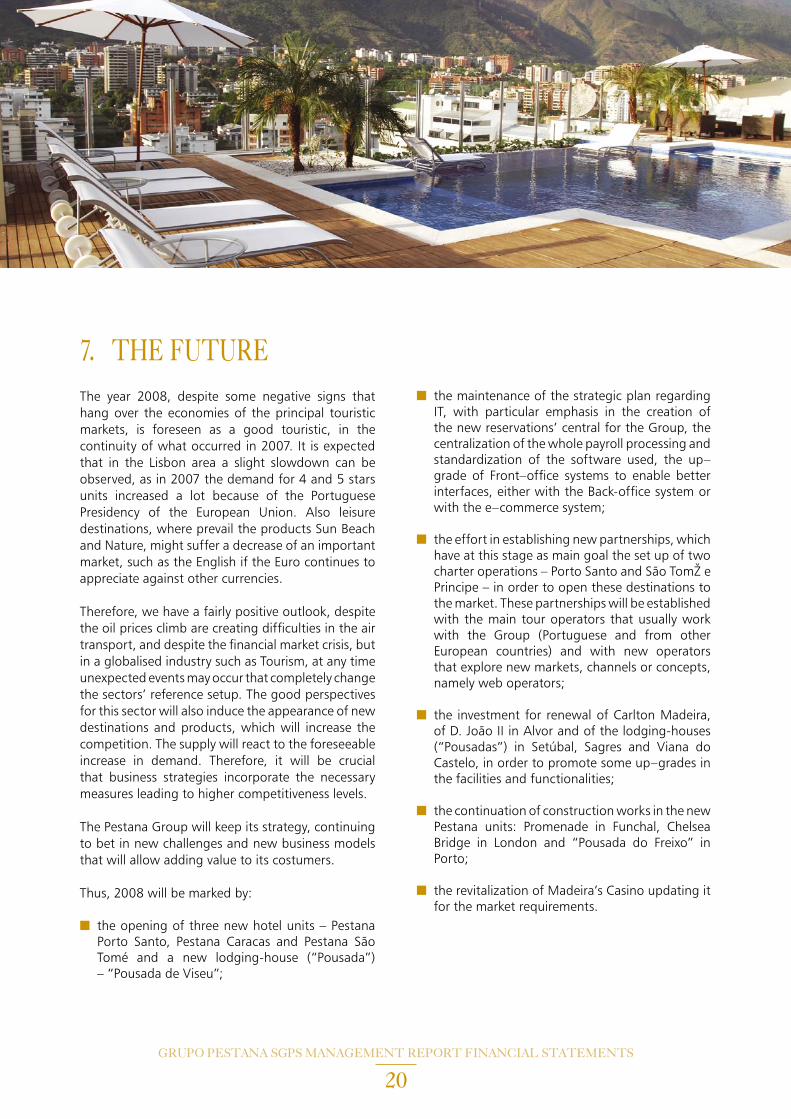
7. THE FUTURE The year 2008, despite some negative signs that hang over the economies of the principal touristic markets, is foreseen as a good touristic, in the continuity of what occurred in 2007. It is expected that in the Lisbon area a slight slowdown can be observed, as in 2007 the demand for 4 and 5 stars units increased a lot because of the Portuguese Presidency of the European Union. Also leisure destinations, where prevail the products Sun Beach and Nature, might suffer a decrease of an important market, such as the English if the Euro continues to appreciate against other currencies.
Therefore, we have a fairly positive outlook, despite the oil prices climb are creating difficulties in the air transport, and despite the financial market crisis, but in a globalised industry such as Tourism, at any time unexpected events may occur that completely change the sectors’ reference setup. The good perspectives for this sector will also induce the appearance of new destinations and products, which will increase the competition. The supply will react to the foreseeable increase in demand. Therefore, it will be crucial that business strategies incorporate the necessary measures leading to higher competitiveness levels. The Pestana Group will keep its strategy, continuing to bet in new challenges and new business models that will allow adding value to its costumers.
Thus, 2008 will be marked by:
■ the opening of three new hotel units – Pestana Porto Santo, Pestana Caracas and Pestana São Tomé and a new lodging-house (“Pousada”) – “Pousada de Viseu”;
■ the maintenance of the strategic plan regarding IT, with particular emphasis in the creation of the new reservations’ central for the Group, the centralization of the whole payroll processing and standardization of the software used, the up–grade of Front–office systems to enable better interfaces, either with the Back-office system or with the e–commerce system;
■ the effort in establishing new partnerships, which have at this stage as main goal the set up of two charter operations – Porto Santo and São TomŽ e Principe – in order to open these destinations to the market. These partnerships will be established with the main tour operators that usually work with the Group (Portuguese and from other European countries) and with new operators that explore new markets, channels or concepts, namely web operators;
■ the investment for renewal of Carlton Madeira, of D. João II in Alvor and of the lodging-houses (“Pousadas”) in Setúbal, Sagres and Viana do Castelo, in order to promote some up–grades in the facilities and functionalities;
■ the continuation of construction works in the new Pestana units: Promenade in Funchal, Chelsea Bridge in London and “Pousada do Freixo” in Porto;
■ the revitalization of Madeira’s Casino updating it for the market requirements.

GRUPO PESTANA SGPS MANAGEMENT REPORT FINANCIAL STATEMENTS
21
8. RELEVANT FACTS ALREADY OCCURRED IN 2008 Of the facts that have already occurred in 2008 was the “soft opening” of Pestana Porto Santo hotel in February, after almost 24 months of construction works and an investment of 40 million EURO. We also highlight the last phase of the renewal in Pestana Carlton Madeira that meant its closure in January and February.
9. THANKS The Board of Directors of Grupo Pestana –S.G.P.S., S.A., as well as their colleagues who carry out administration functions in other Group companies, would like to express their deepest thanks to all the public and private entities that, directly and indirectly, have supported and worked with our Group.
To our clients, suppliers and other business partners, namely financial institutions and other professional services providers, our recognition for all the trust showed in the development of our Group.
The Board of Directors would like to emphasize the support and cooperation that the General Shareholders Meeting Chairman and the Statutory Supervisory Board Members showed in fulfilling their duties.
Finally, we would like to enhance the great professional spirit and sense of duty of all the staff working with Group Pestana. Its effort and devotion are the reason that makes possible the creation of value by which the Group Pestana is responsible.
Funchal, 28 April 2008
The Board of Directors
Dionísio Fernandes Pestana - ChairmanPietro Luigi Valle - Member José Alexandre Lebre Theotónio – Member
CON
SOLI
DAT
EDBa
lance
She
et
GRUPO PESTANA SGPS MANAGEMENT REPORT FINANCIAL STATEMENTS
23
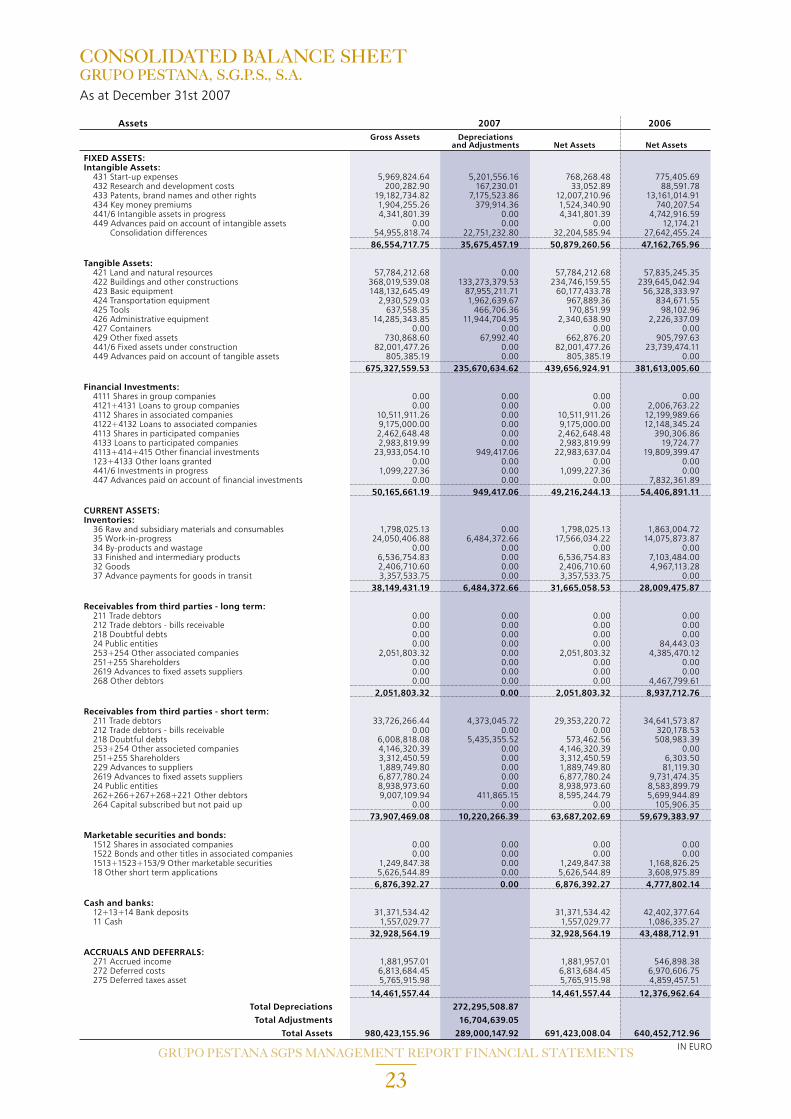
CONSOLIDATED BALANCE SHEETGRUPO PESTANA, S.G.P.S., S.A. As at December 31st 2007
Assets 2007 2006 Gross Assets Depreciations and Adjustments Net Assets Net Assets
FIXED ASSETS: Intangible Assets: 431 Start-up expenses 5,969,824.64 5,201,556.16 768,268.48 775,405.69 432 Research and development costs 200,282.90 167,230.01 33,052.89 88,591.78 433 Patents, brand names and other rights 19,182,734.82 7,175,523.86 12,007,210.96 13,161,014.91 434 Key money premiums 1,904,255.26 379,914.36 1,524,340.90 740,207.54 441/6 Intangible assets in progress 4,341,801.39 0.00 4,341,801.39 4,742,916.59 449 Advances paid on account of intangible assets 0.00 0.00 0.00 12,174.21 Consolidation differences 54,955,818.74 22,751,232.80 32,204,585.94 27,642,455.24 86,554,717.75 35,675,457.19 50,879,260.56 47,162,765.96
Tangible Assets: 421 Land and natural resources 57,784,212.68 0.00 57,784,212.68 57,835,245.35 422 Buildings and other constructions 368,019,539.08 133,273,379.53 234,746,159.55 239,645,042.94 423 Basic equipment 148,132,645.49 87,955,211.71 60,177,433.78 56,328,333.97 424 Transportation equipment 2,930,529.03 1,962,639.67 967,889.36 834,671.55 425 Tools 637,558.35 466,706.36 170,851.99 98,102.96 426 Administrative equipment 14,285,343.85 11,944,704.95 2,340,638.90 2,226,337.09 427 Containers 0.00 0.00 0.00 0.00 429 Other fixed assets 730,868.60 67,992.40 662,876.20 905,797.63 441/6 Fixed assets under construction 82,001,477.26 0.00 82,001,477.26 23,739,474.11 449 Advances paid on account of tangible assets 805,385.19 0.00 805,385.19 0.00 675,327,559.53 235,670,634.62 439,656,924.91 381,613,005.60
Financial Investments: 4111 Shares in group companies 0.00 0.00 0.00 0.00 4121+4131 Loans to group companies 0.00 0.00 0.00 2,006,763.22 4112 Shares in associated companies 10,511,911.26 0.00 10,511,911.26 12,199,989.66 4122+4132 Loans to associated companies 9,175,000.00 0.00 9,175,000.00 12,148,345.24 4113 Shares in participated companies 2,462,648.48 0.00 2,462,648.48 390,306.86 4133 Loans to participated companies 2,983,819.99 0.00 2,983,819.99 19,724.77 4113+414+415 Other financial investments 23,933,054.10 949,417.06 22,983,637.04 19,809,399.47 123+4133 Other loans granted 0.00 0.00 0.00 0.00 441/6 Investments in progress 1,099,227.36 0.00 1,099,227.36 0.00 447 Advances paid on account of financial investments 0.00 0.00 0.00 7,832,361.89 50,165,661.19 949,417.06 49,216,244.13 54,406,891.11
CURRENT ASSETS: Inventories: 36 Raw and subsidiary materials and consumables 1,798,025.13 0.00 1,798,025.13 1,863,004.72 35 Work-in-progress 24,050,406.88 6,484,372.66 17,566,034.22 14,075,873.87 34 By-products and wastage 0.00 0.00 0.00 0.00 33 Finished and intermediary products 6,536,754.83 0.00 6,536,754.83 7,103,484.00 32 Goods 2,406,710.60 0.00 2,406,710.60 4,967,113.28 37 Advance payments for goods in transit 3,357,533.75 0.00 3,357,533.75 0.00 38,149,431.19 6,484,372.66 31,665,058.53 28,009,475.87
Receivables from third parties - long term: 211 Trade debtors 0.00 0.00 0.00 0.00 212 Trade debtors - bills receivable 0.00 0.00 0.00 0.00 218 Doubtful debts 0.00 0.00 0.00 0.00 24 Public entities 0.00 0.00 0.00 84,443.03 253+254 Other associated companies 2,051,803.32 0.00 2,051,803.32 4,385,470.12 251+255 Shareholders 0.00 0.00 0.00 0.00 2619 Advances to fixed assets suppliers 0.00 0.00 0.00 0.00 268 Other debtors 0.00 0.00 0.00 4,467,799.61 2,051,803.32 0.00 2,051,803.32 8,937,712.76
Receivables from third parties - short term: 211 Trade debtors 33,726,266.44 4,373,045.72 29,353,220.72 34,641,573.87 212 Trade debtors - bills receivable 0.00 0.00 0.00 320,178.53 218 Doubtful debts 6,008,818.08 5,435,355.52 573,462.56 508,983.39 253+254 Other associeted companies 4,146,320.39 0.00 4,146,320.39 0.00 251+255 Shareholders 3,312,450.59 0.00 3,312,450.59 6,303.50 229 Advances to suppliers 1,889,749.80 0.00 1,889,749.80 81,119.30 2619 Advances to fixed assets suppliers 6,877,780.24 0.00 6,877,780.24 9,731,474.35 24 Public entities 8,938,973.60 0.00 8,938,973.60 8,583,899.79 262+266+267+268+221 Other debtors 9,007,109.94 411,865.15 8,595,244.79 5,699,944.89 264 Capital subscribed but not paid up 0.00 0.00 0.00 105,906.35 73,907,469.08 10,220,266.39 63,687,202.69 59,679,383.97 Marketable securities and bonds: 1512 Shares in associated companies 0.00 0.00 0.00 0.00 1522 Bonds and other titles in associated companies 0.00 0.00 0.00 0.00 1513+1523+153/9 Other marketable securities 1,249,847.38 0.00 1,249,847.38 1,168,826.25 18 Other short term applications 5,626,544.89 0.00 5,626,544.89 3,608,975.89 6,876,392.27 0.00 6,876,392.27 4,777,802.14 Cash and banks: 12+13+14 Bank deposits 31,371,534.42 31,371,534.42 42,402,377.64 11 Cash 1,557,029.77 1,557,029.77 1,086,335.27 32,928,564.19 32,928,564.19 43,488,712.91 ACCRUALS AND DEFERRALS: 271 Accrued income 1,881,957.01 1,881,957.01 546,898.38 272 Deferred costs 6,813,684.45 6,813,684.45 6,970,606.75 275 Deferred taxes asset 5,765,915.98 5,765,915.98 4,859,457.51
14,461,557.44 14,461,557.44 12,376,962.64
Total Depreciations 272,295,508.87
Total Adjustments 16,704,639.05
Total Assets 980,423,155.96 289,000,147.92 691,423,008.04 640,452,712.96
IN EURO

GRUPO PESTANA SGPS MANAGEMENT REPORT FINANCIAL STATEMENTS
24
CONSOLIDATED BALANCE SHEETGRUPO PESTANA, S.G.P.S., S.A. As at December 31st 2007
SHAREHOLDERS’ EQUITY AND LIABILITIES 2007 2006 SHAREHOLDERS’ EQUITY: 51 Capital 80,000,000.00 80,000,000.00
Acções (quotas) Próprias: 521 Par value 0.00 0.00 522 Premiums and discounts 0.00 0.00 53 Supplementary capital 21,000,000.00 25,403,625.00 54 Premiums on issuance of shares 33,716,655.44 33,690,973.24 55 Adjustments to investments in affiliated and associated companies -829,663.76 1,514,051.35 56 Revaluation reserves 0.00 0.00 Consolidation differences 28,535,809.89 40,443,529.87 Conversion differences -1,206,073.24 -534,449.32
Reserves: 571 Legal reserves 325,931.50 325,928.14 572 Statutory reserves 0.00 0.00 573 Contractual reserves 0.00 0.00 574 a 579 Other reserves 18,686,949.23 12,661,276.43 59 Retained earnings 27,997,396.61 24,876,639.65 Sub total 208,227,005.67 218,381,574.36 88 Net profit/(loss) for the year 15,032,697.89 1,993,351.00 89 Anticipated dividends 0.00 0.00 Total Shareholders’ equity 223,259,703.56 220,374,925.36 Minority Interests 77,583,719.59 69,358,287.34
LIABILITIES: Provisions : 291 Provision for pensions 8,382.86 73,834.62 292 Provision for taxes 93,409.40 31,956.21 293/8 Other provisions 306,233.38 292,546.96 408,025.64 398,337.79 Debts to third parties - long term: 231+12 Bank loans 150,425,531.05 146,989,086.95 2612 Fixed assets suppliers - bills payable 0.00 0.00 251+255 Shareholders 6,644,225.19 5,128,516.58 239 Other loans 29,979,126.84 4,837,889.96 2611 Fixed assets suppliers 0.00 0.00 2613 Fixed assets suppliers - Leasing 5,316,962.76 5,378,515.43 24 Public entities 0.00 0.00 265+268 Other creditors 0.00 2,175,885.57 192,365,845.84 164,509,894.49 Debts to third parties - short term: Bonds: 2321 Convertible 0.00 0.00 2322 Non convertible 0.00 0.00 233 Other titled loans 0.00 0.00 231+12 Bank loans 85,730,682.36 75,068,696.03 269 Advances received on account of sales 0.00 86,594.76 221 Trade creditors 15,728,197.13 13,797,451.66 228 Trade creditors - outstanding invoices 24,201.93 94,424.62 222 Trade creditors - bills payable 0.00 276,404.53 2612 Fixed assets suppliers - bills payable 0.00 0.00 253+254 Other associated companies 0.00 0.00 251+255 Shareholders 18,962.22 6,757,637.40 219 Advances from trade debtors 641,515.07 1,193,478.38 239 Other loans 474,593.43 2,561,075.46 2611 Fixed assets suppliers 8,639,868.80 7,070,982.93 2613 Fixed assets suppliers - Leasing 72,004.85 0.00 24 Public entities 5,032,389.49 4,757,463.81 262+263+264+265+267+268+211 Other creditors 11,004,658.46 10,116,111.16 127,367,073.74 121,780,320.74 Accruals and deferrals: 273 Accrued costs 18,976,517.60 17,914,699.73 274 Deferred income 25,184,883.84 20,507,389.39 276 Deferred taxes liability 26,277,238.23 25,608,858.12 70,438,639.67 64,030,947.24 Total liabilities 390,579,584.89 350,719,500.26 Total Shareholders’ equity, Minority interests and Liabilities 691,423,008.04 640,452,712.96
IN EURO

GRUPO PESTANA SGPS MANAGEMENT REPORT FINANCIAL STATEMENTS
25
CONSOLIDATED INCOME STATEMENT BY NATUREGRUPO PESTANA, S.G.P.S., S.A. For the year-ended December 31st 2007
COSTS AND LOSSES 2007 2006
61 Cost of goods sold and materials consumed: Goods 963,499.66 1,124,943.37
Raw and subsidiary materials and consumables 27,544,081.82 28,507,581.48 34,935,583.42 36,060,526.79
62 External services and supplies from third parties 67,387,826.70 61,178,793.86
64 Personnel costs: Wages (641+642) 48,846,273.37 51,654,996.58
Social charges:
Pensions (643+644) 100,656.00 295,888.23
Others (645/8) 13,915,413.28 62,862,342.65 14,325,789.27 66,276,674.08
Depreciations and amortizations of fixed assets (662+663) 21,406,752.72 21,843,797.23 Adjustments (666+667) 952,953.78 0.00
67 Provisions 188,689.09 22,548,395.59 246,368.59 22,090,165.82
63 Taxes 5,984,442.74 5,815,692.73
65 Other operational costs and losses 2,089,245.18 8,073,687.92 2,573,207.10 8,388,899.83
(A) 189,379,834.34 193,995,060.38 Depreciations and adjustments for financial investments (683+684) 5,030,942.29 4,238,811.86
Interests and similar costs:
Group Companies 0.00 -267,285.63
Losses on Group Companies 162,337.86 317,206.45
Others (681+685+686+687+688) 17,353,232.90 22,546,513.05 12,376,239.68 16,664,972.36
(C) 211,926,347.39 210,660,032.74
69 Extraordinary costs and losses 1,076,558.81 13,088,431.95
(E) 213,002,906.20 223,748,464.69 86 Income tax for the year 4,247,364.16 2,833,576.89
G) 217,250,270.36 226,582,041.58 Profit attributable to minority interests 6,522,476.69 1,936,165.34
88 Net profit/(loss) for the year 15,032,697.89 1,993,351.00
238,805,444.94 230,511,557.92
PROFITS AND GAINS 2007 2006
71 Sales: Goods 3,085,187.43 2,242,353.97
Products 5,201,542.29 13,727,094.49
72 Services rendered 202,391,785.72 210,678,515.44 184,344,345.88 200,313,794.34
Increase in stocks of finished products and work-in-process 266,962.30 0.00
75 Self constructed fixed assets 7,841,527.73 9,039,155.91
73 Supplementary revenue 5,300,282.71 6,399,661.31 74 Operational grants 231,416.71 68,618.78
76 Other operational profits and gains 13,483.02 38,339.66
77 Reversions of depreciations and adjustments 1,245,202.88 6,790,385.32 780,532.08 7,287,151.83
(B) 225,577,390.79 216,640,102.08 782 Gains in group and associated companies:
Group companies 2,717,191.34 2,625,459.57
Other companies 0.00 8,863.68
784 Dividends received
Gains in marketable securities and other financial aplications:
Group companies 1,565,643.80 1,226,518.09
Others (7812+7815+78162+783) 465,076.64 330,790.26
Other interests and similar gains:
Group companies 323,942.15 1,080,330.84
Others (7811+7813+7814+7818+785/788) 4,243,924.12 9,315,778.05 1,275,754.28 6,547,716.72
(D) 234,893,168.84 223,187,818.80 79 Extraordinary profits and gains 3,912,276.10 7,323,739.12
(F) 238,805,444.94 230,511,557.92
SUMMARY Operational profit/(loss): (B)-(A)= 36,197,556.45 22,645,041.70 Financial profit/(loss): (D-B)-(C-A)= -13,230,735.00 -10,117,255.64 Current profit/(loss): (D)-(C)= 22,966,821.45 12,527,786.06 Profit/(Loss) before income tax: (F)-(E)= 25,802,538.74 6,763,093.23 Consolidated profit/(loss) for the year including minority interests: (F) - (G) 21,555,174.58 3,929,516.34
IN EURO

GRUPO PESTANA SGPS MANAGEMENT REPORT FINANCIAL STATEMENTS
26
CONSOLIDATED INCOME STATEMENT BY FUNCTIONSGRUPO PESTANA, S.G.P.S., S.A. For the year-ended December 31st 2007
2007 2006
Sales and services rendered 210,678,515.44 202,018,562.86
Cost of sales and services rendered -132,885,976.67 -134,774,036.68
Gross margin 77,792,538.77 67,244,526.18
Other operational profits and gains 18,811,151.45 11,748,409.63
Distribution costs -8,577,149.77 -8,671,719.35
Administrative costs -25,368,312.31 -34,213,475.27
Other operational costs and losses -23,624,954.40 -20,778,892.41
Operational profit 39,033,273.74 15,328,848.78
Net funding costs -13,109,308.78 -11,040,857.17
Gains/(Losses) in group and associated companies -586,502.86 3,796,774.64
Gains/(Losses) in other investments 465,076.64 -1,303,407.87
Unusual gains/(losses) 0.00 0.00
Current profit and loss 25,802,538.74 6,781,358.38
Income tax over current profit and loss -4,247,364.16 -2,851,842.04
Current profit and loss after income tax 21,555,174.58 3,929,516.34
Extraordinary profit and loss 0.00 0.00
Income tax over extraordinary profit and loss 0.00 0.00
Profit attributable to minority interests -6,522,476.69 -1,936,165.34
Net profit/(loss) for the year 15,032,697.89 1,993,351.00
Net profit/(loss) per share 0.188 0.025
IN EURO

GRUPO PESTANA SGPS MANAGEMENT REPORT FINANCIAL STATEMENTS
27
CONSOLIDATED CASH-FLOWS STATEMENTGRUPO PESTANA, S.G.P.S., S.A. For the year-ended December 31st 2007
2007 2006 OPERATING ACTIVITIES Cash receipts from trade debtors 232,111,451.02 215,917,788.82 Cash paid to trade creditors -120,937,727.17 -124,885,925.68 Cash paid to employees -61,407,240.82 -59,920,040.07 Cash-flow from operations 49,766,483.02 31,111,823.07 Income taxes received/(paid) -3,862,593.55 -3,310,469.47 Other receipts/(payments) of operating activities 6,265,610.05 3,278,055.39 Cash-flow before extraordinary items 52,169,499.52 31,079,408.99 Cash received related to extraordinary items 0.00 409,667.66 Cash payments related to extraordinary items 0.00 -205,275.29 Net cash-flow from operating activities 52,169,499.52 31,283,801.36
INVESTMENT ACTIVITIES Receipts from: Investimentos financeiros 23,302,638.02 5,210,327.77 Tangible assets 2,440,882.52 8,053,312.19 Intangible assets 0.00 -337.32 Government grants 4,799,180.20 95,740.48 Interests and similar profits 5,325,974.62 195,648.50 Dividends 584,145.44 -208,095.24 Other receipts from investment activities 397,402.15 1,883,889.31 ..... Payments of: Financial investments -21,171,759.87 -4,002,860.45 Tangible assets -66,889,335.61 -47,015,349.56 Intangible assets -1,087,078.20 -4,504,940.07 Other payments of investment activities -1,721,150.59 -16,457,471.85 ..... Net cash-flow from investment activities -54,019,101.32 -56,750,136.24
FINANCING ACTIVITIES Receipts from: Loans obtained 61,573,310.49 53,720,700.44 Capital increases, supplementary capital and premiums 2,046,336.94 706,576.96 Grants and donations 0.00 31,342.00 Sales of own shares 0.00 0.00 Coverage of previous years losses 0.00 0.00 Other receipts from financing activities 0.00 2,046,682.62 ..... 0.00 11,568.00 Payments of: Loans obtained -48,714,555.37 -31,527,582.46 Capital amortization of leasing contracts -1,279,480.53 -935,033.40 Interests and similar costs -18,240,989.91 -10,402,003.41 Dividends -4,586,088.95 -5,808,849.78 Capital reimbursement and supplementary capital 0.00 0.00 Acquisition of own shares 0.00 0.00 Other payments of financing activities -324.35 0.00 ..... 0.00 Net cash-flow from financing activities -9,201,791.68 7,843,400.97
Net increase/(decrease) in cash and cash equivalents -11,051,393.47 -17,622,933.91 Cash of new consolidated companies 0.00 0.00 Exchange rate effect 8,349.00 7,411.41 Cash and cash equivalents at the beginning of the period 47,933,712.63 65,549,235.13 Cash and cash equivalents at the end of the period 36,890,668.16 47,933,712.63
NOTES TO THE CASH-FLOW STATEMENT 2007 2006 Cash 1,557,029.77 1,556,705.36 Bank deposits - current accounts 36,998,079.31 46,934,634.27 Other deposits until 3 months 0.00 0.00 Other financial aplications until 3 months 1,249,847.38 (224,803.16) Bank overdrafts (2,914,288.30) (332,823.84) Cash and cash equivalents at the end of the period 36,890,668.16 47,933,712.63 Other Cash and cash equivalents 2,914,288.30 332,802.42 Cash and cash equivalents at Balance Sheet 39,804,956.46 48,266,515.05
IN EURO

NOT
ES to
The C
onso
lidate
d Fi
nanc
ial S
tatem
ents

GRUPO PESTANA SGPS MANAGEMENT REPORT FINANCIAL STATEMENTS
29
Introduction
Group Pestana comprises Grupo Pestana, S.G.P.S., S.A. (Grupo Pestana SGPS or Company) and subsidiary companies (see Note 1), being Tourism its main activity. The Company prepares consolidated financial statements since 2003.
NOTES TO THE CONSOLIDATED FINANCIAL STATEMENTSGRUPO PESTANA, S.G.P.S., S.A. As at 31 December 2007
Hotel Location Hotel Location
Pestana Carlton Madeira Madeira Pestana Alvor Praia Algarve Pestana Miramar Madeira Pestana Alvor Park Algarve Pestana Village Madeira Pestana Delfim Algarve Pestana Palms Madeira Pestana Dom João II Algarve Pestana Atlantic Gardens Madeira Pestana Alvor Atlantico Algarve Pestana Casino Park Hotel Madeira Pestana Levante Algarve Pestana Bay Madeira Pestana Porches Praia Algarve Pestana Atalaia Madeira Pestana Viking Algarve Pestana Grand Madeira Pestana Gramacho Golf Resort Algarve Madeira Magic Madeira Pestana Vale da Pinta Golf Resort Algarve Casino da Madeira Madeira Pousadas de Portugal (Rede) Portugal Centro Intern. Neg. Madeira Madeira Pestana Convento Carmo Brasil Pestana Porto Santo a) Madeira Pestana Trópico Cabo Verde Pestana Promenade b) Madeira Pestana Kruger Lodge Africa Sul Pestana Palace Lisboa Pestana Buenos Aires Argentina Pestana Porto Porto Pestana Caracas (a) Venezuela Pestana Atlantic Gardens Cascais Pestana Londres (b) Reino UnidoPestana Sintra Golf Sintra Pestana Beloura Golf Resort Sintra
a) = Inauguration in the first semester of 2008 b) = Under construction
Besides the traditional hotels’ management activity, the Group also explores resorts in the periodic tenancy system (timeshare), tourist real estate activity, tourist distribution and entertainment.
The notes to the consolidated financial statements
As at 31 December 2007, Group Pestana includes 30 hotels (3 under construction), 3 golf courses, 1 casino, 1 thematic park, 41 lodging-houses (“Pousadas”), 1 travel agency and the management entity of Madeira’s International Business Center.
follow the sequential numbering defined in the Portuguese Official Plan of Accounts (POC).
Standard notes not included are either not applicable to the Company or their presentation is not relevant to the reading of the referred financial statements.

GRUPO PESTANA SGPS MANAGEMENT REPORT FINANCIAL STATEMENTS
30
Basis of consolidation
The consolidated financial statements have been prepared in accordance with the generally accepted accounting principles in Portugal and with the consolidation rules defined in POC, with the changes introduced by the Decree-law 238/91, of 2 July, and with the accounting directives from “Comissão de Normalização Contabilística” (CNC).
In 2007, the Grupo Pestana SGPS implemented a new IT application to support the preparation of the consolidated financial statements, being performed an extensive work in the validation of the opening balances and obtained a greater detail in the
intra-group balances and transactions elimination. These tasks were very time-consuming in this early stage, but it will be the basis to produce faster and more reliable consolidated information in the future.
In previous years, the sub-group Salvor, including the Africa companies, made a sub-consolidation, which was subsequently included in the consolidation of the Grupo Pestana SGPS.
For the first time in 2007, all companies were directly consolidated in the Company.
1. CONSOLIDATED COMPANIES The companies included in the consolidated financial statements, their registered office, consolidation method and proportion of capital held, as at 31 December 2007, are as follows:
% Capital % of ConsolidationCompanys’ name / Registered Office held control method
Grupo Pestana, S.G.P.S., S.A. Holding Holding Full Largo António Nobre, 1 -Funchal Pestana Investimentos -Projectos Industriais e Serviços S.A. 100,00% 100,00% Full Largo António Nobre, 1 -Funchal M. & J. Pestana -Sociedade de Turismo da Madeira, S.A. 76,79% 76,79% Full Largo António Nobre, 1 -Funchal ITI -Sociedade de Investimentos Turísticos na Ilha da Madeira, S.A. 76,79% 100,00% Full Rua Imperatriz D. Amélia, 55 -Funchal Hotéis Atlântico -Sociedade Imobiliária e de Gestão de Hotéis, S.A. 99,92% 99,92% Full Largo António Nobre, 1 -Funchal Ponta da Cruz -Sociedade Imobiliária e de Gestão de Hotéis, S.A. 39,66% 51,65% Full Largo António Nobre, 1 -Funchal Rio de Prata -Consultadoria e Participações, S.A. 99,90% 99,98% Full Largo António Nobre, 1 -Funchal CapeGreen -Consultadoria Económica e Participações, S.A. 54,88% 54.28% Full Largo António Nobre, 1 -Funchal Energólica -Produção de Energia Eléctrica, S.A. 63,00% 63,00% Full Largo António Nobre, 1 -Funchal Pestana Saúde e Vida, S.A. 100,00% 100,00% Full Largo António Nobre, 1 -Funchal Carlton Life, S.G.P.S., S.A. 65,00% 65,00% Full Av Visconde Valmor, 66 -4o -Lisboa Carlton Life – Serviços de Consultoria, S.A. 65,00% 100,00% Full Av Visconde Valmor, 66 -4o -Lisboa Carlton Life – Cuidados de Apoio, S.A. 65,00% 100,00% Full Av Visconde Valmor, 66 -4o -LisboaPestana Management 100,00% 100,00% Full Largo António Nobre, 1 - FunchalMundo da Imaginação 60,36% 77.50% Full Largo António Nobre, 1 - FunchalAplicações Múltiplas - Sociedade de Aplicações Financeiras, S.A. 83,00% 83,00% Full Rau Jau, 54 - Lisboa

GRUPO PESTANA SGPS MANAGEMENT REPORT FINANCIAL STATEMENTS
31
1. CONSOLIDATED COMPANIES % Capital % of ConsolidationCompanys’ name / Registered Office held control method
Grupo Pestana Pousadas - Investimentos Turísticos, S.A. 46,19% 59,80% Full Rua Jau, 54, freguesia de Alcântara, LisboaCarlton Palácio - Sociedade de Construção e Exploração Hoteleiras, S.A. 89,21% 100,00% Full Rua Tierno Galvan, Torre 3–6o - sala 601 - LisboaPorto Carlton - Sociedade de Construção e Exploração Hoteleira, S.A. 49,80% 60,00%I Full Praça da Ribeira, no1, 4050-513 Porto Guiatur - Empreendimentos Turísticos da Guia Cascais, S.A. 87,23% 99,99% Full Av. Manuel Júlio Carvalho e Costa, 115 - CascaisQuinta da Beloura Golfe, S.A. 76,59% 87,81% Full Rua das Sesmarias, no 3, Quinta da Beloura, SintraSalvor, Sociedade de Investimento Hoteleiro, S.A. 92,41% 92,41% Full R. Rodrigo da Fonseca, 77 - 5o - LisboaCarvoeiro Golfe, S.A. 92,41% 100,00% Full Ald. Turístico do Gramacho, Lt4 - CarvoeiroAmoreira - Aldeamento Turístico, Lda 92,41% 100,00% Full R. da Hortinha, 13 - 2A - PortimãoEurogolfe, S.A. 92,41% 100,00% Full Ald. Turístico do Gramacho, Lt4 - CarvoeiroCosta Brava, Construções, Lda 92,41%1 100,00% Full Vale de Currais - CarvoeiroSociedade Imobiliária Troia B3, S.A. 72,47% 80,00% Full R. da Prata, 10 - LisboaSociedade de Investimento Hoteleiro D. João II, S.A. 92,41% 100,00% Full Praia Sra da Rocha, Alporchinhos - Porches - LagoaViquingue, Sociedade Turística, S.A. 92,41% 100,00% Full Praia Sra da Rocha, Alporchinhos - Porches - LagoaSociedade Agrícola dos Arcos, Lda 92,41% 100,00% Full R. do Municipio Lt H 2oA - LeiriaSoc. Invest. Imob. Eira da Loba Lda. 82,01% 88,75% Full São Pedro e Poço dos Pardais - LagoaCarvoeiro Golfe Soc Mediação Imob Lda. 92,41% 100,00% Full Ald. Turístico do Gramacho, Lt4 - CarvoeiroEmpreendimentos Turísticos, Lda 54,88% 100,00% Full Cidade da Praia - Ilha de Santiago - Cabo VerdeArgentur Inversiones Turisticas S.A. 99,90% 100,00% Full Buenos Aires - ArgentinaCota Quarenta, S.A. 76,76% 99,96% Full Largo António Nobre 1 – Funchal SDM- Sociedade Desenvolvimento da Madeira, S.A. 15,00% 70,00% Full Rua da Mouraria 9, 1o andar, 9000-047 FunchalConvento do Carmo 34,64% 75,00% Full Rua do Carmo, s/n Pelourinho, 40301-330 SalvadorWild Break 29 (PTY), Lda 53,90% 50,00% Full Malelane 1320 -South AfricaSouthern Escapes Travel And Tourism (PTY), Lda. 53,90% 50,00% Full 1 Hettie Street Cyrildene -2198 JohannesburgPestana Inversiones, S.L. 99,96% 100,00% Full Pradillo, 5 Bajo Ext. dcha. -28002 MadridInversiones VistalParque, S.A. 76,41% 100,00% Full Primera Avenida Urbanización Santa Eduvigis-1071 CaracasHerdade da Abrunheira, S.A. 66,66% 100,00% Full Heradade Abrunheira, Freguesia Urra-PortalegreEnatur -Empresa Nacional de Turismo, S.A. 22,63% 49,00% Equity Method Avenida Santa Joana Princesa , no 10, 1700 LisboaAlbar -Sociedade Imobiliária do Barlavento, S.A. 50,00% 50,00% Equity Method Rua Tierno Galvan, Torre 3, sala 602, Amoreiras, 1070-274 LisboaEuroAtlantic Airways, Transportes Aéreos S.A. 20,00% 20,00% Equity Method Rua das Sesmarias, 3 Quinta da Beloura 2710-692 SintraIntervisa-Viagens e Turismo, S.A. 38,99% 38,99% Equity Method Av. Fontes Pereira de Melo, no6-1050-121 Lisboa

GRUPO PESTANA SGPS MANAGEMENT REPORT FINANCIAL STATEMENTS
32
2. COMPANIES EXCLUDED FROM THE CONSOLIDATION
% Capital % of ConsolidationCompanys’ name / Registered Office held control method
Djebel S.G.P.S, S.A. 39,50% 39,50% Acq. Cost Largo António Nobre, 1, Funchal
6. OTHER FINANCIAL INVESTMENTS (% OF OWNED SHARES GREATER THAN 10%)
% Capital % of ConsolidationCompanys’ name / Registered Office held control method
Salvintur, Sociedade de Investimentos Turísticos, S.A. 17,21% 2.747.158 52.808 Rau Jau, 54 -Lisboa
7. AVERAGE NUMBER OF EMPLOYEES During 2007 and 2006, the average number of employees serving the consolidated companies was 3.432 and 3.363, respectively.
8. APPROPRIATE AND FAIR PRESENTATION In order to allow the appropriate and fair presentation of the consolidated financial statements, all income and expenses related to Timeshare transactions in units managed by the consolidated companies are not deferred throughout the period of the related contract but fully recognized in the profit and loss for the year in which they occur.
The impact of this procedure in the consolidated financial statements can be analyzed as follows:
This investment in Djebel is booked at the acquisition cost, as the last part of share capital acquired, representing 20%, is available for sale.

GRUPO PESTANA SGPS MANAGEMENT REPORT FINANCIAL STATEMENTS
33
Description 2007 2006
Inventories -2.813.468,41 -3.042.583,50 Deferred costs -36.612.493,46 -30.922.395,99
Sub-Total -39.425.961,87 -33.964.979,49
Consolidation 50.214.673,03 50.126.939,30 Net results 3.037.281,81 2.596.619,68 Retained earnings 10.018.912,55 7.325.664,11 Minority interests 17.025.589,43 16.323.013,50
Sub-Total 80.296.456,82 76.372.236,59
Deferred income -143.034.293,26 -132.509.800,90 Deferred taxes liabilities 23.311.874,56 22.172.584,82
Sub-Total -119.722.418,69 -110.337.216,08
Services rendered 10.524.492,36 5.043.472,35
Sub-Total 10.524.492,36 5.043.472,35
Cost of goods sold -229.115,09 -69.365,93 Supplies and services from third parties 5.690.097,47 1.029.810,90 Deferred taxes assets 1.139.289,74 918.681,16 Minority interests 886.938,43 567.726,54
Sub-Total 7.487.210,55 2.446.852,67
8. APPROPRIATE AND FAIR PRESENTATION
a) Included in Shareholders’ Equity
The balances presented in this caption arose in the first time that consolidated financial statements were prepared and represent the difference between the acquisition cost and its shareholders’ equity proportional value as at 1 January 2003.The referred amount includes the net profits and reserves of affiliated companies, accumulated until the date of the first consolidation procedure.
In some cases, with the implementation of the new consolidated system, these amounts were recalculated. The impact of this recalculation did not affect total equity, as it affected retained earnings and reserves. This account also includes differences identified during the intra-group balances reconciliation, which are immaterial for the consolidated financial statements.
10. CONSOLIDATION DIFFERENCES
Company 2007 2006
Financial investments 28.786.126,26 40.443.529,87
Balances and transactions reconciliation -250.316,37 0,00
Foreign currency conversion -1.206.073,24 -534.449,32
Total 27.329.736,65 39.909.080,55
As at 31 December, this caption can be analyzed as follows:
EURO
IN EURO
GRUPO PESTANA SGPS MANAGEMENT REPORT FINANCIAL STATEMENTS
34
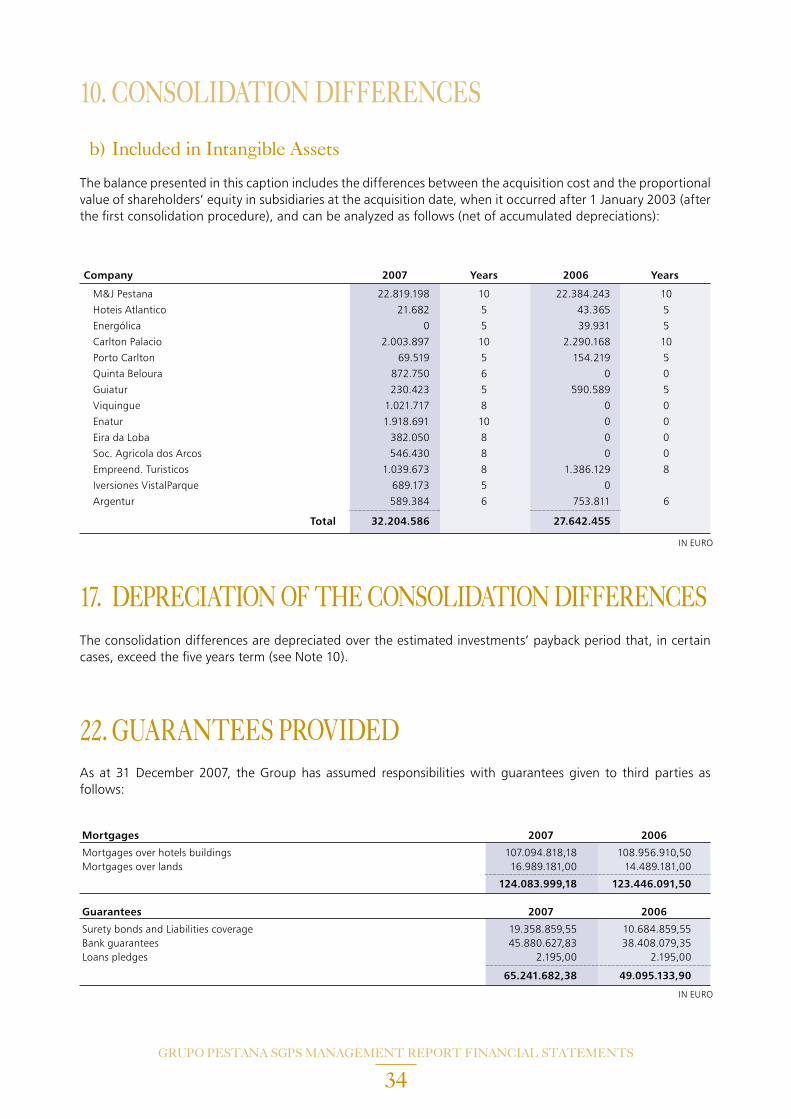
b) Included in Intangible Assets
The balance presented in this caption includes the differences between the acquisition cost and the proportional value of shareholders’ equity in subsidiaries at the acquisition date, when it occurred after 1 January 2003 (after the first consolidation procedure), and can be analyzed as follows (net of accumulated depreciations):
10. CONSOLIDATION DIFFERENCES
Company 2007 Years 2006 Years
M&J Pestana 22.819.198 10 22.384.243 10
Hoteis Atlantico 21.682 5 43.365 5
Energólica 0 5 39.931 5
Carlton Palacio 2.003.897 10 2.290.168 10
Porto Carlton 69.519 5 154.219 5
Quinta Beloura 872.750 6 0 0
Guiatur 230.423 5 590.589 5
Viquingue 1.021.717 8 0 0
Enatur 1.918.691 10 0 0
Eira da Loba 382.050 8 0 0
Soc. Agricola dos Arcos 546.430 8 0 0
Empreend. Turisticos 1.039.673 8 1.386.129 8
Iversiones VistalParque 689.173 5 0
Argentur 589.384 6 753.811 6
Total 32.204.586 27.642.455
The consolidation differences are depreciated over the estimated investments’ payback period that, in certain cases, exceed the five years term (see Note 10).
17. DEPRECIATION OF THE CONSOLIDATION DIFFERENCES
As at 31 December 2007, the Group has assumed responsibilities with guarantees given to third parties as follows:
22. GUARANTEES PROVIDED
Mortgages 2007 2006
Mortgages over hotels buildings 107.094.818,18 108.956.910,50Mortgages over lands 16.989.181,00 14.489.181,00
124.083.999,18 123.446.091,50
Guarantees 2007 2006
Surety bonds and Liabilities coverage 19.358.859,55 10.684.859,55Bank guarantees 45.880.627,83 38.408.079,35Loans pledges 2.195,00 2.195,00
65.241.682,38 49.095.133,90
IN EURO
IN EURO
GRUPO PESTANA SGPS MANAGEMENT REPORT FINANCIAL STATEMENTS
35
Basis of Presentation
The accompanying consolidated financial statements have been prepared on a going concern basis from the accounting books and records of the consolidated companies (see Note 1), maintained in accordance with the generally accepted accounting principles in Portugal.
Consolidation Principles The consolidation of the subsidiaries referred in Note 1 was prepared according to the full consolidation method. The significant intra-group balances and transactions were eliminated in the consolidation process. The amount related to third parties participation in subsidiaries’ capital is stated in the caption Minority interests. The goodwill was accounted for in intangible assets (consolidation differences) and depreciated over the estimated payback period of the investment. The negative
23. BASIS OF PRESENTATION AND ACCOUNTING PRINCIPLES
differences (“badwill”) were accounted as deferred income and recognized over its recovery estimated period. The remaining consolidation differences, resulting from the difference between the share capital acquisition cost and its shareholders’ equity proportional value, were accounted for in Shareholders’ equity of the consolidated balance sheet.
Financial investments in associated companies referred in Note 1 are recorded in the consolidated balance sheet at the acquisition cost or, if lower, at the estimated net realizable value. This amount is adjusted by the equity method usage.
Financial investments corresponding to less than 20% of capital held are registered at the acquisition cost or, if lower, at the estimated net realizable value.

GRUPO PESTANA SGPS MANAGEMENT REPORT FINANCIAL STATEMENTS
36
Main Accounting Principles
The following is a summary of the most significant accounting principles followed in the preparation of the accompanying consolidated financial statements:
a) Intangible Assets
The industrial property relates to the amount paid for the concession of the Portuguese chain of lodging houses (“Pousadas de Portugal”) and is being depreciated by the correspondent concession period. The consolidation differences are depreciated over the estimated payback period of the investments. The remaining intangible assets are accounted for at acquisition cost and depreciated on a straight line basis over a 6 years period.
b) Tangible Assets
Tangible assets acquired until 31 December 1997 are accounted for at the revaluated cost according to official decree-laws (see Note 41) based upon price-adjustment factors. The remaining tangible assets are valued at acquisition cost.
Depreciation is provided on a straight-line basis ac-cording to the following estimated useful lives:
c) Financial leases
Financial leases are recorded as tangible assets at their equivalent acquisition capital value and are depreciated over their useful lives (see Note 23.b). The corresponding liability is recorded as a creditor balance and the interest element of the lease rental is charged against profit and loss account over the primary lease period.
d) Financial Investments
Financial investments in associated companies are accounted for at its acquisition cost or, if lower, at the estimated net realizable value. This amount is adjusted by the equity method.
Financial investments corresponding to participations less than 20% of the companies capital are registered at acquisition cost or, if lower, at the estimated net realizable value.
e) Inventories
Goods, raw and subsidiary materials and consumables are valued at the acquisition cost, which is lower than the market value (being used the weighted average cost to register the consumptions). Finished and intermediary products and work-in-progress are valued at the production cost, which includes direct costs and expenditures and does not exceed its market value.
Adjustments for inventories correspond to the difference between the acquisition cost and the respective net realizable value.
f) Adjustment for doubtful debts When the estimated recovery amount of doubtful debtors’ balances is less than the respective book value, the difference is covered with an adjustment for doubtful debts.
Years
Buildings and other constructions 40Basic equipment Hotel furniture 16 Clothes and Towels 4-10 Dishes, Glasses and Cutlery 6-8 Decoration 8 Other 14-20Transportation equipment Bus vehicles 7 Car vehicles 4 Tools 8-10Administrative equipment 4-8Other tangible assets 4-8
23. BASIS OF PRESENTATION AND ACCOUNTING PRINCIPLES
GRUPO PESTANA SGPS MANAGEMENT REPORT FINANCIAL STATEMENTS
37
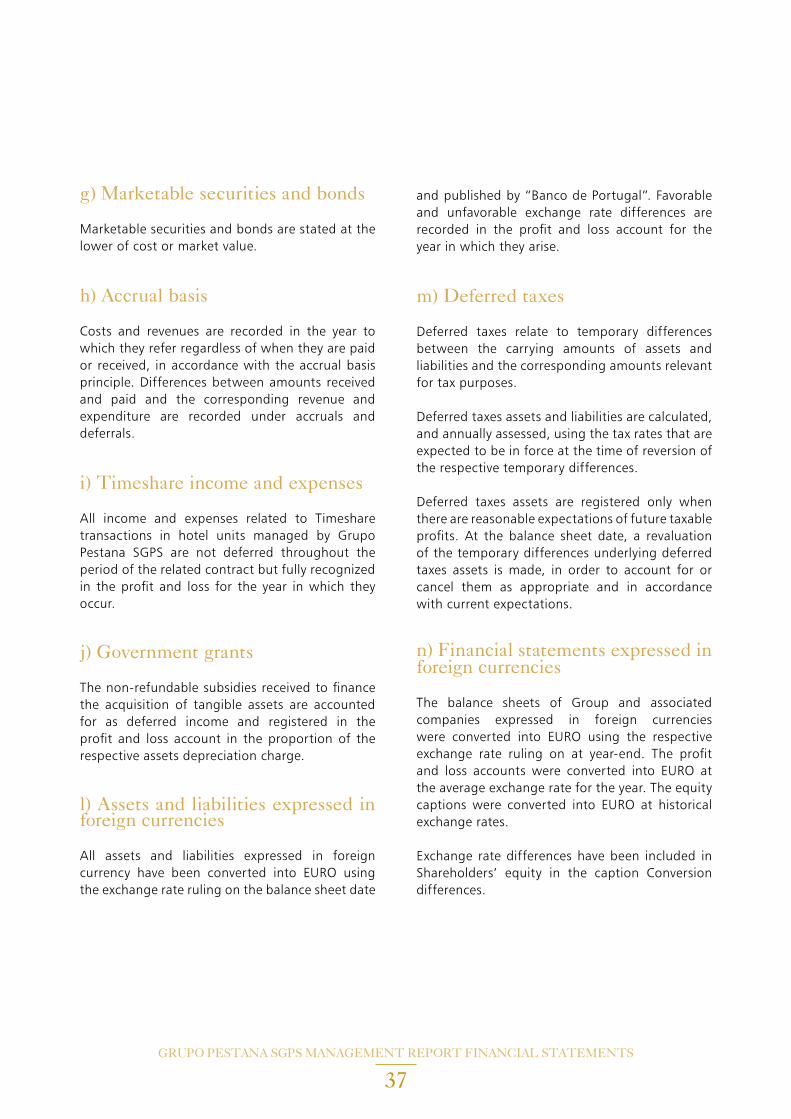
g) Marketable securities and bonds
Marketable securities and bonds are stated at the lower of cost or market value.
h) Accrual basis
Costs and revenues are recorded in the year to which they refer regardless of when they are paid or received, in accordance with the accrual basis principle. Differences between amounts received and paid and the corresponding revenue and expenditure are recorded under accruals and deferrals.
i) Timeshare income and expenses
All income and expenses related to Timeshare transactions in hotel units managed by Grupo Pestana SGPS are not deferred throughout the period of the related contract but fully recognized in the profit and loss for the year in which they occur.
j) Government grants
The non-refundable subsidies received to finance the acquisition of tangible assets are accounted for as deferred income and registered in the profit and loss account in the proportion of the respective assets depreciation charge.
l) Assets and liabilities expressed in foreign currencies
All assets and liabilities expressed in foreign currency have been converted into EURO using the exchange rate ruling on the balance sheet date
and published by “Banco de Portugal”. Favorable and unfavorable exchange rate differences are recorded in the profit and loss account for the year in which they arise.
m) Deferred taxes
Deferred taxes relate to temporary differences between the carrying amounts of assets and liabilities and the corresponding amounts relevant for tax purposes.
Deferred taxes assets and liabilities are calculated, and annually assessed, using the tax rates that are expected to be in force at the time of reversion of the respective temporary differences.
Deferred taxes assets are registered only when there are reasonable expectations of future taxable profits. At the balance sheet date, a revaluation of the temporary differences underlying deferred taxes assets is made, in order to account for or cancel them as appropriate and in accordance with current expectations.
n) Financial statements expressed in foreign currencies
The balance sheets of Group and associated companies expressed in foreign currencies were converted into EURO using the respective exchange rate ruling on at year-end. The profit and loss accounts were converted into EURO at the average exchange rate for the year. The equity captions were converted into EURO at historical exchange rates.
Exchange rate differences have been included in Shareholders’ equity in the caption Conversion differences.

GRUPO PESTANA SGPS MANAGEMENT REPORT FINANCIAL STATEMENTS
38
Assets and liabilities expressed in foreign currencies have been converted into Euro using the following exchange rates:
24. EXCHANGE RATES USED IN EURO
31|12|2007 31|12|2006
United States Dollar 1,4721 1,3193South African Rand 10,0298 9,2124Great Britain Pound 0,7334 0,6733Mozambique Metical (1.000.000) 34,8300 34.470,0000Cape Verde Escudo 110,2650 110,2650Argentine Peso 4,6386 4,0474Brazilian Real 2,5963 2,8118
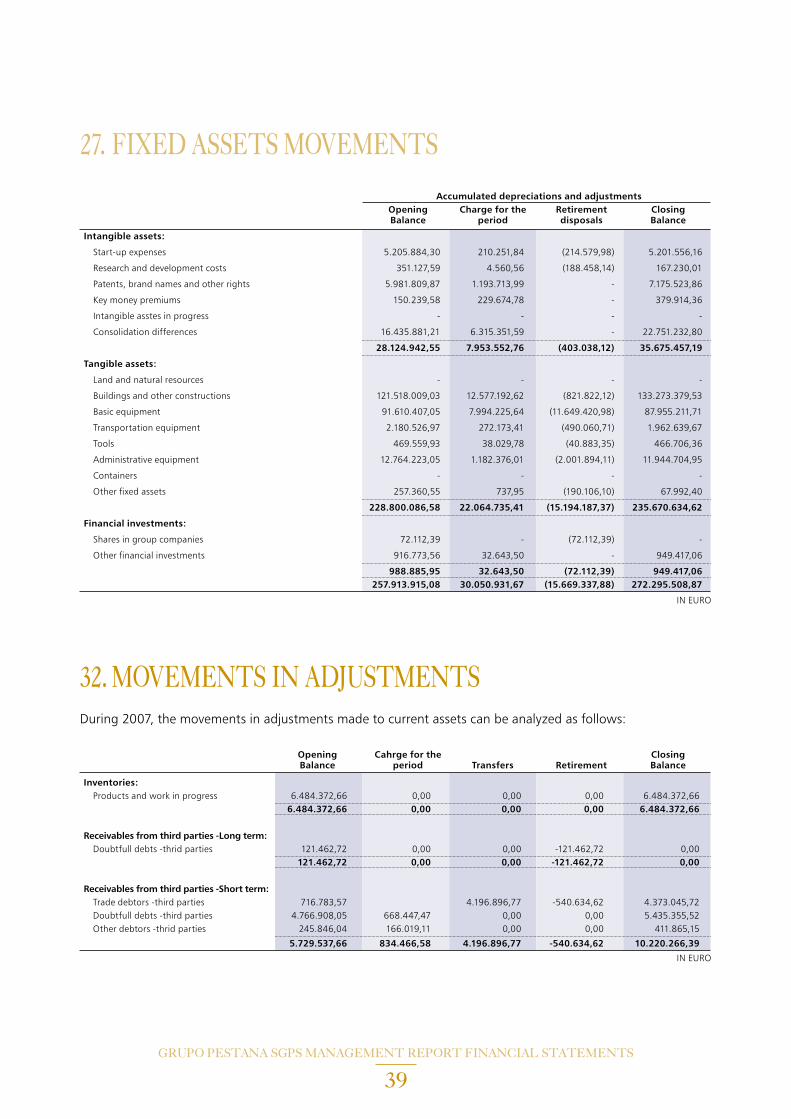
During 2007, the movements occurred in fixed assets, as well as in the related accumulated depreciations and adjustments, were as follows:
27. FIXED ASSETS MOVEMENTS
GROSS AMOUNTS Opening Transfers and Closing Balance Increases Disposals write-off Balance
Intangible assets: Start-up expenses 5.981.289,99 8.480,99 - (19.946,34) 5.969.824,64 Research and development costs 439.719,37 2.400,00 - (241.836,47) 200.282,90 Patents, brand names and other rights 19.142.824,78 21.224,95 - 18.685,09 19.182.734,82 Key money premiums 890.447,12 1.057.372,26 - (43.564,12) 1.904.255,26 Intangible asstes in progress 4.742.916,59 - - (401.115,20) 4.341.801,39 Advances paid on account of intangible fixed assets 12.174,21 - - (12.174,21) - Consolidation differences 44.078.336,45 10.877.482,29 - - 54.955.818,74 75.287.708,51 11.966.960,49 - (699.951,25) 86.554.717,75Tangible assets: Land and natural resources 57.835.245,35 2.475.195,86 (445.809,06) (2.080.419,47) 57.784.212,68 Buildings and other constructions 361.163.051,97 3.519.545,46 (1.303.630,57) 4.640.572,22 368.019.539,08 Basic equipment 147.938.741,01 6.287.043,29 (938.010,78) (5.155.128,03) 148.132.645,49 Transportation equipment 3.015.198,52 348.573,65 (264.906,89) (168.336,25) 2.930.529,03 Tools 567.662,89 106.079,33 - (36.183,87) 637.558,35 Administrative equipment 14.990.560,14 604.859,95 (8.044,08) (1.302.032,16) 14.285.343,85 Containers - - - - - Other fixed assets 1.163.158,19 - - (432.289,59) 730.868,60 Fixed assets under construction 23.739.474,11 66.789.192,29 - (8.527.189,14) 82.001.477,26 Advances paid on account of tangible fixed assets - 805.385,19 - - 805.385,19 610.413.092,18 80.935.875,02 (2.960.401,38) (13.061.006,29) 675.327.559,53Financial investments: Shares in group companies - - - - - Loans to group companies 2.006.763,22 - - (2.006.763,22) - Shares in associated companies 12.272.102,05 - - (1.760.190,79) 10.511.911,26 Loans to associated companies 12.148.345,24 - - (2.973.345,24) 9.175.000,00 Shares in participated companies 390.306,86 2.072.341,62 - - 2.462.648,48 Loans to participated companies 19.724,77 - - 2.964.095,22 2.983.819,99 Other financial investmens 20.726.173,03 3.206.881,07 - - 23.933.054,10 Other loans granted - - - - - Investments in progress - 1.099.227,36 - - 1.099.227,36 Advances paid on account of financial investments 7.832.361,89 0 - (7.832.361,89) - 55.395.777,06 6.378.450,05 - (11.608.565,92) 50.165.661,19 741.096.577,75 99.281.285,56 (2.960.401,38) (25.369.523,46) 812.047.938,47
IN EURO
GRUPO PESTANA SGPS MANAGEMENT REPORT FINANCIAL STATEMENTS
39
27. FIXED ASSETS MOVEMENTS
Accumulated depreciations and adjustments Opening Charge for the Retirement Closing Balance period disposals Balance
Intangible assets:
Start-up expenses 5.205.884,30 210.251,84 (214.579,98) 5.201.556,16
Research and development costs 351.127,59 4.560,56 (188.458,14) 167.230,01
Patents, brand names and other rights 5.981.809,87 1.193.713,99 - 7.175.523,86
Key money premiums 150.239,58 229.674,78 - 379.914,36
Intangible asstes in progress - - - -
Consolidation differences 16.435.881,21 6.315.351,59 - 22.751.232,80
28.124.942,55 7.953.552,76 (403.038,12) 35.675.457,19
Tangible assets:
Land and natural resources - - - -
Buildings and other constructions 121.518.009,03 12.577.192,62 (821.822,12) 133.273.379,53
Basic equipment 91.610.407,05 7.994.225,64 (11.649.420,98) 87.955.211,71
Transportation equipment 2.180.526,97 272.173,41 (490.060,71) 1.962.639,67
Tools 469.559,93 38.029,78 (40.883,35) 466.706,36
Administrative equipment 12.764.223,05 1.182.376,01 (2.001.894,11) 11.944.704,95
Containers - - - -
Other fixed assets 257.360,55 737,95 (190.106,10) 67.992,40
228.800.086,58 22.064.735,41 (15.194.187,37) 235.670.634,62
Financial investments:
Shares in group companies 72.112,39 - (72.112,39) -
Other financial investments 916.773,56 32.643,50 - 949.417,06
988.885,95 32.643,50 (72.112,39) 949.417,06 257.913.915,08 30.050.931,67 (15.669.337,88) 272.295.508,87
IN EURO
During 2007, the movements in adjustments made to current assets can be analyzed as follows:
32. MOVEMENTS IN ADJUSTMENTS
IN EURO
Opening Cahrge for the Closing Balance period Transfers Retirement Balance
Inventories: Products and work in progress 6.484.372,66 0,00 0,00 0,00 6.484.372,66 6.484.372,66 0,00 0,00 0,00 6.484.372,66
Receivables from third parties -Long term: Doubtfull debts -thrid parties 121.462,72 0,00 0,00 -121.462,72 0,00 121.462,72 0,00 0,00 -121.462,72 0,00
Receivables from third parties -Short term: Trade debtors -third parties 716.783,57 4.196.896,77 -540.634,62 4.373.045,72 Doubtfull debts -third parties 4.766.908,05 668.447,47 0,00 0,00 5.435.355,52 Other debtors -thrid parties 245.846,04 166.019,11 0,00 0,00 411.865,15
5.729.537,66 834.466,58 4.196.896,77 -540.634,62 10.220.266,39

GRUPO PESTANA SGPS MANAGEMENT REPORT FINANCIAL STATEMENTS
40
As at 31 December 2007, there was the following debts payable at more than 5 years:
33. LONG TERM LIABILITIES (MORE THAN 5 YEARS)
Sales Internal market External market Total (n)
Goods 516.874,36 346.342,00 863.216,36
Allotments 1.418.634,89 6.004.878,47 7.423.513,36
1.935.509,25 6.351.220,47 8.286.729,72
Services Rendered Internal market External market Total (n)
Hotels 115.927.727,11 43.750.186,99 159.677.914,10
Golf 3.899.510,24 5.044.147,00 8.943.657,24
Construction 338.317,00 2.020.560,00 2.358.877,00
Casino 12.307.253,20 927.889,37 13.235.142,57
Others 12.977.442,31 5.198.752,50 18.176.194,81
145.450.249,86 56.941.535,86 202.391.785,72
147.385.759,11 63.292.756,33 210.678.515,44
As at 31 December 2007, there were debts to third parties amounting to Euros 124.083.999,18, covered by mortgages over some of the Group’s hotels (see Note 22).
34. DEBTS TO THIRD PARTIES COVERED BY REAL WARRANTIES
36. SALES AND SERVICES RENDERED BY BUSINESS AREA AND GEOGRAPHICAL MARKETS
2007 2006
Debts to credit institutions 106.475.120 101.294.796
IN EURO
IN EURO
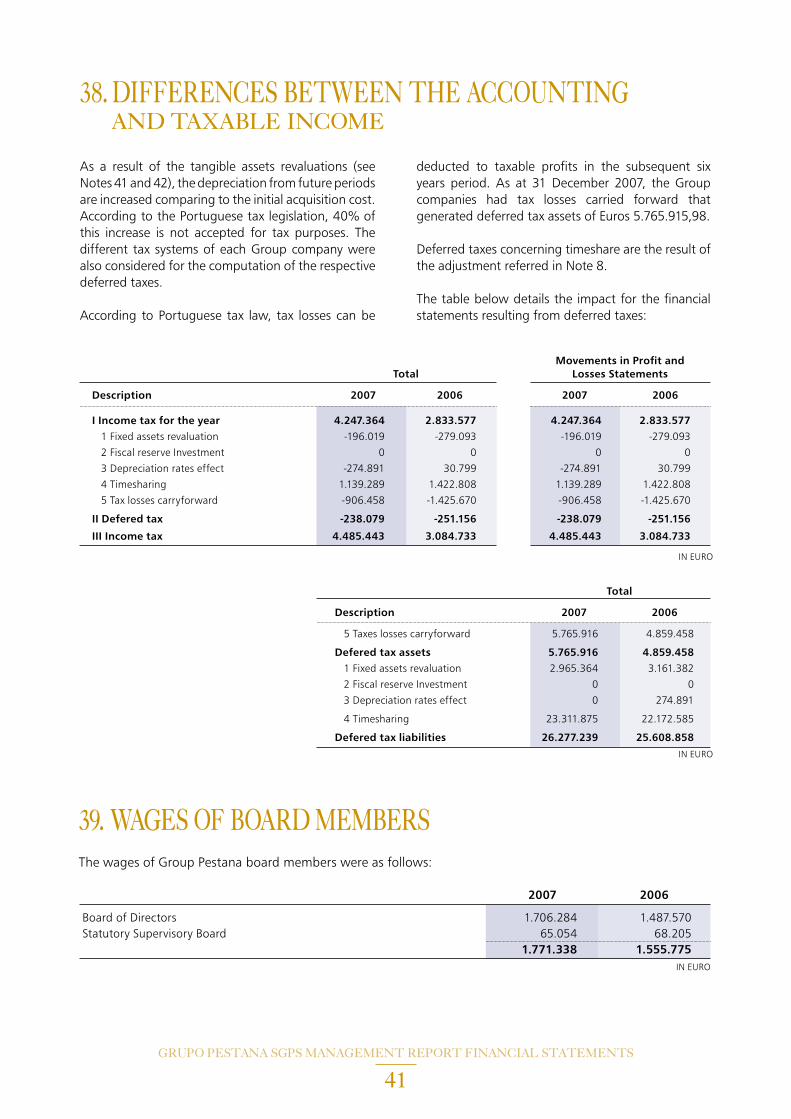
GRUPO PESTANA SGPS MANAGEMENT REPORT FINANCIAL STATEMENTS
41
As a result of the tangible assets revaluations (see Notes 41 and 42), the depreciation from future periods are increased comparing to the initial acquisition cost. According to the Portuguese tax legislation, 40% of this increase is not accepted for tax purposes. The different tax systems of each Group company were also considered for the computation of the respective deferred taxes.
According to Portuguese tax law, tax losses can be
38. DIFFERENCES BETWEEN THE ACCOUNTING AND TAXABLE INCOME
Movements in Profit and Total Losses Statements
Description 2007 2006 2007 2006
I Income tax for the year 4.247.364 2.833.577 4.247.364 2.833.577 1 Fixed assets revaluation -196.019 -279.093 -196.019 -279.093
2 Fiscal reserve Investment 0 0 0 0
3 Depreciation rates effect -274.891 30.799 -274.891 30.799
4 Timesharing 1.139.289 1.422.808 1.139.289 1.422.808
5 Tax losses carryforward -906.458 -1.425.670 -906.458 -1.425.670
II Defered tax -238.079 -251.156 -238.079 -251.156
III Income tax 4.485.443 3.084.733 4.485.443 3.084.733
IN EURO
deducted to taxable profits in the subsequent six years period. As at 31 December 2007, the Group companies had tax losses carried forward that generated deferred tax assets of Euros 5.765.915,98.
Deferred taxes concerning timeshare are the result of the adjustment referred in Note 8.
The table below details the impact for the financial statements resulting from deferred taxes:
Total
Description 2007 2006
5 Taxes losses carryforward 5.765.916 4.859.458
Defered tax assets 5.765.916 4.859.458 1 Fixed assets revaluation 2.965.364 3.161.382
2 Fiscal reserve Investment 0 0
3 Depreciation rates effect 0 274.891
4 Timesharing 23.311.875 22.172.585
Defered tax liabilities 26.277.239 25.608.858
IN EURO
The wages of Group Pestana board members were as follows:
39. WAGES OF BOARD MEMBERS
2007 2006
Board of Directors 1.706.284 1.487.570 Statutory Supervisory Board 65.054 68.205 1.771.338 1.555.775
IN EURO
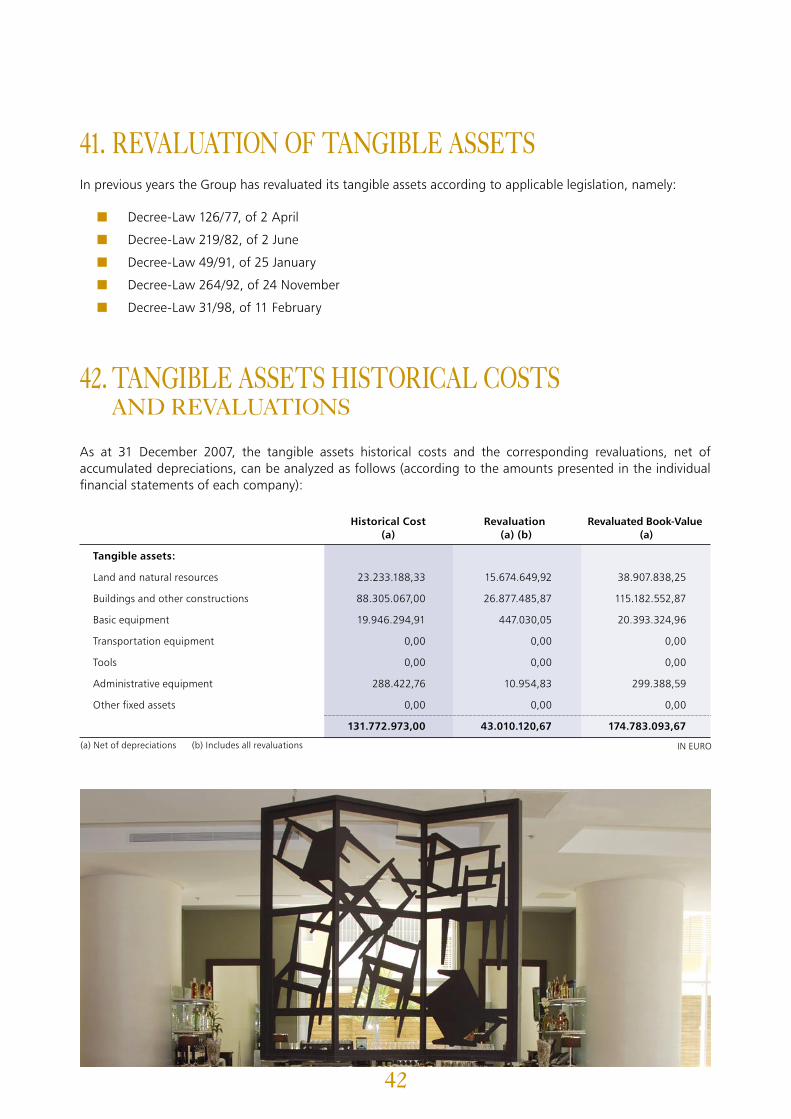
GRUPO PESTANA SGPS MANAGEMENT REPORT FINANCIAL STATEMENTS
42
In previous years the Group has revaluated its tangible assets according to applicable legislation, namely:
■ Decree-Law 126/77, of 2 April
■ Decree-Law 219/82, of 2 June
■ Decree-Law 49/91, of 25 January
■ Decree-Law 264/92, of 24 November
■ Decree-Law 31/98, of 11 February
41. REVALUATION OF TANGIBLE ASSETS
Historical Cost Revaluation Revaluated Book-Value (a) (a) (b) (a)
Tangible assets:
Land and natural resources 23.233.188,33 15.674.649,92 38.907.838,25
Buildings and other constructions 88.305.067,00 26.877.485,87 115.182.552,87
Basic equipment 19.946.294,91 447.030,05 20.393.324,96
Transportation equipment 0,00 0,00 0,00
Tools 0,00 0,00 0,00
Administrative equipment 288.422,76 10.954,83 299.388,59
Other fixed assets 0,00 0,00 0,00
131.772.973,00 43.010.120,67 174.783.093,67
As at 31 December 2007, the tangible assets historical costs and the corresponding revaluations, net of accumulated depreciations, can be analyzed as follows (according to the amounts presented in the individual financial statements of each company):
42. TANGIBLE ASSETS HISTORICAL COSTS AND REVALUATIONS
IN EURO(a) Net of depreciations (b) Includes all revaluations
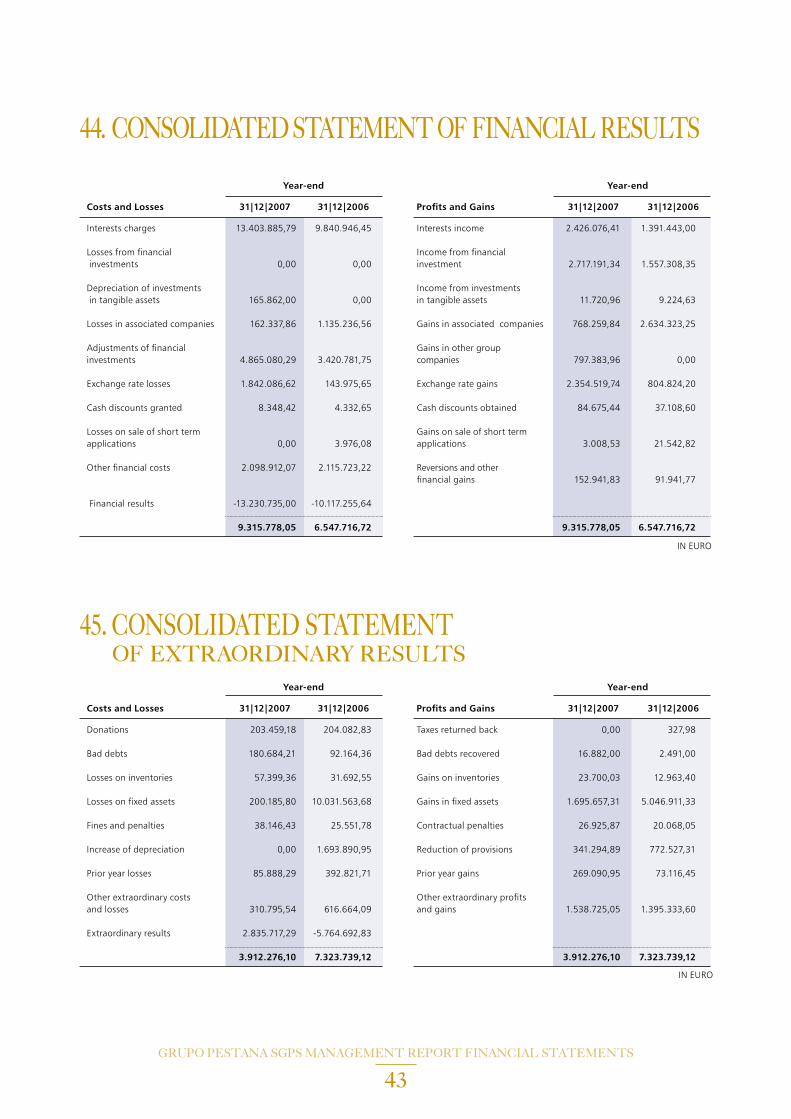
GRUPO PESTANA SGPS MANAGEMENT REPORT FINANCIAL STATEMENTS
43
45. CONSOLIDATED STATEMENT OF EXTRAORDINARY RESULTS
Year-end Year-end
Costs and Losses 31|12|2007 31|12|2006 Profits and Gains 31|12|2007 31|12|2006
Interests charges 13.403.885,79 9.840.946,45 Interests income 2.426.076,41 1.391.443,00 Losses from financial Income from financial investments 0,00 0,00 investment 2.717.191,34 1.557.308,35 Depreciation of investments Income from investments in tangible assets 165.862,00 0,00 in tangible assets 11.720,96 9.224,63
Losses in associated companies 162.337,86 1.135.236,56 Gains in associated companies 768.259,84 2.634.323,25
Adjustments of financial Gains in other group investments 4.865.080,29 3.420.781,75 companies 797.383,96 0,00
Exchange rate losses 1.842.086,62 143.975,65 Exchange rate gains 2.354.519,74 804.824,20 Cash discounts granted 8.348,42 4.332,65 Cash discounts obtained 84.675,44 37.108,60
Losses on sale of short term Gains on sale of short term applications 0,00 3.976,08 applications 3.008,53 21.542,82
Other financial costs 2.098.912,07 2.115.723,22 Reversions and other financial gains 152.941,83 91.941,77
Financial results -13.230.735,00 -10.117.255,64 9.315.778,05 6.547.716,72 9.315.778,05 6.547.716,72
IN EURO
Year-end Year-end
Costs and Losses 31|12|2007 31|12|2006 Profits and Gains 31|12|2007 31|12|2006
Donations 203.459,18 204.082,83 Taxes returned back 0,00 327,98
Bad debts 180.684,21 92.164,36 Bad debts recovered 16.882,00 2.491,00 Losses on inventories 57.399,36 31.692,55 Gains on inventories 23.700,03 12.963,40 Losses on fixed assets 200.185,80 10.031.563,68 Gains in fixed assets 1.695.657,31 5.046.911,33
Fines and penalties 38.146,43 25.551,78 Contractual penalties 26.925,87 20.068,05
Increase of depreciation 0,00 1.693.890,95 Reduction of provisions 341.294,89 772.527,31
Prior year losses 85.888,29 392.821,71 Prior year gains 269.090,95 73.116,45
Other extraordinary costs Other extraordinary profits and losses 310.795,54 616.664,09 and gains 1.538.725,05 1.395.333,60
Extraordinary results 2.835.717,29 -5.764.692,83
3.912.276,10 7.323.739,12 3.912.276,10 7.323.739,12
IN EURO
44. CONSOLIDATED STATEMENT OF FINANCIAL RESULTS

GRUPO PESTANA SGPS MANAGEMENT REPORT FINANCIAL STATEMENTS
44
46. MOVEMENTS IN PROVISIONS
Opening Closing Caption Balance Increase Decrease Balance
Provisions for pensions 73.834,62 0,00 65.451,76 8.382,86
Provisions for taxes 31.956,21 61.453,18 0,00 93.409,39
Provisions for judicial processes 18.954,32 42.185,23 1.500,00 59.639,55
Warranties provisions 0,00 21.383,77 0,00 21.383,77
Other risks and charges 273.592,64 191.224,18 239.606,76 225.210,06
TOTAL 398.337,79 316.246,36 306.558,52 408.025,63
IN EURO
As at 31 December 2007, the Group had accounted for the following amounts as financial leases:
47. FINANCIAL LEASES
IN EURO
acquisition Accumulated Payable to third parties Total Caption cost depreciations Short term Medium/Long debts (+) (-) term (n)
Financial Investment in Buildings 8.489.951,22 2.313.906,06 31.555,75 3.807.089,87 3.838.645,62
Land and natural resources - - - - 973.646,57
Buildings and other constructions 28.478,04 2.847,80 - - -
Basic equipment 6.494.073,73 3.889.788,44 4,93 973.646,57 973.651,50
Transportation equipment 575.875,88 297.414,87 40.444,17 257.377,36 297.821,53
Administrative equipment 762.001,10 483.151,85 - 278.848,96 278.848,96
Other fixed assets 67.972,34 67.972,34 - - -
16.418.352,31 7.055.081,36 72.004,85 5.316.962,76 6.362.614,18
Funchal, 28 April 2008 The Board of Directors
Dionísio Fernandes Pestana - ChairmanPietro Luigi Valle - MemberJosé Alexandre Lebre Theotónio – Member
The official accountant Jorge da Silva Figueira

FIN
ANCI
ALSt
atem
ents
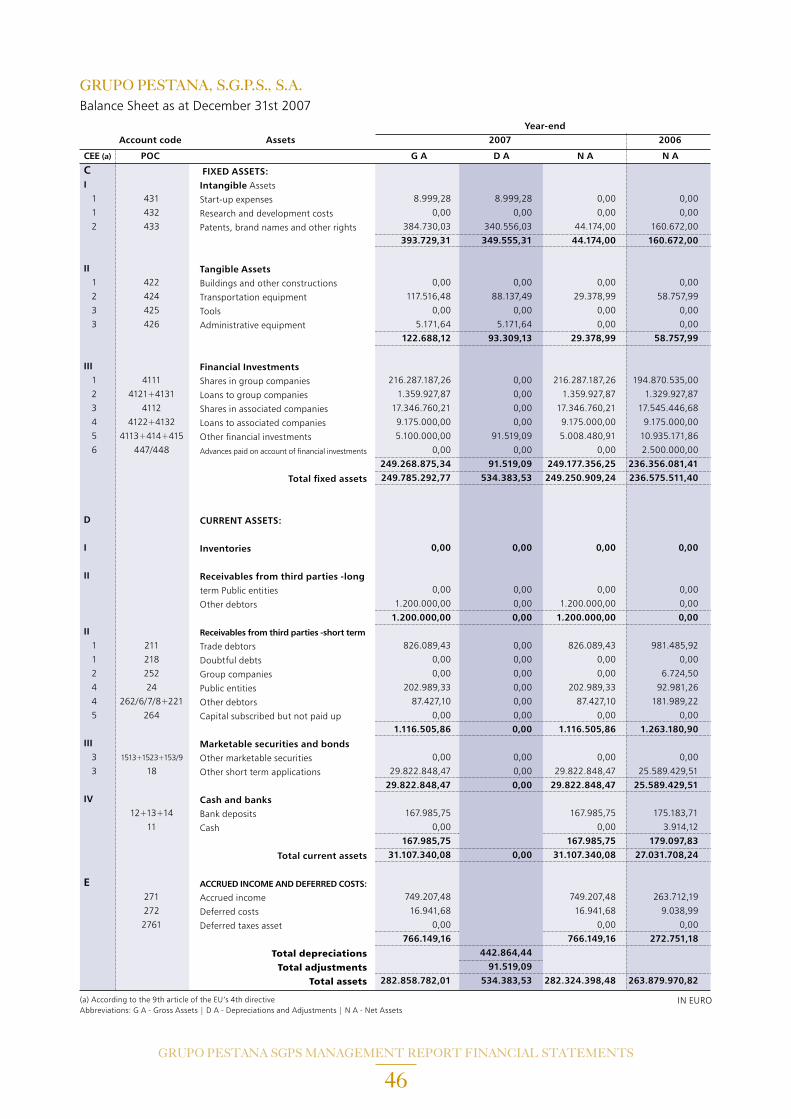
GRUPO PESTANA SGPS MANAGEMENT REPORT FINANCIAL STATEMENTS
46
GRUPO PESTANA, S.G.P.S., S.A. Balance Sheet as at December 31st 2007 Year-end Account code Assets 2007 2006
CEE (a) POC G A D A N A N A
C
I
1 431 8.999,28 8.999,28 0,00 0,00
1 432 0,00 0,00 0,00 0,00
2 433 384.730,03 340.556,03 44.174,00 160.672,00
393.729,31 349.555,31 44.174,00 160.672,00
II
1 422 0,00 0,00 0,00 0,00
2 424 117.516,48 88.137,49 29.378,99 58.757,99
3 425 0,00 0,00 0,00 0,00
3 426 5.171,64 5.171,64 0,00 0,00
122.688,12 93.309,13 29.378,99 58.757,99
III
1 4111 216.287.187,26 0,00 216.287.187,26 194.870.535,00
2 4121+4131 1.359.927,87 0,00 1.359.927,87 1.329.927,87
3 4112 17.346.760,21 0,00 17.346.760,21 17.545.446,68
4 4122+4132 9.175.000,00 0,00 9.175.000,00 9.175.000,00
5 4113+414+415 5.100.000,00 91.519,09 5.008.480,91 10.935.171,86
6 447/448 0,00 0,00 0,00 2.500.000,00
249.268.875,34 91.519,09 249.177.356,25 236.356.081,41 249.785.292,77 534.383,53 249.250.909,24 236.575.511,40
D I 0,00 0,00 0,00 0,00
II
0,00 0,00 0,00 0,00
1.200.000,00 0,00 1.200.000,00 0,00
1.200.000,00 0,00 1.200.000,00 0,00II
1 211 826.089,43 0,00 826.089,43 981.485,92
1 218 0,00 0,00 0,00 0,00
2 252 0,00 0,00 0,00 6.724,50
4 24 202.989,33 0,00 202.989,33 92.981,26
4 262/6/7/8+221 87.427,10 0,00 87.427,10 181.989,22
5 264 0,00 0,00 0,00 0,00
1.116.505,86 0,00 1.116.505,86 1.263.180,90III
3 1513+1523+153/9 0,00 0,00 0,00 0,00
3 18 29.822.848,47 0,00 29.822.848,47 25.589.429,51
29.822.848,47 0,00 29.822.848,47 25.589.429,51IV 12+13+14 167.985,75 167.985,75 175.183,71
11 0,00 0,00 3.914,12
167.985,75 167.985,75 179.097,83 31.107.340,08 0,00 31.107.340,08 27.031.708,24
E
271 749.207,48 749.207,48 263.712,19
272 16.941,68 16.941,68 9.038,99
2761 0,00 0,00 0,00
766.149,16 766.149,16 272.751,18 442.864,44 91.519,09 282.858.782,01 534.383,53 282.324.398,48 263.879.970,82
IN EURO(a) According to the 9th article of the EU’s 4th directive Abbreviations: G A - Gross Assets | D A - Depreciations and Adjustments | N A - Net Assets
FIXED ASSETS: Intangible Assets
Start-up expenses
Research and development costs
Patents, brand names and other rights
Tangible Assets Buildings and other constructions
Transportation equipment
Tools
Administrative equipment
Financial Investments Shares in group companies
Loans to group companies
Shares in associated companies
Loans to associated companies
Other financial investments
Advances paid on account of financial investments
Total fixed assets
CURRENT ASSETS:
Inventories
Receivables from third parties -long term Public entities
Other debtors
Receivables from third parties -short term
Trade debtors
Doubtful debts
Group companies
Public entities
Other debtors
Capital subscribed but not paid up
Marketable securities and bonds Other marketable securities
Other short term applications
Cash and banks Bank deposits
Cash
Total current assets
ACCRUED INCOME AND DEFERRED COSTS:
Accrued income
Deferred costs
Deferred taxes asset
Total depreciations Total adjustments
Total assets

GRUPO PESTANA SGPS MANAGEMENT REPORT FINANCIAL STATEMENTS
47
GRUPO PESTANA, S.G.P.S., S.A. Balance Sheet as at December 31st 2007
Account code shareholders’ equity and liabilities
CEE (a) POC 2007 2006
A
I 51 80.000.000,00 80.000.000,00
521 0,00 0,00
522 0,00 0,00
53 21.000.000,00 21.000.000,00
II 54 33.716.655,44 33.690.973,24
III 55 12.965.447,82 13.548.285,32
56 0,00 0,00
IV
1/2 571 325.928,14 325.928,14
3 572 0,00 0,00
4 573 0,00 0,00
4 574 a 579 12.661.276,43 12.661.276,43
V 59 8.800.115,96 10.157.470,71
169.469.423,79 171.383.933,84
VI 88 12.703.044,17 -845.030,48
89 0,00 0,00
182.172.467,96 170.538.903,36
B
1 291 0,00 0,00
2 292 0,00 0,00
3 293/8 0,00 0,00
0,00 0,00
C
0,00 0,00
37.500.000,00 40.000.000,00
0,00 0,00
252 0,00 0,00
265 1.488.727,18 1.666.473,79
38.988.727,18 41.666.473,79
C
1
2321 0,00 0,00
2 231+12 5.997.075,42 6.961.515,65
4 221 109.846,24 50.282,07
6 252 0,00 0,00
8 234/239 53.471.172,96 43.049.744,00
8 24 113.244,53 108.493,03
8 262+263+264+265 209.049,67 585.861,38
+267+268+211 59.900.388,82 50.755.896,13
D
273 1.262.814,52 918.697,54
274 0,00 0,00
2762 0,00 0,00
1.262.814,52 918.697,54
100.151.930,52 93.341.067,46
282.324.398,48 263.879.970,82
IN EURO(a) According to the 9th article of the EU’s 4th directive.
SHAREHOLDERS’ EQUITY:
Share capital
Own Shares -Par value
Own Shares -Premiums and discounts
Supplementary capital
Premiums on issuance of shares
Adjustments to investments in affiliated and associated companies
Revaluation reserves
Reserves
Legal reserves
Statutory reserves
Contractual reserves
ther reserves
Retained earnings
Sub-total
Net profit/(loss) for the year
Anticipated dividends
Total shareholders’ equity
LIABILITIES:
Provisions
Provision for pensions
Provision for taxes
Other provisions
Debts to third parties -long term
Bonds
Security-based loans
Bank loans
Fixed assets suppliers -bills payable
Group companies
Other creditors
Debts to third parties -short term
Bond-based loans
Convertible
Bank loans
Trade creditors
Group companies
Other loans
Public entities
Other creditors
ACCRUED COSTS AND DEFERRED INCOME:
Accrued costs
Deferred income
Deferred taxes liability
Total liabilities
Total shareholders’ equity and liabilities
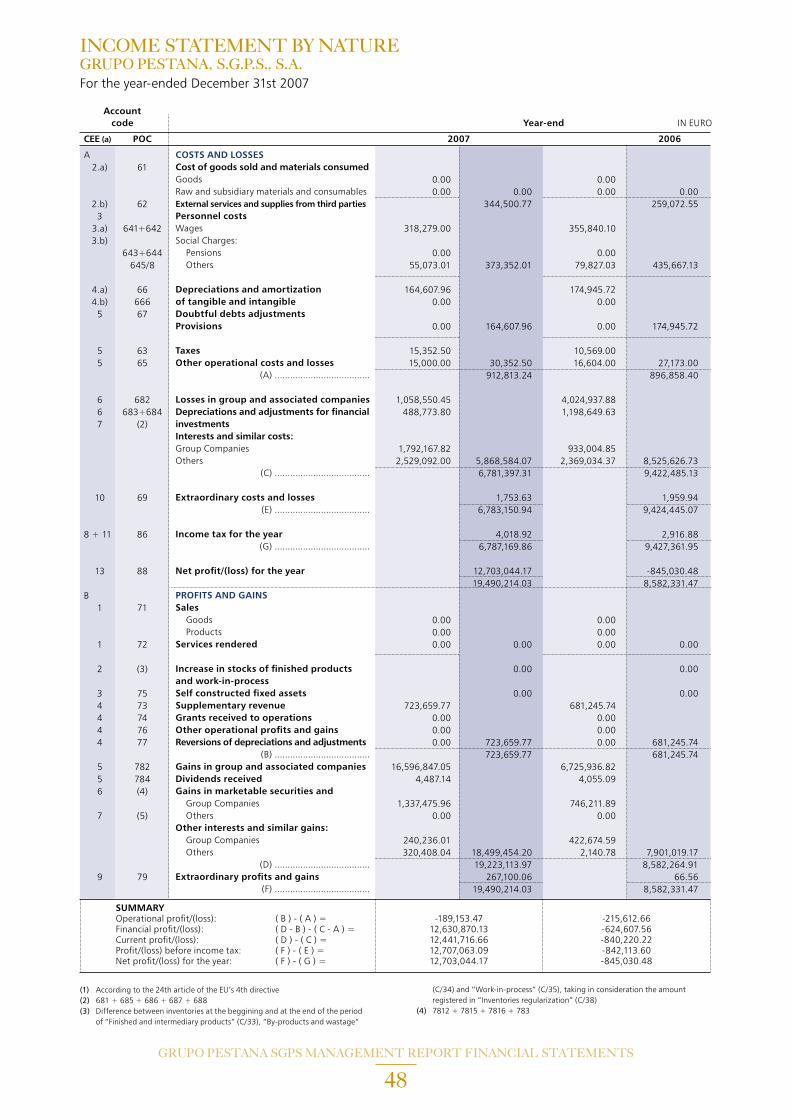
GRUPO PESTANA SGPS MANAGEMENT REPORT FINANCIAL STATEMENTS
48
INCOME STATEMENT BY NATUREGRUPO PESTANA, S.G.P.S., S.A. For the year-ended December 31st 2007
Account code Year-end
CEE (a) POC 2007 2006
A 2.a) 61 0.00 0.00 0.00 0.00 0.00 0.00 2.b) 62 344,500.77 259,072.55 3 3.a) 641+642 318,279.00 355,840.10 3.b) 643+644 0.00 0.00 645/8 55,073.01 373,352.01 79,827.03 435,667.13
4.a) 66 164,607.96 174,945.72 4.b) 666 0.00 0.00 5 67 0.00 164,607.96 0.00 174,945.72 5 63 15,352.50 10,569.00 5 65 15,000.00 30,352.50 16,604.00 27,173.00 912,813.24 896,858.40 6 682 1,058,550.45 4,024,937.88 6 683+684 488,773.80 1,198,649.63 7 (2) 1,792,167.82 933,004.85 2,529,092.00 5,868,584.07 2,369,034.37 8,525,626.73 6,781,397.31 9,422,485.13 10 69 1,753.63 1,959.94 6,783,150.94 9,424,445.07 8 + 11 86 4,018.92 2,916.88 6,787,169.86 9,427,361.95 13 88 12,703,044.17 -845,030.48 19,490,214.03 8,582,331.47 B 1 71 0.00 0.00 0.00 0.00 1 72 0.00 0.00 0.00 0.00 2 (3) 0.00 0.00 3 75 0.00 0.00 4 73 723,659.77 681,245.74 4 74 0.00 0.00 4 76 0.00 0.00 4 77 0.00 723,659.77 0.00 681,245.74 723,659.77 681,245.74 5 782 16,596,847.05 6,725,936.82 5 784 4,487.14 4,055.09 6 (4) 1,337,475.96 746,211.89 7 (5) 0.00 0.00 240,236.01 422,674.59 320,408.04 18,499,454.20 2,140.78 7,901,019.17 19,223,113.97 8,582,264.91 9 79 267,100.06 66.56 19,490,214.03 8,582,331.47
SUMMARY Operational profit/(loss): ( B ) - ( A ) = -189,153.47 -215,612.66 Financial profit/(loss): ( D - B ) - ( C - A ) = 12,630,870.13 -624,607.56 Current profit/(loss): ( D ) - ( C ) = 12,441,716.66 -840,220.22 Profit/(loss) before income tax: ( F ) - ( E ) = 12,707,063.09 -842,113.60 Net profit/(loss) for the year: ( F ) - ( G ) = 12,703,044.17 -845,030.48
IN EURO
(1) According to the 24th article of the EU’s 4th directive(2) 681 + 685 + 686 + 687 + 688(3) Difference between inventories at the beggining and at the end of the period of “Finished and intermediary products” (C/33), “By-products and wastage”
(C/34) and “Work-in-process” (C/35), taking in consideration the amount registered in “Inventories regularization” (C/38) (4) 7812 + 7815 + 7816 + 783
COSTS AND LOSSES Cost of goods sold and materials consumedGoods Raw and subsidiary materials and consumablesExternal services and supplies from third parties Personnel costs Wages Social Charges: Pensions Others
Depreciations and amortization of tangible and intangible Doubtful debts adjustments Provisions
Taxes Other operational costs and losses
(A) .....................................
Losses in group and associated companies Depreciations and adjustments for financial investments Interests and similar costs: Group Companies Others
(C) .....................................
Extraordinary costs and losses (E) .....................................
Income tax for the year
(G) .....................................
Net profit/(loss) for the year
PROFITS AND GAINS Sales Goods Products Services rendered Increase in stocks of finished products and work-in-process Self constructed fixed assets Supplementary revenue Grants received to operations Other operational profits and gains Reversions of depreciations and adjustments
(B) ..................................... Gains in group and associated companies Dividends received Gains in marketable securities and Group Companies Others Other interests and similar gains: Group Companies Others
(D) ..................................... Extraordinary profits and gains
(F) .....................................
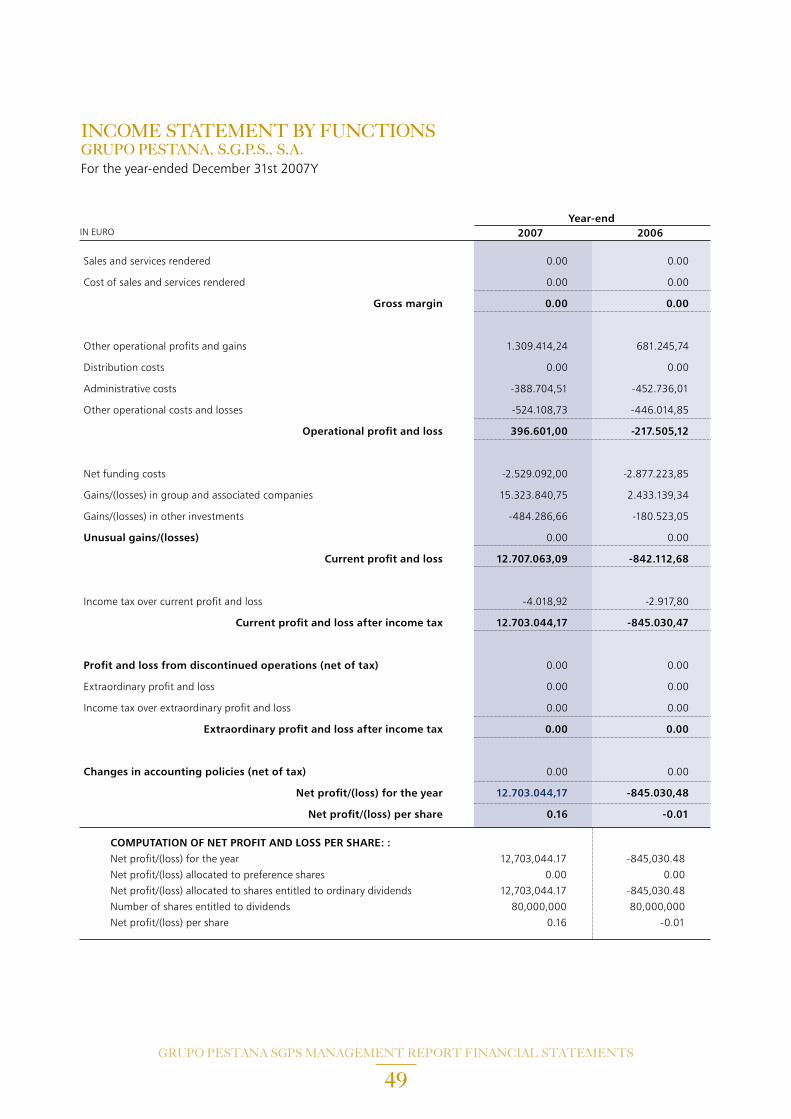
GRUPO PESTANA SGPS MANAGEMENT REPORT FINANCIAL STATEMENTS
49
INCOME STATEMENT BY FUNCTIONSGRUPO PESTANA, S.G.P.S., S.A. For the year-ended December 31st 2007Y
Year-end 2007 2006
Sales and services rendered 0.00 0.00
Cost of sales and services rendered 0.00 0.00
Gross margin 0.00 0.00
Other operational profits and gains 1.309.414,24 681.245,74
Distribution costs 0.00 0.00
Administrative costs -388.704,51 -452.736,01
Other operational costs and losses -524.108,73 -446.014,85
Operational profit and loss 396.601,00 -217.505,12
Net funding costs -2.529.092,00 -2.877.223,85
Gains/(losses) in group and associated companies 15.323.840,75 2.433.139,34
Gains/(losses) in other investments -484.286,66 -180.523,05
Unusual gains/(losses) 0.00 0.00
Current profit and loss 12.707.063,09 -842.112,68
Income tax over current profit and loss -4.018,92 -2.917,80
Current profit and loss after income tax 12.703.044,17 -845.030,47
Profit and loss from discontinued operations (net of tax) 0.00 0.00
Extraordinary profit and loss 0.00 0.00
Income tax over extraordinary profit and loss 0.00 0.00
Extraordinary profit and loss after income tax 0.00 0.00
Changes in accounting policies (net of tax) 0.00 0.00
Net profit/(loss) for the year 12.703.044,17 -845.030,48
Net profit/(loss) per share 0.16 -0.01
IN EURO
COMPUTATION OF NET PROFIT AND LOSS PER SHARE: : Net profit/(loss) for the year 12,703,044.17 -845,030.48
Net profit/(loss) allocated to preference shares 0.00 0.00
Net profit/(loss) allocated to shares entitled to ordinary dividends 12,703,044.17 -845,030.48
Number of shares entitled to dividends 80,000,000 80,000,000
Net profit/(loss) per share 0.16 -0.01
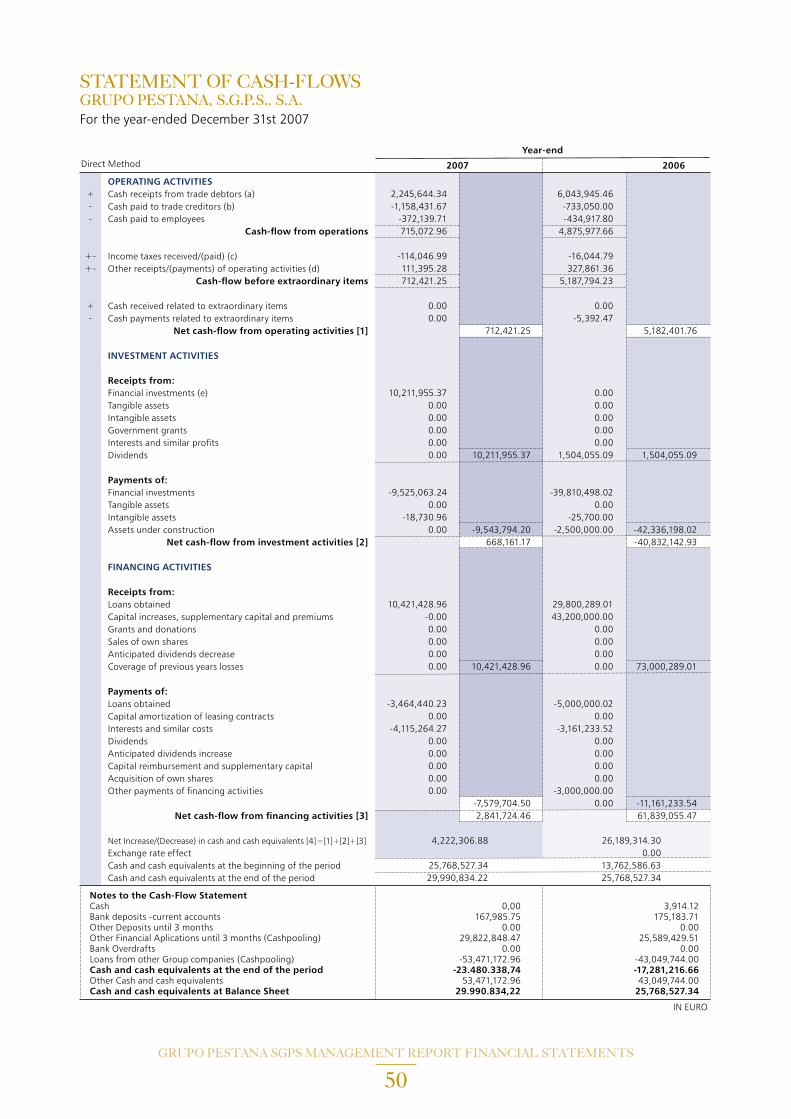
GRUPO PESTANA SGPS MANAGEMENT REPORT FINANCIAL STATEMENTS
50
STATEMENT OF CASH-FLOWS GRUPO PESTANA, S.G.P.S., S.A. For the year-ended December 31st 2007
Direct Method
OPERATING ACTIVITIES Cash receipts from trade debtors (a)Cash paid to trade creditors (b)Cash paid to employees
Cash-flow from operations
Income taxes received/(paid) (c)Other receipts/(payments) of operating activities (d)
Cash-flow before extraordinary items
Cash received related to extraordinary itemsCash payments related to extraordinary items
Net cash-flow from operating activities [1] INVESTMENT ACTIVITIES Receipts from: Financial investments (e)Tangible assetsIntangible assetsGovernment grantsInterests and similar profitsDividends
Payments of: Financial investmentsTangible assetsIntangible assetsAssets under construction
Net cash-flow from investment activities [2] FINANCING ACTIVITIES
Receipts from:Loans obtained Capital increases, supplementary capital and premiumsGrants and donationsSales of own sharesAnticipated dividends decreaseCoverage of previous years losses Payments of: Loans obtainedCapital amortization of leasing contractsInterests and similar costsDividendsAnticipated dividends increaseCapital reimbursement and supplementary capitalAcquisition of own sharesOther payments of financing activities
Net cash-flow from financing activities [3]
Net Increase/(Decrease) in cash and cash equivalents [4]=[1]+[2]+[3]Exchange rate effectCash and cash equivalents at the beginning of the periodCash and cash equivalents at the end of the period
IN EURO
Notes to the Cash-Flow Statement Cash 0,00 3,914.12Bank deposits -current accounts 167,985.75 175,183.71 Other Deposits until 3 months 0.00 0.00Other Financial Aplications until 3 months (Cashpooling) 29,822,848.47 25,589,429.51Bank Overdrafts 0.00 0.00Loans from other Group companies (Cashpooling) -53,471,172.96 -43,049,744.00Cash and cash equivalents at the end of the period -23.480.338,74 -17,281,216.66Other Cash and cash equivalents 53,471,172.96 43,049,744.00Cash and cash equivalents at Balance Sheet 29.990.834,22 25,768,527.34
+--
+-+-
+-
2007 2006
2,245,644.34 6,043,945.46 -1,158,431.67 -733,050.00 -372,139.71 -434,917.80 715,072.96 4,875,977.66 -114,046.99 -16,044.79 111,395.28 327,861.36 712,421.25 5,187,794.23 0.00 0.00 0.00 -5,392.47 712,421.25 5,182,401.76
10,211,955.37 0.00 0.00 0.00 0.00 0.00 0.00 0.00 0.00 0.00 0.00 10,211,955.37 1,504,055.09 1,504,055.09 -9,525,063.24 -39,810,498.02 0.00 0.00 -18,730.96 -25,700.00 0.00 -9,543,794.20 -2,500,000.00 -42,336,198.02 668,161.17 -40,832,142.93
10,421,428.96 29,800,289.01 -0.00 43,200,000.00 0.00 0.00 0.00 0.00 0.00 0.00 0.00 10,421,428.96 0.00 73,000,289.01
-3,464,440.23 -5,000,000.02 0.00 0.00 -4,115,264.27 -3,161,233.52 0.00 0.00 0.00 0.00 0.00 0.00 0.00 0.00 0.00 -3,000,000.00 -7,579,704.50 0.00 -11,161,233.54 2,841,724.46 61,839,055.47 4,222,306.88 26,189,314.30 0.00 25,768,527.34 13,762,586.63 29,990,834.22 25,768,527.34
Year-end
NOT
E to
The F
inan
cial S
tatem
ents
As at
31 D
ecem
ber 2
007

GRUPO PESTANA SGPS MANAGEMENT REPORT FINANCIAL STATEMENTS
52
Grupo Pestana, S.G.P.S., S.A is a limited liability company, established in Largo António Nobre no 1, Funchal, created in 5 December 2002. Its main activity is the management of financial investments on other companies, acting like a holding company.
The notes to the financial statements follow the sequential numbering defined in the Portuguese Official Plan of Accounts (POC). Standard notes not included are either not applicable to the Company or their presentation is not relevant to the reading of the referred financial statements.
INTRODUCTION
The accompanying financial statements have been prepared in a going concern basis from the books and accounting records of the Company, maintained in accordance with generally accepted accounting principles in Portugal (“PGAAP”).
The most significant accounting principles used in the preparation of the accompanying financial statements were as follows:
a) Intangible assets
Intangible assets include mainly start-up expenses, which are accounted at acquisition cost and depreciated on a straight-line basis period between 3 to 6 years.
b) Tangible assets
Tangible assets are valued at acquisition cost.
Depreciation is provided on a straight-line basis according to the estimated useful lives between 3 and 7 years.
3. BASIS OF PRESENTATION AND ACCOUNTING PRINCIPLES
GRUPO PESTANA SGPS MANAGEMENT REPORT FINANCIAL STATEMENTS
53
c) Financial investments
Financial investments in subsidiaries and associated companies, on an individual basis, are recorded using the equity method. Initially, the financial investment is recorded at acquisition cost adjusted according to the proportional shareholder’s equity value, reported to the acquisition date or the first-time equity method’s adoption date.
The differences between acquisition cost of subsidiaries and associated companies and the proportional shareholder’s equity fair value on the acquisition date were registered in Financial Investments - shares in group companies, when positive, and depreciated during the current estimated payback period, and in Shareholders’ equity - adjustments to investments in affiliated and associated companies, when negative.
According to the equity method, the financial investments amounts are annually adjusted through the proportional share in the net results of participated companies and registered in the profit and loss account. Additionally, the dividends received are deducted from the respective financial investment asset value.
The remaining financial investments are accounted for at acquisition cost or, in case of loans to associated companies, at the nominal value. The estimated recovery losses on financial investments are registered in the caption Adjustments for financial investments.
The dividends received from these investments are recorded in the profit and loss account for the year when it is decided and communicated the distribution’s decision.
d) Cash-pooling
One of the Company’s functions is to manage the Group’s centralized treasury. Therefore, it registers in Other short term applications and Other loans obtained the amounts granted and received, respectively, to other Group companies, according to the cash-pooling contract.
e) Accrual basis
Costs and revenues are recorded in the year to which they refer, regardless of when they are paid or received, in accordance with the accrual basis principle. Differences between amounts received and paid and the corresponding revenue and expenditure are recorded as accruals and deferrals. f) Assets and liabilities expressed in foreign currencies
All assets and liabilities expressed in foreign currency have been converted into Euro using the exchange rate ruling on the balance sheet date and published by Banco de Portugal.
g) Taxation
Income tax is calculated in accordance with the applicable legal requirements. Deferred taxes are, when applicable, recognised in the financial statements in accordance with Portuguese Accounting Directive nr. 28.

6. TAXATION According with Portuguese Tax Law, tax returns are subject to review and correction by Tax Authorities, for a period of four years subsequent to their filing (five years for Social Security returns. Thus, the Company’s tax returns for the years 2004 to 2007 are still subject to such review.
The Board of Directors believes that any corrections that may arise from a tax review by the Tax Authorities shall not have a material effect on the financial statements as at 31 December 2007 and 2006.
According to article 81o of the Corporate Income Tax Code the Company is subject to a flat tax rate over a set of expenses, which in the current period amounts to Euro 4.018,92.
7. AVERAGE NUMBER OF EMPLOYEES
During 2006 and 2007, the average number of employees was 3.
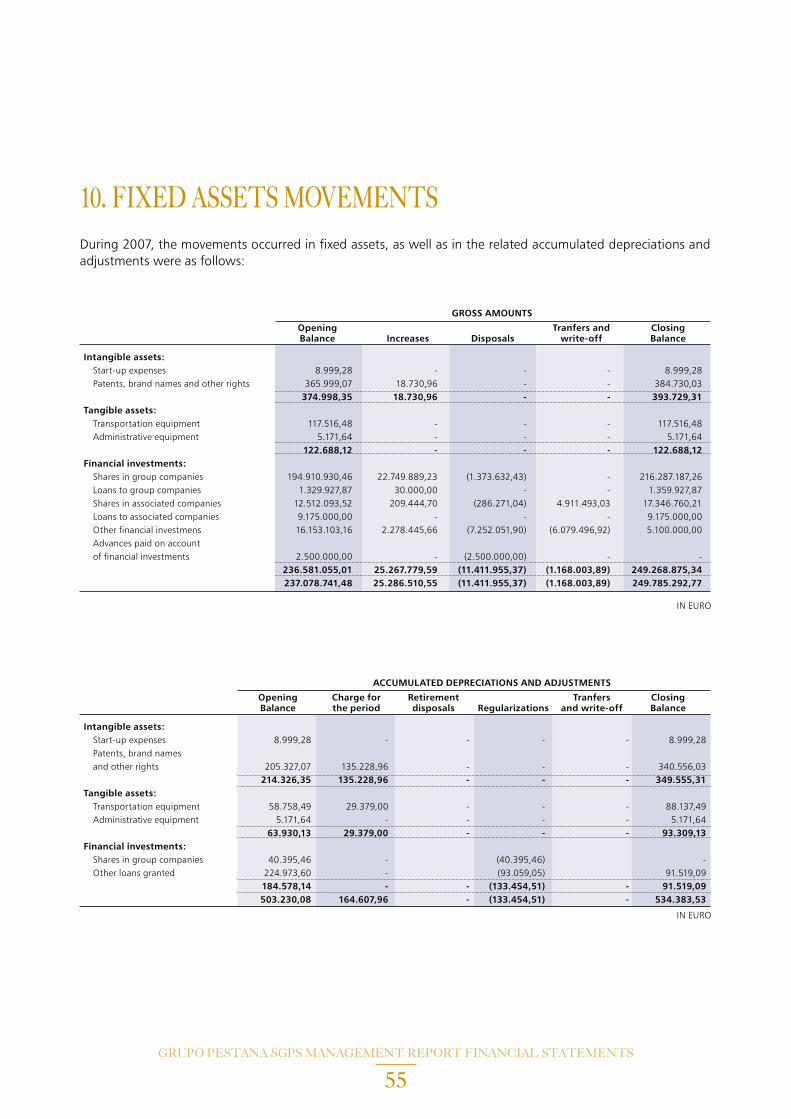
GRUPO PESTANA SGPS MANAGEMENT REPORT FINANCIAL STATEMENTS
55
10. FIXED ASSETS MOVEMENTS During 2007, the movements occurred in fixed assets, as well as in the related accumulated depreciations and adjustments were as follows:
IN EURO
GROSS AMOUNTS
Opening Tranfers and Closing Balance Increases Disposals write-off Balance
Intangible assets: Start-up expenses 8.999,28 - - - 8.999,28 Patents, brand names and other rights 365.999,07 18.730,96 - - 384.730,03 374.998,35 18.730,96 - - 393.729,31Tangible assets: Transportation equipment 117.516,48 - - - 117.516,48 Administrative equipment 5.171,64 - - - 5.171,64 122.688,12 - - - 122.688,12Financial investments: Shares in group companies 194.910.930,46 22.749.889,23 (1.373.632,43) - 216.287.187,26 Loans to group companies 1.329.927,87 30.000,00 - - 1.359.927,87 Shares in associated companies 12.512.093,52 209.444,70 (286.271,04) 4.911.493,03 17.346.760,21 Loans to associated companies 9.175.000,00 - - - 9.175.000,00 Other financial investmens 16.153.103,16 2.278.445,66 (7.252.051,90) (6.079.496,92) 5.100.000,00 Advances paid on account of financial investments 2.500.000,00 - (2.500.000,00) - - 236.581.055,01 25.267.779,59 (11.411.955,37) (1.168.003,89) 249.268.875,34 237.078.741,48 25.286.510,55 (11.411.955,37) (1.168.003,89) 249.785.292,77
IN EURO
ACCUMULATED DEPRECIATIONS AND ADJUSTMENTS
Opening Charge for Retirement Tranfers Closing Balance the period disposals Regularizations and write-off Balance
Intangible assets: Start-up expenses 8.999,28 - - - - 8.999,28 Patents, brand names and other rights 205.327,07 135.228,96 - - - 340.556,03 214.326,35 135.228,96 - - - 349.555,31Tangible assets: Transportation equipment 58.758,49 29.379,00 - - - 88.137,49 Administrative equipment 5.171,64 - - - - 5.171,64 63.930,13 29.379,00 - - - 93.309,13Financial investments: Shares in group companies 40.395,46 - (40.395,46) - Other loans granted 224.973,60 - (93.059,05) 91.519,09 184.578,14 - - (133.454,51) - 91.519,09 503.230,08 164.607,96 - (133.454,51) - 534.383,53
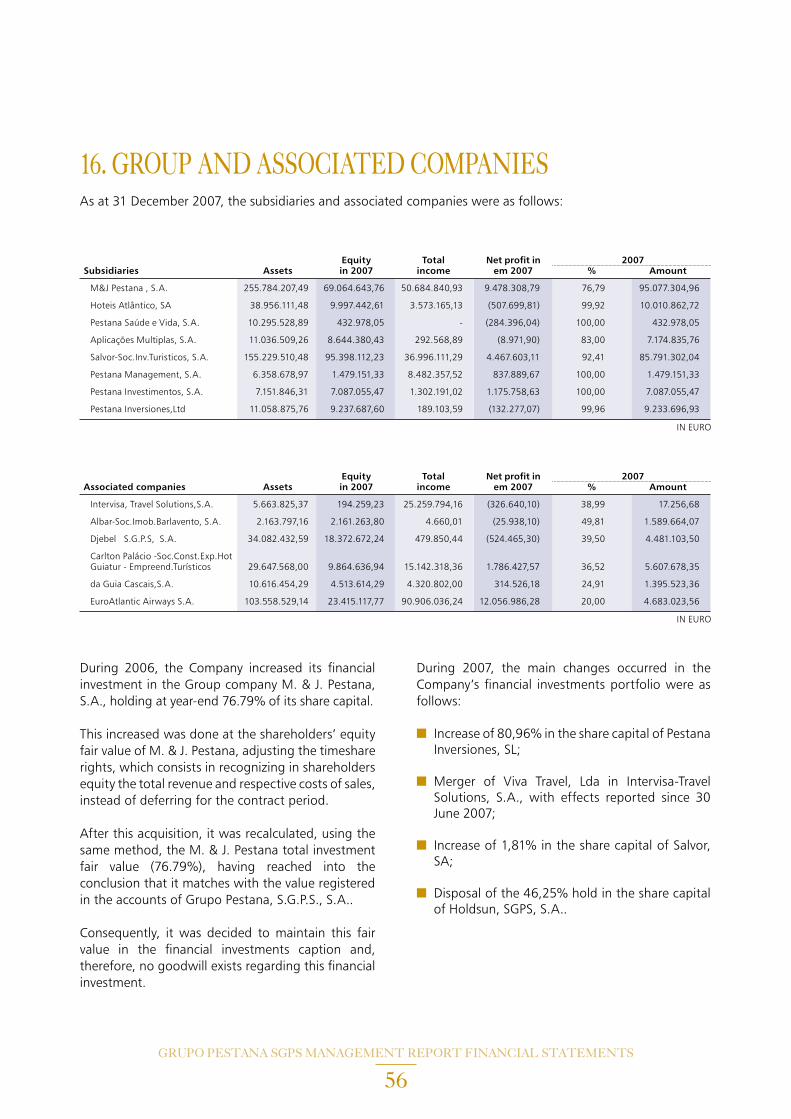
GRUPO PESTANA SGPS MANAGEMENT REPORT FINANCIAL STATEMENTS
56
16. GROUP AND ASSOCIATED COMPANIESAs at 31 December 2007, the subsidiaries and associated companies were as follows:
IN EURO
Equity Total Net profit in 2007Subsidiaries Assets in 2007 income em 2007 % Amount
M&J Pestana , S.A. 255.784.207,49 69.064.643,76 50.684.840,93 9.478.308,79 76,79 95.077.304,96
Hoteis Atlântico, SA 38.956.111,48 9.997.442,61 3.573.165,13 (507.699,81) 99,92 10.010.862,72
Pestana Saúde e Vida, S.A. 10.295.528,89 432.978,05 - (284.396,04) 100,00 432.978,05
Aplicações Multiplas, S.A. 11.036.509,26 8.644.380,43 292.568,89 (8.971,90) 83,00 7.174.835,76
Salvor-Soc.Inv.Turisticos, S.A. 155.229.510,48 95.398.112,23 36.996.111,29 4.467.603,11 92,41 85.791.302,04
Pestana Management, S.A. 6.358.678,97 1.479.151,33 8.482.357,52 837.889,67 100,00 1.479.151,33
Pestana Investimentos, S.A. 7.151.846,31 7.087.055,47 1.302.191,02 1.175.758,63 100,00 7.087.055,47
Pestana Inversiones,Ltd 11.058.875,76 9.237.687,60 189.103,59 (132.277,07) 99,96 9.233.696,93
IN EURO
Equity Total Net profit in 2007Associated companies Assets in 2007 income em 2007 % Amount
Intervisa, Travel Solutions,S.A. 5.663.825,37 194.259,23 25.259.794,16 (326.640,10) 38,99 17.256,68
Albar-Soc.Imob.Barlavento, S.A. 2.163.797,16 2.161.263,80 4.660,01 (25.938,10) 49,81 1.589.664,07
Djebel S.G.P.S, S.A. 34.082.432,59 18.372.672,24 479.850,44 (524.465,30) 39,50 4.481.103,50
Carlton Palácio -Soc.Const.Exp.Hot Guiatur - Empreend.Turísticos 29.647.568,00 9.864.636,94 15.142.318,36 1.786.427,57 36,52 5.607.678,35
da Guia Cascais,S.A. 10.616.454,29 4.513.614,29 4.320.802,00 314.526,18 24,91 1.395.523,36
EuroAtlantic Airways S.A. 103.558.529,14 23.415.117,77 90.906.036,24 12.056.986,28 20,00 4.683.023,56
During 2006, the Company increased its financial investment in the Group company M. & J. Pestana, S.A., holding at year-end 76.79% of its share capital.
This increased was done at the shareholders’ equity fair value of M. & J. Pestana, adjusting the timeshare rights, which consists in recognizing in shareholders equity the total revenue and respective costs of sales, instead of deferring for the contract period.
After this acquisition, it was recalculated, using the same method, the M. & J. Pestana total investment fair value (76.79%), having reached into the conclusion that it matches with the value registered in the accounts of Grupo Pestana, S.G.P.S., S.A..
Consequently, it was decided to maintain this fair value in the financial investments caption and, therefore, no goodwill exists regarding this financial investment.
During 2007, the main changes occurred in the Company’s financial investments portfolio were as follows:
■ Increase of 80,96% in the share capital of Pestana Inversiones, SL;
■ Merger of Viva Travel, Lda in Intervisa-Travel Solutions, S.A., with effects reported since 30 June 2007;
■ Increase of 1,81% in the share capital of Salvor, SA;
■ Disposal of the 46,25% hold in the share capital of Holdsun, SGPS, S.A..
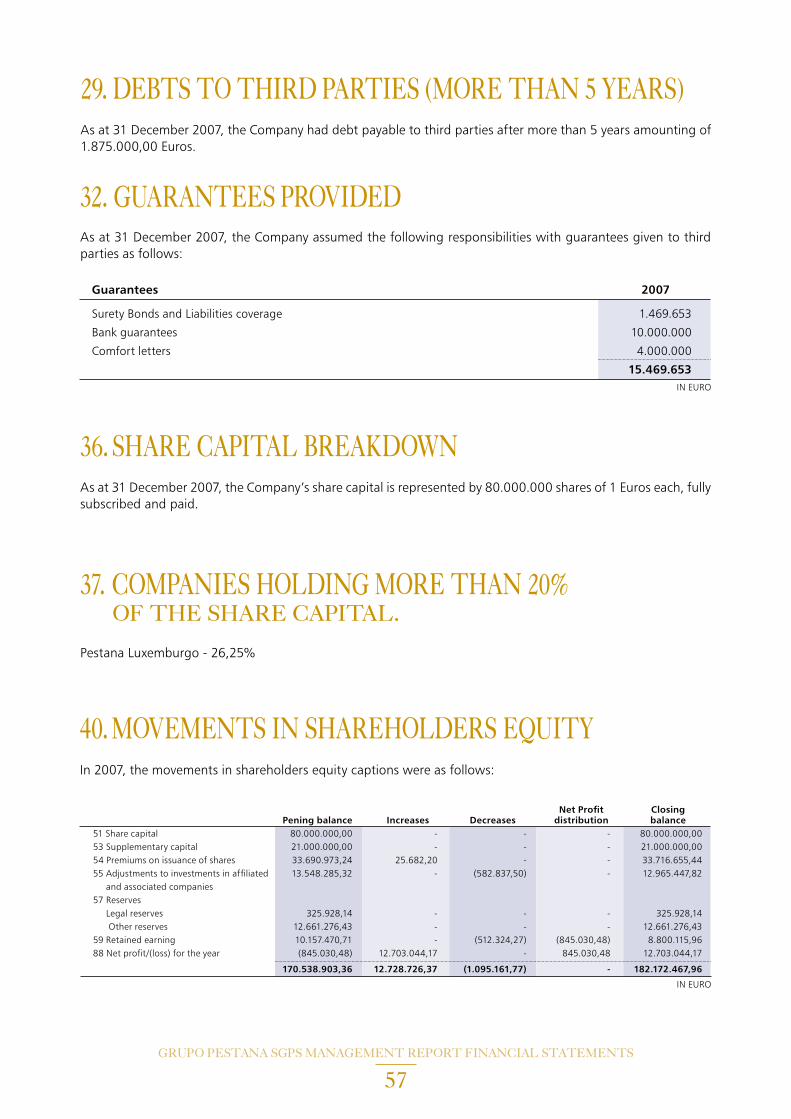
GRUPO PESTANA SGPS MANAGEMENT REPORT FINANCIAL STATEMENTS
57
40. MOVEMENTS IN SHAREHOLDERS EQUITYIn 2007, the movements in shareholders equity captions were as follows:
IN EURO
Net Profit Closing Pening balance Increases Decreases distribution balance 51 Share capital 80.000.000,00 - - - 80.000.000,00 53 Supplementary capital 21.000.000,00 - - - 21.000.000,00 54 Premiums on issuance of shares 33.690.973,24 25.682,20 - - 33.716.655,44 55 Adjustments to investments in affiliated 13.548.285,32 - (582.837,50) - 12.965.447,82 and associated companies 57 Reserves Legal reserves 325.928,14 - - - 325.928,14 Other reserves 12.661.276,43 - - - 12.661.276,43 59 Retained earning 10.157.470,71 - (512.324,27) (845.030,48) 8.800.115,96 88 Net profit/(loss) for the year (845.030,48) 12.703.044,17 - 845.030,48 12.703.044,17
170.538.903,36 12.728.726,37 (1.095.161,77) - 182.172.467,96
As at 31 December 2007, the Company had debt payable to third parties after more than 5 years amounting of 1.875.000,00 Euros.
29. DEBTS TO THIRD PARTIES (MORE THAN 5 YEARS)
As at 31 December 2007, the Company assumed the following responsibilities with guarantees given to third parties as follows:
32. GUARANTEES PROVIDED
Guarantees 2007
Surety Bonds and Liabilities coverage 1.469.653
Bank guarantees 10.000.000
Comfort letters 4.000.000
15.469.653IN EURO
As at 31 December 2007, the Company’s share capital is represented by 80.000.000 shares of 1 Euros each, fully subscribed and paid.
36. SHARE CAPITAL BREAKDOWN
Pestana Luxemburgo - 26,25%
37. COMPANIES HOLDING MORE THAN 20% OF THE SHARE CAPITAL.

GRUPO PESTANA SGPS MANAGEMENT REPORT FINANCIAL STATEMENTS
58
Costs and losses 2007 2006
Interests paid 4.252.728,19 3.259.417,74
Losses in group and associated companies 1.058.550,45 4.024.937,88
Depreciation of financial investments - 1.014.071,49
Adjustments of financial investments 488.773,80 184.578,14
Other financial costs 68.531,63 42.621,48
5.868.584,07 8.525.626,73
Financial results 12.630.870,13 (624.607,56)
18.499.454,20 7.901.019,17
Profits and gains 2007 2006
Interests received 1.764.665,50 988.352,67
Gains in group and associated companies 16.596.847,05 6.725.936,82
Income from financial investments 4.487,14 4.055,09
Other financial gains 133.454,51 182.674,59
18.499.454,20 7.901.019,17
The financial results can be analyzed as follows:
45. STATEMENT OF FINANCIAL RESULTS
IN EURO
Costs and losses 2007 2006Donations - 160,00
Fines and penalties - 427,12
Prior year losses 1.579,32 816,64
Other extraordinary costs and losses 174,31 556,18
1.753,63 1.959,94
Extraordinary results 265.346,43 (1.893,39)
267.100,06 66,55
Profits and gains 2007 2006 Gains in fixed assets 266.400,00 -
Prior year gains 700,00 66,55
Other extraordinary profits and gains 0,06 -
267.100,06 66,55
The extraordinary results can be analyzed as follows:
46. STATEMENT OF EXTRAORDINARY RESULTS
IN EURO

GRUPO PESTANA SGPS MANAGEMENT REPORT FINANCIAL STATEMENTS
59
Short term Medium and long term
Internal loans 53.471.172,96 -
External loans 5.995.365,25 7.500.000,00
Commercial paper - 30.000.000,00
Overdrafts 1.710,17 -
59.468.248,38 37.500.000,00
48. OTHER RELEVANT INFORMATION: LOANS
IN EURO
Year Opening Debt Payment Closing Debt
2008 8.750.000 1.250.000 7.500.000
2009 7.500.000 1.250.000 6.250.000
2010 6.250.000 1.250.000 5.000.000
2011 5.000.000 1.250.000 3.750.000
2012 3.750.000 1.875.000 1.875.000
2013 1.875.000 1.875.000 -
IN EURO
The external loans payable to medium and long term can be analysed as follows:
DEBTOR BALANCES
Special payment on account 11.792,94
Withholding Corporate Income Tax to be recovered 191.196,39
202.989,33
CREDITOR BALANCES
VAT 104.121,90
Social Security 5.290,77
Withholding personal income tax 3.831,86
113.244,53
As at 31 December 2007, the balances with public entities are as follows:
PUBLIC ENTITIES
IN EURO
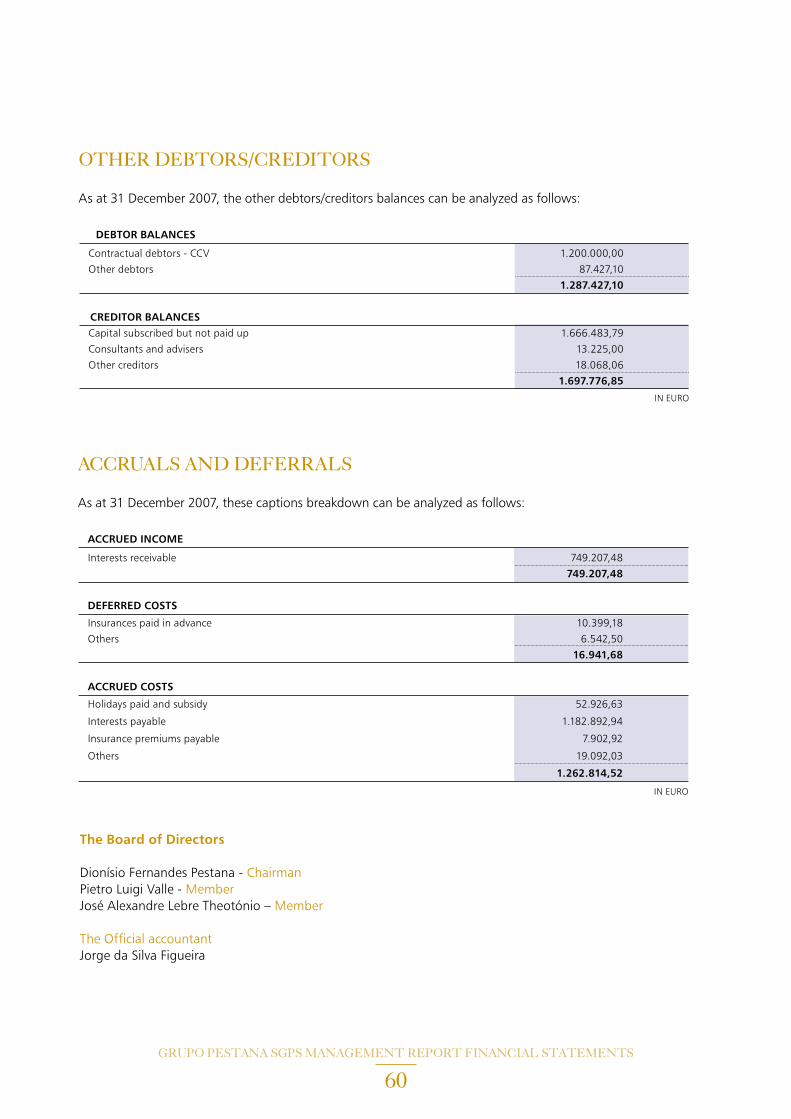
GRUPO PESTANA SGPS MANAGEMENT REPORT FINANCIAL STATEMENTS
60
ACCRUED INCOME
Interests receivable 749.207,48
749.207,48 DEFERRED COSTS
Insurances paid in advance 10.399,18
Others 6.542,50
16.941,68
ACCRUED COSTS
Holidays paid and subsidy 52.926,63
Interests payable 1.182.892,94
Insurance premiums payable 7.902,92
Others 19.092,03
1.262.814,52
As at 31 December 2007, these captions breakdown can be analyzed as follows:
ACCRUALS AND DEFERRALS
IN EURO
DEBTOR BALANCES
Contractual debtors - CCV 1.200.000,00
Other debtors 87.427,10
1.287.427,10
CREDITOR BALANCES Capital subscribed but not paid up 1.666.483,79
Consultants and advisers 13.225,00
Other creditors 18.068,06
1.697.776,85
As at 31 December 2007, the other debtors/creditors balances can be analyzed as follows:
OTHER DEBTORS/CREDITORS
IN EURO
The Board of Directors
Dionísio Fernandes Pestana - ChairmanPietro Luigi Valle - MemberJosé Alexandre Lebre Theotónio – Member
The Official accountant Jorge da Silva Figueira

REPO
RTan
d Op
inion
of th
e Satu
tory
Aud
itor
GRUPO PESTANA SGPS MANAGEMENT REPORT FINANCIAL STATEMENTS
62
In accordance with the applicable legislation and the Company’s by-law, we here with present the report on our supervisory activity over the Board of Directors of Grupo Pestana - S.G.P.S., S.A. for the year ended 31 December, 2007.
With the frequence considered adequate, in general, we have accompanied the company’s evolution through information supplied by the Board of Directors and the Financial Department and verifing the recording of most significant transactions, validated with respective supporting documentation. Our supervisory role comprisedthe verification of patrimonial values and was complemented by obtaining information and explanations on the important transactions and on the company’s business development perspectives, dully informed by the Company’s services and Board of Directors.
The Board of Director’s Report, due to the quality and synthesized information contained regarding the company’s activity in 2007, deserves cared reading by the shareholders.
We verified the adequacy of financial statements- individual and consolidated - reported as of December 31st, 2007, subject to our approval by the Board of Directors and its consistency with the Board of Directors’ report, as well as the adequate disclose of accounting policies and criteria used, which we consider lead to an appropriate evaluation of the Company’s and Group’s patrimony.
As it was our duty, as statutory auditor’s, we have issued today the Auditor’s Report on the company’s financial
statements - individual and consolidated. Likewise and in the same quality, we have issued today our report on the supervisory activity preformed, directed exclusively to the Board of Directors as usually.
In conclusion, we believe that the mentioned documents, read together, permit a reasonable comprehension of the financial position - individualand consolidated - of Grupo Pestana - S.G.P.S.,S.A. as of December 31st 2007 and satisfy legaland statutory requirements.
As result, the Statutory Auditor believes:
1º The shareholders should approve Board ofDirectors annual report and both individual andconsolidated financial statements - disclosed bythe Board of Directors
2º The shareholders should approve the resultdistribution proposed by the Board of Directors.
Funchal, May 13th 2008 The Statutory Auditor
Neves da Silva, Pão Alvo, Maria J. Pimentae Velosa Ferreira, SROC
Represented by:Manuel António Neves da Silva (ROC 625)
TO THE SHAREHOLDERS OFGRUPO PESTANA S.G.P.S., S.A.

AUD
ITOR
’ REP
ORT
Cons
olida
ted
Fina
ncial
Stat
emen
ts
GRUPO PESTANA SGPS MANAGEMENT REPORT FINANCIAL STATEMENTS
64
INTRODUCTION1. We have examined the consolidated financial
statements of Grupo Pestana - S.G.P.S., S.A. which comprise: the Consolidated Balance Sheet as at December 31st, 2007 (showing total assets of Euros 691.423.008 and shareholders’ equity of Euros 223.259.704, including a profit of Euros 15.032.698), the Consolidated Statements of Incomeby nature and by function and the Consolidated Cash Flow Statement for the year then ended and the corresponding Notes to the accounts.
RESPONSABILTIES2. The Company’s Board of Directors is responsible
for the preparation of consolidated financial statements that present a true and fair view of the financial position of the companies included in the consolidation, results of its’ operations and consolidated cash flows, as well the adoption of adequate accounting policies and criteria and the maintenance of appropriate system of internal control.
3. Our responsibility is to issue a professional and independent opinion based on our work over such financial statements.
SCOPE4. Our audit was performed in accordance with
the Auditing Standards (“Normas Técnicas e as Directrizes de Revisão/Auditoria”) issued by the Portuguese Institute of Statutory Auditors (“Ordem dos Revisores Oficiais de Contas”), which require the audit to be planned and performed with the objective of obtaining reasonable assurance about whether the consolidated financial statements are free of material misstatement. An audit includes:
■ verifying that the financial statements of the companies included in the consolidation have been appropriately audited and, for the significant case where that did not happen, verifying, on a sample basis, evidence supporting the amounts and disclosures in the financial statements and assessing the
significant estimates, based on judgments and criteria defined by the Board of Directors, used in their preparation;
■ verifying the consolidation operations;
■ assessing the adequacy of the accounting policies used and disclosed, taking into consideration the circumstances;
■ verifying the applicability of the going concern concept;
■ verifying the adequacy of the overall presentation of the consolidated financial statements.
5. An audit also includes verifying that the financial information included in the Board of Directors’ Report is consistent with the financial statements.
6. We believe that our audit provides a reasonable basis for expressing our opinion.
OPINON7. In our opinion, the referred consolidated financial
statements, present fairly, in all material respects, the consolidated financial position of Grupo Pestana- S.G.P.S., S.A. as of December 31st, 2007 and the consolidated results of its operations, its consolidated cash flows for the year then ended, in conformity with the accounting principles generally accepted in Portugal.
Funchal, May 13th 2008 The Statutory Auditor
Neves da Silva, Pão Alvo, Maria J. Pimentae Velosa Ferreira, SROC
Represented by:Manuel António Neves da Silva (ROC 625)
AUD
ITOR
’ REP
ORT
Indi
vidua
l Fin
ancia
l Stat
emen
t
GRUPO PESTANA SGPS MANAGEMENT REPORT FINANCIAL STATEMENTS
66
INTRODUCTION1. We have examined the financial statements of
Grupo Pestana - S.G.P.S., S.A. which comprise: the Balance Sheet as at December 31st, 2007 (showing total assets of Euros 282.324.398 and shareholders’ equity of Euros 182.172.468, including a loss of Euros 12.703.044), the Statements of Income by nature and by function and the Cash Flow Statement for the year then ended and the corresponding Notes to the accounts.
RESPONSABILTIES2. The Company’s Board of Directors is responsible
for the preparation of financial statements that present a true and fair view of the company’s financial position, results of its operations and cash flows, as well the adoption of adequate accounting policies and criteria and the maintenance of appropriate system of internal control.
3. Our responsibility is to issue a professional and independent opinion based on our work over such financial statements.
SCOPE4. Our audit was performed in accordance with
the Auditing Standards (“Normas Técnicas e as Directrizes de Revisão/Auditoria”) issued by the Portuguese Institute of Statutory Auditors (“Ordem dos Revisores Oficiais de Contas”), which require the audit to be planned and performed with the objective of obtaining reasonable assurance about whether the financial statements are free of material misstatement. An audit includes:
■ verifying, on a sample basis, evidence supporting the amounts and disclosures in the financial statements and assessing the significant estimates, based on judgments and criteria defined by the Board of Directors, used in their preparation;
■ assessing the adequacy of the accounting policies used, their uniform application and their disclosure, taking into consideration the circumstances;
■ verifying the applicability of the going concern concept;
■ verifying the adequacy of the overall presentation of the financial statements.
5. An audit also includes verifying that the financial information included in the Board of Directors’ Report is consistent with the financial statements
6. We believe that our audit provides a reasonable basis for expressing our opinion.
OPINION7. In our opinion, the referred financial statements,
present fairly, in all material respects, the financial position of Grupo Pestana - S.G.P.S., S.A. as of December 31st, 2007 and the results of its operations, its cash flows for the year then ended, in conformity with the accounting principles generally accepted in Portugal.
Funchal, May 13th 2008 The Statutory Auditor
Neves da Silva, Pão Alvo, Maria J. Pimentae Velosa Ferreira, SROC
Represented by:Manuel António Neves da Silva (ROC 625)

Larg
o Ant
ónio
Nob
re 9
004-
531 F
unch
al, M
adeir
aww
w.pe
stana
.com