GRUPO CEMENTOS DE CHIHUAHUA, S.A.B. DE C.V. … CEMENTOS DE CHIHUAHUA, S.A.B. DE C ... GCC REPORTS...
10
GRUPO CEMENTOS DE CHIHUAHUA, S.A.B. DE C.V. (BMV: GCC *) First quarter 2015 earnings results
-
Upload
nguyencong -
Category
Documents
-
view
222 -
download
0
Transcript of GRUPO CEMENTOS DE CHIHUAHUA, S.A.B. DE C.V. … CEMENTOS DE CHIHUAHUA, S.A.B. DE C ... GCC REPORTS...

GRUPO CEMENTOS DE CHIHUAHUA, S.A.B. DE C.V.
(BMV: GCC *) First quarter 2015 earnings results

1
1Q2015 Earnings
GCC REPORTS FIRST QUARTER 2015 RESULTS
Chihuahua, Chihuahua, Mexico, April 28, 2015 – Grupo Cementos de Chihuahua, S.A.B. de C.V. (“GCC” or the “Company”) (BMV: GCC *), a leading producer of cement and concrete in markets in Mexico and the United States, announces its results for the first quarter of 2015.
HIGHLIGHTS
GCC generated strong growth in sales, operating income, EBITDA and net income for the first quarter of 2015 compared to the same period of last year.
• Total sales grew 20.0%
• Operating income rose 522.4%
• EBITDA increased 47.2%
• Net income rose 501.5%
• Leverage ratio declined from 4.02 times EBITDA to 2.87 times EBITDA
KEY FIGURES (millions of pesos)
1Q15 1Q14 1Q15 vs 1Q14
Net Sales 2,094.4 1,744.8 20.0%
Operating Income 113.7 18.3 522.4%
EBITDA 339.8 230.8 47.2%
Consolidated Net Income 40.1 (10.0) 501.5%
EBITDA: operating income + depreciation and amortization
FINANCIAL RESULTS
During the first quarter of 2015, Net Sales increased 20.0% over the same period of last year, totaling $2,094.4 million pesos. This increase reflects strong sales momentum in Mexico and good results in the United States, with better pricing for all of the Company’s products.
In the United States, sales rose 17.9% in the quarter compared to the previous year, totaling $1,244.0 million pesos. The factors that led to this increase were: 1% growth in concrete sales volumes, driven by operations in the north; cement volumes similar to 2014 levels, supported by sales in Texas and South Dakota; and better pricing for all products. In addition, the 12.9% depreciation of the peso against the dollar positively impacted sales in peso terms.
The rise in US sales in dollar terms was 4.3%, driven by increased activity during the quarter in the following segments: public sector, with the construction of highways and roads; public utilities infrastructure; and the non-residential sector, particularly the manufacturing, commercial, health and office building segments.
2
1Q2015 Earnings
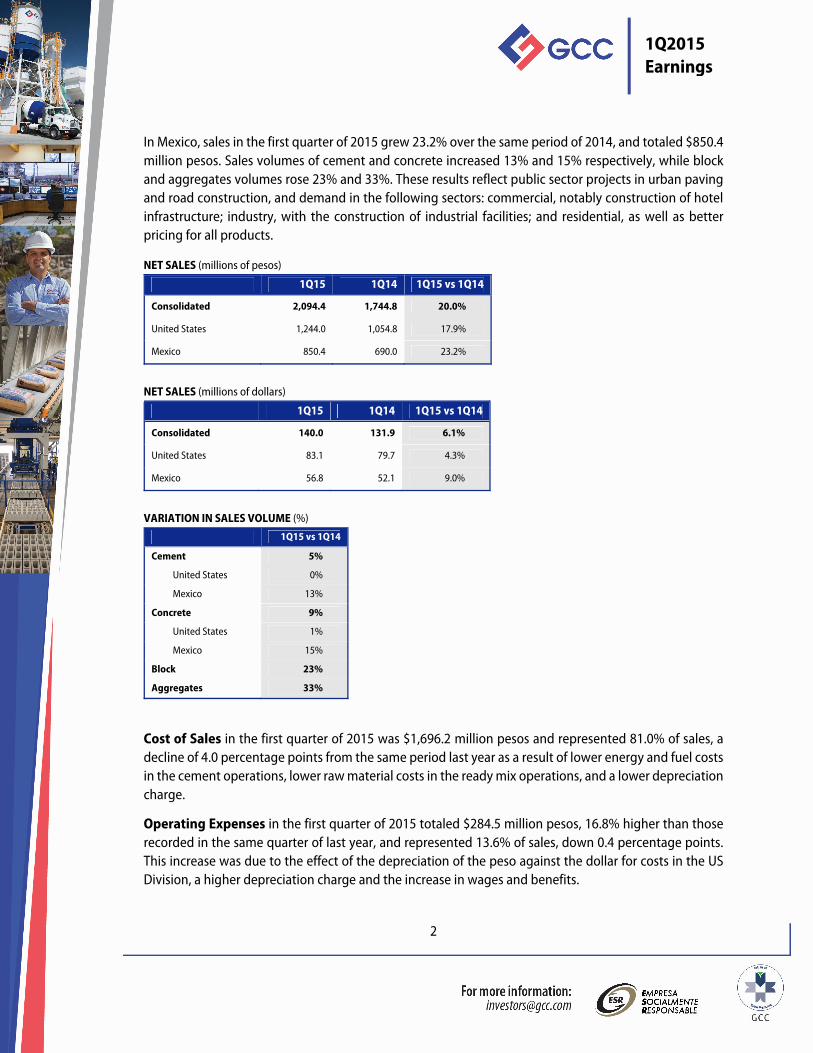
In Mexico, sales in the first quarter of 2015 grew 23.2% over the same period of 2014, and totaled $850.4 million pesos. Sales volumes of cement and concrete increased 13% and 15% respectively, while block and aggregates volumes rose 23% and 33%. These results reflect public sector projects in urban paving and road construction, and demand in the following sectors: commercial, notably construction of hotel infrastructure; industry, with the construction of industrial facilities; and residential, as well as better pricing for all products.
NET SALES (millions of pesos)
1Q15 1Q14 1Q15 vs 1Q14
Consolidated 2,094.4 1,744.8 20.0%
United States 1,244.0 1,054.8 17.9%
Mexico 850.4 690.0 23.2%
NET SALES (millions of dollars)
1Q15 1Q14 1Q15 vs 1Q14
Consolidated 140.0 131.9 6.1%
United States 83.1 79.7 4.3%
Mexico 56.8 52.1 9.0%
VARIATION IN SALES VOLUME (%)
1Q15 vs 1Q14
Cement 5%
United States 0%
Mexico 13%
Concrete 9%
United States 1%
Mexico 15%
Block 23%
Aggregates 33%
Cost of Sales in the first quarter of 2015 was $1,696.2 million pesos and represented 81.0% of sales, a decline of 4.0 percentage points from the same period last year as a result of lower energy and fuel costs in the cement operations, lower raw material costs in the ready mix operations, and a lower depreciation charge.
Operating Expenses in the first quarter of 2015 totaled $284.5 million pesos, 16.8% higher than those recorded in the same quarter of last year, and represented 13.6% of sales, down 0.4 percentage points. This increase was due to the effect of the depreciation of the peso against the dollar for costs in the US Division, a higher depreciation charge and the increase in wages and benefits.

3
1Q2015 Earnings
Operating Income in the first quarter of 2015 rose 522.4% over the same quarter of 2014 to $113.7 million pesos.
EBITDA in the first quarter of the year increased 47.2% over the first quarter of 2014, totaling $339.8 million pesos. The margin increased 3.0 percentage points and represented 16.2% of sales.
Net Financial Expenses in the first quarter of 2015 totaled $137.5 million pesos, rising 6.3% over the same quarter of last year. This was due to the effect of the depreciation of the peso against the dollar on financial expenses, which was somewhat offset by the effect of reduced interest rates with the lower leverage ratio, and a lower debt balance. Additionally, a foreign exchange gain was recorded for the effect of the depreciation of the peso against the dollar.
In the first quarter of 2015, Income Taxes resulted in a benefit of $60.9 million pesos, a decrease of 37.7% compared to the benefit recorded in the same period of 2014, due to the 80.6% reduction in pre-tax losses, compared to the figure registered in the first quarter of last year.
Consolidated Net Income in the first quarter of 2015 totaled $40.1 million pesos, which compares favorably with the net loss of $9.9 million pesos recorded in the first quarter of 2014. The increase in net income was 501.5%.
Free Cash Flow during the first quarter required $338.3 million pesos in resources, a rise of 102.6% compared with the resource requirement of $167.0 million pesos in the first quarter of 2014. This variation is comprised of higher working capital requirements, mainly for inventory in preparation for the high demand season, and the 188.6% increase in capital expenditures; these were partially offset by the 24.8% decrease in taxes paid and the 47.2% increase in EBITDA.
EBITDA AND FREE CASH FLOW (millions of pesos)
1Q15 1Q14 Var
Operating Income 113.7 18.3 522.4%
Depreciation y amortization 226.2 212.6 6.4%
EBITDA 339.8 230.8 47.2%
Interest income (expense) (188.0) (184.7) 1.8%
(Increase) Decrease in working capital
(255.2) (119.0) 114.5%
Taxes (12.4) (16.5) -24.8%
Capital expenditures* (222.1) (76.9) 188.6%
Other (0.4) (0.7) -38.6%
Free Cash Flow (338.3) (167.0) 102.6%
*Excludes investments in new production capacity and acquisitions
Total Interest-Bearing Debt at March 31, 2015 was $6,851.4 million pesos, 8.5% higher than at the end of March 2014. This increase is due to the combination of amortization payments made, equivalent to 12.0% of bank debt, and the depreciation of the peso against the dollar. The Company’s leverage ratio

4
1Q2015 Earnings
declined from 4.02 times EBITDA to 2.87 times EBITDA as a result of higher EBITDA and the lower debt balance.
At the end of the first quarter of 2015, short-term debt accounted for 12.6% of total debt and totaled $863.7 million pesos. Of the Company’s total debt, 93% is denominated in dollars and 7% in pesos.
INTEREST- BEARING DEBT (millions of pesos)
Mar-2015 Mar-2014 2015 vs 2014
TOTAL 6,851.4 6,316.5 8.5%
U.S. dollar denominated 93% 92%
Mexican peso denominated 7% 8%
Short-term 863.7 399.5 116.2%
U.S. dollar denominated 85% 83%
Mexican peso denominated 15% 17%
Long-term 5,987.7 5,917.0 1.2%
U.S. dollar denominated 94% 92%
Mexican peso denominated 6% 8%
GCC’s Total Assets at March 31, 2015 totaled $24,342.6 million pesos, rising 12.0% with respect to the total assets at the close of the first quarter of 2014, primarily due to the effect of the depreciation of the peso against the dollar on the assets in the US Division, capital expenditures and the increase in inventories.
As per the provisions of Article 4.033.01 section VIII of the Mexican Stock Exchange Regulations, the Company discloses that as of January 2014, analyst coverage of GCC stock is conducted by the independent research group Investigaciones MSMexico, S. de R.L. de C.V. (Morningstar).
5
1Q2015 Earnings
OTHER EVENTS
GCC’s global credit ratings were upgraded by Standard & Poor's and Fitch Ratings.
GCC’s current rating by Standard & Poor's is 'B +' with a positive outlook, and in the opinion of the ratings agency, GCC’s operating and financial performance has consistently improved, owing to more robust market conditions, particularly in the United States, and also due to the Company’s prudent financial practices. The positive outlook reflects the potential to upgrade GCC’s rating within the next twelve months, if free cash flow continues to improve.
Fitch Ratings has a 'BB-' rating for GCC with stable outlook, and the agency reported in its statement that GCC’s rating reflects its solid business position in the cement, ready mix and aggregates segments in the regions where the Company has presence, the diversification of its operations in Mexico and the United States in the residential and non-residential sectors, and positive free cash flow generation across the last industry cycle.
The ratings of Standard & Poor's and Fitch Ratings were revised on December 19, 2014 and January 21, 2015, respectively.
GCC informs the results of an international arbitration.
Today GCC informed the reception of the “Final Award on Damages” dated April 15, 2015 (the “Damages Award”) in the arbitration commenced against GCC by Compañia de Inversiones Mercantiles, S.A. (CIMSA) pursuant to the Inter-American Commission on International Commercial Arbitration (CIAC). The Damages Award provides for GCC and its affiliate, GCC Latinoamerica, S.A. de C.V., to pay CIMSA approximately USD 36.1 million in damages, costs and attorneys’ fees.
GCC believes that both the Liability Award and the Damages Award are contrary to Bolivian and international law. Accordingly, it has filed a petition for annulment of the Liability Award, which is currently pending before a Bolivian court. GCC will promptly file a petition for annulment of the Damages Award with the same court and will pursue all other remedies available to it. If either petition is granted in full, the Damages Award will be of no effect. In addition, GCC filed an injunction action with the Mexican courts in order to enjoin CIMSA from executing any arbitration award until the petition for annulment is resolved.
At the appropriate time, GCC will pursue any contractual claims available to it to recover any damages resulting from the Final Award on Damages.
Pursuant to Bolivian Law, the execution of the Final Award on Damages is suspended until the petitions for annulment are resolved.
6
1Q2015 Earnings
BASIS OF PREPARATION FOR FINANCIAL STATEMENTS
All figures herein were prepared in accordance with International Financial Reporting Standards, and are expressed in Mexican pesos. Unless otherwise stated, all percentage changes refer to the 2015 figures compared to those of 2014.
About GCC
GCC is a leading supplier of cement, aggregates, concrete and construction‐related services in Mexico and the United States. The Company has annual cement production capacity of 4.6 million tons.
Founded in 1941, the Company’s shares trade on the Mexican Stock Exchange under the ticker symbol GCC*.
This document contains forward-looking statements relating to Grupo Cementos de Chihuahua S.A.B. de C.V. and subsidiaries (GCC) based upon management projections. These projections reflect GCC’s opinion on future events that may be subject to a number of risks and uncertainties. Various factors may cause actual results to differ from those expressed herein, including, among others, changes in macroeconomic, political, governmental or business conditions in the markets where GCC operates; changes in interest rates, inflation rates and currency exchange rates; construction industry performance; pricing, business strategy and other factors. Should one or more of these risks or uncertainties materialize, or should underlying assumptions prove incorrect, actual results may vary materially from those described herein. GCC assumes no obligation to update or correct the information contained in this press release.

7
1Q2015 Earnings
Income Statement (Thousands of pesos)
1Q 2015 % 1Q 2014 % 1Q15 / 1Q14
Net sales 2,094,363 100.0% 1,744,773 100.0% 20.0% Mexico sales 850,361 40.6% 689,985 39.5% 23.2% USA sales 1,244,002 59.4% 1,054,788 60.5% 17.9%Cost of sales 1,696,156 81.0% 1,482,977 85.0% 14.4%
Gross income 398,207 19.0% 261,796 15.0% 52.1%
Operating expenses 284,536 13.6% 243,532 14.0% 16.8%
Operating income (loss) 113,671 5.4% 18,264 1.0% 522.4%
Other expenses, net 429 0.0% 700 0.0% -38.7%
Operating income (loss) after other expenses, net 113,242 5.4% 17,564 1.0% 544.7%
Financial income 7,254 0.3% 7,022 0.4% 3.3% Financial expenses (152,065) -7.3% (139,107) -8.0% 9.3% Exchange gain (loss), net 7,300 0.3% 2,741 0.2% 166.3%Net financing income (expenses) (137,511) -6.6% (129,344) -7.4% 6.3%
Earnings in associates 3,400 0.2% 3,935 0.2% -13.6%
Income (loss) before taxes (20,869) -1.0% (107,845) -6.2% -80.6%
Income taxes (60,926) -2.9% (97,868) -5.6% -37.7%
Consolidated net (loss) income 40,057 1.9% (9,977) -0.6% 501.5%Controlling interest 39,996 1.9% (9,996) -0.6% 500.1%Non-controlling interest 61 0.0% 19 0.0% 222.0%
EBITDA 339,824 16.2% 230,823 13.2% 47.2%
Free cash flow (338,323) -19.4% (167,022) -9.6% 102.6%
8
1Q2015 Earnings
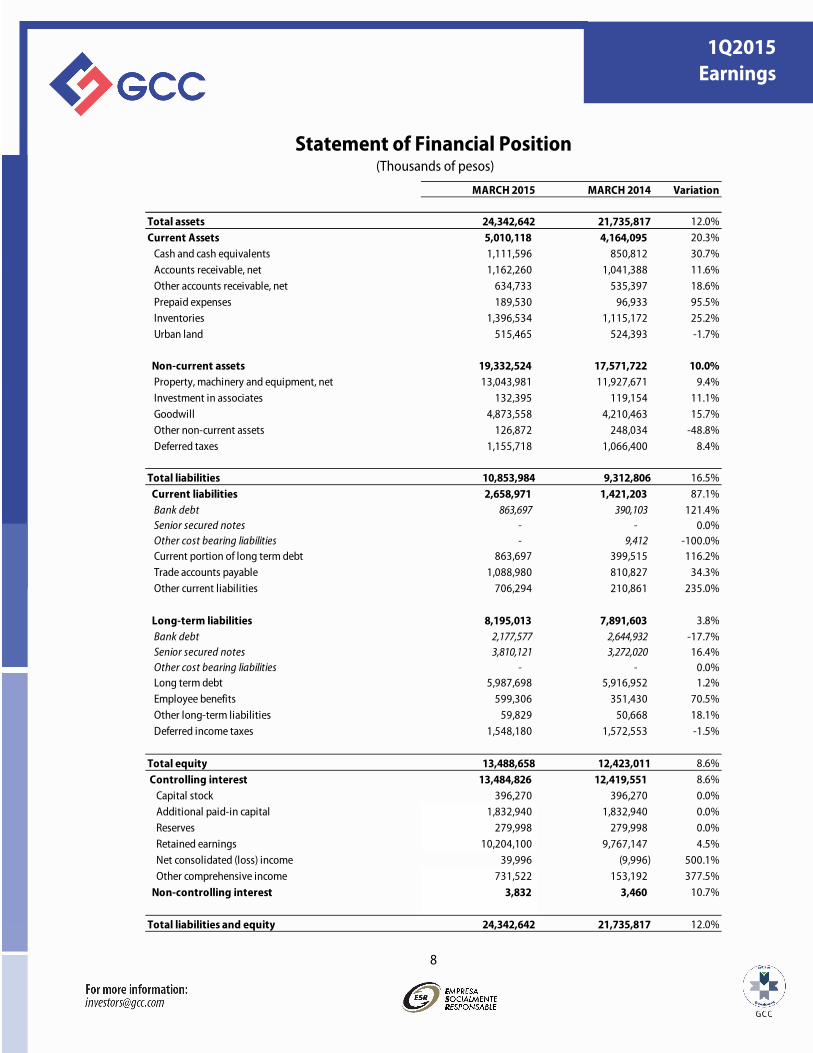
Statement of Financial Position (Thousands of pesos)
MARCH 2015 MARCH 2014 Variation
Total assets 24,342,642 21,735,817 12.0%Current Assets 5,010,118 4,164,095 20.3% Cash and cash equivalents 1,111,596 850,812 30.7% Accounts receivable, net 1,162,260 1,041,388 11.6% Other accounts receivable, net 634,733 535,397 18.6% Prepaid expenses 189,530 96,933 95.5% Inventories 1,396,534 1,115,172 25.2% Urban land 515,465 524,393 -1.7%
0 Non-current assets 19,332,524 17,571,722 10.0% Property, machinery and equipment, net 13,043,981 11,927,671 9.4% Investment in associates 132,395 119,154 11.1% Goodwill 4,873,558 4,210,463 15.7% Other non-current assets 126,872 248,034 -48.8% Deferred taxes 1,155,718 1,066,400 8.4%
Total liabilities 10,853,984 9,312,806 16.5% Current liabilities 2,658,971 1,421,203 87.1% Bank debt 863,697 390,103 121.4% Senior secured notes - - 0.0% Other cost bearing liabilities - 9,412 -100.0% Current portion of long term debt 863,697 399,515 116.2% Trade accounts payable 1,088,980 810,827 34.3% Other current liabilities 706,294 210,861 235.0%
Long-term liabilities 8,195,013 7,891,603 3.8% Bank debt 2,177,577 2,644,932 -17.7% Senior secured notes 3,810,121 3,272,020 16.4% Other cost bearing liabilities - - 0.0% Long term debt 5,987,698 5,916,952 1.2% Employee benefits 599,306 351,430 70.5% Other long-term liabilities 59,829 50,668 18.1% Deferred income taxes 1,548,180 1,572,553 -1.5%
Total equity 13,488,658 12,423,011 8.6% Controlling interest 13,484,826 12,419,551 8.6% Capital stock 396,270 396,270 0.0% Additional paid-in capital 1,832,940 1,832,940 0.0% Reserves 279,998 279,998 0.0% Retained earnings 10,204,100 9,767,147 4.5% Net consolidated (loss) income 39,996 (9,996) 500.1% Other comprehensive income 731,522 153,192 377.5% Non-controlling interest 3,832 3,460 10.7%
Total liabilities and equity 24,342,642 21,735,817 12.0%
9
1Q2015 Earnings
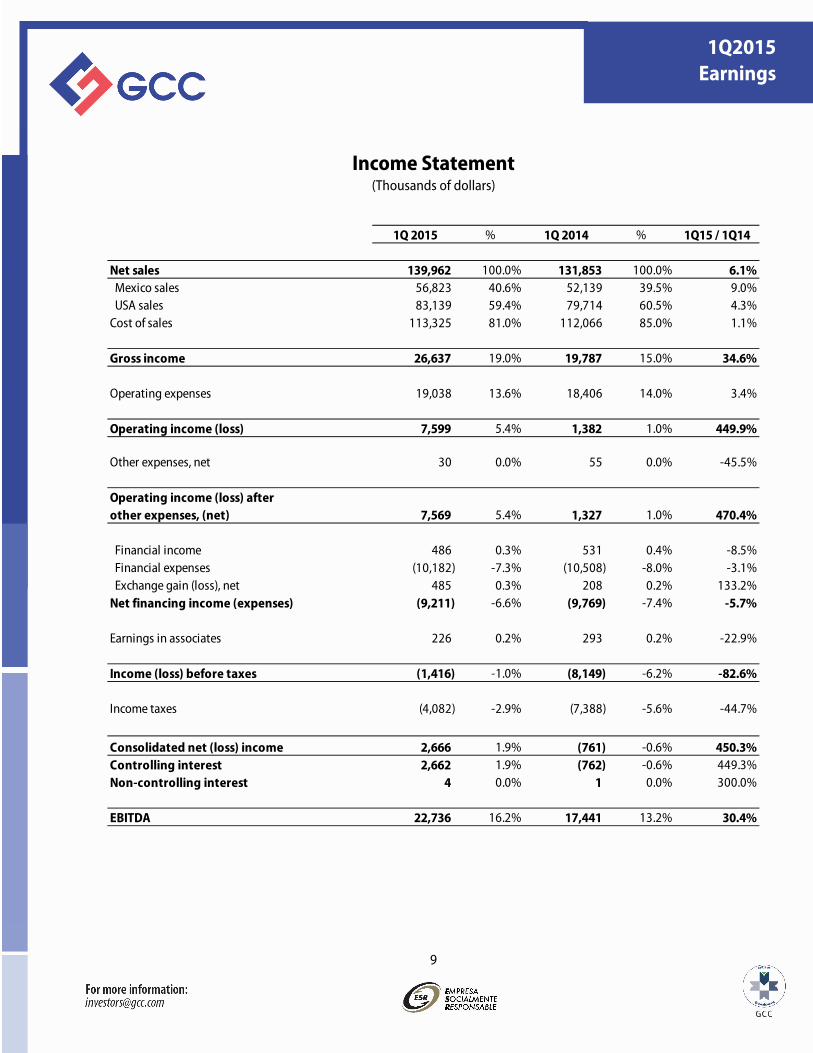
Income Statement (Thousands of dollars)
1Q 2015 % 1Q 2014 % 1Q15 / 1Q14
Net sales 139,962 100.0% 131,853 100.0% 6.1% Mexico sales 56,823 40.6% 52,139 39.5% 9.0% USA sales 83,139 59.4% 79,714 60.5% 4.3%Cost of sales 113,325 81.0% 112,066 85.0% 1.1%
Gross income 26,637 19.0% 19,787 15.0% 34.6%
Operating expenses 19,038 13.6% 18,406 14.0% 3.4%
Operating income (loss) 7,599 5.4% 1,382 1.0% 449.9%
Other expenses, net 30 0.0% 55 0.0% -45.5%
Operating income (loss) after other expenses, (net) 7,569 5.4% 1,327 1.0% 470.4%
Financial income 486 0.3% 531 0.4% -8.5% Financial expenses (10,182) -7.3% (10,508) -8.0% -3.1% Exchange gain (loss), net 485 0.3% 208 0.2% 133.2%Net financing income (expenses) (9,211) -6.6% (9,769) -7.4% -5.7%
Earnings in associates 226 0.2% 293 0.2% -22.9%
Income (loss) before taxes (1,416) -1.0% (8,149) -6.2% -82.6%
Income taxes (4,082) -2.9% (7,388) -5.6% -44.7%
Consolidated net (loss) income 2,666 1.9% (761) -0.6% 450.3%Controlling interest 2,662 1.9% (762) -0.6% 449.3%Non-controlling interest 4 0.0% 1 0.0% 300.0%
EBITDA 22,736 16.2% 17,441 13.2% 30.4%