GRPDLQ - Main < TWiki
32
Copyright (c) 2011 IEEE. Personal use is permitted. For any other purposes, permission must be obtained from the IEEE by emailing [email protected]. This article has been accepted for publication in a future issue of this journal, but has not been fully edited. Content may change prior to final publication. Abst ra c t²We propose a concatenative synthesis approach to the problem of foreign accent conversion. The approach consists of replacing the most accented portions of non-native speech with alternative segments from a corpus of WKH VSHDNHU¶V own speech based on their similarity to those from a reference native speaker. We propose and compare two approaches for selecting units, one based on acoustic similarity (e.g. MFCCs) and a second one based on articulatory similarity, as measured through EMA. Our hypothesis is that articulatory features provide a better metric for linguistic similarity across speakers than acoustic features. To test this hypothesis, we recorded an articulatory-acoustic corpus from a native and a non-native speaker, and evaluated the two speech representations (acoustic vs. articulatory) through a series of perceptual experiments. Formal listening tests indicate that the approach can achieve a 20% reduction in perceived accent, but also reveal a strong coupling between accent and speaker identity. To address this issue, we disguised original and resynthesized utterances by altering their average pitch and normalizing vocal tract length. An additional listening experiment supports the hypothesis that articulatory features are less speaker dependent than acoustic features. I . I NTRODUCTION Despite years or decades of immersion in a new culture, older learners of a second language (L2) typically speak with a so-FDOOHG ³IRUHLJQ DFFHQW.´ $PRQJ WKH PDQ\ DVSHFWV RI SURILFLHQF\ LQ D VHFRQG language, native-like pronunciation can be the most difficult to master because of the neuro-musculatory basis of speech production [1]. $ IRUHLJQ DFFHQW GRHV QRW QHFHVVDULO\ DIIHFW D SHUVRQ¶V DELOLW\ WR EH )RUHLJQ DFFHQW FRQYHUVLRQ WKURXJK FRQFDWHQDWLYH V\QWKHVLV LQ WKH DUWLFXODWRU\ GRPDLQ Daniel Felps, Christian Geng, and Ricardo Gutierrez-Osuna, Senior Membe r , IEEE Copyright (c) 2010 IEEE. Personal use of this material is permitted. However, permission to use this material for any other purposes must be obtained from the IEEE by sending a request to [email protected]. Manuscript received June 20, 2011. This work was supported by NSF award 0713205, the SMART scholarship program at the Department of Defense, and EPSRC grants EP/E01609X/1 and EP/E016359/1. D. Felps is with Texas A&M University, College Station, TX 77843 USA (email: [email protected]). C. Geng is with the University of Edinburgh, Edinburg, Scotland UK (email: [email protected]).R. Gutierrez-Osuna is with TAMU, College Station, TX 77843 USA (phone: 979-845-2942; fax: 979-847-8578; e-mail: [email protected]).
Transcript of GRPDLQ - Main < TWiki

Copyright (c) 2011 IEEE. Personal use is permitted. For any other purposes, permission must be obtained from the IEEE by emailing [email protected].
This article has been accepted for publication in a future issue of this journal, but has not been fully edited. Content may change prior to final publication.
Abstract We propose a concatenative synthesis approach to the problem of foreign accent
conversion. The approach consists of replacing the most accented portions of non-native speech with
alternative segments from a corpus of own speech based on their similarity to those from a
reference native speaker. We propose and compare two approaches for selecting units, one based on
acoustic similarity (e.g. MFCCs) and a second one based on articulatory similarity, as measured through
EMA. Our hypothesis is that articulatory features provide a better metric for linguistic similarity across
speakers than acoustic features. To test this hypothesis, we recorded an articulatory-acoustic corpus from
a native and a non-native speaker, and evaluated the two speech representations (acoustic vs. articulatory)
through a series of perceptual experiments. Formal listening tests indicate that the approach can achieve a
20% reduction in perceived accent, but also reveal a strong coupling between accent and speaker identity.
To address this issue, we disguised original and resynthesized utterances by altering their average pitch
and normalizing vocal tract length. An additional listening experiment supports the hypothesis that
articulatory features are less speaker dependent than acoustic features.
I . IN T R O DU C T I O N
Despite years or decades of immersion in a new culture, older learners of a second language (L2)
typically speak with a so- .
language, native-like pronunciation can be the most difficult to master because of the neuro-musculatory
basis of speech production [1].
Daniel Felps, Christian Geng, and Ricardo Gutierrez-Osuna, Senior Member, IEEE
Copyright (c) 2010 IEEE. Personal use of this material is permitted. However, permission to use this material for any other purposes must be obtained from the IEEE by sending a request to [email protected]. Manuscript received June 20, 2011. This work was supported by NSF award 0713205, the SMART scholarship program at the Department of Defense, and EPSRC grants EP/E01609X/1 and EP/E016359/1. D. Felps is with Texas A&M University, College Station, TX 77843 USA (email: [email protected]). C. Geng is with the University of Edinburgh, Edinburg, Scotland UK (email: [email protected]).R. Gutierrez-Osuna is with TAMU, College Station, TX 77843 USA (phone: 979-845-2942; fax: 979-847-8578; e-mail: [email protected]).

Copyright (c) 2011 IEEE. Personal use is permitted. For any other purposes, permission must be obtained from the IEEE by emailing [email protected].
This article has been accepted for publication in a future issue of this journal, but has not been fully edited. Content may change prior to final publication.
understood, but it may subject them to discriminatory attitudes and negative stereotypes [2]. Thus, by
achieving near-native pronunciation, L2 learners stand to gain more than just better intelligibility.
A number of computer-assisted pronunciation training (CAPT) techniques have been investigated
for this purpose [3]. Although not as effective as human instruction, CAPT allows users to follow
personalized lessons, at their own pace, and practice as often as they like. Despite these advantages CAPT
remains controversial, partly because many commercial products tend to choose technological novelty
over pedagogical value [4]. As an example, a product may display the
waveform or a spectrogram) against that from a native speaker. These visualizations are not only difficult
to interpret for non-specialists but they are also misleading: two utterances can have different acoustic
representations despite having been pronounced correctly. The most praised systems are those that
incorporate automatic speech recognition (ASR) because they can provide users with objective and
consistent feedback. However, using ASR technology to detect pronunciation errors and evaluate
pronunciation quality [5] is challenging because of the inherent variability of non-native speech. As a
result, ASR errors may frustrate and mislead the learner, and ultimately undermine their trust in the CAPT
tool. For these reasons, some authors have suggested that CAPT systems should rely on implicit rather
than explicit feedback [6]. As an example, recasts a rephrasing of the incorrectly pronounced
[7].
Supporting the use of implicit feedback, a handful of studies during the last two decades have
suggested that it would be beneficial for L2 students to be able to listen to their own voices producing
native-accented utterances. The rationale is that,
quality, it becomes easier for the learner to perceive differences between their accented utterances and
accent-free counterparts. As an example, Nagano and Ozawa [8] and Bissiri et al. [9] showed that
allowing learners to hear their own utterances resynthesized with a native prosody led to further
improvements in pronunciation than listening to prerecorded utterances from a native speaker. Results by
Probst et al. [10] also indicate that choosing a well-matched voice to imitate leads to improvements in

Copyright (c) 2011 IEEE. Personal use is permitted. For any other purposes, permission must be obtained from the IEEE by emailing [email protected].
This article has been accepted for publication in a future issue of this journal, but has not been fully edited. Content may change prior to final publication.
pronunciation, which suggests there is a user-
golden speaker is the learner with a native accent. Accent Conversion (AC) attempts to create
such a speaker by modifying non-native cues while maintaining those that carry the identity.
In previous work [11] we presented an AC method based on the source/filter model of speech.
The method combined the spectral envelope of a native speaker (assumed to be the primary carrier of
linguistic information) with the excitation and vocal tract length of a non-native speaker (assumed to be
the primary carrier of identity). The result was perceived as being 60% less accented than the non-native
speaker, but subjects perceived the voice to belong to a third speaker (i.e. neither the native nor the non-
native speaker). There are two likely explanations for the emergence of a new identity: 1) the spectral
envelope contained information identity and 2) subjects used accent as a
discriminator of identity. To address this issue, we propose a new AC method based on concatenative
speech synthesis. In this new approach, which we refer to as conFAC, accent conversion is achieved by
re-sequencing existing speech units (i.e. diphones) from the non-native speaker so as to best match the
prosodic and segmental characteristics of a native speaker. We hypothesize that the approach will create
utterances that have a native accent while preserving the identity of the non-native speaker1. In the
process, we evaluate two metrics of segmental similarity: one based on articulation (e.g., tongue, lips, and
jaw motion) and a second one based on acoustics (i.e., MFCCs). Our hypothesis is that the articulatory
domain provides a better separation of linguistic information and speaker-dependent characteristics,
which otherwise interact in complex ways in the acoustic domain. This hypothesis is consistent with
previous work by Broad and Hermansky [12],
main carrier of linguistic content whereas the back cavity carries speaker-dependent information2.
The manuscript is organized as follows. Section II reviews previous work in AC. Section
IIIdescribes our articulatory corpus, which captures mid-saggittal vocal tract movements for a native
1 The approach is also advantageous in pronunciation training because it provides realistically attainable targets for L2 learners (i.e., the resynthesized speech consists of units previously produced by the learner). 2Note, however, that some vowel systems use the feature +-ATR(advanced tongue root) in a contrastive fashion. +-ATR allegedly correlates with second formant bandwidths.

Copyright (c) 2011 IEEE. Personal use is permitted. For any other purposes, permission must be obtained from the IEEE by emailing [email protected].
This article has been accepted for publication in a future issue of this journal, but has not been fully edited. Content may change prior to final publication.
speaker and non-native speaker of American English. Section IV describes the proposed AC method as a
unit-selection problem that transforms non-native speech using a reference utterance by a native speaker.
Section V presents four experiments to evaluate the degree of accent in conFAC utterances using either
articulatory- or acoustic-based metrics during unit selection. The discussion suggests potential points of
improvement and directions for future research.
I I . L I T E R A T UR E R E VI E W
Accent conversion has grown out of several research areas, from signal processing methods for
voice conversion [8, 13] to perceptual studies on cues of speaker identity and non-native accent [14, 15].
Inspiration for our work comes from a study by Campbell [16], who used unit selection to synthesize
English words from a Japanese corpus. His approach consisted of selecting Japanese units to match low-
level targets (i.e. cepstral values) generated from an English text-to-speech synthesizer (TTS). Mean
opinion scores (MOS) showed that selecting Japanese units based on their similarity to English cepstral
features improved quality (MOS=2.9) compared to a baseline system that used text-based context-
dependent features (MOS=2.3). More interestingly, the study also showed that utterances created with the
proposed method sounded more native than those of the baseline system.
In a related study, Huckvale and Yanagisawa [17] sought to synthesize native Japanese utterances
from an English TTS system by means of an ccent morphing scheme. The authors created two
versions of the desired Japanese utterance: an English-accented Japanese utterance (E) created by
synthesizing Japanese words with an English TTS, and a native Japanese-accented utterance created
separately with a Japanese TTS (J). Then, the prosodic and segmental features of E were altered to follow
J more closely. Namely, the authors morphed the spectral envelope of E by interpolating line-spectral-
pairs with J, and also altered prosody (pitch and rhythm) using pitch-synchronous overlap add
(PSOLA). The individual and combined effects of each morph were evaluated through an intelligibility
test. Their results showed that the segmental and prosodic morphs can individually yield a slight
improvement in intelligibility; when combined, however, both morphs provide a much stronger

Copyright (c) 2011 IEEE. Personal use is permitted. For any other purposes, permission must be obtained from the IEEE by emailing [email protected].
This article has been accepted for publication in a future issue of this journal, but has not been fully edited. Content may change prior to final publication.
improvement than that predicted from the individual effects. Unlike Campbell [16], which was limited to
the sounds of the source speaker, accent morphing provides a way to create new sounds not available in
the source corpus. However, since the approach is based on spectral interpolation, it is more likely to be
successful if both speakers have similar voice qualities.
Yan et al. [18] developed an AC method based on modifying the parameters of a formant
synthesizer. In their approach, a model of vowel formant trajectories for British, Australian, and
American accents is built using a two-dimensional HMM. AC is then performed by resynthesizing an
utterance using the formant values predicted by the appropriate formant trajectory model. Prosodic
features (e.g. vowel duration and pitch) are modified with PSOLA. An ABX test confirmed that accent-
converted utterances were closer to the target accent than to the source accent in about 75% of the cases.
A different approach was explored by Yanguas et al. [19], who convolved the glottal flow derivative of
one speaker with the vocal tract transfer function from another speaker. The approach was tested on two
pairs of speakers: one pair had northern- and southern- accents of American English, while the second
pair had Cuban and Peruvian Spanish accents. In both cases, interchanging the glottal flow derivative
affected the perceived accent.
Our AC approach is most similar to [16] because it uses features from a native speaker to perform
unit selection on a non-native database. However, our work is unique among all previous AC methods
because it relies on articulatory features. In the process, we also perform acoustic-based AC within the
same synthesis framework to compare the advantages of each domain. The next section describes a
custom articulatory database collected explicitly for this work.
I I I . A R T I C U L A T O R Y-A C O UST I C D A T A B ASE
A . Articulatory data
A few articulatory databases are publicly available (e.g. MOCHA [20] and Wisconsin X-ray
microbeam [21]), but these corpuses are relatively small in size and, most importantly, do not contain
non-native speech. For this reason, we decided to collect a custom articulatory database from a non-native

Copyright (c) 2011 IEEE. Personal use is permitted. For any other purposes, permission must be obtained from the IEEE by emailing [email protected].
This article has been accepted for publication in a future issue of this journal, but has not been fully edited. Content may change prior to final publication.
speaker and a native speaker of English. The dataset was collected at CSTR (University of Edinburgh) by
means of Electromagnetic Articulography (EMA; Carstens AG500, c.f. [22, 23] for a more detailed
description of the method). The non-native subject (FS) was raised in Madrid (Spain); he began studying
English at age 6 but primarily spoke Spanish until he moved to the United States at the age of 25. At the
time of the recording he was 41 years old and had been living in the United States for 16 years. The native
speaker (NS) was a monolingual speaker who grew up in New York; he was 39 years old at the time of
the recording. Both subjects recorded the same 344 sentences chosen from the Glasgow Herald corpus. In
addition, FS recorded 305 sentences not spoken by NS. Audio recordings were captured at a sampling rate
of 32 kHz with an AKG CK98 shotgun microphone.
Articulatory movements were simultaneously tracked by attaching sensors to various locations in
Four pellets placed behind the ears, the upper nasion and the upper jaw were
used to cancel head motion and provide a frame of reference, while the other six were attached to capture
articulatory movements (upper lip, lower lip, jaw, tongue tip, tongue mid, and tongue back). The front-
most tongue sensor (TT) was positioned 1cm behind the actual tongue tip, the rearmost sensor (TD) as far
back as possible without creating discomfort for the participant, and the third sensor was placed
equidistant from TT and TD [22]. Position estimation was done with the help of the TAPAD toolbox [23]
as well as Kalman filtering software developed at CSTR. The data were low-pass filtered before and after
position estimation with FIR filters3.
Raw EMA pellet positions are not suitable synthesis features since they are rather speaker-
dependent, and our approach requires that articulatory features from one speaker be used to select speech
units from another speaker. Following [24], we convert EMA pellet positions into relative measurements
of the vocal tract (Fig. 1 (a)); these measurements correspond to 6 of 7 parameters of
model [25] (the 7th parameter, larynx height, cannot be calculated from EMA data). The EMA-derived
mean and variance normalized (zero mean, unit variance) to further reduce 3 Each low-pass filter was applied to the raw amplitude signal and then again to the position estimations. The low-pass filter specifications are as follows. The reference sensors (right and left ear, bridge of nose and maxilla) had a passband of 5 Hz and a stopband of 15 Hz, and a damping of 60 dB. The tongue tip had a passband of 40 Hz, a stopband of 50 Hz, and a damping of 60 dB. All other sensors had a passband of 20 Hz, a stopband of 30 Hz, and a damping of 60 dB.

Copyright (c) 2011 IEEE. Personal use is permitted. For any other purposes, permission must be obtained from the IEEE by emailing [email protected].
This article has been accepted for publication in a future issue of this journal, but has not been fully edited. Content may change prior to final publication.
differences caused by speaker anatomy. A sample of the parameters deployment is
illustrated in Fig. 1 (b). The parameters are described as follows: (1) Jaw opening distance: Euclidean
distance from the lower incisor to the upper incisor (origin); (2) Tongue back position: horizontal
displacement between the tongue back and the upper incisor; (3) Tongue shape: angle created between
the three points on the tongue; (4) Tongue tip height: vertical displacement between the tongue tip and
the upper incisor; (5) L ip opening distance: Euclidean distance between the upper and lower lips; and (6)
L ip protrusion: Euclidean distance between a) the midpoint between the upper and lower incisors and b)
the midpoint between the upper and lower lips.
(a)
(b)
F ig. 1. (a) Calculating Maeda parameters from E M A recordings. Pellets (blue ci rcles) are placed in
the upper lip, lower lip, jaw, tongue tip, tongue mid, and tongue back . An additional pellet (red
crosshair) is located on the upper incisor and serves as the reference f rame. (b) Example Maeda
parameters for the word
notation. Maeda labels (M1-6) correspond to the numbers in (a). The data has been artificially
scaled and offset for visualization purposes.
B . Acoustic data
For comparison purposes, we extracted acoustic features in the form of thirteen Mel Frequency
4
6
1
2
35

Copyright (c) 2011 IEEE. Personal use is permitted. For any other purposes, permission must be obtained from the IEEE by emailing [email protected].
This article has been accepted for publication in a future issue of this journal, but has not been fully edited. Content may change prior to final publication.
Cepstral Coefficients (MFCC), computed from the STRAIGHT spectrum [26] by warping the spectrum
according to the Mel-frequency scale and applying a discrete cosine transform. The suprasegmental
features pitch and loudness (0th cepstral coefficient) were also calculated. Features were mean and
variance normalized to reduce differences between long-term voice properties of FS and NS (e.g. spectral
slope) and make them more robust to noise [27].
C . Phonetic transcription and analysis
Arpabet phonetic transcriptions of the utterances were obtained in a two stage process. First, an
peaker-independent acoustic
models trained on the Wall Street Journal and TIMIT corpuses. Details of the acoustic model can be
found in [28]; the specific configuration chosen was a monophone model with 4000 tied states and 32
Gaussians per state. The transcriptions were subsequently adjusted4 by a native speaker using the audio
editing tool WaveSurfer to amend phoneme labels and boundaries. Based on these annotations, we had
2,581 accented items (when aggregated across the whole corpus). Among these, substitutions were the
most common class. We observed 1,573 (61%) substitutions. In contrast, deletions accounted for only
26% of all accented items. Insertions were even less frequent (13%, n=337). Certain types of phones (and
phone sequences) are more common than others, and certain phones are also more prone to be deleted,
inserted or substituted. Therefore, individual substitutions, deletions, and insertions were transformed into
Wilson scores in order to make their magnitudes comparable. A Wilson score represents the lower bound
of the confidence interval (95%) of the probability of mispronunciation, e.g., a Wilson Score of 0.10
means that there is a 95% chance that the probability of mispronunciation is greater than 10%.
The first major observation was that substitutions were the strongest source of mispronunciations
(max. WS 0.2503), followed by deletions (max.WS 0.179) and insertions (max. WS 0.073). In the
following we will generally only deal with substitutions, deletions, and insertions if their WS exceeds
0.10. Scores lower than this threshold will only be mentioned if they form a class with other processes
4 The accuracy of the HTK transcriptions was noticeably worse for the foreign speaker than the native speaker.

Copyright (c) 2011 IEEE. Personal use is permitted. For any other purposes, permission must be obtained from the IEEE by emailing [email protected].
This article has been accepted for publication in a future issue of this journal, but has not been fully edited. Content may change prior to final publication.
exceeding the threshold. Following this rationale, there were no noteworthy insertions. Only the deletion
of voiced and voiceless alveolar stop as well as the labiodental fricatives [v] exceeded a Wilson score of
0.1 (0.18, 0.12 and 0.14 respectively). Among substitutions, the most common were associated with the
fact that the Spanish sound system [29] phonemically does not have voiced fricatives. As a consequence
s involving associated
frequently replaced its
voiced counterpart [v] (WS 0.079). A second major class of substitutions targets the vowel system: The
Spanish vowel inventory
their tense counterparts ([i] and [u]). However, lax vowel substitution is more common for the back [WS
0.14] than for front vowels for which the probability is lower than 10% [WS 0.087]. A third common
class of substitutions targets the nasals: Spanish has bilabial, alveolar and palatal nasal phonemes (/m/,/n/
to the place of articulation of the following consonant. This is likely to
be the
interesting finding is the relative rare occurrence of substitutions of voiceless plosives by their voiced
counterpart that could have been expected by the fact that the distinction between voiced and voiceless
plosives is a true voicing distinction in Spanish, but cued by the presence of aspiration in English.
However, the substitution of [t] by its voiced cognate [d] as the most frequent in this class of substitutions
is only moderately frequent (WS 0.05). Taken together, the frequencies render well the difficulties
expected from the phonological differences between Spanish and English. A summary of these values is
found in Table 1.

Copyright (c) 2011 IEEE. Personal use is permitted. For any other purposes, permission must be obtained from the IEEE by emailing [email protected].
This article has been accepted for publication in a future issue of this journal, but has not been fully edited. Content may change prior to final publication.
Table 1 Summary of the most relevant mispronunciations by the foreign speaker ; the absence of FS
realization denotes deletions. The last column indicates the coverage of the target phones in the FS
database; higher values indicate a better selection of candidates used by the proposed method of
accent conversion (descr ibed in the next section).
Target phone FS realization WS Ave. # of replacement diphones (left, right) in DB
[z] [s] 0.25 (29,5)
0.23 (1,2)
[d] - 0.18 (32,35)
[n] 0.15 (52,5)
[v] - 0.14 (61,39)
[i] 0.14 (51,5)
[t] - 0.12 (46,31)
0.097 (2,2)
[u] 0.087 (9,6)
[v] [f] 0.079 (18,10)
[t] [d] 0.05 (43,53)
I V . M E T H O DS
Our AC approach is built on top of a general framework for unit-selection synthesis. Given native
and non-native versions of an utterance and their phonetic transcriptions, our method operates in three
steps: (1) detect mispronunciations as differences between the non-native and native phonetic
transcriptions, (2) extract articulatory features from a native utterance, and (3) search a database of non-
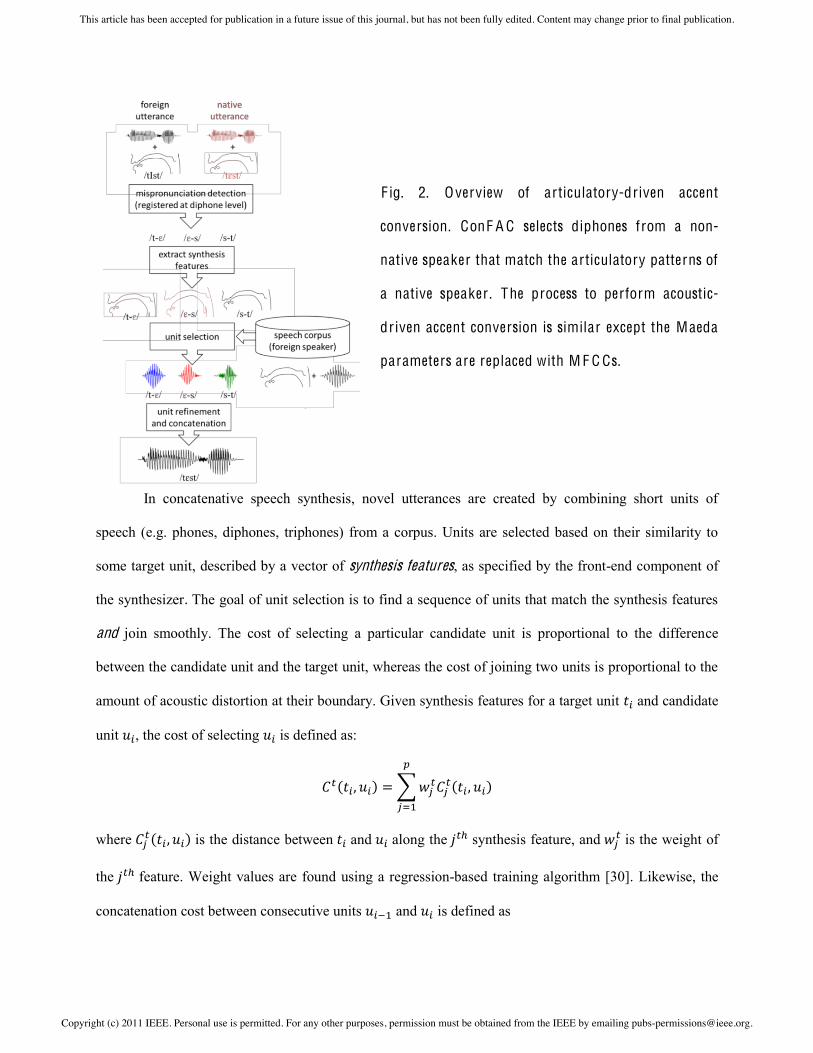
native speech to find units similar to those of the native utterance. These steps are illustrated in Fig. 2.
Copyright (c) 2011 IEEE. Personal use is permitted. For any other purposes, permission must be obtained from the IEEE by emailing [email protected].
This article has been accepted for publication in a future issue of this journal, but has not been fully edited. Content may change prior to final publication.
F ig. 2. Overview of articulatory-driven accent
conversion. ConF A C selects diphones from a non-
native speaker that match the articulatory patterns of
a native speaker . The process to perform acoustic-
driven accent conversion is similar except the Maeda
parameters are replaced with M F C Cs.
In concatenative speech synthesis, novel utterances are created by combining short units of
speech (e.g. phones, diphones, triphones) from a corpus. Units are selected based on their similarity to
some target unit, described by a vector of synthesis features, as specified by the front-end component of
the synthesizer. The goal of unit selection is to find a sequence of units that match the synthesis features
and join smoothly. The cost of selecting a particular candidate unit is proportional to the difference
between the candidate unit and the target unit, whereas the cost of joining two units is proportional to the
amount of acoustic distortion at their boundary. Given synthesis features for a target unit and candidate
unit , the cost of selecting is defined as:
where is the distance between and along the synthesis feature, and is the weight of
the feature. Weight values are found using a regression-based training algorithm [30]. Likewise, the
concatenation cost between consecutive units and is defined as

Copyright (c) 2011 IEEE. Personal use is permitted. For any other purposes, permission must be obtained from the IEEE by emailing [email protected].
This article has been accepted for publication in a future issue of this journal, but has not been fully edited. Content may change prior to final publication.
which estimates the amount of distortion introduced by the join, i.e., discontinuities in the MFCCs, pitch,
and loudness at the boundary between two units. The total cost for a particular sequence of units is the
sum of the target and concatenation costs for the entire sequence.
(1)
A user-defined parameter provides a tradeoff between smooth joins and accurate target
matches. The Viterbi algorithm can then be used to find the sequence of units from the database that yield
the minimum total cost in equation (1).
A . Accent conversion as concatenative synthesis
We employ this unit-selection strategy to replace the most accented units in a non-native
utterance with units that are closer to those produced by the native speaker. This is accomplished in three
steps: mispronunciation detection, feature extraction, and synthesis. The first step detects pronunciation
differences between the FS and NS5 by comparing their phonetic transcriptions for a given sentence. This
comparison is facilitated by creating a third transcription composed of the NS phone sequence aligned (as
closely as possible) to the FS utterance (see Fig. 3
for an example). Broad differences in pronunciation (i.e. phonetic insertions, substitutions, and deletions)
can be determined by comparing the mispronunciation transcript and true FS transcript since they share
the same time-base. Phone-level mispronunciations are subsequently registered at the diphone level. Thus
a single phone-level mispronunciation affects two diphones: one spanning from the center of the
mispronounced phone to the center of the previous phone and one from the mispronounced phone to the
following phone. This approach is advantageous because diphone synthesis yields a smoother result than
5 Due to the fact that there may be several acceptable native pronunciations for a given word, our approach may sometimes mark an acceptable FS pronunciation as mispronounced (i.e. false positive) if it does not coincide with the particular pronunciation used by NS. In this case, the effect would be that the synthesized speech sounds more like the NS production, which is an acceptable result.

Copyright (c) 2011 IEEE. Personal use is permitted. For any other purposes, permission must be obtained from the IEEE by emailing [email protected].
This article has been accepted for publication in a future issue of this journal, but has not been fully edited. Content may change prior to final publication.
phone synthesis; i.e., diphones are joined at acoustically stable locations (i.e. center of a phone) whereas
phones are joined at their transitions. Our implementation also includes a parameter to allow the user to
define how far a mispronunciation spreads to neighboring diphones; the default value is two diphones to
either side of the mispronounced phone.
F ig. 3. Phonetic differences between native and non-native speech are detected from the
mispronunciation transcription. This transcr iption is created by
phonetic transcr ipt to the timing of the non-native speaker . In this example, the non-native speaker
pronounced the anything with two phonetic substitutions and one insertion.
For each non-native diphone that is marked as mispronounced, we extract features from the
corresponding native diphone to serve as target synthesis features in equation (1). Ideally, these features
reflect the linguistic content of the diphone rather than cues identity. Our hypothesis is
that articulatory features are better suited for this purpose than acoustic features. We test this hypothesis
by gathering two sets of synthesis features: one t
parameters and another that uses MFCCs6. Each diphone is represented by the following synthesis
features: phonetic label (e.g. /a-t/), duration (e.g. 100 ms), and Maeda/MFCC trajectory; the latter is
obtained by sampling each Maeda/MFCC feature at three relative locations to facilitate comparison of
diphones with different lengths (i.e. beginning, middle, and end of the diphone). Our approach also
replaces correctly-pronounced phones if their suprasegmental features are not consistent with those of the
native utterance. In this case, the primary features (i.e. Maeda or MFCC) are sampled from the non-native
6 The features pitch, loudness, and phoneme duration were included in both conditions. Although they are technically acoustic measurements, they also represent articulatory features: glottal activity (frequency and power) and rate of speech.
n inative transcription
n i t inon-‐native transcription
n imispronunciation
insertionsubstitution

Copyright (c) 2011 IEEE. Personal use is permitted. For any other purposes, permission must be obtained from the IEEE by emailing [email protected].
This article has been accepted for publication in a future issue of this journal, but has not been fully edited. Content may change prior to final publication.
speaker, and features associated with suprasegmental properties (e.g. pitch, loudness) are taken from the
native speaker. Finally, we create an acoustic waveform from the synthesis features following three steps:
1) diphones are selected from the non-native corpus based on their similarity to synthesis features from
the native speaker, 2) selected diphones are refined to minimize spectral discontinuities at their
boundaries, and 3) the STRAIGHT parameters for each diphone are concatenated and an acoustic
waveform is generated with the STRAIGHT vocoder.
B . Unit selection with a small speech corpus
Previous work on unit-selection synthesis shows that a minimum of 36,000 phones is required to
generate intelligible speech, though some systems use as many as 175,000 [31]. By comparison, our non-
native corpus (the longest continuously collected articulatory dataset to our knowledge) contains 20,000
phones spanning 60 minutes of active speech7. We use two techniques to compensate for the reduced size
of our articulatory speech corpus. First, we allow the original non-native diphones to be considered as
candidates for synthesis. This occurs when the unit-selection parameter is set to ; since neighboring
units (by definition) have zero concatenation cost, the Viterbi algorithm will select the original diphone
sequence at a total cost of zero. As increases, target costs are weighted more heavily, which results in
units being selected from the database to replace the original units. Selecting different units increases the
chance of reducing the non-native accent, but also increases the chance of introducing distortions. By
adjusting accordingly, we can effectively control the number of diphones replaced in a given utterance.
The second technique provides better control over this factor by allowing us to define the
percentage of new units to replace in a given utterance. This is achieved by replacing the static variable
in (1) with a function that dynamically controls the percentage of new units to be selected:
7 These figures may suggest that we lack sufficient data to perform unit selection synthesis. However, it is important to note that our system has a restricted vocabulary (1385 unique words in the NS corpus) and that the system has access to a reference utterance by NS in addition to the text transcript.

Copyright (c) 2011 IEEE. Personal use is permitted. For any other purposes, permission must be obtained from the IEEE by emailing [email protected].
This article has been accepted for publication in a future issue of this journal, but has not been fully edited. Content may change prior to final publication.
where is a user-defined variable that determines the percentage of new units to be replaced in an
utterance, and the function calculates the percentage of new units selected for a given . This
formulation allows us to balance the desired amount of accent change and overall level of naturalness. We
tested values for the parameter from 0.1 to 1.0 in increments of 0.1. A value of 0.5 was empirically
determined to be the highest tested value that did not significantly alter the overall level of naturalness of
synthesized utterances. This corresponds to replacing 50% of the diphones in the non-native utterance.
C . Unit refinements
Due to the sparsity of our corpus, direct concatenation of diphones can lead to harsh distortions
resulting from discontinuities in the acoustic spectrum. We improve the quality of a join between
consecutive diphones with two acoustic refinement methods: optimal coupling and spectral smoothing.
Optimal coupling [32] improves the join between two diphones by adjusting their boundaries to minimize
spectral differences (see Fig. 4 (a)). The cost of joining at a particular boundary is calculated as follows:
let be a row vector containing the values of the MFCC prior to the cut-point,
and let be a row vector for the values following the cut-point for the right diphone ( =10 in our
implementation). As illustrated in Fig. 4 (b), to determine the cost of joining at a particular boundary, we
model the combined vector by a line of best fit defined by coefficients and compute the
sum-squared residuals:
The optimal cut point is specified by the pair with the minimum cost. To avoid deviating
from the desired target duration , our solution also incorporates a duration penalty:
where is the final duration of the shared phone that results from joining two diphones (see Fig. 4
Copyright (c) 2011 IEEE. Personal use is permitted. For any other purposes, permission must be obtained from the IEEE by emailing [email protected].
This article has been accepted for publication in a future issue of this journal, but has not been fully edited. Content may change prior to final publication.
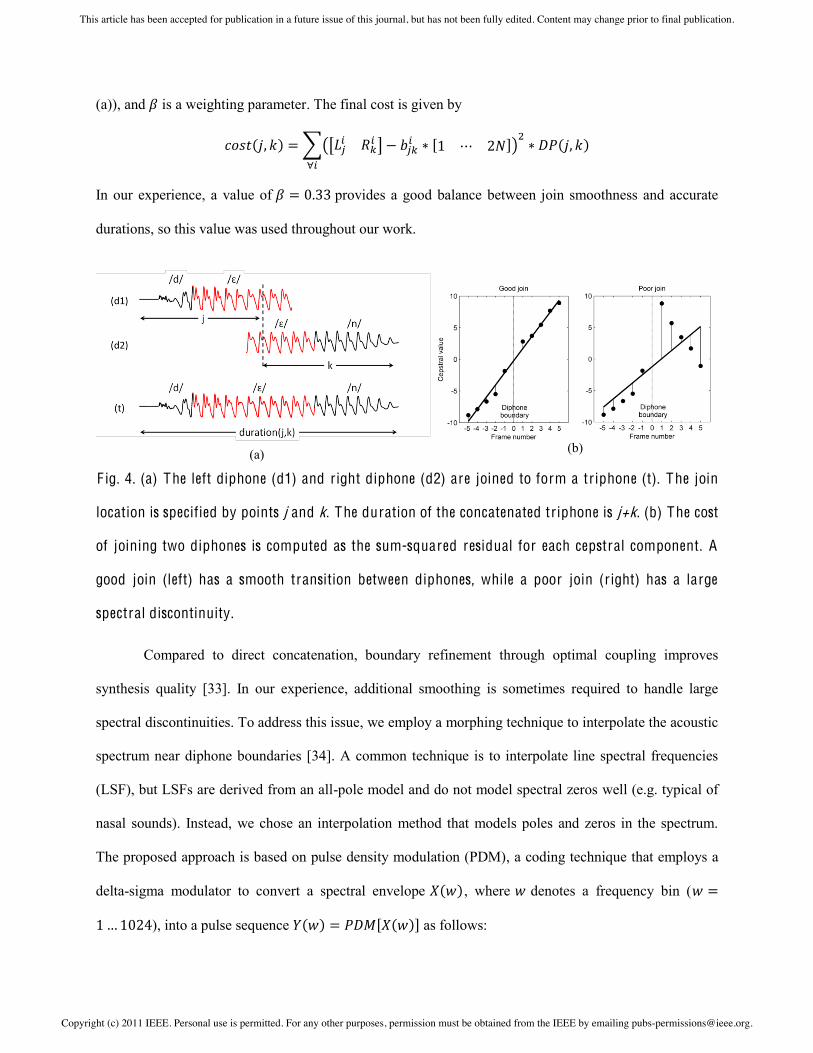
(a)), and is a weighting parameter. The final cost is given by
In our experience, a value of provides a good balance between join smoothness and accurate
durations, so this value was used throughout our work.
(a)
(b)
F ig. 4. (a) The left diphone (d1) and right diphone (d2) are joined to form a triphone (t). The join
location is specified by points j and k. The duration of the concatenated triphone is j+k. (b) The cost
of joining two diphones is computed as the sum-squared residual for each cepstral component. A
good join (left) has a smooth transition between diphones, while a poor join (r ight) has a large
spectral discontinuity.
Compared to direct concatenation, boundary refinement through optimal coupling improves
synthesis quality [33]. In our experience, additional smoothing is sometimes required to handle large
spectral discontinuities. To address this issue, we employ a morphing technique to interpolate the acoustic
spectrum near diphone boundaries [34]. A common technique is to interpolate line spectral frequencies
(LSF), but LSFs are derived from an all-pole model and do not model spectral zeros well (e.g. typical of
nasal sounds). Instead, we chose an interpolation method that models poles and zeros in the spectrum.
The proposed approach is based on pulse density modulation (PDM), a coding technique that employs a
delta-sigma modulator to convert a spectral envelope , where denotes a frequency bin (
), into a pulse sequence as follows:

Copyright (c) 2011 IEEE. Personal use is permitted. For any other purposes, permission must be obtained from the IEEE by emailing [email protected].
This article has been accepted for publication in a future issue of this journal, but has not been fully edited. Content may change prior to final publication.
with initial conditions and ; the term represents the feedback gain of
the delta-sigma modulator: . In turn, the pulse sequence can be decoded back into a
log spectral envelope through the discrete cosine transform (DCT) as:
which essentially acts as a low-pass filter by truncating the DCT expansion with an appropriate cutoff k
( in our implementation). Thus, given a pair of spectral envelopes and , a morphed
spectral envelope can be computed by averaging the position of corresponding pulses in the two spectra:
where the morphing coefficient can be used to generate a continuum of morphs between
the two spectral envelopes and (Fig. 5).
F ig. 5. Spectral morphing with the PD M method [34]. Spectra were offset vertically for
visualization purposes.
D . STRAIG H T synthesis
Once individual diphones have been selected and refined, we generate an acoustic waveform
using the STRAIGHT analysis/synthesis framework [26]. We selected the STRAIGHT analysis/synthesis

Copyright (c) 2011 IEEE. Personal use is permitted. For any other purposes, permission must be obtained from the IEEE by emailing [email protected].
This article has been accepted for publication in a future issue of this journal, but has not been fully edited. Content may change prior to final publication.
framework because it yields high-quality results while providing straightforward manipulation of
fundamental frequency and spectral characteristics (necessary for Experiment #2 in Section V).
STRAIGHT models speech using three parameters: spectrogram, aperiodicity, and fundamental
frequency. As described in the previous section, the STRAIGHT spectrogram for each diphone is altered
to create a smooth join. In turn, the STRAIGHT aperiodicity signal for each diphone is retrieved directly
from the database without modification. Prosodic modifications are also performed at this stage to match
the pitch contour of the native speaker. First, the contour is taken from the native speaker and shifted
to match the average of the non-native speaker (i.e. NS fundamental frequency is on average 40 Hz
lower than FS). Second, we correct for differences between phone durations of the two speakers by
calculating a piecewise linear function8 that maps phone durations of the native speaker to those of the
new utterance. This allows us to
of the non-native speaker. In a final step, the modified spectrogram, aperiodicity, and fundamental
esis engine.
V . E XPE RI M E N TS
We evaluated the AC system through four perceptual studies. The first three experiments were
aimed at evaluating our ability to modify the accent of a non-native speaker, whereas the fourth
experiment investigated whether articulatory features (Maeda) provide a more speaker-independent
encoding than acoustic parameters (MFCCs). Participants in these perceptual studies were recruited
through Mechanical Turk, In order to qualify for the studies,
participants were required to pass a screening test that consisted of identifying various American English
accents: Northeast (i.e. Boston, New York), Southern (i.e. Georgia, Texas, Louisiana), and General
American (i.e. Indiana, Iowa). Participants who did not pass this qualification task were not allowed to
participate in the studies. In addition, participants were asked to list their native language/dialect and any
other fluent languages that they spoke. If a subject was not a monolingual speaker of American English
8 The knots of the piecewise function are calculated from the phonetic transcripts. For example, if the phoneme /a/ is spoken by the native speaker from 400 ms to 500 ms and the corresponding non-native /a/ spans 350 to 425 ms, then one piece of the mapping function is defined by the line between (400,350) and (500,425).
Copyright (c) 2011 IEEE. Personal use is permitted. For any other purposes, permission must be obtained from the IEEE by emailing [email protected].
This article has been accepted for publication in a future issue of this journal, but has not been fully edited. Content may change prior to final publication.
then their responses were excluded from the results. Participants were paid $1 for completing the test.
A . Experiment #1: Accent rating
Following [35], participants were asked to rate the degree of foreign accent of utterances using a
7-point Empirically Grounded, Well-Anchored (EGWA) scale (0=not at all accented; 2=slightly accented;
4=quite a bit accented; 6=extremely accented). Four types of stimuli were compared: original utterances
from FS and NS, AC in MFCC space6 (ACMFCC), and AC in Maeda space6 (ACMaeda). Twenty participants
rated 40 utterances (4 conditions × 10 sentences shown in Table 2). Several criteria were considered
during test sentence selection
many differences are there between the phonetic transcript of FS and NS? 3) Are the differences typical to
those of Spanish L2 speakers of English? and 4) How many potential replacement diphones exist in the
corpus? The selected sentences were then reconstructed from diphones taken from the remaining 639 FS
utterances (described previously in Section III).
Results from the first experiment indicate a large difference in perceived accent between FS and
NS, but ACMFCC and ACMaeda were rated similar to FS (Fig. 6). A repeated measures ANOVA test was
performed with the null hypothesis that the average accent rating for FS, ACMFCC, and ACMaeda are the
same. The results do not give sufficient evidence to reject the null hypothesis, i.e. there is no significant
difference in perceived accent F(2,38)=0.52, p=0.60. We suspected that the high similarity among FS,
ACMFCC, and ACMaeda may have influenced listener ratings; i.e., the three conditions are based on units
from the same speaker. Namely, we hypothesized that subjects assigned similar accent ratings to the three
conditions (FS, ACMFCC, and ACMaeda) either because of a need to provide consistent responses for the
condition (NS). Testing this hypothesis was the subject of the next two experiments.

Copyright (c) 2011 IEEE. Personal use is permitted. For any other purposes, permission must be obtained from the IEEE by emailing [email protected].
This article has been accepted for publication in a future issue of this journal, but has not been fully edited. Content may change prior to final publication.
Table 2 B road IPA transcr iptions of the ten sentences used in Exper iments 1-3. The fi rst
transcr iption below each sentence is from NS and the second transcr iption is f rom FS.
The obvious answer is cash
Everybody meddles with nature
He said education education education
This is the big fear
They are so easy for youngsters to open
We must take a measured look at this
There was huge irony here
We are regarded as being dour people
It is due for release in the U K early next year
This was a meeting which changed his life
F ig. 6. Accent ratings for conF A C .
comparison test.
B . Exp. #2: Decoupling accent and identity (Part 1)
In this experiment we sought to determine whether accent ratings in Experiment #1 had been affected by
the perceived identity of the speaker. For this purpose, we disguised the original FS and NS recordings by
altering their fundamental frequency and long-term spectral properties. Three baseline guises were
created: (1) Gdeep: modeled after NS, this guise resembles a deep male voice ( ); (2) Gave:
modeled after FS, this guise resembles an average male voice ( ), and (3) G child: modeled as the
reciprocal of Gdeep with respect to Gave, this guise resembles a child-like male voice ( )

Copyright (c) 2011 IEEE. Personal use is permitted. For any other purposes, permission must be obtained from the IEEE by emailing [email protected].
This article has been accepted for publication in a future issue of this journal, but has not been fully edited. Content may change prior to final publication.
To create a guise, we shift and scale the fundamental frequency of the source voice to match the
range of the target guise, and perform vocal tract length normalization through frequency warping [36].
To calculate a frequency warping function , we apply dynamic frequency warping on 20 time-
aligned STRAIGHT spectrograms from the two speakers. Therefore, to make NS (who has a deep voice)
sound more like FS (who has an average voice) we warp NS function
. Conversely, applying the inverse function to FS makes his voice sound deeper. The
process is illustrated in Fig. 7 (a).
Six types of stimuli were created for this test by combining two source voices (FS and NS) with
three guises (Table 3). Twenty participants rated 10 utterances from each condition on a 7 point EGWA
scale. Results from the listening experiments are summarized in Fig. 7 (b). A two-factor repeated
significant difference in source voice (i.e. FS or NS) F(1,97)=1812.08, p<0.001, but no significant
difference for guise F(2,97)=0.79, p=0.46. In other words, these results indicate that exposure to the
original voices (NS has a deeper voice than FS) does not bias participants towards assigning lower accent
(i.e. more native) ratings to deeper voices. This is a positive result because it allows us to disguise the AC
conditions in Experiment #1 without affecting their true accent ratings.
(a) (b)
F ig. 7. (a) Defining the frequency warping function for each of the three guises. Guises Gave and
Gdeep are modeled after FS and NS, respectively. The baseline warping function is the result of
performing dynamic frequency warping from NS to FS. (b) Accent ratings for the change of
Gchild Gave Gdeep

Copyright (c) 2011 IEEE. Personal use is permitted. For any other purposes, permission must be obtained from the IEEE by emailing [email protected].
This article has been accepted for publication in a future issue of this journal, but has not been fully edited. Content may change prior to final publication.
identity experiment. 05) in a multiple comparison
test. Aster isks indicate original voices.
Table 3 Six conditions used in Exper iment #2.
Source voice Guise Transformation Notes FS deep F-1(w) - FS avg. - original FS FS child F(w) - NS deep - original NS NS avg. F(w) - NS child F(F(w)) -
C . Exp. #3: Decoupling accent and identity (Part 2)
In this third experiment, we sought to determine whether listeners in Experiment #1 rated
ACMFCC, ACMaeda and FS similarly because they perceived them as the same speaker. To answer this
question, we disguised ACMFCC and ACMaeda (from Experiment #1) with the guises developed in
Experiment #2. Two separate tests were performed to balance the choice of disguise across experimental
conditions. In the first test (denoted by Set A in Table 4), ACMFCC and ACMaeda underwent Gchild and Gdeep
transforms, respectively. Listeners rated these utterances in addition to unmodified FS and NS utterances.
These guises were reversed for set B.
Twenty participants rated the utterances in Set A and a different group of twenty participants
rated utterances in Set B. Results from the study are summarized in Fig. 8. We combined tests A and B in
a repeated measures ANOVA analysis to test the null hypothesis that the mean accent rating of FS,
ACMFCC, and ACMaeda are the same. The evidence suggests that we can reject the null hypothesis; there is a
significant difference between the means F(2,78)=16.08, p<0.001. The results of a multiple comparison
test also show that all pairs are significantly different except for ACMFCC and ACMaeda. In this case, the
perceived accent of ACMFCC and ACMaeda are 16% and 20% lower than that of FS. Both acoustic and
articulatory-based conFAC reduce the accent of FS, though the result is still perceived as more accented
than native. This result also suggests that listeners in Experiment #1 were biased by the similarity of
ACMFCC and ACMaeda to FS, and that the guises allowed listeners to assign independent ratings to the two

Copyright (c) 2011 IEEE. Personal use is permitted. For any other purposes, permission must be obtained from the IEEE by emailing [email protected].
This article has been accepted for publication in a future issue of this journal, but has not been fully edited. Content may change prior to final publication.
forms of synthesis.
Table 4. Separation of Exper iment #3 stimuli into two test sets (A and B).
Set A Set B Condition Guise conFAC synthesis features6
Foreign (FS) - ACMFCC Gchild MFCC ACMaeda Gdeep Maeda
ACMFCC Gdeep MFCC ACMaeda Gchild Maeda Native (NS) -
F ig. 8. Accent ratings for the exper imental conditions after undergoing a change of identity. E rror
D . Exp. #4: Comparing strengths of synthesis features
The objective of the fourth experiment was to assess the relative amount of linguistic information
and speaker-dependent information in the two domains: acoustic and articulatory. To measure linguistic
content in the two domains, we performed leave-one-out synthesis by extracting synthesis features from
an FS utterance and selecting replacement units among the remaining FS utterances. We will refer to this
as the same-speaker (SS) condition since the synthesis features and synthesis database are both taken
from FS. Twenty participants were then asked to indicate the synthesized utterance (SSMFCC vs. SSMaeda)
that . To measure the degree of speaker-dependence of the two
domains, we also generated stimuli by extracting synthesis features from a NS utterance and selecting
replacement units among the remaining 9 FS utterances. Since the synthesis features and synthesis
9 The FS utterance that was removed in the SS condition was also removed in the DS condition.

Copyright (c) 2011 IEEE. Personal use is permitted. For any other purposes, permission must be obtained from the IEEE by emailing [email protected].
This article has been accepted for publication in a future issue of this journal, but has not been fully edited. Content may change prior to final publication.
database originated from different speakers, we will refer to these stimuli as different speaker (DS). The
same twenty participants were then asked to choose among pairs of utterances (DSMFCC vs. DSMaeda). Each
participant responded to 25 paired comparisons in the SS condition and 25 paired comparisons in the DS
condition; presentation order of the 50 pairs was randomized within the study, and participants were not
presented with SS and DS stimuli within the same paired comparison.
To compare the relative amount of linguistic information in the two domains, we analyzed results
for the SS stimuli using a two-tailed binomial significance test with the null hypothesis that there was an
equal preference (P=0.5) for the choice of target features (i.e. MFCC and Maeda). The 500 responses (20
participants 25 SS questions) showed a preference for MFCC synthesis features (321) over Maeda
(179), which corresponds to a preferred Maeda proportion of 0.358 (p(two-tailed) < 0.001). The
preference for SSMFCC may be explained by the fact that Maeda parameters provide an incomplete
representation of the vocal tract, as well as by experimental issues with EMA sensor drift over time and
nonlinearities in the articulatory space, where slightly different articulatory configurations can produce
large changes in acoustics [37]. In short, MFCCs are more reliable indicators of the linguistic content of a
diphone than Maeda parameters.
Table 5. Exper imental conditions in Exper iment #4.
Condition Synthesis database (speaker)
Synthesis features (speaker) Target features6
SSMFCC FS FS MFCC SSMaeda FS FS Maeda DSMFCC FS NS MFCC DSMaeda FS NS Maeda
To analyze results for the DS condition, we combined responses in a 2 2 contingency
table (see Table 6); this allowed us to isolate the effects of linguistic content and speaker-dependence of
the two domains. To fill the contingency table, we considered
sentence in the SS and DS conditions. For example, if a listener preferred SSMFCC (over SSMaeda) for
DSMaeda (over DSMFCC) for the same sentence, then that response was recorded by

Copyright (c) 2011 IEEE. Personal use is permitted. For any other purposes, permission must be obtained from the IEEE by emailing [email protected].
This article has been accepted for publication in a future issue of this journal, but has not been fully edited. Content may change prior to final publication.
increasing the count on the upper-right bin. We analyzed responses ,
with the null hypothesis that row and column marginal frequencies are equal for each outcome. In this
case, due to the high preference for MFCCs in the same-speaker condition, we should expect a similar
preference in the different-speaker condition. Our results show strong evidence to reject the null
hypothesis; the Maeda preference proportion increased from 0.358 in the same-speaker condition to 0.52
in the different- 2= 26.7782, p(two-tailed)<0.001). This result supports our hypothesis
that speech is less speaker-dependent in the articulatory domain than in the acoustic domain, the
conclusion being drawn from the relative improvement (i.e. 0.358 to 0.52) rather than the final Maeda
preference (0.52). Additional studies, however, are required to confirm that this result generalizes to other
pairs of speakers.
Table 6. Contingency table showing the paired responses in the fourth exper iment.
different-speaker row total MFCC Maeda
same-speaker MFCC 161 160 321 Maeda 79 100 179
column total 240 260 500
V I . DISC USSI O N
In previous work [11] we proposed an AC method that consisted of combining the spectral
features of a native speaker with the excitation signal from non-native speaker; the synthesized speech
was perceived as being 60% more native-sounding, but failed to maintain the identity of the non-native
speaker. Furthermore, it was unsuitable for altering mispronunciations involving missing or extraneous
phonemes. To address this issue we have applied concatenative synthesis to the problem of accent
conversion. By reconstructing speech from the non- , we are able to
address mispronunciations involving missing and extraneous phones while preserving the voice quality of
the non-native speaker. Our results reveal a modest improvement (20% more native); the lesser
improvement can be partially explained by the fact that conFAC is limited by the inventory of speech
Copyright (c) 2011 IEEE. Personal use is permitted. For any other purposes, permission must be obtained from the IEEE by emailing [email protected].
This article has been accepted for publication in a future issue of this journal, but has not been fully edited. Content may change prior to final publication.
segments in the non- 10. Therefore, conFAC ability to alter accent depends upon
the non- particular mispronunciations as well the diversity of the corpus11. We are
considering two options to expand the FS diphone inventory. One option is to increase the corpus by
means of articulatory inversion. Namely, an inversion model could be built from the existing articulatory-
acoustic corpus, and then used to predict articulators for a much larger acoustic-only corpus of the non-
native speaker; this work is currently underway in our group. The second option is to augment the non-
length normalization to match the non-native speaker) or from a formant synthesizer; previous work [39]
has shown that synthetic units can be introduced in natural speech with little degradation in speech
quality. We are also exploring non-concatenative AC techniques for accent conversion including
statistical voice conversion [40].
A natural extension of conFAC would be to combine the advantages of the acoustic domain,
which provides better linguistic information, with those of the articulatory domain, which provides a
higher degree of speaker independence. In a preliminary experiment (not reported here), we also
performed accent conversion using a hybrid feature set containing articulatory and acoustic information.
An inspection of the resulting unit-selection weights revealed that nearly all high weight values were
assigned to MFCC features. Furthermore, utterances synthesized with the hybrid weights were not
perceptually different from those obtained for ACMFCC. We believe this result can be traced back to our
current weight-training procedure. Since weights are trained using units and features from a single
speaker (FS), they are therefore optimized for same-speaker synthesis. Results from the same-speaker
stimuli in Experiment #4 show a clear preference for MFCC (SSMFCC), which explains the high weight
10 Another possible explanation for the modest improvements of our approach is that it detects mispronunciation differences at the level of broad transcriptions. As noted by one of the anonymous reviewers of the manuscript, this approach may miss foreign accents that manifest themselves at a finer phonetic detail (e.g., lack of aspiration in a voiceless plosive by FS may be perceived as a voiced plosive by a native listener). To detect finer-grained mispronunciations, it may be possible to time-align utterances from the two speakers at the analysis-window level. Several techniques have been proposed recently for the specific problem of measuring VOT [38]. Ironically, our previous accent conversion approach [11] based on vocoding may be better suited to correct this type of mispronunciations; audio morphing with the proposed PDM method may be another option. 11 The FS and NS corpuses contain 20,000 and 13,000 phones, respectively, which is considered small for concatenative synthesis. For comparison, Clark et al. [31] indicate that in order to achieve reasonable performance (MOS of 3 out of 5) a database should contain a minimum of 36,000 phones. Even with these limitations, our FS database is the most extensive single-session collection of EMA data, to the best of our knowledge. For comparison, the MOCHA-TIMIT [20]and X-Ray Microbeam [21] datasets contain 30% and 50% fewer sentences per speaker.

Copyright (c) 2011 IEEE. Personal use is permitted. For any other purposes, permission must be obtained from the IEEE by emailing [email protected].
This article has been accepted for publication in a future issue of this journal, but has not been fully edited. Content may change prior to final publication.
values for MFCC in the hybrid set. Therefore, we do not expect the hybrid feature set to provide
significantly different results from ACMFCC. A potential direction for future research is to develop a
to represent
linguistically similar speech consistently across speakers. As an example, a simple solution may be to
.
The finding in Experiment #4 is important because it addresses a common issue found in
investigations of articulatory similarity across speakers. These studies typically compare the variance of
articulatory features (e.g. tongue position) with acoustic features (e.g. formant values) for multiple phones
across several speakers [41]. Information from these studies is used as evidence to determine whether
humans aim for auditory or articulatory targets when speaking (i.e., the domain with the least variance
across speakers being assumed to be the target domain). The problem with this methodology is that the
relationship between these two domains is highly nonlinear [37], which makes it difficult to perform a
meaningful comparison across domains. The approach used in Experiment #4 to create the different-
speaker stimuli resolves this issue by estimating the acoustic result of articulatory differences across
speakers (FS and NS in this case). As an example, NS may position his tongue in a forward position
compared to FS for a particular segment. To determine whether this difference is meaningful, one would
then synthesize a comparable utterance from FS using segments where the tongue was placed in a more
forward position, and then determine if this manipulation leads to significant differences in acoustics. In
other words, the approach has the potential to help distinguish between phonetic variations that are
linguistic or the result of organismic variation such as palate geometry or overall vocal tract morphology.
V I I . C O N C L USI O N
We have proposed a concatenative approach to foreign accent conversion that combines diphones
from a non-native corpus based on their similarity to acoustic/articulatory features from a native speaker.
Using this approach, we showed that the perceived degree of foreign accent in a Spanish speaker of
American English was reduced by 20%. Our results indicate that the tested acoustic and articulatory

Copyright (c) 2011 IEEE. Personal use is permitted. For any other purposes, permission must be obtained from the IEEE by emailing [email protected].
This article has been accepted for publication in a future issue of this journal, but has not been fully edited. Content may change prior to final publication.
representations are equally suitable for the purposes of accent conversion through concatenative
synthesis. These results also indicate that articulatory-based features are more speaker-independent than
acoustic features, but that they do not capture as much of the linguistic content of a diphone; this is most
likely because EMA can only track a small number of points within the vocal tract (upper and lower lips,
jaw, and 3 points along the tongue), whereas acoustic features characterize the full vocal tract.
The proposed framework allows accent conversion to be performed using other types of features.
We are currently exploring the use of two additional types of features: articulatory features predicted from
acoustics (i.e. through articulatory inversion) [42], which would allow us to significantly expand the unit-
selection corpus, and full tongue contours reconstructed from EMA [43], which may provide a better
articulatory representation than Maeda parameters. We expect these forthcoming studies to provide
further understanding of the types of features that are most suitable for accent conversion.
V I I I . A C K N O W L E D G M E N TS
This work was supported in part by the National Science Foundation under Award 0713205. We are also
grateful to Prof. Steve Renals and the Scottish Informatics and Computer Science Alliance (SICSA) for
CSTR.
I X . R E F E R E N C ES
[1] T. Scovel, A time to speak: a psycholinguistic inquiry into the critical period for human speech,
Cambridge, England: Newbury House, 1988.
[2] -
in Second Language Acquisition, vol. 5, no. 02, pp. 160-176, 1983.
[3]
vol. 51, no. 10, pp. 832-844, 2009.
[4] -Technology Interface in Computer Assisted
-467, 2002.
[5]

Copyright (c) 2011 IEEE. Personal use is permitted. For any other purposes, permission must be obtained from the IEEE by emailing [email protected].
This article has been accepted for publication in a future issue of this journal, but has not been fully edited. Content may change prior to final publication.
Congress of Phonetic Sciences, 2003, pp. 1157-1160.
[6]
-276, 1999.
[7] Recasts, and Explicit Correction in Relation to Error Types and
-301, 2001.
[8]
1990, pp. 1169-1172.
[9]
Science & Tech., 2006, pp. 24-29.
[10] - In search of the golden
-4, pp. 161-173, 2002.
[11] D. Felps, H. Bortfeld, and R. Gutierrez- r assisted
-932, 2009.
[12] -cavity/F2[prime] hypothesis tested by data on tongue
-S114, 1989.
[13] A
Synth. Workshop, 2007, pp. 182-185.
[14]
Forensic Linguistics, vol. 6, no. 2, pp. 290-299, 1999.
[15]
of Sociolinguistics, vol. 6, no. 2, pp. 179-208, 2002.
[16] - ch Synth. Workshop, 1998, pp.
117-180.
[17]
Speech Synth. Workshop, 2007, pp. 64-70.

Copyright (c) 2011 IEEE. Personal use is permitted. For any other purposes, permission must be obtained from the IEEE by emailing [email protected].
This article has been accepted for publication in a future issue of this journal, but has not been fully edited. Content may change prior to final publication.
[18] es of British,
676-689, 2007.
[19]
Proc. ICASSP, Phoenix, AZ, 1999, pp. 813-816.
[20] A. Wrench. "MOCHA-TIMIT,"Online Database. Available:
http://www.cstr.ed.ac.uk/research/projects/artic/mocha.html.
[21] J. R. Westbury, X-Ray Microbeam Speech Production Database Tech. Report, University of
Wisconsin, Madison, WI, 1994.
[22]
Proc. Int. Conf. of Phonetic Sciences, 2003, pp. 265-268.
[23] - -349,
2010.
[24] -by-synthesis features for speech
-4188.
[25]
pp. S22, 1979.
[26]
. ICASSP, 1997, pp. 1303-1306
[27]
-3, pp. 133-147, 1998.
[28] K. Vertanen, Baseline WSJ acoustic models for HTK and Sphinx: training recipes and
recognition experiments, Tech. Report, University of Cambridge, United Kingdom 2006.
[29] E. Martínez-Celdrán, A. M. Fernández-Planas, and J. Carrera-
Journal of the International Phonetic Association, vol. 33, no. 02, pp. 255-259, 2003.
[30]

Copyright (c) 2011 IEEE. Personal use is permitted. For any other purposes, permission must be obtained from the IEEE by emailing [email protected].
This article has been accepted for publication in a future issue of this journal, but has not been fully edited. Content may change prior to final publication.
-376.
[31] R. A. J. Clark, K. Richmond, and -domain unit selection for the Festival
-330, 2007.
[32] A. Conkie, and S. Isard, "Optimal coupling of diphones," Progress in Speech Synthesis, pp. 293
304, 1997.
[33]
-4, pp. 343-373, 2002.
[34]
Interspeech, 2009, pp. 1771-1774.
[35]
-266, 1994.
[36]
Speech and Audio Proc., vol. 6, no. 1, pp. 49-60, 1998.
[37] -45, 1989.
[38] J. H. L. Hansen, S. S. Gray,
pp. 777-789, 2010.
[39] -based formant synthesis and waveform concatenation: a hybrid
approach to text-to- -90.
[40] -language voice conversion using
bilingual and non- in Proc. Interspeech, 2002, pp.
[41]
vol. 94, no. 2, pp. 701-714, 1993.
[42] M. Á. Carreira- ory
-2472.
[43] C. Qin, and M. A. Carreira- -ray microbeam

Copyright (c) 2011 IEEE. Personal use is permitted. For any other purposes, permission must be obtained from the IEEE by emailing [email protected].
This article has been accepted for publication in a future issue of this journal, but has not been fully edited. Content may change prior to final publication.
-1595.
Daniel F elps received the B.S. degree in computer engineering (Hon.) from Texas A&M University (TAMU), College Station, in 2005, and the Ph.D. degree in computer engineering from TAMU in 2011. His research interests include speech processing, voice conversion, pattern recognition, and machine learning.
Christian G eng is a researcher in the Linguistics at University of Potsdam, Germany. He received his Diploma in Psychology in 1998 from the Free University Berlin, and his PhD in General Linguistics from the Humboldt-Universität zu Berlin in 2008. His research interests include all aspects of speech production/perception as well as speech processing. Within speech production, his special focus lies on instrumental methods in speech physiology. In particular, he has actively participated in the development of Electromagnetic Articulography (EMA), both within industrial and academic contexts.
Ricardo Gutier rez-Osuna Professor in the department of Computer Science and Engineering at Texas A&M University. He received a BS degree in electrical engineering from the Polytechnic University of Madrid, Spain, in 1992, and MS and PhD degrees in computer engineering from North Carolina State University, Raleigh, in 1995 and 1998, respectively. His current research interests include voice and accent conversion, speech and face perception, wearable physiological sensors, and active sensing. Dr. Gutierrez-Osuna received the NSF Faculty Early Career Development (CAREER) award in 2000. He is an associate editor at the IEEE Sensors Journal.