NOMINAL GDP vs. REAL GDP REAL GDP NOMINAL GDP vs. REAL GDP REAL GDP.
SPECIAL ARTICLES
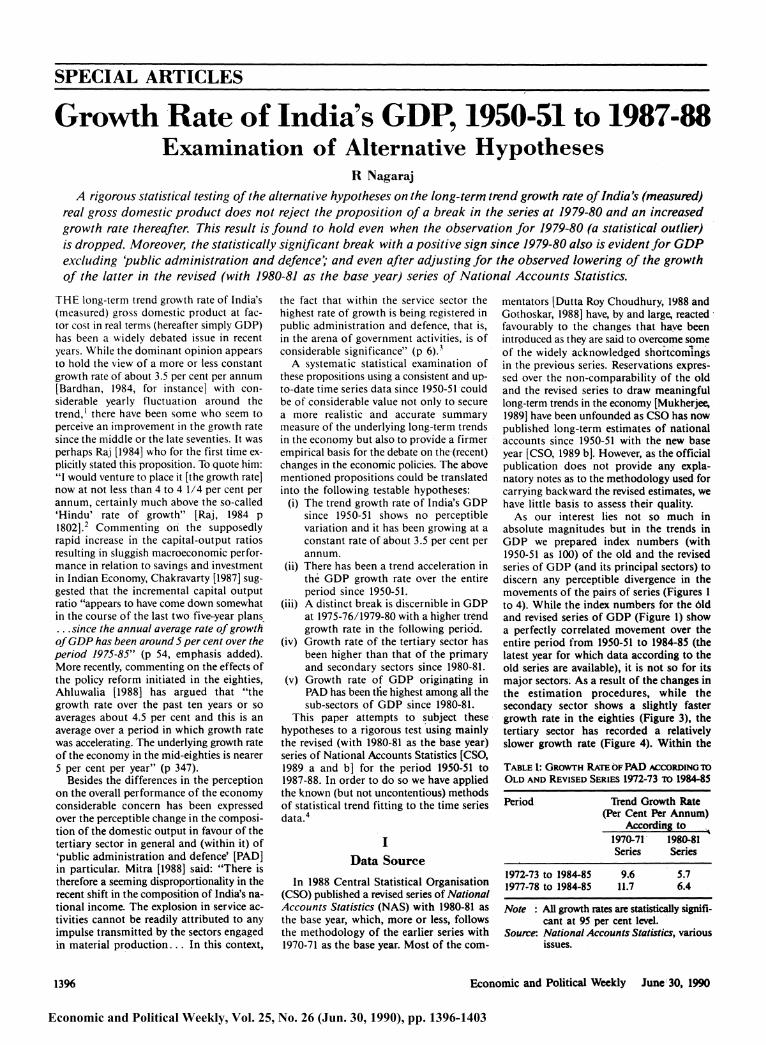
Growth Rate of India's GDP, 1950-51 to 1987-88 Examination of Alternative Hypotheses
R Nagaraj
A rigorous statistical testing of the alternative hypotheses on the long-term trend growth rate of India's (measured) real gross domestic product does not reject the proposition of a break in the series at 1979-80 and an increased growth rate thereafter. This result is found to hold even when the observation for 1979-80 (a statistical outlier) is dropped. Moreover, the statistically significant break with a positive sign since 1979-80 also is evident for GDP excluding 'public administration and defence'; and even after adjusting for the observed lowering of the growth of the latter in the revised (with 1980-81 as the base year) series of National Accounts Statistics.
THE long-term trend growth rate of India's (measured) gross domestic product at fac- tor cost in real terms (hereafter simply GDP) has been a widely debated issue in recent years. While the dominant opinion appears to hold the view of a more or less constant growth rate of about 3.5 per cent per annum [Bardhan, 1984, for instance] with con- siderable yearly fluctuation around the trend,' there have been some who seem to perceive an improvement in the growth rate since the middle or the late seventies. It was perhaps Raj [1984] who for the first time ex- plicitly stated this proposition. To quote him: "I would venture to place it [the growth rate] now at not less than 4 to 4 1/4 per cent per annum, certainly much above the so-called 'Hindu' rate of growth" [Raj, 1984 p 1802].2 Commenting on the supposedly rapid increase in the capital-output ratios resulting in sluggish macroeconomic perfor- mance in relation to savings and investment in Indian Economy, Chakravarty [1987] sug- gested that the incremental capital output ratio "appears to have come down somewhat in the course of the last two five-year plans . . since the annual average rate of growth of GDP has been around 5 per cent over the period 1975-85" (p 54, emphasis added). More recently, commenting on the effects of the policy reform initiated in the eighties, Ahluwalia [1988] has argued that "the growth rate over the past ten years or so averages about 4.5 per cent and this is an average over a period in which growth rate was accelerating. The underlying growth rate of the economy in the mid-eighties is nearer 5 per cent per year" (p 347).
Besides the differences in the perception on the overall performance of the economy considerable concern has been expressed over the perceptible change in the composi- tion of the domestic output in favour of the tertiary sector in general and (within it) of 'public administration and defence' [PAD] in particular. Mitra [1988] said: "There is therefore a seeming disproportionality in the recent shift in the composition of India's na- tional income. The explosion in service ac- tivities cannot be readily attributed to any impulse transmitted by the sectors engaged in material production ... In this context,
the fact that within the service sector the highest rate of growth is being registered in public administration and defence, that is, in the arena of government activities, is of considerable significance" (p 6).
A systematic statistical examination of these propositions using a consistent and up- to-date time series data since 1950-51 could be of considerable value not only to secure a more realistic and accurate summary measure of the underlying long-term trends in the economy but also to provide a firmer empirical basis for the debate on the-(recent) changes in the economic policies. The above mentioned propositions could be translated into the following testable hypotheses:
(i) The trend growth rate of India's GDP since 1950-51 shows no perceptible variation and it has been growing at a constant rate of about 3.5 per cent per annum.
(ii) There has been a trend acceleration in the GDP growth rate over the entire period since 1950-51.
(iii) A distinct break is discernible in GDP at 1975-76/1979-80 with a higher trend growth rate in the following period.
(iv) Growth rate of the tertiary sector has been higher than that of the primary and secondary sectors since 1980-81.
(v) Growth rate of GDP originating in PAD has been tfie highest among all the sub-sectors of GDP since 1980-81.
This paper attempts to subject these hypotheses to a rigorous test using mainly the revised (with 1980-81 as the base year) series of National Accounts Statistics [CSO, 1989 a and b] for the period 1950-51 to 1987-88. In order to do so we have applied the known (but not uncontentious) methods of statistical trend fitting to the time series data.4
Data Source
In 1988 Central Statistical Organisation (CSO) published a revised series of National Accounts Statistics (NAS) with 1980-81 as the base year, which, more or less, follows the methodology of the earlier series with 1970-71 as the base year. Most of the com-
mentators [Dutta Roy Choudhury, 1988 and Gothoskar, 1988] have, by and large, reacted favourably to the changes that have been introduced as they are said to overcome some of the widely acknowledged shortcomings in the previous series. Reservations expres- sed over the non-comparability of the old and the revised series to draw meaningful long-term trends in the economy [Mukherjee, 1989] have been unfounded as CSO has now published long-term estimates of national accounts since 1950-51 with the new base year [CSO, 1989 b]. However, as the official publication does not provide any expla- natory notes as to the methodology used for carrying backward the revised estimates, we have little basis to assess their quality.
As our interest lies not so much in absolute magnitudes but in the trends in GDP we prepared index numbers (with 1950-51 as 100) of the old and the revised series of GDP (and its principal sectors) to discern any perceptible divergence in the movements of the pairs of series (Figures I to 4). While the index numbers for the 61d and revised series of GDP (Figure 1) show a perfectly correlated movement over the entire period from 1950-51 to 1984-85 (the latest year for which data according to the old series are available), it is not so for its major sectors. As a result of the changes in the estimation procedures, while the secondary sector shows a slightly faster growth rate in the eighties (Figure 3), the tertiary sector has recorded a relatively slower growth rate (Figure 4). Within the
TABLE 1: GROWrH RATE OF PAD ACCORDING TO OLD AND REVISED SERIES 1972-73 ro 1984-85
Period Trend Growth Rate (Per Cent Per Annum)
According to 1970-71 1980-81 Series Series
1972-73 to 1984-85 9.6 5.7 1977-78 to 1984-85 11.7 6.4
Note : All growth rates are statistically signifi- cant at 95 per cent level.
Source: National Accounts Statistics, various issues.
Economic and Political Weekly June 30, 1990
Economic and Political Weekly, Vol. 25, No. 26 (Jun. 30, 1990), pp. 1396-1403
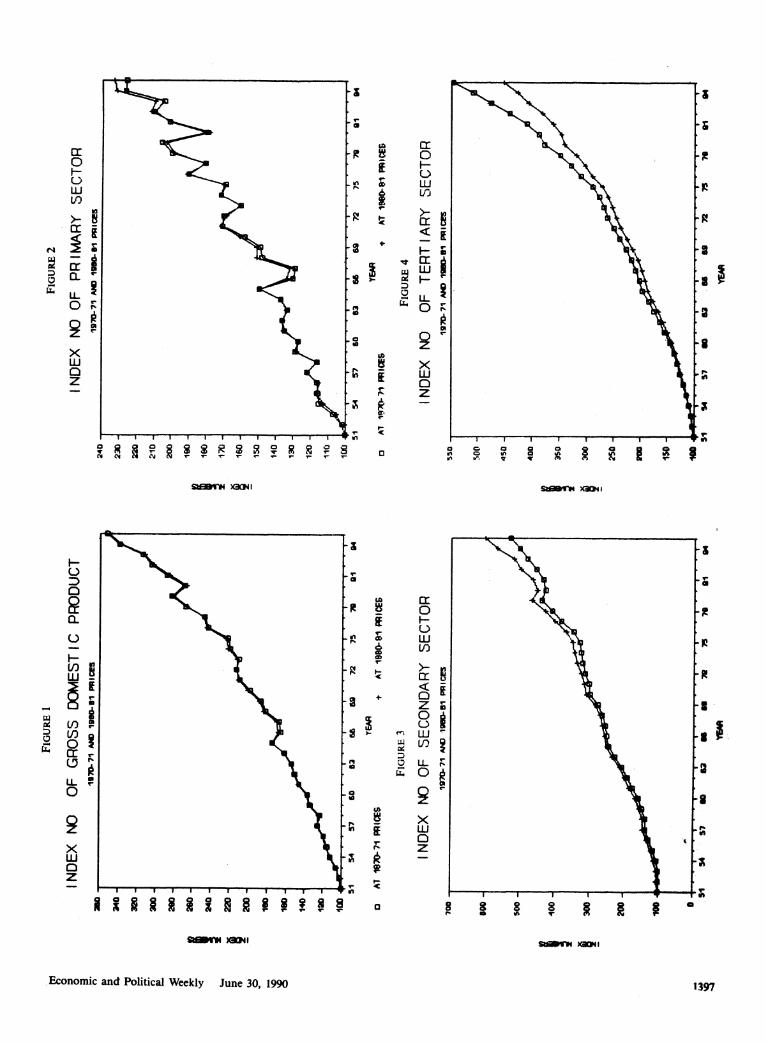
FIGURE I FIGURE 2 0 o INDEX NO OF GROSS DOMESTIC PRODUCT INDEX NO OF PRIMARY SECTOR
*19701-71 AND 1900-SI PRICES 1970-71 AND 1900-SI PRICES 240
340~~~~~~~~~~~~~~~~~~~~~~~3 -2 220
200 290-
p260-
240
1 70 220-
160
o ~~~~~~~~~~~~~~~~~~~~~~~~~~~~~150 140
140 130
120 110
loo~~~~~~~~~~~~~~~~~~~~~~~~~0 51 54 57 sO 53 56 gm 72 75 79 91 94 51 54 57 60 63 66 6 75 7 91 9
YEAR YEAR O A7 1870-71 FRICES + AT 198081 PRICES D Av i-W1,-7i FRICES + AT 1*80- 81
FIGURE 3 FIGURE 4
INDEX NO OF SECONDARY SECTOR INDEX NO OF TERTIARY SECTOR 1970-71 AND 1950-51 PRICE5 1970-71 AND 1900-81 PRICES
700~~~~~~~~~~~~~~~~~~~~~~~~~0
450-
$00~~~~~~~~~~~~~~~~~~~~~~~~0 400 - 36~~~~~~~~~~~~~~~~~~~~~00-
p300 -m
54 ~~~~~57 so 5 n a 72 n5 79 el 9 51 as as777
R ~~~~~~~~~~~~~~~~~~~~~~~ER
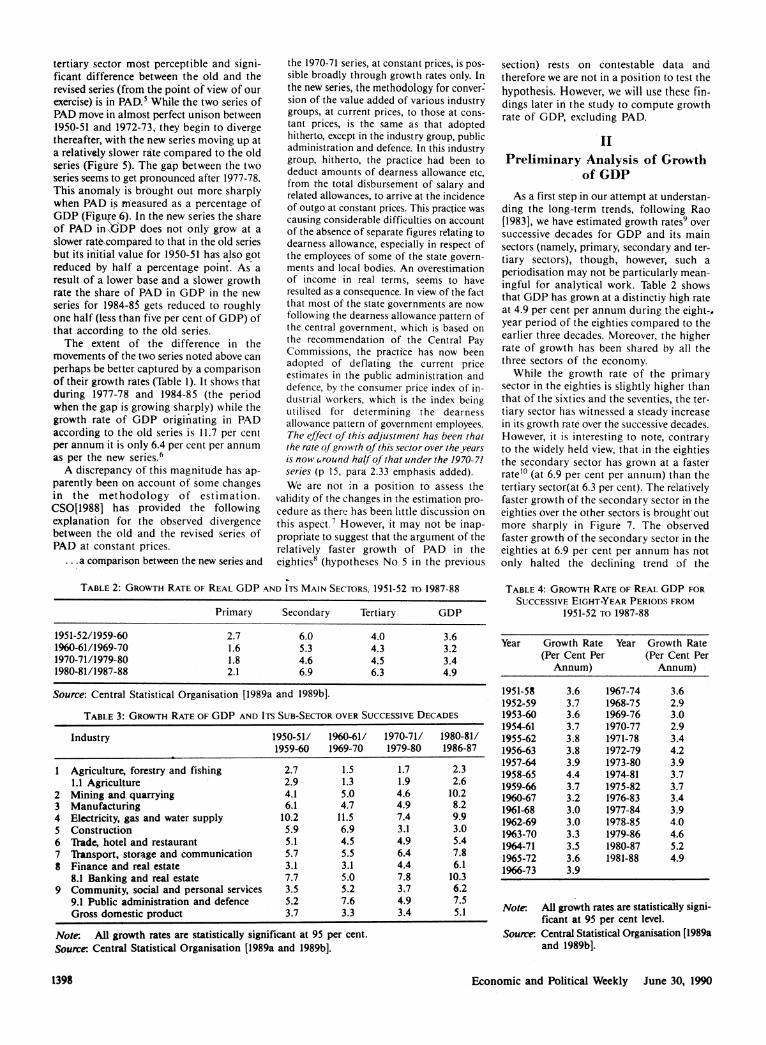
tertiary sector most perceptible and signi- ficant difference between the old and the revised series (from the point of view of our exercise) is in PAD.5 While the two series of PAD move in almost perfect unison between 1950-51 and 1972-73, they begin to diverge thereafter, with the new series moving up at a relatively slower rate compared to the old s,pries (Figdre 5). The gap between the two series seems to get pronounced after 1977-78. This anomaly is brought out more sharply when PAD is measured as a percentage of GDP (Figure 6). In the new series the share of PAD in\? DP does not only grow at a slower rat&,compared to that in the old series but its initial value for 1950-51 has also got reduced by half a percentage point. As a result of a lower base and a slower growth rate the share of PAD in GDP in the new series for 1984-8S gets reduced to roughly one half (less than five per cent of GDP) of that according to the old series.
The extent of the difference in the movements of the two series noted above can perhaps be better captured by a comparison of their growth rates (Table 1). It shows that during 1977-78 and 1984-85 (the period when the gap is growing sharply) while the growth rate of GDP originating in PAD according to the old series is 11.7 per cent per annum it is only 6.4 per cent per annum as per the new series.6
A discrepancy of this magnitude has ap- parently been on account of some changes in the methodology of estimation. CSO[1988] has provided the following explanation for the observed divergence between the old and the revised series of PAD at constant prices.
a comparison between the new series and
the 1970-71 series, at constant prices, is pos- sible broadly through growth rates only. In the new series, the methodology for conver- sion of the value added of various industry groups, at current prices, to those at cons- tant prices, is the same as that adopted hitherto, except in the industry group, public administration and defence. In this industry group, hitherto, the practice had been to deduct amounts of dearness allowance etc, from the total disbursement of salary and related allowances, to arrive at the incidence of outgo at constant prices. This practice was causing considerable difficulties on account of the absence of separate figures relating to dearness allowance, especially in respect of the employees of some of the state govern- ments and local bodies. An overestimation of income in real terms, seems to have resulted as a consequence. In view of the fact that most of the state governments are now following the dearness allowance pattern of the central government, which is based on the recommendation of the Central Pay Commissions, the practiSce has now been adopted of deflating the current price estimates in the public administration and defence, by the consumer price index of in- duistrial workers, which is the index being utilised for determining the dearness allowance pattern of government employees. The effect of this adjustment has been that the rate of grow th of this sector over the years is now t-round half of that under the 1970-71 series (p 15, para 2.33 emphasis added). We are not in a position to assess the
validity of the changes in the estimation pro- cedure as there has been little discussion on this aspect.7 However, it may not be inap- propriate to suggest that the argument of the relatively faster growth of PAD in the eighties8 (hypotheses No 5 in the previous
TABLE 2: GROWTH RATE OF REAL GDP AND ITS MAIN SECTORS, 1951-52 TO 1987-88
Primary Secondary Tertiary GDP
1951-52/1959-60 2.7 6.0 4.0 3.6 1960-61/1969-70 1.6 5.3 4.3 3.2 1970-71/1979-80 1.8 4.6 4.5 3.4 1980-81/1987-88 2.1 6.9 6.3 4.9
Source: Central Statistical Organisation [1989a and 1989b].
TABLE 3: GROWTH RATE OF GDP AND T'S SUB-SECTOR OVER SUCCESSIVE DECADES
Industry 1950-51/ 1960-61/ 1970-71/ 1980-81/ 1959-60 1969-70 1979-80 1986-87
1 Agriculture, forestry and fishing 2.7 1.5 1.7 2.3 1.1 Agriculture i 2.9 1.3 1.9 2.6
2 Mining and quarrying 4.1 5.0 4.6 10.2 3 Manufacturing 6.1 4.7 4.9 8.2 4 Electricity, gas and water supply 10.2 11.5 7.4 9.9 5 Construction 5.9 6.9 3.1 3.0 6 Trade, hotel and restaurant 5.1 4.5 4.9 5.4 7 Transport, storage and communication 5.7 5.5 6.4 7.8 8 Finance and real estate 3.1 3.1 4.4 6.1
8.1 Banking and real estate 7.7 5.0 7.8 10.3 9 Community, social and personal services 3.5 5.2 3.7 6.2
9.1 Public administration and defence 5.2 7.6 4.9 7.5 Gross domestic product 3.7 3.3 3.4 5.1
Note: All growth rates are statistically significant at 95 per cent. Source: Central Statistical Organisation [1989a and 1989b].
section) rests on contestable data and therefore we are not in a position to test the hypothesis. However, we will use these fin- dings later in the study to compute growth rate of GDP, excluding PAD.
II Preliminary Analysis of Growth
of GDP
As a first step in our attempt at understan- ding the long-term trends, following Rao [1983], we have estimated growth rates9 over successive decades for GDP and its main sectors (namely, primary, secondary and ter- tiary sectors), though, however, such a periodisation may not be particularly mean- ingful for analytical work. Table 2 shows that GDP has grown at a distinctiy high rate at 4.9 per cent per annum during the eight-. year period of the eighties compared to the earlier three decades. Moreover, the higher rate of growth has been shared by all the three sectors of the economy.
While the growth rate of the primary sector in the eighties is slightly higher than that of the sixties and the seventies, the ter- tiary sector has witnessed a steady increase in its growth rate over the successive decades. However, it is interesting to note, contrary to the widely held view, that in the eighties the secondary sector has grown at a faster rate'? (at 6.9 per cent per annum) than the tertiary sector(at 6.3 per cent). The relatively faster growth of the secondary sector in the eighties over the other sectors is brought out more sharply in Figure 7. The observed faster growth of the secondary sector in the eighties at 6.9 per cent per annum has not only halted the declining trend of the
TABLE 4: GROWTH RATE OF REAL GDP FOR SUCCESSIVE EIGHT-YEAR PERIODS FROM
1951-52 To 1987-88
Year Growth Rate Year Growth Rate (Per Cent Per (Per Cent Per
Annum) Annum)
1951-58 3.6 1967-74 3.6 1952-59 3.7 1968-75 2.9 1953-60 3.6 1969-76 3.0 1954-61 3.7 1970-77 2.9 1955-62 3.8 1971-78 3.4 1956-63 3.8 1972-79 4.2 1957-64 3.9 1973-80 3.9 1958-65 4.4 1974-81 3.7 1959-66 3.7 1975-82 3.7 1960-67 3.2 1976-83 3.4 1961-68 3.0 1977-84 3.9 1962-69 3.0 1978-85 4.0 1963-70 3.3 1979-86 4.6 1964-71 3.5 1980-87 5.2 1965-72 3.6 1981-88 4.9 1966-73 3.9
Note: All growth rates are statistically signi- ficant at 95 per cent level.
Source: Central Statistical Organisation [1989a and 1989b].
1398 Economic and Political Weekly June 30, 1990
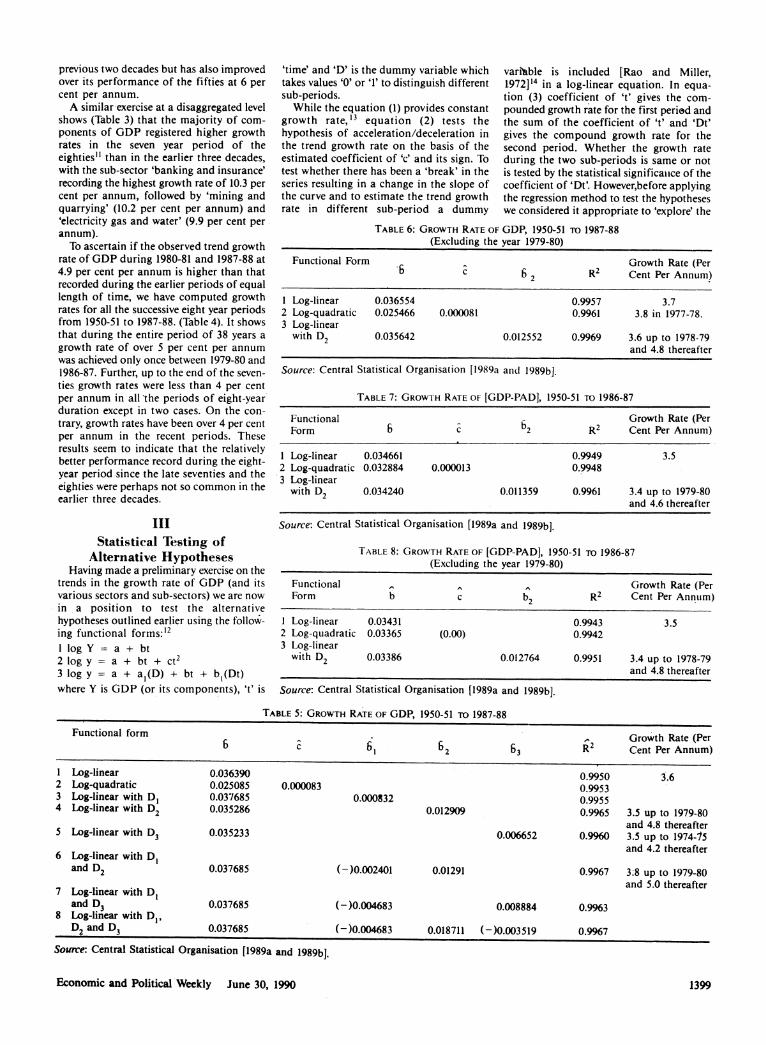
previous two decades but has also improved over its performance of the fifties at 6 per cent per annum.
A similar exercise at a disaggregated level shows (Table 3) that the majority of com- ponents of GDP registered higher growth rates in the seven year period of the eighties" than in the earlier three decades, with the sub-sector 'banking and insurance' recording the highest growth rate of 10.3 per cent per annum, followed by 'mining and quarrying' (10.2 per cent per annum) and 'electricity gas and water' (9.9 per cent per annum).
To ascertain if the observed trend growth rate of GDP during 1980-81 and 1987-88 at 4.9 per cent per annum is higher than that recorded during the earlier periods of equal length of time, we have computed growth rates for all the successive eight year periods from 1950-51 to 1987-88. (Table 4). It shows that during the entire period of 38 years a growth rate of over 5 per cent per annum was achieved only once between 1979-80 and 1986-87. Further, up to the end of the seven- ties growth rates were less than 4 per cent per annum in all the periods of eight-year duration except in two cases. On the con- trary, growth rates have been over 4 per cent per annum in the recent periods. These results seem to indicate that the relatively better performance record during the eight- year period since the late seventies and the eighties were perhaps not so common in the earlier three decades.
III Statistical Testing of
Alternative Hypotheses Having made a preliminary exercise on the
trends in the growth rate of GDP (and its various sectors and sub-sectors) we are now in a position to test the alternative hypotheses outlined earlier using the follow- ing functional forms:'2 1 log Y = a + bt 2 log y = a + bt + ct2 3 log y = a + al(D) + bt + bl(Dt) where Y is GDP (or its components), 't' is
TABLE 5: GROWTH RATE OF GDP, 1950-51 To 1987-88
Functional form Growth Rate (Per 6 c 61 62 63 R2 Cent Per Annum)
1 Log-linear 0.036390 0.9950 3.6 2 Log-quadratic 0.025085 0.000083 0.9953 3 Log-linear with D1 0.037685 0.000832 0.9955 4 Log-linear with D2 0.035286 0.012909 0.9965 3.5 up to 1979-80
and 4.8 thereafter 5 Log-linear with D3 0.035233 0.006652 0.9960 3.5 up to 1974-15
and 4.2 thereafter 6 Log-linear with D,
and D2 0.037685 (-)0.002401 0.01291 0.9967 3;8 up to 1979-80 and 5.0 thereafter
7 Log-linear with D, and D3 0.037685 (-)0.004683 0.008884 0.9963
8 Log-linear with D1, D2 and D3 0.037685 (-)0.004683 0.018711 (-)0.003519 0.9967
Source: Central Statistical Organisation [1989a and 1989b]
'time' and 'D' is the dummy variable which takes values 'O' or '1' to distinguish different sub-periods.
While the equation (1) provides constant growth rate, 13 equation (2) tests the hypothesis of acceleration/deceleration in the trend growth rate on the basis of the estimated coefficient of 'c' and its sign. To test whether there has been a 'break' in the series resulting in a change in the slope of the curve and to estimate the trend growth rate in different sub-period a dummy
vari'able is included [Rao and Miller, 1.972]'4 in a log-linear equation. In equa- tion (3) coefficient of 't' gives the com- pounded growth rate for the first period and the sum of the coefficient of 't' and 'Dt' gives the compound growth rate for the second period. Whether the growth rate during the two sub-periods is same or not is tested by the statistical significaiice of the coefficient of 'Dt'. However,before applying the regression method to test the hypotheses we considered it appropriate to 'explore' the
TABLE 6: GROWTH RATE OF GDP, 1950-51 To 1987-88 (Excluding the year 1979-80)
Functional Form Growth Rate (Per !6 c b 2 R2 Cent Per Annum)
1 Log-linear 0.036554 0.9957 3.7 2 Log-quadratic 0.025466 0.000081 0.9961 3.8 in 1977-78. 3 Log-linear
with D2 0.035642 0.012552 0.9969 3.6 up to 1978-79 and 4.8 thereafter
Source: Central Statistical Organisation [1989a an(d 1989b].
TABLE 7: GROWTH RATE OF [GDP-PAD], 1950-51 TO 1986-87
Functional Growth Rate (Per Form B c b2 R2 Cent Per Annum)
1 Log-linear 0.034661 0.9949 3.5 2 Log-quadratic 0.032884 0.000013 0.9948 3 Log-linear
with D2 0.034240 0.011359 0.9961 3.4 up to 1979-80 and 4.6 thereafter
Source: Central Statistical Organisation [1989a and 1989b].
TABLE 8: GROWTH RATE OF [GDP-PAD], 1950-51 TO 1986-87 (Excluding the year 1979-80)
Functional Growth Rate (Per Form b c b R2 Cent Per Annum)
1 Log-linear 0.03431 0.9943 3.5 2 Log-quadratic 0.03365 (0.00) 0.9942 3 Log-linear
with D2 0.03386 0.012764 0.9951 3.4 up to 1978-79 and 4.8 thereafter
Source: Central Statistical Organisation [1989a and 1989b].
Economic and Political Weekly June 30, 1990 1399

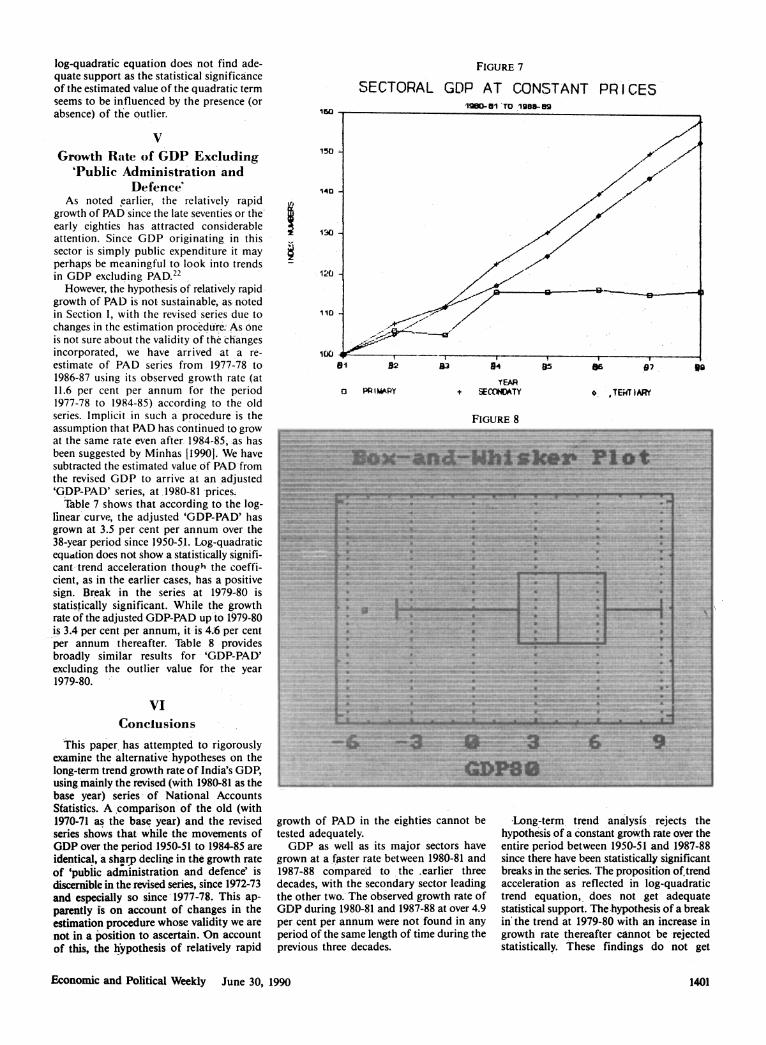
data to get a 'feel' of the pattern in the time series. 15 A box-and-whisker plot'6 (Figure 8) of the yearly growth rate of GDP shows that the observation for 1979-80 (when there was a sharp fall in GDP of 5.2 per cent over the previous year) is a clear outlier'7 indicating a possible break in the series at that point. However, on a priori considerations we have also tested for possible breaks in the series at 1965-66 [fall in GDP of 3.7 per cent over the previous year due to crop failure; and changes. in economic policies and agri- cultural technology since then] and 1975-76 (indicated by Chakravarty and Ahluwalia as a possible turning point in the growth rate of GDP), and attempted to . statistically verify them by the trend analysis.
Table 5 presents estimated trend equations for GDP under alternative functional specifications. According to the log-linear curve, GDP has grown at 3.6 per cent per annum18 for the entire period of 38 years since 1950- 51.19 Log-quadratic equation does not show a statistically significant acceleration in the trend, though the estimated coefficient has a positive sign.20 Therefore the hypothesis of trend accelera- tion in the growth rate of GDP is not sup- ported by the data.
Equations 3,6,7 and 8 (Table 5) clearly reject the hypothesis of any break in the series at 1965-66 implying that despite the changes in the economic policies and the introduction of the newer agricultural technology around that time the economy has continued to grow at an unchanging growth rate. Various estimated equations in the same table, however, do not reject the hypothesis of a possible break in the series at 1975-76/1979-80 and an increase in growth rate thereafter. According to equa- tion 5 while the growth rate of GDP up to 1974-75 is 3.5 per cent per annum, it increased to 4.2 per cent per annum thereafter. Similarly, while the growth rate of GDP up to 1979-80 (equation 6) is 3.8 per cent per annum, in the eight-year period after it witnessed a trend growth rate of 5.0 per cent per annum with a statistically significant break in the series. However, when the dummy variable to indicate breaks in the series at 1975-76 (D3) and 1979-80 (D2) are taken together (equation 8) the former turns statistically not significant with a negative sign suggesting perhaps the relatively 'strength' break in the series at 1979-80.
The above trend analysis, to recapitulate, rejects the hypotdieses of a trend accelera- tion over the entire period and a break in the series at 1965-66. The hypothesis of a constant growth rate is also rejected as the breaks in the series at 1975-76/1979-80 and an increase in growth rate thereafter are statistically significant. Moreover, the break in the series at 1979-80 and a higher growth rate in the eighties appears to be a statistical- ly stronger proposition than the break in the series at 1975-76.
Admittedly the above inference could be influenced by the presence of the statistical
FIGURE 5
INDEX NO OF PUB. ADMN. AND DEFENCE Al 197D-71 AM PRICES
1. 2
4.4
0.9
0.5
0.4
0.3
0.2 -
51 54 57 60 63 66 69 72 7S 78 91 94
YEAR O AT 1970-71 PRICES t AT 1980-81 PRICES
FIGURE 6
SHARE OF PUB . ADMN. AND DEFENCE I N GDP AT 1970-71 AND 198O-B1 PRICES
7
4
5.1 54 57 S0 63 Be 6s 72 75 79 91 94
YEAR o AT 19701-71 PRICES t AT 1980-81 PR ICIES
outlier (as revealed by Figure 8) in the data for the year 1979-80. To verify if' the significantly higher gr'owth rate of GDP in the eighties is on account of it, we dropped the value for the year 1979-80 and re- estimated the trend equations (Table 6). Though the growth rate according to the log- linear equation does not show any percep- tible change, the estimated coefficient of quadratic term turns out to be statistically significant with a positive sign indicating a trend acceleratiop in GDP. Further, the dummy variable test (equation 3) clearly shows a statistically significant break in the series at 1978-79 and the estimated equation
has a higher slope thereafter indicating a clear increase in trend growth rate in the eighties, uninfluenced by the presence of the outlier.
Thus the hypothesis of an unchanging growth rate over the entire period 1950-51 to 1987-88 is not a valid proposition as there has been a statistically significant break in the series at 1975-76/1979-80 and a higher growth rate thereafter. However, the argu- ment of such a break at 1979-80 appears to be statistically stronger proposition. This in- ference is valid even when the value for 1979-80, an outlier, is dropped. The hypothesis of a trend acceleration'based on
1400 Economic and Political Weekly June 30,- 1990
log-quadratic equation does not find ade- quate support as the statistical significance of the estimated value of the quadratic term seems to be influenced by the presence (or absence) of th'e outlier.
V
Growth Rate of GDP Excluding 'Public Administration and
Defence As noted earlier, the relatively rapid
growth of PAD since the late seventies or the- early eighties has attracted considerable attention. Since GDP originating in this sector is simply public expenditure it may perhaps be meaningful to look into trends in GDP excluding PAD.22
However, the hy'pothesis of relatively rapid growth of PAD is not sustainable, as noted in Section 1, with the revised series due to changes in the estimation procedu're: As One is not sure about the validity of the chalnges incorporated, we have arrived at a re- estimate of PAD series from 1977-78 to 1986-87 using its observed growth rate (at 11.6 per cent per annum for the period 1977-78 to 1984-85) according to the old series. Implicit in such a procedure is the assumption that PAD has continued to grow at the same rate even after 1984-85, as has been suggested by Minhas [19901. We have subtracted the estimated value of PAD from the revised GDP to arrive at an adjusted 'GDP-PAD' series, at 1980-81 prices;
Table 7 shows that according to the log- linear curve, the adjusted 'GDP-PAD' has grown at 3.5 per cent per annum over the 38-year period since 1950-51. Log-quadratic equdtion does not show a statistically signifl- cant trend acceleration though the coeffi- cient, as in the earlier cases, has a positive sign. Break in the series at 1979-80 is statistically significant. While the growth rate of the adjusted GDP-PAD up to 1979-80 is 3.4 per cent per annum, it is 4.6 per cent per annum thereafter. Table 8 provides broadly similar results for 'GDP-PAD' excluding the outlier value for the year 1979-80.
VI Conclusions
'This paper has attempted to rigorously examine the alternative hypotheses on the long-term trend growth rate of India's GDP, using'mainly the revised (with 1980-81 as the base year) series. of 'National Accounts Statistics. A comparison of the old (with 1970-71 as the base year) and the revised series shows that while the movements of GDP over the period 1950-51 to 1984-85 are identical, 'a sharp declirne in the growth rate of 'public administration and defence' is discernible in the revised series, since 1972-73 and especially so since 1977-78. This ap- parently is on account of changes in the estimation procedure whose validity we are not in a position to ascertain. On account of this, the hypothesis of relatively rapid
FIGURE 7
SECTORAL GDP AT CONSTANT PR ICES
140
51i 32 83 54 85 SB97 S
YEAR a PA IMAkPY + SECX*WMY ,TTAR
FIGURE 8
~~i1~~~~imHHiIiHEH . - H" .. . ~~~~~~~~~~~~~~~~~~~~~~P""'~~~~ .. .'.... . .....H .. . ..... ..........
H ....'lHH'.... ... -. - .-- . PP'""' ' '"" 'P' '"'1"'"''""''""'"~~~~~~~~~. ..................
NW ~ ~ ~ ~ ~ ~ ~ ~ ~ ~ ~ ~ ~ ~ ~ ~ HHI~~~~~~~~~~~~~~....I ~ ............
.~~~~f' -'-'PP+PP'HH'L""PPI . p~~~-- ------------
. p-IM nnI . -... .. ......US....
"'I'i'I'P"'IIIP"I 'IPHIP PHHIH'IILHHHIH'IIHOIHIHIHIHHIUHIHHHIIIHIIHHHIHIHWHH"IPlH'ir"WrHwI'HP H UP#PH.'H PiPHP.."iffi:.:' ......"...""..........P H-M I'I'.I'P"I'P IRJ iii-.-IM H0v. P"'"'1"I"I, P1IH1HPlU1IP4IP'IHL'HP( IPPPIPPHIIZ.WP'I W'P1'P'HPH1P1Pa1P.PIHuUP1WHHWM =.'I'P..............HIj"' 'IP'"P"I
'Pl.iL''.1'I" PIPP''IP'P' '1 PPWIPI 'HII4'1HIPH'HIIHHH.P111PR'g""". MM' 1'"P'
.I1IPH i'.lPPIPZ PIH PIIIIH IP ' I 1111 H lH' i ..........i M I N 1, 1 ,,,IIPI I 1-.II ' I.. 'I I I'i1I"I"II-H1 t I.. :-1 IIIIHiiPHHiPHHPPHH,~~~~~~~~,~.HIPPIIP, ~~~~ ~ ~ ~ p HP~~~..; I. I. .
i M -..................... ....H..... JIM MI .................
growth of PAD in the eighties cannot be tested adequately.
GDP as well as its major sectors have grown at a faster rate between 1980-81 and 1987-88 compared to the earlier three decades, with the secondary-sector leading the other two.' The observed growth rate of GDP during 1980-81 and 1987-88 at over 4.9 per cent per annum were not found in any period of the same length of time during the previous three decades.
Long-term trend analysis rejects the hypothesis of a constant growth rate over the entire period between 1950-51 and 1987-88 since there have been statistically significant breaks in the series. The proposition of trend acceleration as reflected in log-quadratic trend equation, does not get adequate statistical support. The-hypothesis of a break in the trend at 1979-80 with an increase in growth rate thereafter ca-nnot be rejected statistically. These findings do not get
Economic and Political Weekly June 30, 1990 1401
vitiated when the data for the year 1979-80, a statistical outlier, is excluded. On the contrary, when the outlier is dropped the hypothesis of trend acceleration in growth rate gets a statistically significant coefficient with a positive sign.
Since the growth of 'public administration and defence' has been a matter of dispute- and moreover it simply constitutes public expenditure-we attempted to look into trends in GDP excluding PAD. To overcome the observed lowering of its growth rate in the revised series, we re-estimated it for the period 197,2-73 to 1986-87 with the growth rate observed with'the old series between 1977-78 and 1984-85 and deducted it from GDP at 1980-81 prices to arrive at a more accurate measure of 'GDP-PAD'. Trend analysis of this series yields more or less identical results (even after dropping the outlier) to those observed with GPD, thus providing a more reasonable basis to sug- gest a clear increase in the trend growth rate of real GDP in the eighties. This statistical exercise, we believe, could provide a firmer basis for more meaningful debate on India's macroeconomic performance.
Notes
[I am grateful to A Vaidyanathan, N Krishnaji Sebastian Morris and G Pakki Reddy for theii comments on earlier drafts of this paper and the statistical results. My thanks to M V S Siva Prasad, G Bhaskar and J Nagarjan for their help in writing the paper.]
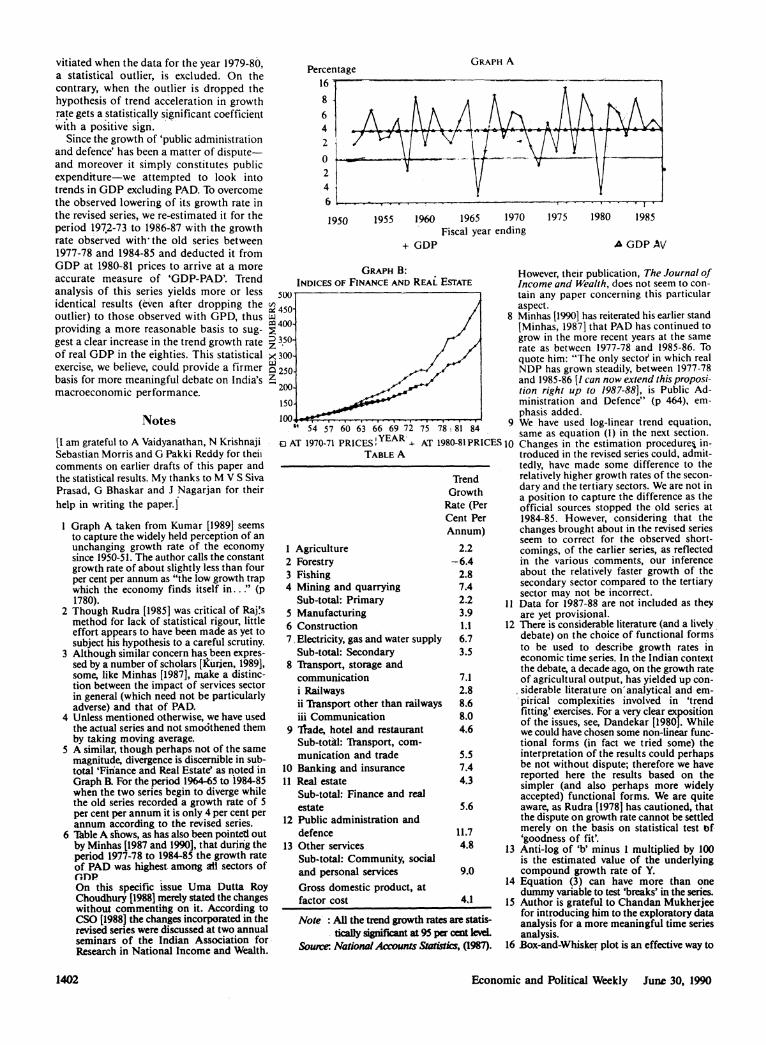
I Graph A taken from Kumar [1989] seems to capture the widely held perception of an unchanging growth rate of the economy since 1950-51. The author calls the constant growth rate of about slightly less than four per cent per annum as "the low growth trap which the economy finds itself in.. ." (p 1780).
2 Though Rudra [1985] was critical of Raj's method for lack of statistical rigour, little effort appears to have been made as yet to subject his hypothesis to a careful scrutiny.
3 Although similar concern has been expres- sed by a number of scholars [kiurien, 1989], some, like Minhas [1987], niake a distinc- tion between the impact of services sector in general (which need not be particularly adverse) and that of PAD.
4 Unless mentioned otherwise, we have used the actual series and not smoothened them by taking moving average.
5 A similar, though perhaps not of the same magnitude, divergence is discernible in sub- total 'Finance and Real Estate' as noted in Graph B. For the period 1964-65 to 1984-85 when the two series begin to diverge while the old series recorded a growth rate of 5 per cent per annum it is only 4 per cent per annum according to the revised series.
6 TAble A shows, as has also been pointed out by Minhas [1987 and 1990], that during the period 1977-78 to 1984-85 the growth rate of PAD was highest among all sectors of GDlP On this specific issue Uma Dutta Roy Choudhury [1988] merely stated the changes without commentihg on it. According to CSO [19881 the changes incorporated in the revised series were discussed at two annual seminars of the Indian Association for Research in National Income and Wealth.
GRAPH A Percentage
16
81
61
2
0 2
1950 1955 1960 1965 1970 1975 1980 1985 Fiscal year ending
+ GDP A GDP AV
GRAPH B: INDICES OF FINANCE AND REAL ESTATE
500' su)
X 450/ CO 400
~:)350-
>< 300-
1250
54 57 60 63 66 69 72 75 7,81 84
C AT 1970-71 PRICES YEAR _ AT 1980-81PRICES TABLE A
Trend Growth
Rate (Per Cent Per Annum)
1 Agriculture 2.2 2 Forestry -6.4 3 Fishing 2.8 4 Mining and quarrying 7.4
Sub-total: Primary 2.2 5 Manufacturing 3.9 6 Construction 1.1 7. Electricity, gas and water supply 6.7
Sub-total: Secondary 3.5 8 T1ansport, storage and
communication 7.1 i Railways 2.8 ii Transport other than railways 8.6 iii Communication 8.0
9 lrade, hotel and restaurant 4.6 Sub-total: Transport, com- munication and trade 5.5
10 Banking and insurance 7.4 11 Real estate 4.3
Sub-total: Finance and real estate 5.6
12 Public administration and defence 11.7
13 Other services 4.8 Sub-total: Community, social and personal services 9.0 Gross domestic product, at factor cost 4.1
Note : All the trend growth rates are statis- ticay nt at 95 per cent lveL
Sourcer: National Accounts Sttistics, (1987).
However, their publication, The Journal of Income and Wealth, does not seem to con- tain any paper concerning this particular aspect.
8 Minhas [1990] has reiterated his earlier stand [Minhas, 19871 that PAD has continued to grow in the more recent years at the same rate as between 1977-78 and 1985-86. To quote him: "The only sectoe' in which real NDP has grown steadily, between 1977-78 and 1985-86 [1 can now extend this proposi- tion right up to 1987-88], is Public Ad- ministration and Defence" (p 464), em- phasis added.
9 We have used log-linear trend equation, same as equation (1) in the next section.
10 Changes in the estimation procedurer in- troduced in the revised series could, admit- tedly, have made some difference to the relatively higher growth rates of the secon- dary and the tertiary sectors. We are not in a position to capture the difference as the official sources stopped the old series at 1984-85. However, considering that the changes brought about in the revised series seem to correct for the observed short- comings, of the earlier series, as reflected in the various comments, our inference about the relatively faster growth of the secondary sector compared to the tertiary sector may not be incorrect.
11 Data for 1987-88 are not included as they are yet provisional.
12 There is considerable literature (and a lively debate) on the choice of functional forms to be used to describe growth rates in economic time series. In the Indian context the debate, a decade ago, on the growth rate of agricultural output, has yielded up con- siderable literature on' analytical and em- pirical complexities involved in 'trend fitting' exercises. For a very clear exposition of the issues, see, Dandekar [1980]. While we could have chosen some non-linear func- tional forms (in fact we tried some) the interpretation of the results could perhaps be not without dispute; therefore we have reported here the results based on the simpler (and also perhaps more widely accepted) functional forms. We are quite aware, as Rudra [1978] has cautioned, that the dispute on growth rate cannot be settled merely on the basis on statistical test tf 'goodness of fit'.
13 Anti-log of 'b' minus I multiplied by 100 is the estimated value of the underlying compound growth rate of Y.
14 Equation (3) can have more than one dummy variable to test 'breaks' in the series.
15 Author is grateful to Chandan Mukherjee for introducing him to the exploratory data analysis for a more meaningful time series analysis.
16 Box-and-Whisker plot is an effective way to
1402 Economic and Political Weekly June 30, 1990

display summary statistics graphically. It allows one to detect outliers and note asym- metric behaviour since the plot divides the data into four areas of equal frequency.
17 Outliers are defined as those observations which are beyond 1.5 times the inter quar- tile range.
18 All trend equation reported in this note have been tested for statistical significance at 95 per cent confidence level, unless otherwise stated.
19 We have not included the observation for the year 1988-89 when GDP increased over the previous year by over 10 per cent since such a sharp rise in the terminal year of the series could severely distort the value of the estimated coefficient.
20 The coefficient (with estimated 't' value of 1.974) is, however, statistically significant at 90 per cent confidence level.
21 Log-quadratic trend equation for the 3-year moving average of GDP without excluding the observation for the outlier, i e, 1979-80, also shows a statistically significant acceleration.
log Y = 9.199 + 0.026 t + 0.000079 t2
(6.198) (2.632) R2 = 0.9976 N = 38
Where Y is smoothened GDP and figures in brackets refer to estimated 't' values. Both the independent variables are statistically significant at 95 per cent confidence level.
22 Minhas has, in fact, used this category in his recent analysis [Minhas 1987].
References Ahluwalia, Montek S (1988): 'India's Economic
Performance, Policies and Prospects' in Robert E B Lucas and Gustav F Papanek (eds), The Indian Economy: Recent Development and Future Prospects, Oxford University Press, Delhi.
Bardhan, Pranab (1984): The Political Economy of Development in India, Oxford Univer- sity Press, Delhi.
Central Statistical Organisation (1988): New Series on National Accounts with 1980-81 as Base year, 1980-81 to 1985-86, Govern- ment of India, New Delhi.
-(1989a): National Accounts Statistics, 1980-81 to 1986-87, Government of India, New Delhi.
-(1989b): National Accounts Statistics, (New Series) 1950-51 1979-80, Government of India, New Delhi.
Chakravarty, Sukhamoy (1987): Development Planning: The Indian Experience, Clarendon Press, Oxford.
Dandekar, V M (1980): 'Introduction', Indian Journal of Agricultural Economics, Vol 35, No 2 April-June.
Gothoskar, S P (1988): 'New Approach in National Account Statistics', Economic and Political Weekly, September 24.
Kumar, Arun (1989): 'Unemployment, Technological Dynamism and Need for Government Intervention: A Closer Look at 1989-90 Budget', Economic and Political Weekly, August 5.
Kurien, C T (1989): 'Indian Economy in the
1980s and on to the 1990s', Economic and Political Weekly, April 15.
Minhas, B S (1987): 'The Planning Process and the Annual Budgets: Some Reflections on Recent Indian Experience', Indian Economic Review, Vol 22, No 2.
--(1990): 'NSS Consumer Expenditure Data: Further Comment'. Economic and Political Weekly, March 3.
Mitra, Ashok (1988): 'Disproportionality and the Service Sector: A Note, Social Scientist, No 179, April.
Mukherjee, M (1988): 'New National Income Estimates: Some Observations'. Economic and Political Weekly, Vol 23, No 48, November 26.
Raj, K N (1984): 'Some observations on Economic Growth in India over the Period 1952-53 to 1982-83', Economic and Political Weekly, Vol 19, No 41, October 13.
Rao, Patluri and Miller, Roger Le Roy (1972): Applied Econometrics, Wiley Eastern.
Rao, V K R V (1983): India's National Income, 1950- 1980, Sage Publication, New Delhi.
Roy Choudhury, Uma Dutta(1985): 'New Series on National Accounts Statistics: Some Comments', Economic and Political Week- ly, Vol 23, No 30, July 23.
Rudra, Ashok (1978): 'Organisation of Agriculture for Rural Development: The Indian Case', Cambridge Journal of Economics, December.
-(1985): 'Economic Growth in India', Economic and Political Weekly, Vol 20 No 15, April 13.
JUST PUBLISHED !_ Perestroilka in India ............ .. . ......................... ..................... .. ...... ..... ..
V D T p 5 2 .... :~~~ ~~~~~~~~~~~~~~~.......... . .. v
*s * - 11 s tJ o $, ,: ,: , ~~~~~~~~~~~~~~~~~~~~~~~~~~~~~~~~~~~~~. . . . . . . . . I . . . . . .,. . . '""""'w 'Z '"n ........... .............
N.S.~~~~~~~~~~~~~~~~~~~~~~~~~~~~. .....aha ..... .......
}..'..'.'.'."... t'. .~~~~..........
~~~~~~~~~~~~~~~. . . . . . . . . . . . . . . . ..... t . G. S. BHARGAVA ~~~~~~~~~~~~~~~~~~~~~~~~~~~~~~~~~~~~~..................... ....
220~~~~~~~~~~~~~~~~~~~~~~~~~~~~~~~~~... .... ....... ...... cm.cot.R..4 ZN ~~~~~~~~~~~~~~~~~~~~~~~~~~~~~~~~~~~~~~~~~~~..... .......
Economic and Political Weekly June 30, 1990 1403