
GDP, incomes and austerity - IFS · GDP, incomes and austerity ... Comparison of forecasts for real...
40
GDP, incomes and austerity Paul Johnson © Institute for Fiscal Studies
Transcript of GDP, incomes and austerity - IFS · GDP, incomes and austerity ... Comparison of forecasts for real...

GDP, incomes and austerity Paul Johnson
© Institute for Fiscal Studies

Since 2008...
• Following a long period of growth, GDP has fallen dramatically and failed to recover
© Institute for Fiscal Studies
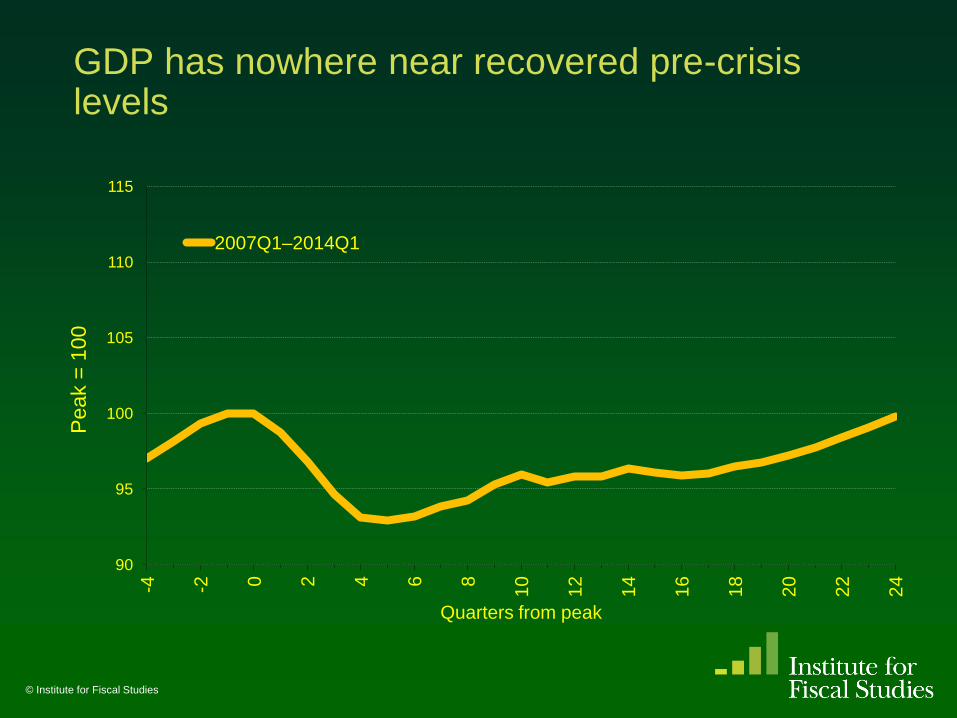
GDP has nowhere near recovered pre-crisis levels
© Institute for Fiscal Studies
90
95
100
105
110
115
-4
-2
0
2
4
6
8
10
12
14
16
18
20
22
24
Peak =
100
Quarters from peak
2007Q1–2014Q1
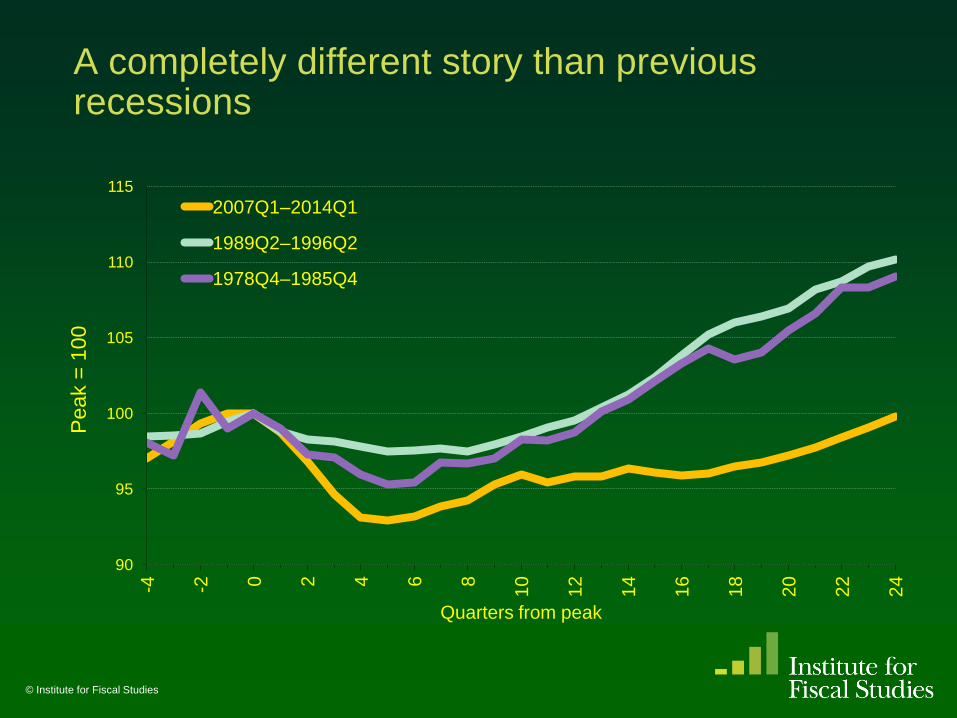
A completely different story than previous recessions
© Institute for Fiscal Studies
90
95
100
105
110
115
-4
-2
0
2
4
6
8
10
12
14
16
18
20
22
24
Peak =
100
Quarters from peak
2007Q1–2014Q1
1989Q2–1996Q2
1978Q4–1985Q4

70
75
80
85
90
95
100
105
110
Last quarter’s good news doesn’t change the pattern:
GDP flat for two years

Since 2008...
• GDP has fallen dramatically and failed to recover
• Trend output is now expected to be 13% smaller in 2016 than had been forecast in Budget 2008
– The economy will be about £200 billion smaller than expected
• This is expected to be a permanent loss
– Depends on uncertain estimates of the “output gap”
© Institute for Fiscal Studies

Trend GDP revised down as successive outturns for actual GDP weaker than expected
90
100
110
120
130
140
150
Level
of
GD
P
(In
dex, actu
al
2009-1
0 G
DP
= 1
00)
Nov 10 - Actual Nov 10 - Trend
Nov 11 - Actual Nov 11 - Trend
Mar 08 - Trend
© Institute for Fiscal Studies
Comparison of forecasts for real GDP growth and trend GDP
13% loss
of trend
output
Source: Author’s calculations, Office for Budget Responsibility, HM Treasury.
But GDP isn’t everything
• Incomes matter most to most people
– They were rising much more slowly than GDP pre-recession
© Institute for Fiscal Studies

Living Standards since 2002-03
© Institute for Fiscal Studies
90
95
100
105
110
115
120
Qu
art
er
2 2
00
2 =
10
0
Source: ONS series IHXW and Family Resources Survey, various years
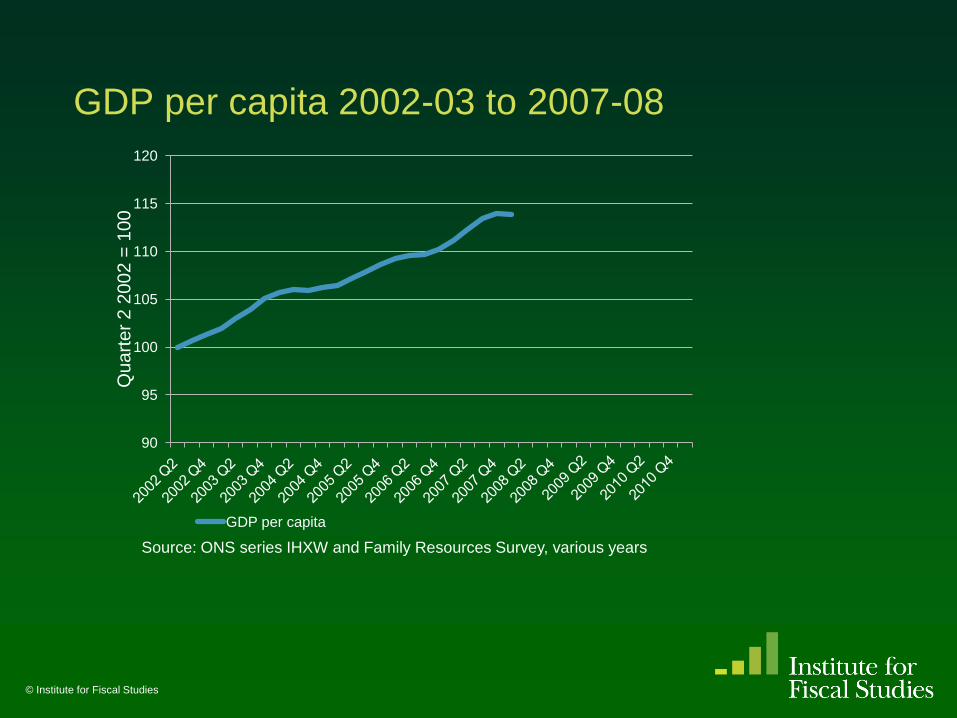
GDP per capita 2002-03 to 2007-08
© Institute for Fiscal Studies
90
95
100
105
110
115
120
Qu
art
er
2 2
00
2 =
10
0
GDP per capita
Source: ONS series IHXW and Family Resources Survey, various years

Slow income growth before the recession
© Institute for Fiscal Studies
90
95
100
105
110
115
120
Qu
art
er
2 2
00
2 =
10
0
GDP per capita Mean income Median income
Source: ONS series IHXW and Family Resources Survey, various years

But GDP isn’t everything
• Incomes matter most to most people
– They were rising much more slowly than GDP pre-recession
– Stood up well during the recession
© Institute for Fiscal Studies

Sharp fall in GDP per capita in recession...
© Institute for Fiscal Studies
90
95
100
105
110
115
120
Qu
art
er
2 2
00
2 =
10
0
GDP per capita Mean income Median income
Peak to trough
fall in GDP per
capita of 7.9%
Source: ONS series IHXW and Family Resources Survey, various years
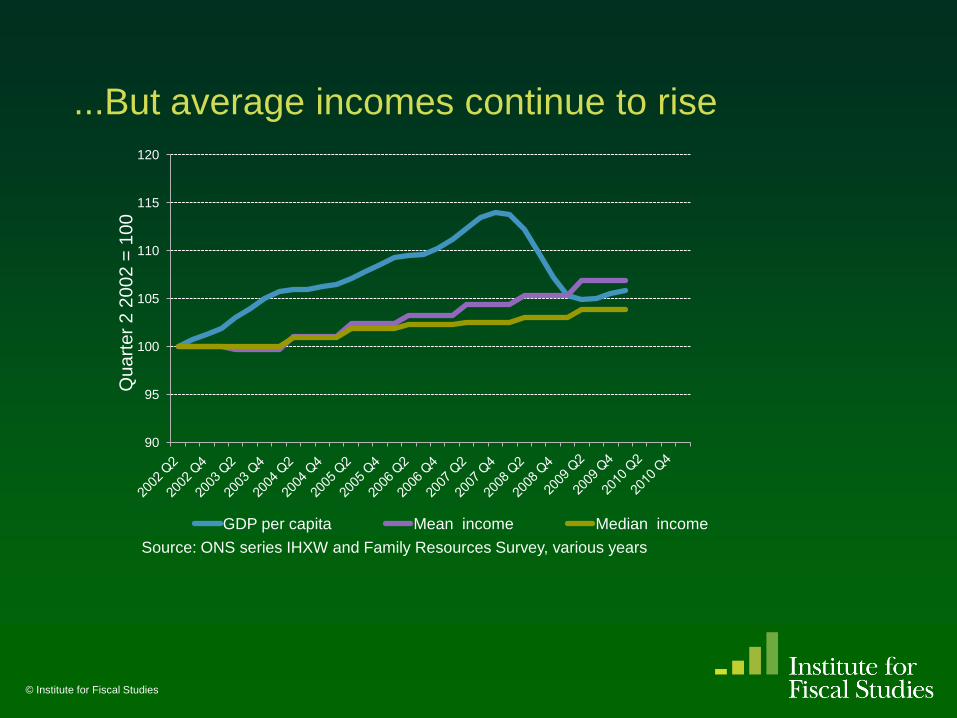
...But average incomes continue to rise
© Institute for Fiscal Studies
90
95
100
105
110
115
120
Qu
art
er
2 2
00
2 =
10
0
GDP per capita Mean income Median income
Source: ONS series IHXW and Family Resources Survey, various years

But GDP isn’t everything
• Incomes matter most to most people
– They were rising much more slowly than GDP pre-recession
– Stood up well during the recession
– But took a dive in 2010-11
© Institute for Fiscal Studies

Weak macroeconomic recovery in 2010-11
© Institute for Fiscal Studies
90
95
100
105
110
115
120
Qu
art
er
2 2
00
2 =
10
0
GDP per capita Mean income Median income
GDP per capita
grew 1.4% in
2010-11
Source: ONS series IHXW and Family Resources Survey, various years

Large falls in average income in 2010-11
© Institute for Fiscal Studies
90
95
100
105
110
115
120
Qu
art
er
2 2
00
2 =
10
0
GDP per capita Mean income Median income
• Median income fell 3.1% to reach £ 419 per week
• Mean income fell 5.7% to reach £511 per week
Source: ONS series IHXW and Family Resources Survey, various years

We don’t expect a swift recovery
© Institute for Fiscal Studies
90
91
92
93
94
95
96
97
98
99
100
2009-10 2010-11 2011-12 2012-13 2013-14 2014-15 2015-16
Med
ian
net
ho
useh
old
in
co
me (
ind
exed
to
2009=
100)
Sources: Department for Work and Pensions’ HBAI series; IFS calculations and projections using Family Resources Survey.

But GDP isn’t everything
• Incomes matter most to most people
– They were rising much more slowly than GDP pre-recession
– Stood up well during the recession
– But took a dive in 2010-11
– With the rich hardest hit
© Institute for Fiscal Studies
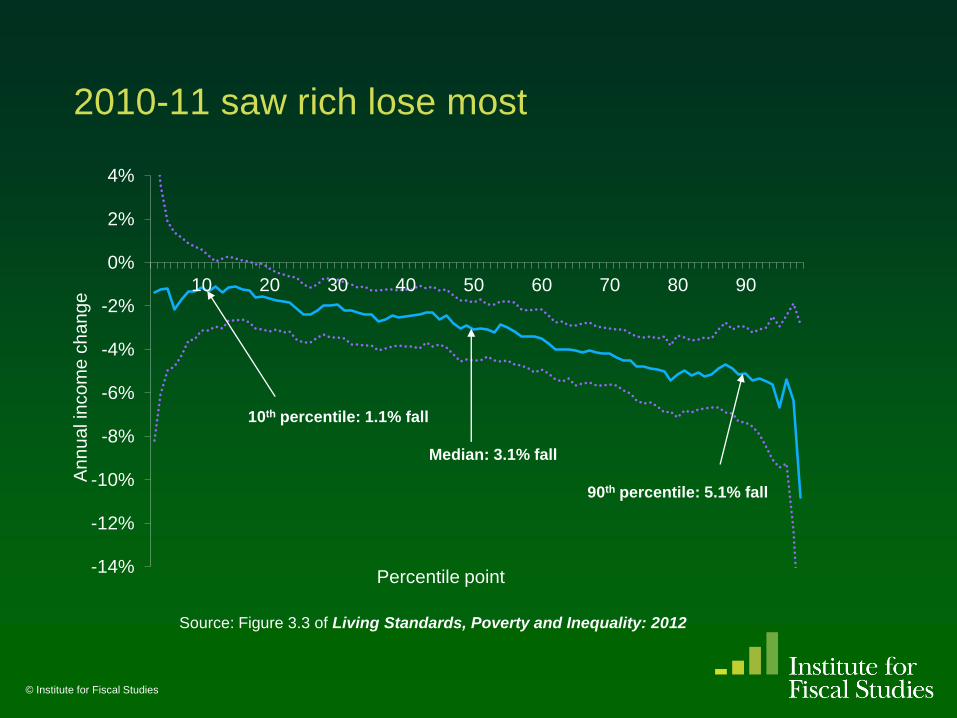
2010-11 saw rich lose most
© Institute for Fiscal Studies
-14%
-12%
-10%
-8%
-6%
-4%
-2%
0%
2%
4%
10 20 30 40 50 60 70 80 90
An
nu
al in
co
me
ch
an
ge
Percentile point
Median: 3.1% fall
10th percentile: 1.1% fall
90th percentile: 5.1% fall
Source: Figure 3.3 of Living Standards, Poverty and Inequality: 2012

In contrast to previous period
© Institute for Fiscal Studies
-2%
-1%
0%
1%
2%
3%
4%
10 20 30 40 50 60 70 80 90
Ave
rage
an
nu
al in
co
me
ga
in
Percentile point
Income growth: 1996–97 to 2009–10
Source: Figure 3.5 of Living Standards, Poverty and Inequality: 2012

Income growth since 1996-97 (GB)
© Institute for Fiscal Studies
-2%
-1%
0%
1%
2%
3%
4%
10 20 30 40 50 60 70 80 90
Ave
rage
an
nu
al in
co
me
ga
in
Percentile point
Income growth: 1996–97 to 2010–11
Income growth: 1996–97 to 2009–10
Source: Figure 3.5 of Living Standards, Poverty and Inequality: 2012

And very different from period from 1979-96
© Institute for Fiscal Studies
-2%
-1%
0%
1%
2%
3%
4%
10 20 30 40 50 60 70 80 90
Ave
rage
an
nu
al in
co
me
ga
in
Percentile point
Income growth: 1979 to 1996–97
Income growth: 1996–97 to 2010–11
Income growth: 1996–97 to 2009–10
Source: Figure 3.5 of Living Standards, Poverty and Inequality: 2012
But GDP isn’t everything
• Incomes matter most to most people
– They were rising much more slowly than GDP pre-recession
– Stood up well during the recession
– But took a dive in 2010-11
– With the rich hardest hit
• Employment rates look strong
© Institute for Fiscal Studies

Employment rates are remarkably high
© Institute for Fiscal Studies

But GDP isn’t everything
• Incomes matter most to most people
– They were rising much more slowly than GDP pre-recession
– Stood up well during the recession
– But too a dive in 2010-11
– With the rich hardest hit
• Employment rates look strong
– And unemployment much less high than you’d expect
© Institute for Fiscal Studies

Unemployment rate lower than past recessions (unemployment as percent of economically active population)
0
2
4
6
8
10
12
14

But GDP isn’t everything
• Incomes matter most to most people
– They were rising much more slowly than GDP pre-recession
– Stood up well during the recession
– But too a dive in 2010-11
– With the rich hardest hit
• Employment rates look strong
– And unemployment much less high than you’d expect
– Though that implies a productivity problem
© Institute for Fiscal Studies

Productivity (output per hour) has taken a dive
© Institute for Fiscal Studies

But GDP isn’t everything
• Incomes matter most to most people
– They were rising much more slowly than GDP pre-recession
– Stood up well during the recession
– But too a dive in 2010-11
– With the rich hardest hit
• Employment rates look strong
– And unemployment much less high than you’d expect
– Though that implies a productivity problem
• We also don’t have the repossession rates of the early 1990s
© Institute for Fiscal Studies

Repossession rates lower than early 1990s (as a percentage of total number of mortgages)
0.00
0.10
0.20
0.30
0.40
0.50
0.60
0.70
0.80
0.90
Properties repossessed

But GDP isn’t everything
• Incomes matter most to most people
– They were rising much more slowly than GDP pre-recession
– Stood up well during the recession
– But too a dive in 2010-11
– With the rich hardest hit
• Employment rates look strong
– And unemployment much less high than you’d expect
– Though that implies a productivity problem
• We also don’t have the repossession rates of the early 1990s
• GDP obviously does not tell the whole story
– But falling GDP did create a massive fiscal problem
© Institute for Fiscal Studies
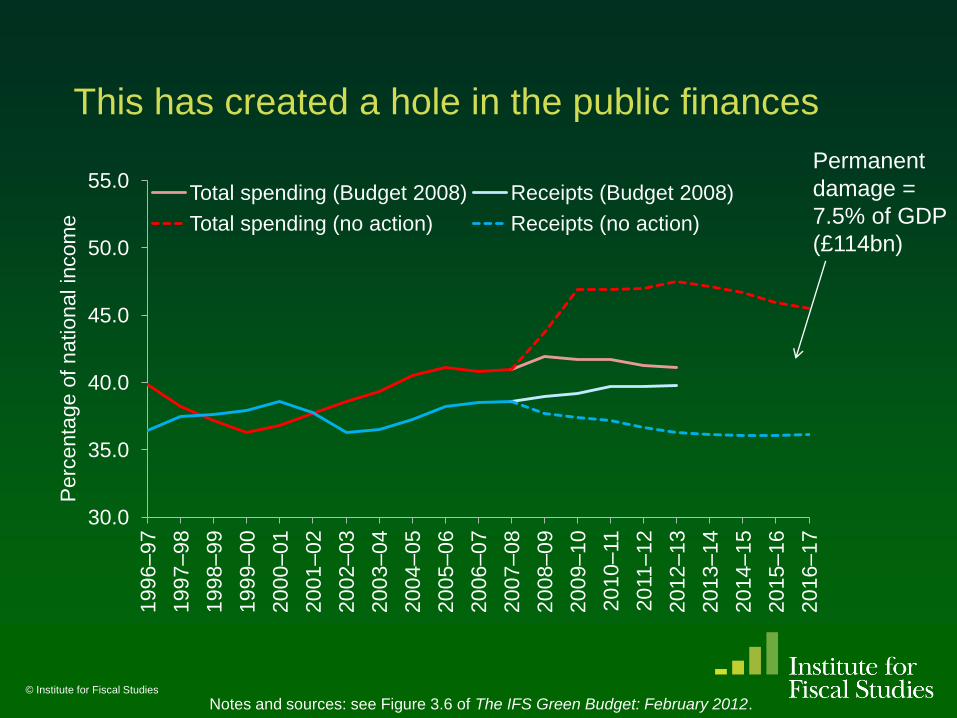
This has created a hole in the public finances
© Institute for Fiscal Studies
30.0
35.0
40.0
45.0
50.0
55.0
19
96
–9
7
1997–98
19
98
–9
9
19
99
–0
0
20
00
–0
1
20
01
–0
2
20
02
–0
3
20
03
–0
4
20
04
–0
5
20
05
–0
6
20
06
–0
7
20
07
–0
8
20
08
–0
9
20
09
–1
0
20
10–
11
20
11–
12
20
12
–1
3
2013–14
20
14
–1
5
20
15
–1
6
20
16
–1
7
Perc
enta
ge o
f national in
com
e
Total spending (Budget 2008) Receipts (Budget 2008)
Total spending (no action) Receipts (no action)
Permanent
damage =
7.5% of GDP
(£114bn)
Notes and sources: see Figure 3.6 of The IFS Green Budget: February 2012.

Which has to be dealt with
© Institute for Fiscal Studies
0
20
40
60
80
100
120
140
160
180
200 1974–75
1978–79
1982–83
1986–87
1990–91
1994–95
1998–99
2002–03
2006–07
2010–11
2014–15
2018–19
2022–23
2026–27
2030–31
2034–35
2038–39
2042–43
2046–47
2050–51
Perc
enta
ge o
f national in
com
e
Debt: Budget 2008
Debt: No policy action
Notes and sources: see Figure 3.3 of The IFS Green Budget: February 2012.

0
1
2
3
4
5
6
7
8
9
2010–11 2011–12 2012–13 2013–14 2014–15 2015–16 2016–17
Perc
enta
ge o
f national in
com
e Other current spend
Debt interest
Benefits
Investment
Tax increases
© Institute for Fiscal Studies
The government plans to do that over 7 years (original plan to do so over 5 years)
20%
80%
Notes and sources: see Figure 3.5 of The IFS Green Budget: February 2012.
Nov 2011: 7.5% national income (£114bn) hole in public finances

© Institute for Fiscal Studies
Which just leads to fiscal mandate being met..
30.0
35.0
40.0
45.0
50.0
55.0
19
96
–9
7
1997–98
19
98
–9
9
19
99
–0
0
20
00
–0
1
20
01
–0
2
20
02
–0
3
20
03
–0
4
20
04
–0
5
20
05
–0
6
20
06
–0
7
20
07
–0
8
20
08
–0
9
20
09
–1
0
20
10–
11
20
11–
12
20
12
–1
3
2013–14
20
14
–1
5
20
15
–1
6
20
16
–1
7
Perc
enta
ge o
f national in
com
e
Total spending (Budget 2008) Receipts (Budget 2008) Receipts (no action) Total spending (no action)
Notes and sources: see Figure 3.6 of The IFS Green Budget: February 2012.

Debt back on a more sustainable path - but to remain above pre-crisis levels for a generation
© Institute for Fiscal Studies
0
20
40
60
80
100
120
140
160
180
200 1974–75
1977–78
1980–81
1983–84
1986–87
1989–90
1992–93
1995–96
1998–99
2001–02
2004–05
2007–08
2010–11
2013–14
2016–17
2019–20
2022–23
2025–26
2028–29
2031–32
2034–35
2037–38
2040–41
Perc
enta
ge o
f national in
com
e
Debt: Budget 2008 Debt: No policy action Debt: Current policy Debt: Current policy – incl. estimated impact of ageing
Notes and sources: see Figure 3.3 of The IFS Green Budget: February 2012.

7-year squeeze on public service spending
© Institute for Fiscal Studies
-10
-5
0
5
10
15 1950–51
1955–56
1960–61
1965–66
1970–71
1975–76
1980–81
1985–86
1990–91
1995–96
2000–01
2005–06
2010–11
2015–16 A
nnual perc
enta
ge r
eal in
cre
ase
Labour ConLib Historic 7 year moving average
Note: Figure shows total public spending less spending on welfare
benefits and debt interest.
9.3% cut
over 7 years
16.2% cut
over 7 years
Summary
• The loss of output following the crisis has been deep and prolonged
• With a consequent reduction in household incomes
– Though in many ways this really has been an equitable recession
• A dramatic worsening of the public finances
• Government’s fiscal consolidation is most dramatic in 60 years
– But still leaves debt above pre-crisis levels for a generation or more
• More bad news likely in the Autumn Statement
© Institute for Fiscal Studies

Summary
• The loss of output following the crisis has been deep and prolonged
• With a consequent reduction in household incomes
– Though in many ways this really has been an equitable recession
• A dramatic worsening of the public finances
• Government’s fiscal consolidation is most dramatic in 60 years
– But still leaves debt above pre-crisis levels for a generation or more
• More bad news likely in the Autumn Statement
• No sunny uplands around the corner
© Institute for Fiscal Studies