Growth Diversification - University of Montana
38
Transcript of Growth Diversification - University of Montana

Growth
Diversification
High Wage Jobs The only Accredited Economic
Development Organization in Montana

Forward Great Falls What is it?

Coaching Businesses to Success
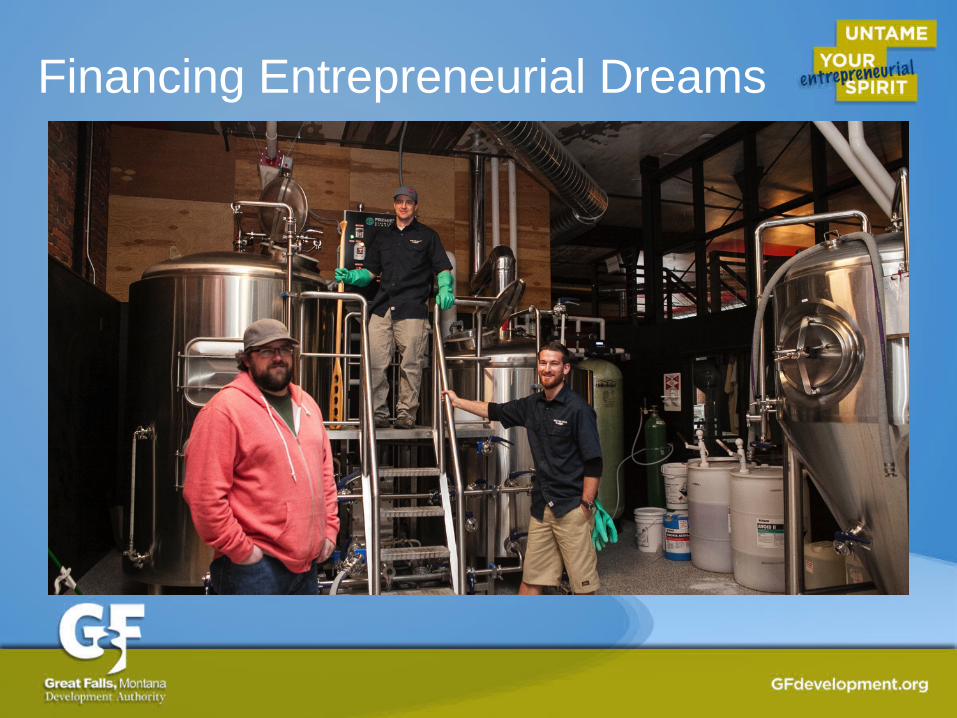
Financing Entrepreneurial Dreams

Supporting & Celebrating Entrepreneurs

Helping Local Companies Grow

Helping Lots of Companies to Grow
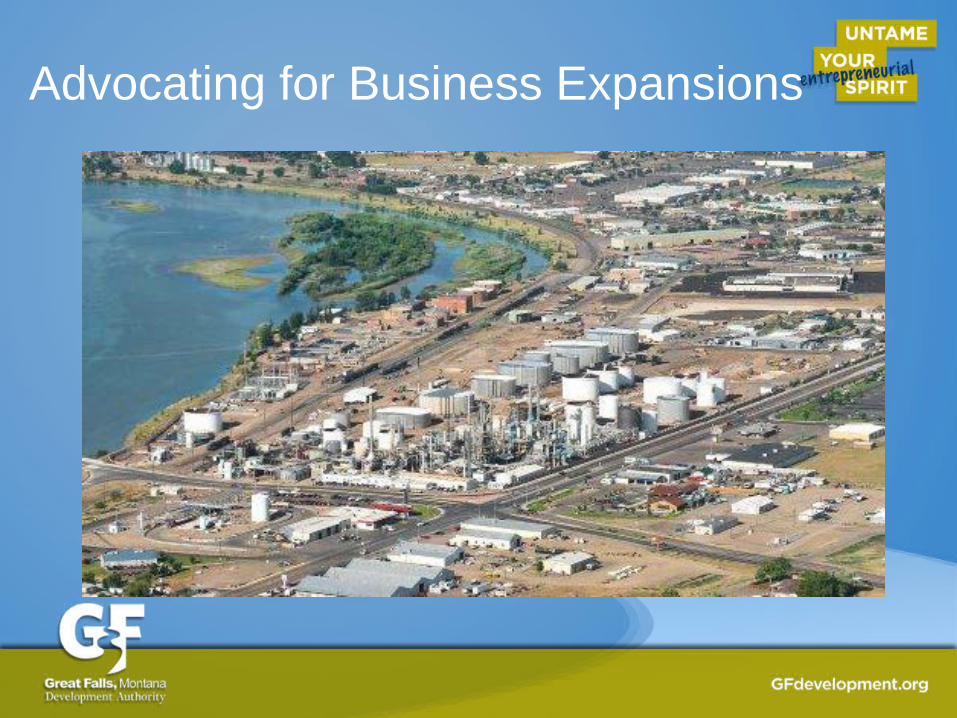
Advocating for Business Expansions
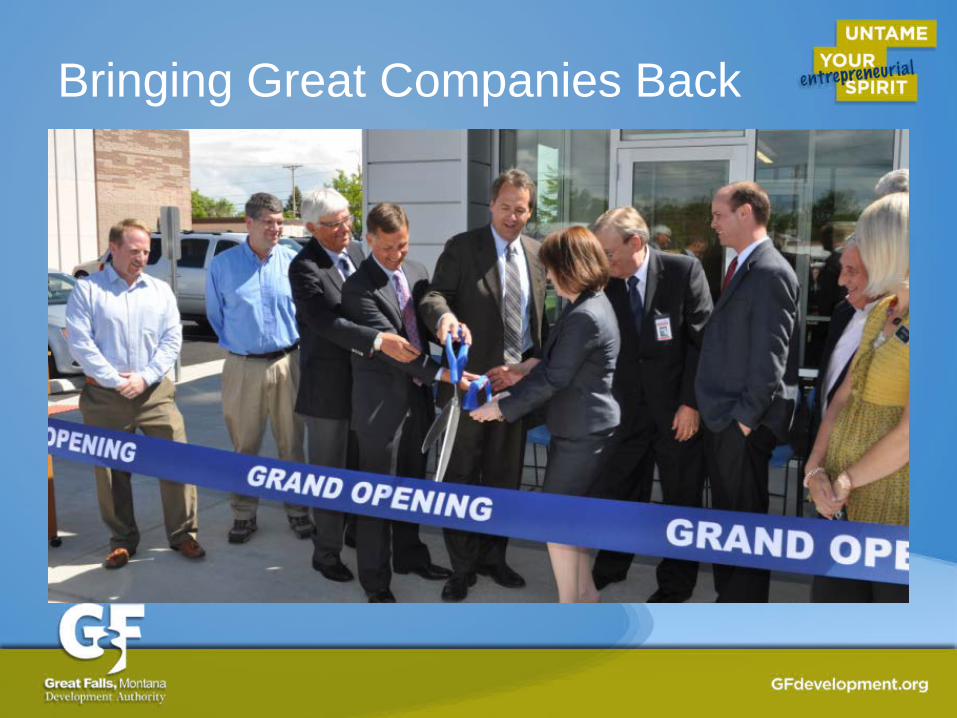
Bringing Great Companies Back

Attracting World-Class Companies

Helping Create Workforce Education & Training Programs

Financing Rural Health Care
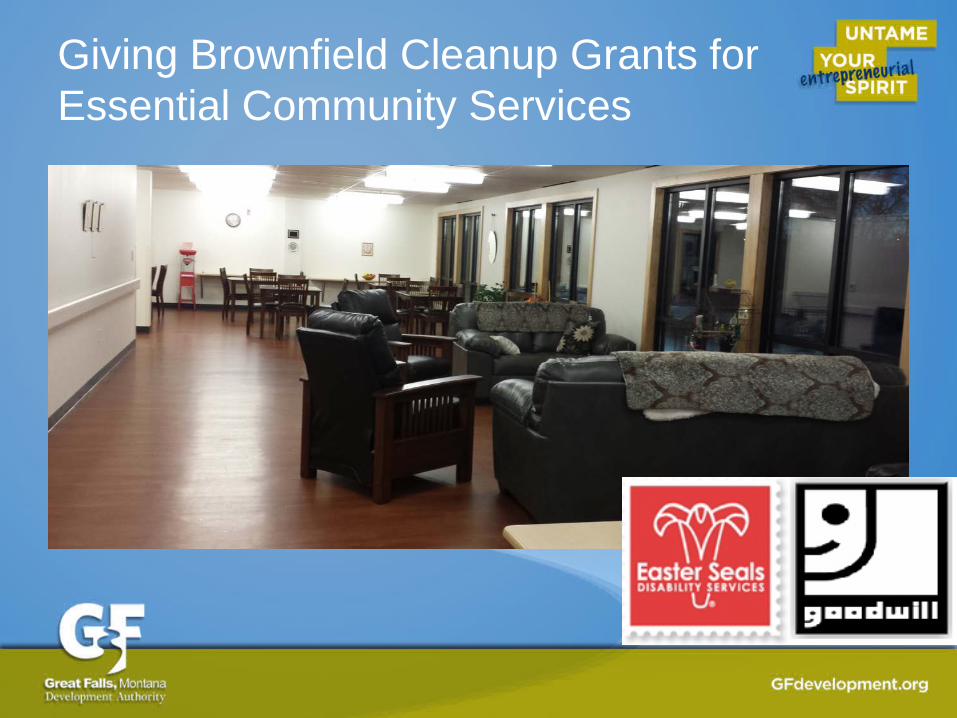
Giving Brownfield Cleanup Grants for Essential Community Services

Financing Housing Development

Talus Apartments
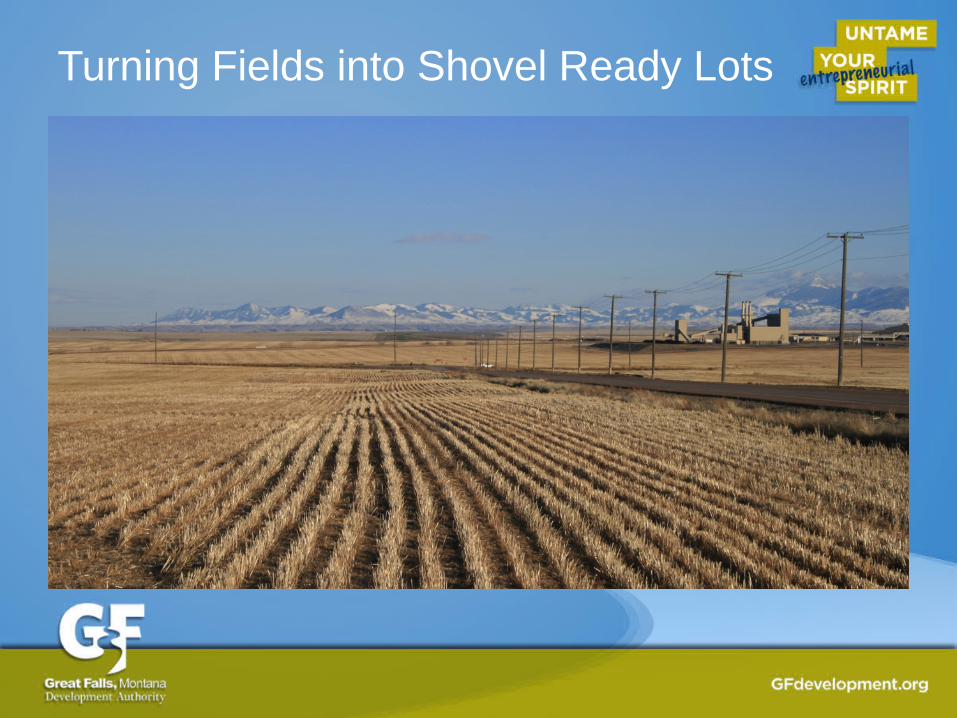
Turning Fields into Shovel Ready Lots

Turning Location
to Advantage
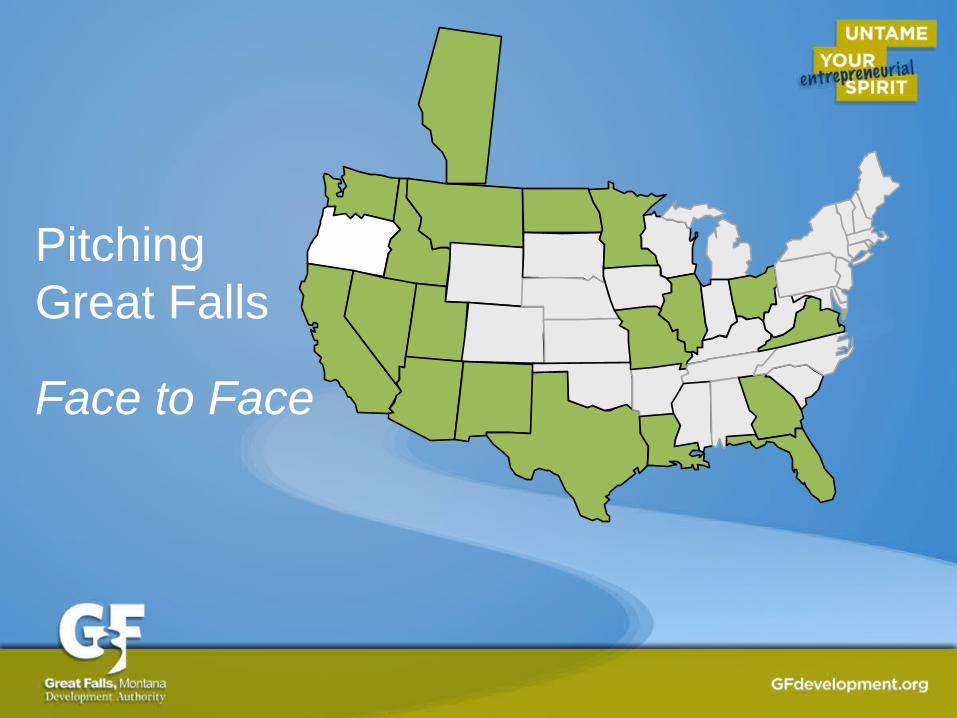
Pitching Great Falls
Face to Face

Team Great Falls
Leading & Supporting Teams
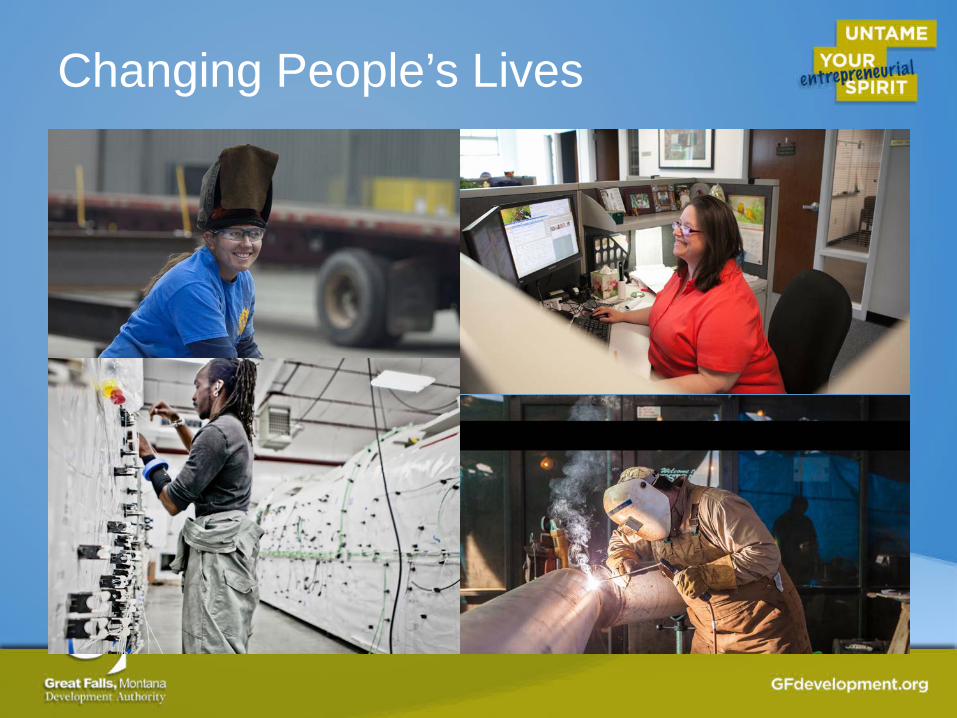
Changing People’s Lives

TEAM GREAT FALLS IS BEATING
EXPECTATIONS!

April 2012
Moody’s forecasted GF metro would lose 1,000 Jobs
in 3 year period 2011-2014
Instead, We Gained 2,128 Jobs

GF Metro Employment Growth
-500
-
500
1,000
1,500
2,000
2,500
1980's & '90's Last 36 Months
-70
2,128

December Employment Stats » December unemployment rate 3.7%
» Labor Force Growth 1 year 257 people 0.6% 3 year 1,458 people 3.7% 1.2% annual 10 year 3,068 people 8.0% 0.8% annual
» Employment Growth 1 year 662 people 1.7% 3 year 2,128 people 5.6% 1.9% annual 10 year 2,905 people 7.9% 0.8% annual
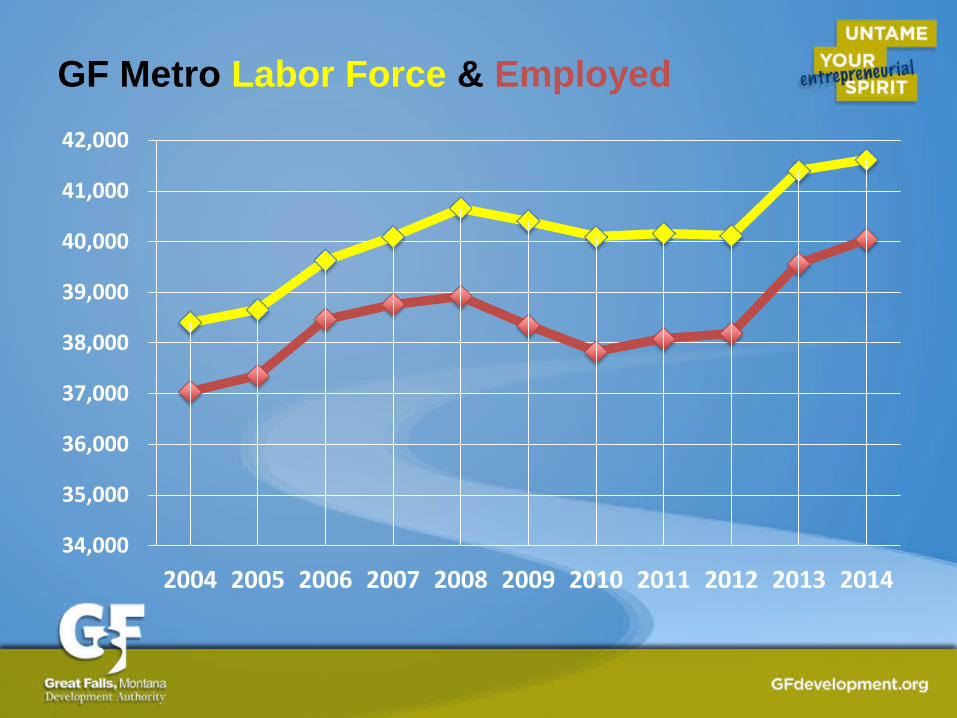
GF Metro Labor Force & Employed
34,000
35,000
36,000
37,000
38,000
39,000
40,000
41,000
42,000
2004 2005 2006 2007 2008 2009 2010 2011 2012 2013 2014
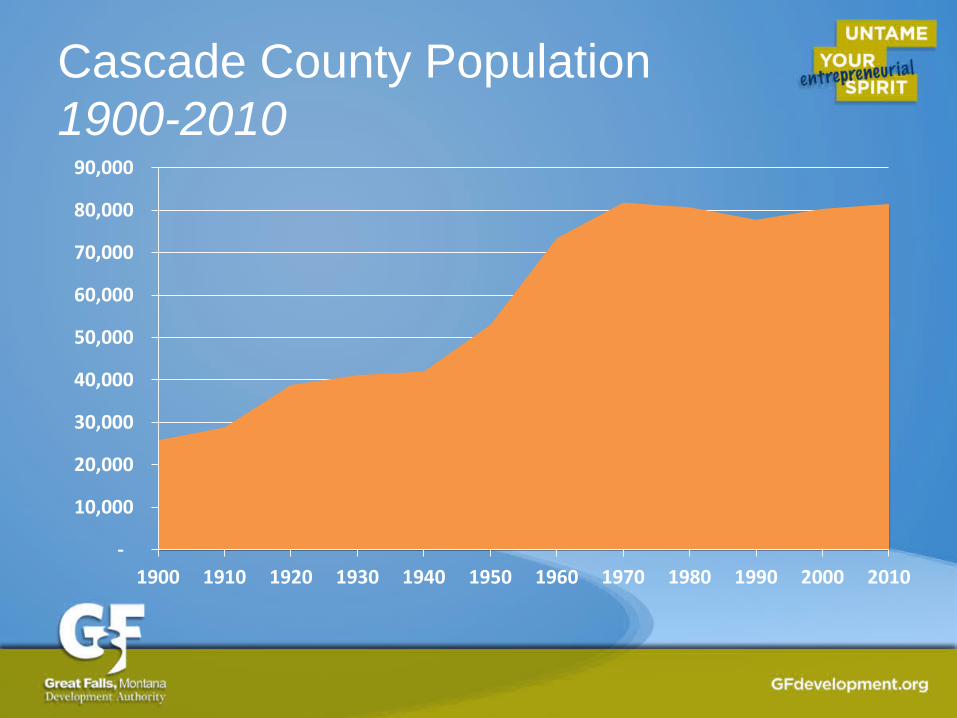
Cascade County Population 1900-2010
-
10,000
20,000
30,000
40,000
50,000
60,000
70,000
80,000
90,000
1900 1910 1920 1930 1940 1950 1960 1970 1980 1990 2000 2010
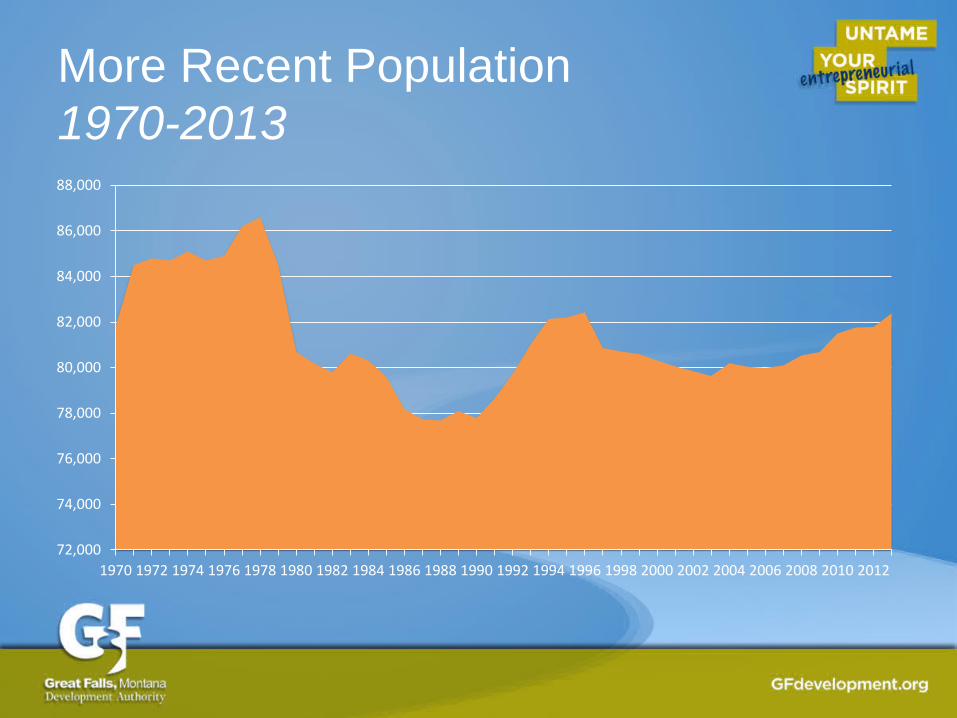
More Recent Population 1970-2013
72,000
74,000
76,000
78,000
80,000
82,000
84,000
86,000
88,000
1970 1972 1974 1976 1978 1980 1982 1984 1986 1988 1990 1992 1994 1996 1998 2000 2002 2004 2006 2008 2010 2012
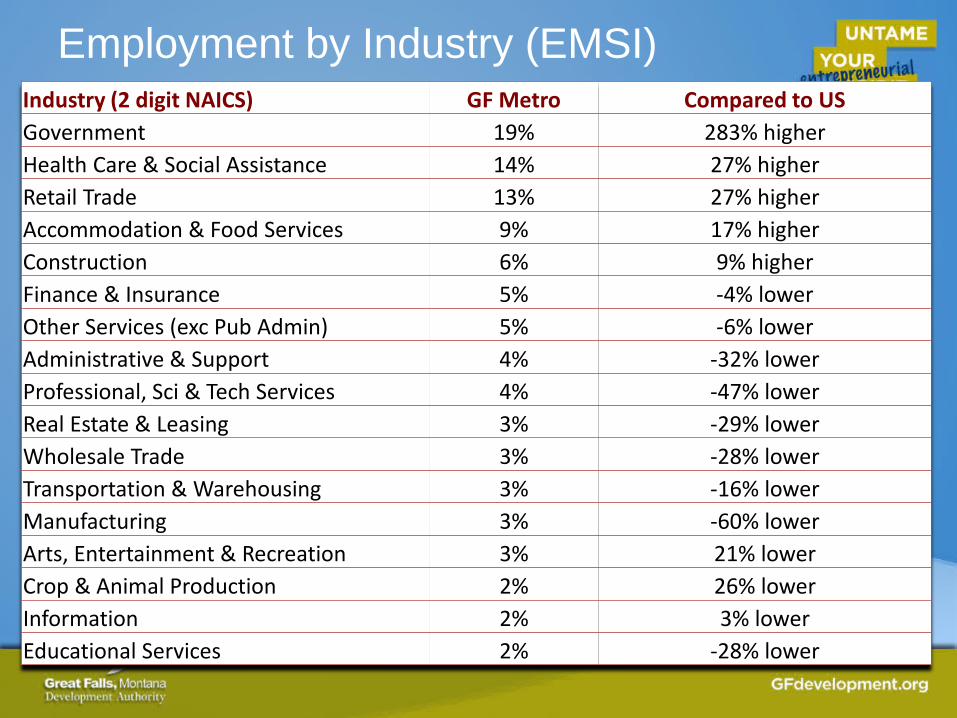
Employment by Industry (EMSI) Industry (2 digit NAICS) GF Metro Compared to US Government 19% 283% higher Health Care & Social Assistance 14% 27% higher Retail Trade 13% 27% higher Accommodation & Food Services 9% 17% higher Construction 6% 9% higher Finance & Insurance 5% -4% lower Other Services (exc Pub Admin) 5% -6% lower Administrative & Support 4% -32% lower Professional, Sci & Tech Services 4% -47% lower Real Estate & Leasing 3% -29% lower Wholesale Trade 3% -28% lower Transportation & Warehousing 3% -16% lower Manufacturing 3% -60% lower Arts, Entertainment & Recreation 3% 21% lower Crop & Animal Production 2% 26% lower Information 2% 3% lower Educational Services 2% -28% lower
Manufacturing Job Growth
19.7% in last 2 years

10 Year Employment Change 2004-14 Industry (2 digit NAICs) GF Metro US Administrative & Support 43% 16% Educational Services 40% 27% Manufacturing 27% -13% Health Care & Social Assistance 19% 28% Real Estate & Leasing 13% 35% Transportation & Warehousing 9% 14% Accommodation & Food Services 8% 20% Information 7% -8% Other Services (exc Pub Admin) 6% 11% Crop & Animal Production 3% 2% Retail Trade 3% 3% Government 0% 1% Arts, Entertainment & Recreation -2% 25% Wholesale Trade -4% 6% Construction -5% -10% Finance & Insurance -5% 32% Professional, Scientific & Technical Services -9% 20%
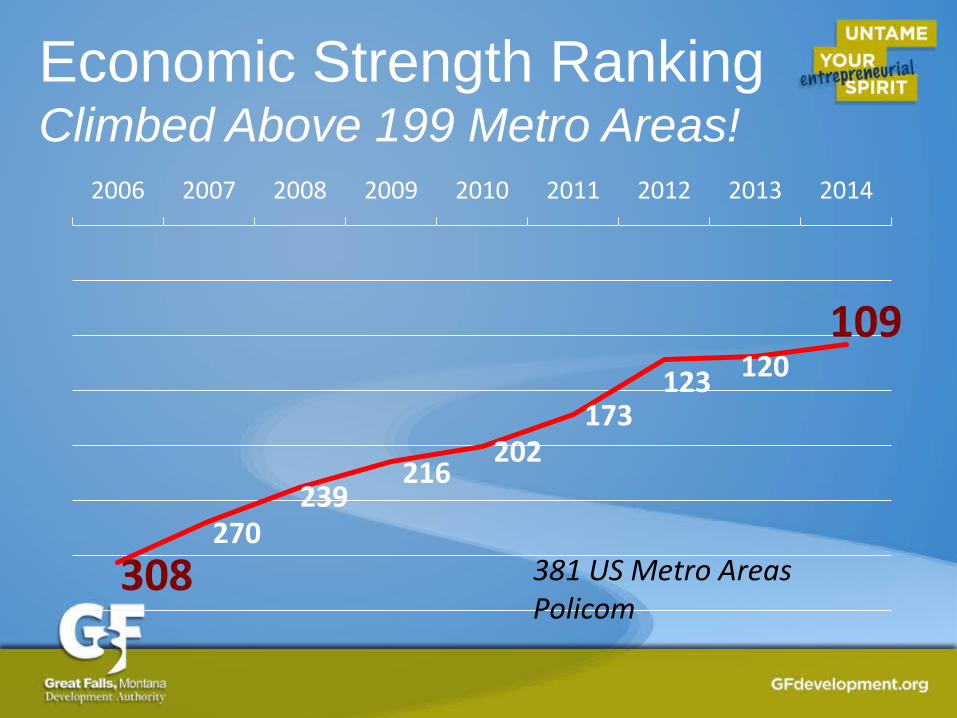
Economic Strength Ranking Climbed Above 199 Metro Areas!
308 270
239 216
202 173
123 120 109
2006 2007 2008 2009 2010 2011 2012 2013 2014
381 US Metro Areas Policom
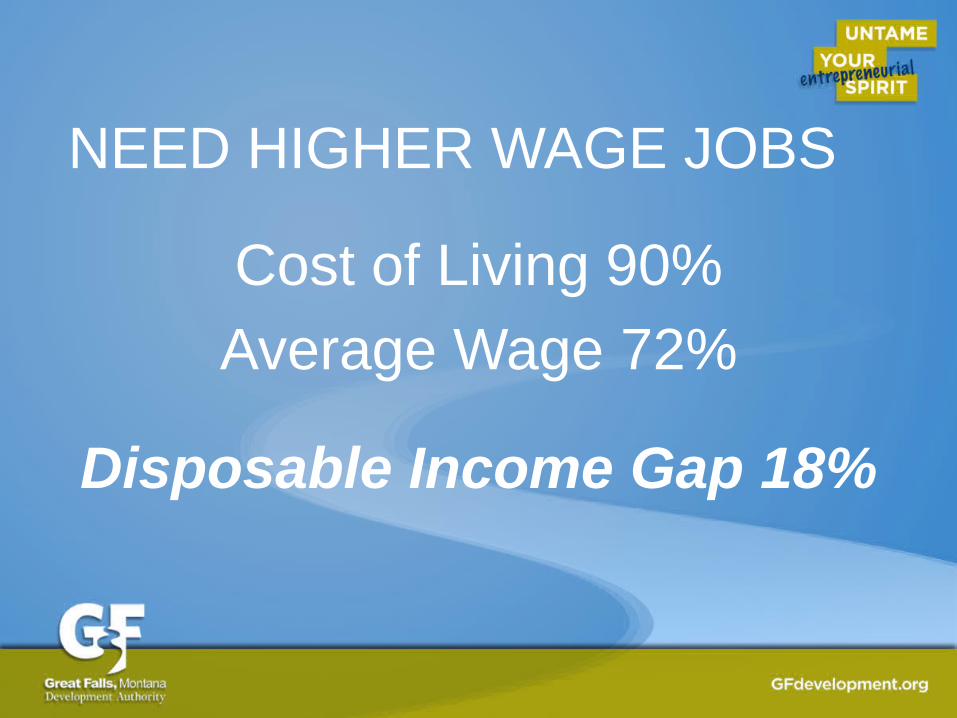
NEED HIGHER WAGE JOBS
Cost of Living 90% Average Wage 72%
Disposable Income Gap 18%
Forward Great Falls
A Team Effort!
Join the Team that’s Creating the Future
of Great Falls
Sign up for GFDA Top10
Spread the Word
Recruit Talent
Invest in Forward Great Falls