From Double Diversification to Growth
23
For Comparative Economic Studies 16 December 2016. From Double Diversification to Growth Thorvaldur Gylfason * Abstract The paper discusses economic and political diversification as two sides of the same coin, presenting them as parallel potential determinants of long-run economic growth. Three different measures of economic diversification are discussed: the Finger-Kreinin index of export diversification, the Herfindahl-Hirschman index of market concentration, and the Theil index of export diversification. Three measures of political diversification are also discussed: indices of political liberties and civil rights as well as the Polity2 index of democracy. All six measures of diversification are shown to vary directly with one another as well as with per capita incomes across a large sample of countries. * University of Iceland and CESifo, University of Munich. The paper is derived from the author’s presentation at the 22nd Dubrovnik Economic Conference hosted by the Croatian National Bank in Dubrovnik 13-14 June 2016. The author is indebted to his discussant at the conference, Sanja Madžarević–Šujster, as well as other conference participants for helpful suggestions.
Transcript of From Double Diversification to Growth
For Comparative Economic Studies 16 December 2016.
From Double Diversification to Growth
Thorvaldur Gylfason*
Abstract
The paper discusses economic and political diversification as two sides of the same coin,
presenting them as parallel potential determinants of long-run economic growth. Three
different measures of economic diversification are discussed: the Finger-Kreinin index
of export diversification, the Herfindahl-Hirschman index of market concentration, and
the Theil index of export diversification. Three measures of political diversification are
also discussed: indices of political liberties and civil rights as well as the Polity2 index of
democracy. All six measures of diversification are shown to vary directly with one
another as well as with per capita incomes across a large sample of countries.
*University of Iceland and CESifo, University of Munich. The paper is derived from the author’s presentation at the 22nd Dubrovnik Economic Conference hosted by the Croatian National Bank in Dubrovnik 13-14 June 2016. The author is indebted to his discussant at the conference, Sanja Madžarević–Šujster, as well as other conference participants for helpful suggestions.

2
μέτρον ἄριστον
(Metron Ariston, Moderation is best)
Ancient Greek poet
1. Introduction
Economic diversification, like moderation, is generally considered desirable in and of
itself as well as on account of its beneficial effects on economic performance. Thus,
economic diversification away from excessive dependence on a single dominant sector
or a few typically natural-resource-based commodities, including change toward
increased complexity and increased quality of national economic output, is of value
because it reduces the risks and vulnerabilities associated with a narrow economic
base, and enhances the ability of a nation to produce high-quality items that other
nations wish to buy. Well-diversified economies tend to be more efficient as well as
more open to trade, and hence to have a greater capacity for rapid economic growth
over the long haul as suggested by cross-country growth regression studies1 as well as
by individual case studies.2
The beneficial effects of economic diversification on growth can be viewed through
the widely observed inverse relationship across as well as within countries between
heavy dependence on a few natural resources and long-run economic growth,
sometimes referred to as the ‘resource curse’.3 Brenton et al. (2009), Cadot et al. (2011),
and Lederman and Maloney (2012) provide overviews of the recent analytical and
empirical literature on economic diversification and growth.
Excessive dependence on natural resources, especially oil and minerals, has also
been identified as a source of other problems, including deindustrialization,
macroeconomic imbalances,4 civil strife, and political oppression.5
Natural resource management policies aiming at economic diversification and
avoidance of risk are rooted in the need to manage common property resources so as to
forestall the ´tragedy of the commons´ – i.e., the danger of overuse and pollution,
including global warming, due to unregulated economic interests. Without proper
1 See, e.g., Al-Marhubi (2000), Lederman and Maloney (2007), Hesse (2008), and Agosin (2009). 2 See, e.g., Herzer and Nowak-Lehnmann (2006) on Chile and Zafar (2011) on Mauritius. 3 See Matsuyama (1992), Auty (2002), Sachs and Warner (1995), Humphreys et al. (2007), and Van der Ploeg (2011). 4 See Ghosh and Ostry (1994). 5 See Dunning (2005), Humphreys (2005), Collier (2011), and Ramsay (2011).
3
incentive structures in place, private parties or public entities or even entire nations
may on selfish grounds have an interest in despoiling natural resources – say, fish
species in international waters or fresh air. It takes government action and international
agreements to put in place incentive structures that align private interests with the
public interest and with the interests of the world community. For this reason,
economic diversification policies may prove to be intertwined with efficient and
egalitarian responses to the overexploitation of common-property natural resources.
Along these lines, the recent call by the heads of the IMF and the World Bank for carbon
pricing to mitigate climate change6 echoes the arguments long advanced by economists
for market-based solutions for cleaning up the environment7 and managing natural
resources.8
Like economic diversification, political diversification – that is, the fortification of
democracy in the political arena – is generally also considered desirable in itself even if
its beneficial effects on economic outcomes remain the subject of controversy. By
political diversification is meant the democratization of political processes aiming to
reduce the risks and vulnerabilities associated with excessive dependence on a narrow
political base. Political diversification can be gainfully viewed as the twin sister of
economic diversification,9 providing corresponding benefits. In this paper, accordingly,
economic and political diversification are viewed side by side as potential determinants
of sustained economic growth.
The paper is organized as follows. Section 2 presents three different measures of
economic diversification, showing them to be closely correlated with one another across
countries and reporting that they are also closely correlated with other diversification
measures discussed elsewhere. Section 3 shows the current purchasing power of per
capita Gross National Income (GNI) to be significantly correlated across countries with
each of the three measures of economic diversification from Section 2. Section 4
presents three different measures of political diversification, again showing them to be
closely correlated with one another across countries as well as with the three economic
diversification indices from Sections 2 and 3. Section 5 shows the current purchasing
6 See Lagarde and Yong Kim (2015). 7 See, e.g., Bergstrom (1982), Blinder (1987, Ch. 5), Mankiw (2009), and Van der Ploeg (2014). 8 See, e.g., Wijkman (1976), Gylfason (1992), Matthíasson (2001), Gylfason and Weitzman (2003), Stern (2006, 2015), Metcalf (2007), and Mankiw (2009). 9 See Gylfason and Wijkman (2016); see also Cuberes and Jerzmanovsky (2009).

4
power of per capita GNI to be significantly correlated across countries with each of the
three measures of political diversification from Section 4. Section 6 concludes the
discussion, emphasizing how economic and political diversification can be seen as two
sides of the same coin and as parallel potential drivers of long-run economic growth.
2. Measures of economic diversification
There are several different ways to gauge economic diversification. Two common
measures are the Finger-Kreinin index of export diversification10 and the Herfindahl-
Hirschman index of market concentration, both published by UNCTAD.
First, the Finger-Kreinin index (FKI) of export diversification compares the structure
of exports across countries. The FKI is a relative index showing the extent to which the
structure of exports by product of a given country differs from the world average. The
index ranges from 1 (no diversification) to 0 (full diversification), with values closer to 1
indicating a larger deviation from the world average and hence a relatively less
diversified export structure. The index covers only merchandise exports, i.e., exports of
goods, not services. As a country’s exports become less diversified compared with the
rest of the world, the value of FKI increases toward 1. In Figure 1A, FKI is shown on the
horizontal axis by its inverse, 100*(1 – FKI), to have an index that reaches from 0 (no
diversification) to 100 (full diversification).
In second place, the Herfindahl-Hirschman index (HHI) of market concentration,
ranging from 1 (extreme concentration) to 0 (no concentration), is a country-specific
index, unrelated to market concentration in other countries. The HHI is computed as the
sum of the squares of the shares of each sector of production in total output (or
sometimes as the square root of the sum of squares). Like FKI, HHI covers only
merchandise exports. As a country´s markets become more concentrated – i.e., less
dispersed or less diversified – the value of HHI rises toward 1. While a lower FKI means
more export diversification, a lower HHI means less market concentration, i.e., more
market dispersion, which is not quite the same thing as more diversification. Because
FKI is a relative index while HHI is country-specific, it is possible for the two indices to
move in opposite directions in a given country at a given time. For example, a country
may move toward more dispersion according to HHI while at the same time moving
10 See Finger and Kreinin (1979).

5
toward less diversification according to FKI if other countries are diversifying their
exports at a more rapid pace than the country in question. Even so, FKI and HHI are
quite closely correlated across countries as can be seen in Figure 1A where HHI is
represented on the vertical axis by its inverse, 100*(1 – HHI), to have an index that
reaches from 0 (extreme concentration) to 100 (no concentration). In Figure 1A, a
movement from southwest to northeast represents a movement toward diversification,
away from concentration.
Thirdly, the IMF has developed a new measure of export diversification, again not
including services (Figs. 1B and 1C). The IMF´s export diversification index (EDI) is
based on the Theil index, a common measure of inequality, segregation, and other forms
of diversity. The Theil index – unlike, e.g., the Gini index of inequality – reflects diversity
within as well as among sectors and groups. Specifically, the Theil index equals the sum
of measures of diversity across sectors (vertical diversity or extensive margin, meaning
new export products or new export destinations) and diversity within sectors
(horizontal diversity or intensive margin, meaning a larger volume of exports of old
products). The more diversified a country´s exports, the lower is EDI which spans the
range from 0 to 8. In Figures 1B and 1C, EDI is represented on the vertical axes by
8 - EDI to have as before an inverted index that reaches from 0 (no diversification) to 8
(full diversification). Figure 1 shows that the three measures of economic
diversification, FKI, HHI, and EDI, are all closely correlated.
Export diversification is generally considered desirable apart from considerations of
risk because, among other things, it helps promote the emergence of high-quality
exports. The basic idea here is that in addition to what and how much a country exports
it also matters to whom the exports are sold. Thus, geographic diversification is
desirable in addition to economic diversification in that selling the same product to
several different customers spreads risk in a similar way as selling several different
products to the same customer. This can be seen as a variation on a familiar theme from
economic growth theory: Good neighbors are good for a country´s long-run growth.11
Along these lines, the IMF has recently also produced yet another index, intended to
measure the average quality demanded in an exporter´s current destination markets for
a product based on destinations that demand a high quality of that product on average
11 See Ades and Chua (1997).

6
in their imports.12 The product quality index (not shown here), derived from elaborate
modeling,13 has been shown to be closely correlated with the three diversification
indices in Figure 1.14
Because they cover only goods and not services, the UNCTAD and IMF measures in
Figure 1 tell only a part of the story of economic diversification. This matters because
the economic diversification strategies of many countries focus increasingly on
branching out into services, the world’s largest economic sector by far measured either
in terms of manpower or output. The argument that diversification reduces risk applies
with equal force to services and to tangible goods. Further, the expansion of services can
be a strong catalyst of goods exports, directly as well as indirectly through spillover
effects.15 Disaggregated statistics on services, enabling statisticians to measure the
diversification, concentration, and quality of services, remain to be compiled and
analyzed. Economists at the IMF are presently in the process of putting together an
international data base on services to expedite a balanced coverage of goods and
services exports in studies of economic diversification.
To highlight the role of manufactures and services, their shares in merchandise
exports from the World Bank´s World Development Indicators (not shown here) are
sometimes used as indicators of export diversification. The reason is that, as a rule,
economic diversification involves the transfer of labor and other resources from
agriculture first to manufacturing and then to services. The rising weight of first
manufactures and industry, a broader category including construction, and then of
services in economic activity correspondingly reduces the share of agriculture and
other primary production in national output, a near-universal trend that in large
measure reflects technological progress enabling a steadily declining part of the labor
force to produce enough food. The development of manufacturing (secondary output)
and services (tertiary output), which can sometimes be hard to distinguish in practice,
tends to go along with increased sophistication and complexity of production, including
production for export, making it possible to use the share of manufactures and services
(i.e., of secondary and tertiary output) in total output as a rough proxy for economic
12 See Henn et al. (2013). 13 See IMF (2014). 14 See Gylfason (2017). 15 See Cattaneo (2009).

7
complexity. Elsewhere the share of manufactures in merchandise exports has been
shown to be closely correlated with the Finger-Kreinin index.16
There is yet another way of looking at export diversification, through the Economic
Complexity Index (ECI) developed by Hidalgo and Hausmann (2009). The ECI ranks
countries by the diversity and complexity of their export structure. The least complex
products are raw materials and simple farm products, whereas the most complex
products are sophisticated chemicals and machinery. Countries that produce complex
goods as well as a large number of products are typically more economically developed
or likely to experience more rapid economic growth than are countries producing fewer
and less complex products.17 On this basis, ECI can be used as an indicator of a country´s
state of economic development. The consideration of economic complexity adds a
potentially useful dimension to the analysis of economic diversification. The ECI (not
shown here) has been shown to be closely correlated with the three diversification
indices in Figure 1.18
3. From economic diversification to growth
Let us now look at the relationship between economic diversification as measured in
Section 2 and long-run economic growth across countries to see if the three indices of
economic diversification are correlated with economic growth across countries. Growth
is here measured simply by the latest available level of the purchasing power of per
capita GNI on the grounds that a country´s income today (i.e., in 2014) reflects its
economic growth performance in the past. Figures 2A and 2B show a significantly
positive cross-country correlation between the average values of the Finger-Kreinin
index (Fig. 2A) and the Herfindahl-Hirschman index (Fig. 2B) on the one hand and the
natural log of current (or rather, recent) per capita GNI on the other in the 178
countries for which data are available, not including six GCC countries19 that are
characterized by high per capita incomes and low diversification. Figure 2A suggests
that an increase in FKI by 10 points, spanning a bit less than one sixth of the range of the
variable from 10 to 75, goes along with an increase in per capita GNI by 46%. Similarly,
16 See Gylfason and Wijkman (2016). 17 See Hummels and Klenow (2005) and Hausmann and Rodrik (2007). 18 See Gylfason (2017). 19 The six countries are Bahrain, Kuwait, Oman, Qatar, Saudi Arabia, and United Arab Emirates.

8
Figure 2B suggests that an increase in HHI by 20 points from one country to another,
covering nearly a fourth of the range from 5 to 95, goes along with an increase in per
capita GNI by 45%, virtually the same result. In this case, however, the correlation is
weaker than before but, because the sample is so large, it is still significant in a
statistical sense as well as in an economic sense.20
Figure 2C also shows a significantly positive cross-country correlation between the
average values of the Theil index and the natural log of per capita GNI in the 165
countries for which data are available, again not including six GCC countries. If Figure
2C is taken to suggest that diversification is a determinant of growth rather than the
other way round and if the slope of the regression line, 0.57, is taken at face value, the
regression coefficient suggests that an increase in diversification by one point, spanning
a fifth of the scale observed across countries from 2 to 7, would in the average country
go along with an increase in per capita GNI by 57%, a similar result as before.
Thus, in all three panels of Figure 2, the pattern is the same: Per capita incomes and
diversification in three different guises go hand in hand from southwest to northeast.
This is what economic theory suggests: Diversified economic activity and diversified
exports reduce risk, promote stability, and strengthen the foundation of economic
growth over time. Similar cross-country patterns of per capita GNI and the IMF´s
Product Quality Index and the Hidalgo-Hausmann Economic Complexity Index are
reported elsewhere.21
These results suggest that, as a rule, economic diversification is not only desirable in
its own right but also because it may be an independent catalyst of economic growth.
Digging deeper into the data by panel estimation methods to see if the significance of
the cross-sectional patterns reported here is preserved within as well as across
countries – i.e., across time as well as space – ought perhaps to await the anticipated
availability of disaggregated trade data covering services as well as products. It would
also be of interest to see if indices of geographic diversification of trade are correlated
with economic growth across countries which may or may not be the case in view of
gravity models that suggest that countries generally prefer trade with their neighbors to
trade with more distant countries.22
20 The t-statistic associated with the slope coefficient in Fig. 2B is 5.6. 21 See Gylfason (2017). 22 See Anderson (2011).

9
Bivariate correlations such as those shown in Figure 2 do not generally allow us to
make any valid inferences about cause and effect. Economic theory suggests that while
economic diversification can be good for growth, economic growth is probably also
conducive to diversification.23 However, Figure 2 has current per capita GNI on the
vertical axes and past averages of different diversification indices on the horizontal
axes, suggesting that the direction of causation must in this context run from
diversification to growth because per capita GNI in 2014 cannot possibly have had a
retroactive influence on diversification.
Further, Figure 2 does not seem to support the hypothesis of a U-shaped relationship
reported in several studies to suggest that diversification, while prevalent in many low-
income countries, tends to slow down or reverse course at higher levels of income as
new opportunities for specialization arise at a per capita income threshold of about USD
9,000.24 If that were the case, we should expect to see nonlinear patterns in Figure 2, but
we do not. Whether economic diversification and growth tend to go hand in hand only
up to a certain mid-range level of per capita GNI or the relationship persists at high
levels of income, available empirical evidence, including Figure 2, serves as a warning
against excessive specialization, especially in early stages of economic development.
4. Measures of political diversification
There are several different ways to gauge political diversification. Two common
measures are the Political Rights Index (PRI) and Civil Liberties Index (CLI) compiled by
Freedom House since 1972, now covering 205 countries. Each country score is based on
two numerical ratings – each from 1 to 7 – for political rights and civil liberties, with 1
representing the most free and 7 the least free. Countries scoring from 1 to 2.5 are
classified as Free, those scoring from 3 to 5 are classified as Partly Free, and those
scoring from 5.5 to 7 are classified as Not Free. About 50 countries remain Not Free.
Since 1972, civil liberties and political rights have advanced on average from 4.2 to 3.3
(CLI) and from 4.5 to 3.3 (PRI), a quantitatively significant improvement on a scale from
7 to 1.25 Even so, the consistent improvement ceased after 2000. While the number of
countries classified by Freedom House as Free doubled from 44 in 1972 to 89 in 2014,
23 See Brenton et al. (2009) and Cadot et al. (2011). 24 See, e.g., Imbs and Wacziarg (2003), Klinger and Lederman (2004), and Cadot et al. (2011). 25 See Gylfason and Wijkman (2016).

10
that number has been stagnant since 2002. Several countries have become more
democratic, true, but others have slid in the other direction, including Bangladesh,
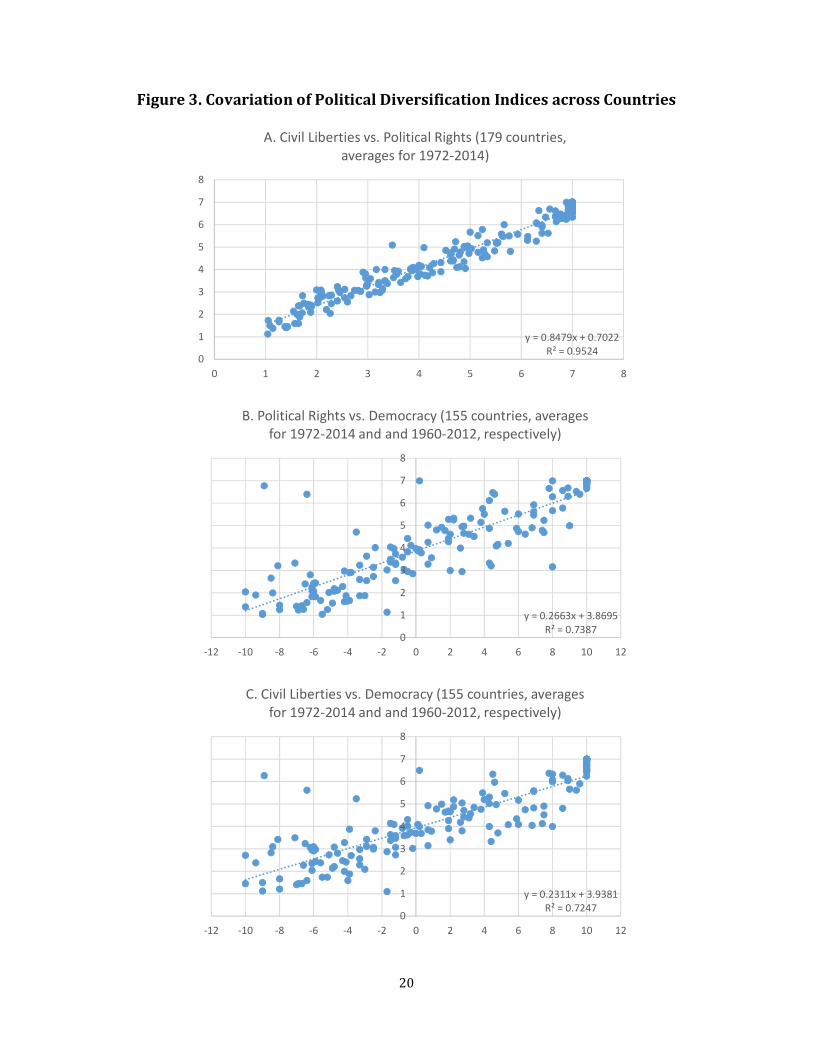
Kenya, Russia, Thailand, and Turkey.26 Figure 3A shows that PRI and CLI are strongly
correlated across countries.
Our third measure of democracy here is the Polity IV Project’s Polity2 variable
designed to reflect the characteristics of democratic and autocratic authority in
governing institutions rather than discrete and mutually exclusive forms of
governance.27 The Polity2 variable (DEM) ranges from fully institutionalized
autocracies through mixed authority regimes to fully institutionalized democracies on a
20-point scale ranging from -10 (hereditary monarchy) to 10 (consolidated
democracy). Countries are classified as democratic if their Polity2 score is larger than or
equal to 6, as neither democratic nor autocratic (“anocracies”) if the score lies from 5 to
-5, and as autocratic if their score is smaller than or equal to -6.
Figure 3 shows that the three measures of economic diversification, PRI, CLI, and
DEM, are all closely correlated. What is more, the three political diversification indices
are also closely correlated with the economic diversification indices from Section 2.
Rather than show all nine permutations, Figure 4 shows three correlations: HHI vs. CLI
(Fig. 4A), FKI vs. PRI (Fig. 4B), and EDI vs. DEM (Fig. 4C). The pattern is the same
throughout: The three measure of political diversification go hand in hand from
southwest to northeast.
5. From political diversification to growth
Next, we look at the relationship between the different measures of political
diversification from Section 4 and long-run economic growth across countries to see if
the three indices of political diversification are correlated with economic growth,
measured as before by the latest available level of the purchasing power of per capita
GNI.
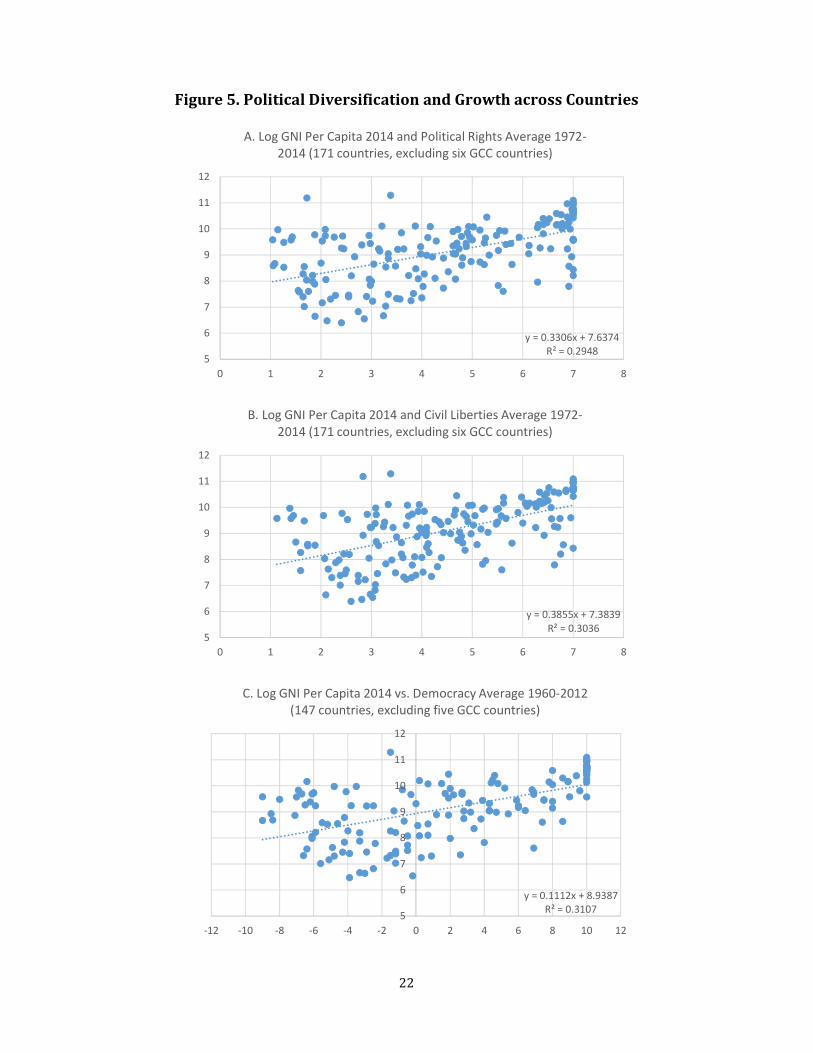
Figures 5A and 5B display a significantly positive cross-country correlation between
the average values of the inverted Political Rights Index (8 – PRI, Fig. 5A) and the
inverted Civil Liberties Index (8 – CLI, Fig. 5B) on the one hand and the natural log of
current per capita GNI on the other in the 171 countries for which data are available,
26 See Diamond (2015). 27 See Marshall and Jaggers (2005).
11
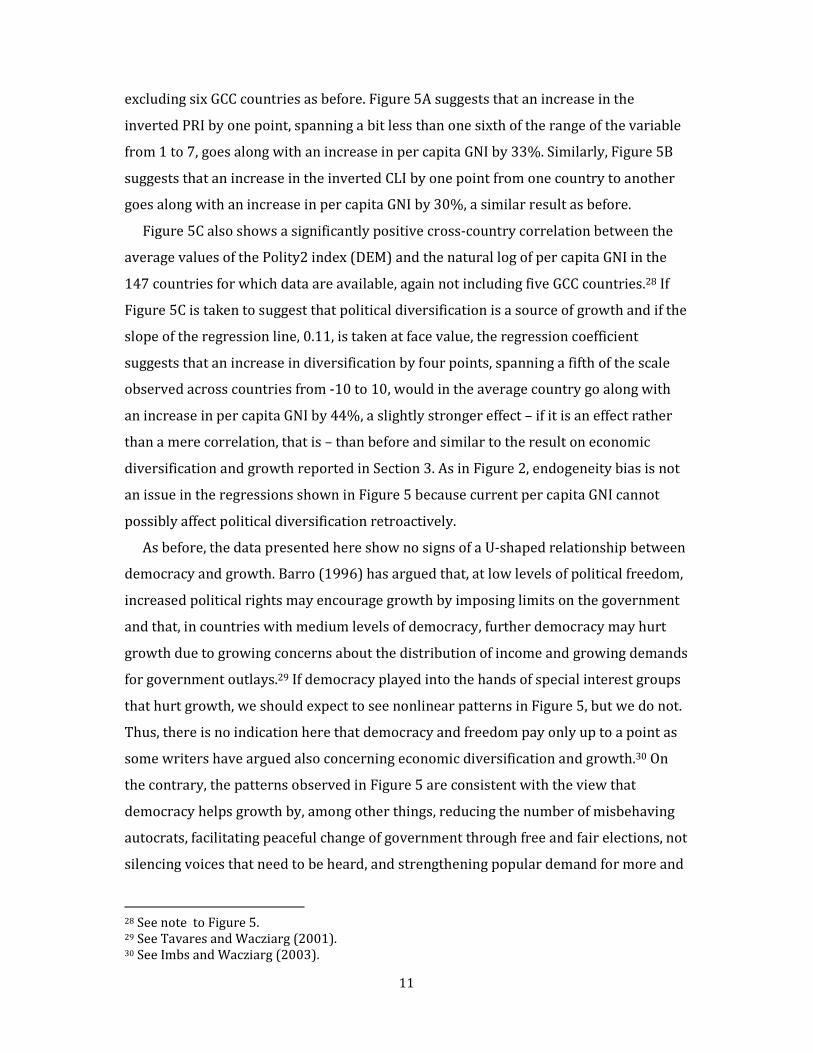
excluding six GCC countries as before. Figure 5A suggests that an increase in the
inverted PRI by one point, spanning a bit less than one sixth of the range of the variable
from 1 to 7, goes along with an increase in per capita GNI by 33%. Similarly, Figure 5B
suggests that an increase in the inverted CLI by one point from one country to another
goes along with an increase in per capita GNI by 30%, a similar result as before.
Figure 5C also shows a significantly positive cross-country correlation between the
average values of the Polity2 index (DEM) and the natural log of per capita GNI in the
147 countries for which data are available, again not including five GCC countries.28 If
Figure 5C is taken to suggest that political diversification is a source of growth and if the
slope of the regression line, 0.11, is taken at face value, the regression coefficient
suggests that an increase in diversification by four points, spanning a fifth of the scale
observed across countries from -10 to 10, would in the average country go along with
an increase in per capita GNI by 44%, a slightly stronger effect – if it is an effect rather
than a mere correlation, that is – than before and similar to the result on economic
diversification and growth reported in Section 3. As in Figure 2, endogeneity bias is not
an issue in the regressions shown in Figure 5 because current per capita GNI cannot
possibly affect political diversification retroactively.
As before, the data presented here show no signs of a U-shaped relationship between
democracy and growth. Barro (1996) has argued that, at low levels of political freedom,
increased political rights may encourage growth by imposing limits on the government
and that, in countries with medium levels of democracy, further democracy may hurt
growth due to growing concerns about the distribution of income and growing demands
for government outlays.29 If democracy played into the hands of special interest groups
that hurt growth, we should expect to see nonlinear patterns in Figure 5, but we do not.
Thus, there is no indication here that democracy and freedom pay only up to a point as
some writers have argued also concerning economic diversification and growth.30 On
the contrary, the patterns observed in Figure 5 are consistent with the view that
democracy helps growth by, among other things, reducing the number of misbehaving
autocrats, facilitating peaceful change of government through free and fair elections, not
silencing voices that need to be heard, and strengthening popular demand for more and
28 See note to Figure 5. 29 See Tavares and Wacziarg (2001). 30 See Imbs and Wacziarg (2003).

12
better education and institutions.31 After all, around the world, most rich countries are
democratic, and most dictatorships are poor.32
To sum up, in all three panels of Figure 5 the pattern observed is the same: Per capita
incomes and political diversification in three different guises go hand in hand from
southwest to northeast. Comparing the regression lines shown in Figure 2 and 5, we see
striking similarities because in all six cases an increase in economic or political
diversification by an amount that spans from a fourth to a sixth of the range of each
diversification index goes along with an increase in per capita GNI by 30% (Fig. 5B) to
57% (Fig. 2C). Due to the large sample sizes the correlations shown are all significant in
a statistical sense as well as in an economic sense. By any standard, an increase in per
capita GNI by 30% to 57% is a significant increase. The results seem to suggest that
both economic and political diversification, side by side, are good for growth.
6. Conclusion
The struggle for economic diversification, often against strong political resistance, can
be justified, inter alia, on the grounds of the observed cross-country relationship
between different measures of economic diversification and macroeconomic
performance. This relationship suggests that diversification is good for long-run growth.
One possible way to interpret the cross-country evidence is to view economic
diversification as an essential component of sensible risk management and hence also of
rapid and sustainable economic growth. Before we can reach that conclusion, however,
the data on economic diversification need to be extended from goods alone at present to
goods and services, work that is underway at the IMF. In principle, the diversification of
services should reduce exposure to macroeconomic risk in the same way as the
diversification of goods for export. The argument can be extended to capital flows.
The same argument can also be applied to political diversification through more and
better democracy. We have seen here how, in large cross-sectional samples of countries
from the 1960s to date, per capita GNI varies directly and significantly with political
diversification as well as with economic diversification in a simple empirical setting
where statistical endogeneity bias does not arise. Economic theory suggests that
diversification, whether economic or political, is good for growth but we also know that
31 See Glaeser et al. (2004) and Acemoglu et al. (2014). 32 See Hernández-Murillo and Martinek (2008).
13
sometimes there can be too much of a good thing. This is why specialization based on
comparative advantages is efficient up to a point. And this is why representative rather
than direct democracy is the general modus operandi in liberal democracies, with legal
checks and balances.

14
References
Acemoglu, D., S. Naidu, P. Restrepo, and J. A. Robinson (2014), “Democracy Does Cause
Growth,” NBER Working Paper No. 20004.
Ades, A., and H. B. Chua (1997). “The Neighbor´s Curse: Regional Instability and
Economic Growth,” Journal of Economic Growth 2, September, 279-304.
Agosin, M. R. (2009). “Export Diversification and Growth in Emerging Economies,”
CEPAL Review 97, 115-132.
Al-Marhubi, F. (2000). “Export Diversification and Growth: An Empirical Investigation,”
Applied Economics Letters 7, 559-562.
Anderson, J. E. (2011). “The Gravity Model,” Annual Review of Economics, Annual
Reviews 3(1), 133-160.
Auty, R. M. (2002). Sustaining Development in Mineral Economies: The Resource Curse
Thesis, Routledge, London.
Barro, Robert J. (1996). “Democracy and Growth,” Journal of Economic Growth 1 (1),
March, 1-27.
Bergstrom, T. C. (1982). “On Capturing Oil Rents with a National Excise Tax,” American
Economic Review 72(1), 194–201.
Blinder, A.S. (1987). Hard Heads, Soft Hearts: Tough-Minded Economics for a Just Society,
Addison-Wesley Publishing Company, Reading, Massachusetts.
Brenton, P., R. Newfarmer, W. Shaw, and P. Walkenhorst (2009). “Breaking Into New
Markets: Overview,” Ch. 1 in Newfarmer et al. (2009).
Cadot, O., C. Carrère, and V. Strauss-Kahn (2011). “Export Diversification: What's behind
the Hump?,” Review of Economics and Statistics 93(2), May, 590-605.
Cadot, O., C. Carrère, and V. Strauss-Kahn (2013). “Trade Diversification, Income, and
Growth: What Do We Know?” Journal of Economic Surveys 27(4), 790-812.
Cattaneo, O. (2009). “Tourism as a Strategy to Diversify Exports: Lessons from
Mauritius,” Ch. 10 in Newfarmer et al. (2009).
Collier, Paul (2011). The Plundered Planet: Why We Must – and How We Can – Manage
Nature for Global Prosperity, Oxford University Press, Oxford and New York.
Cuberes, D., and M. Jerzmanowski (2009). “Democracy, Diversification and Growth
Reversals,” Economic Journal 119 (540), October, 1270-1302.
Diamond, L. (2015). “Facing Up to the Democratic Recession,” Journal of Democracy 26
(7), 141-155.

15
Dunning, T. 2005. “Resource Dependence, Economic Performance, and Political
Stability,” Journal of Conflict Resolution 49 (4), August, 451-482.
Finger, J., and M. E. Kreinin (1979). “A Measure of 'Export Similarity' and Its Possible
Uses,” Economic Journal 89, Issue 356, 905-912.
Ghosh, A. R., and J. Ostry (1994). “Export Instability and the External Balance in
Developing Countries,” IMF Staff Papers 41, 214-235.
Glaeser, E. L., R. La Porta, F. Lopez-de-Silanes, and A. Shleifer (2004). “Do Institutions
Cause Growth?” Journal of Economic Growth 9 (3), September, 271-303.
Gylfason, T. (1992). “The Pros and Cons of Fishing Fees: The Case of Iceland” (also in
French, German, and Norwegian), EFTA Bulletin 3/4, European Free Trade
Association, Geneva.
Gylfason, T. (2017). “From Economic Diversification to Growth,” in a book edited by R.
Arezki and R. Boucekkine (forthcoming).
Gylfason, T., and M. L. Weitzman (2003). “Icelandic Fisheries Management: Fees vs.
Quotas,” CEPR Discussion Paper No. 3849, March.
Gylfason, T., and P. M. Wijkman (2016). “Double Diversification with an Application to
Iceland,” in Mahroum and Al-Saleh (2016).
Hausmann, R., J. Hwang, and D. Rodrik (2007). “What You Export Matters,” Journal of
Economic Growth 12, 1-25.
Henn, C., C. Papageorgiou, and N. Spatafora (2013). “Export Quality in Developing
Countries,” IMF Working Paper WP/13/108.
Hernandez-Murillo, R., and C. J. Martinek (2008), “Which came first-democracy or
growth?” The Regional Economist, April, 4-6.
Herzer, D., and F. Nowak-Lehmann D. (2006). “What Does Export Diversification Do for
Growth? An Econometric Analysis,” Applied Economics 38, 1825-1838.
Hesse, H. (2008). “Export Diversification and Economic Growth,” Working Paper No. 21,
Commission on Growth and Development, The World Bank, Washington, D.C.
Hidalgo, C. A., and R. Hausmann (2009). “The Building Blocks of Economic Complexity,”
in P. S. Dasgupta (ed.), Proceedings of the National Academy of Sciences of the United
States of America 106 (26), June 30, 10570-10575.
Hummels, D., and P. Klenow (2005). “The Variety and Quality of a Nation’s Exports,”
American Economic Review 95 (2), May, 704-723.

16
Humphreys, M. (2005). “Natural Resources, Conflict, and Conflict Resolution:
Uncovering the Mechanisms,” Journal of Conflict Resolution 49 (4), August, 508-537.
Humphreys, M., J. D. Sachs, and J. E. Stiglitz (eds.) (2007). Escaping the Resource Curse,
Columbia University Press, New York.
Imbs, J. M., and R. Wacziarg (2003). “Stages of Diversification,” American Economic
Review 93 (1), 63-86.
International Monetary Fund (2014). “The Diversification Toolkit: Export
Diversification and Quality Databases,” Spring.
Klinger, B., and D. Lederman (2004). ”Discovery and Development: An Empirical
Exploration of ‘New’ Products,” World Bank Policy Research Working Paper 3450,
Washington, D.C.
Lagarde, C., and Yong Kim, J. (2015). “The Path to Carbon Pricing,” Project Syndicate, 19
October.
Lederman, D., and W. F. Maloney (2007). “Trade Structure and Growth,” in Lederman,
D., and W. F. Maloney (eds.) (2007), Natural Resources, Neither Curse nor Destiny,
Stanford University Press and World Bank, Stanford and Washington, DC.
Lederman, D., and W. F. Maloney (2012). Does What You Export Matter? In Search of
Empirical Guidance for Industrial Policies, The World Bank, Washington, D.C.
Mahroum, S., and Al-Saleh, Y. (eds.) (2016). Economic Diversification Policies in Natural
Resource Rich Economies, Routledge, London and New York.
Mankiw, N. G. (2009). “Smart Taxes: An Open Invitation to Join the Pigou Club,” Eastern
Economic Journal 35, 14–23.
Marshall, M., and K. Jaggers (2005). “Polity IV Project: Dataset Users’ Manual. Center for
Global Policy,” George Mason University (www.cidcm.umd.edu/polity). Polity IV Data
Computer File, Version p4v2004, Center for International Development and Conflict
Management, University of Maryland, College Park, Maryland.
Matsuyama, K. (1992). “Agricultural Productivity, Comparative Advantage, and
Economic Growth,” Journal of Economic Theory 58, 317-334.
Matthíasson, T. (2001). “The Icelandic Debate on the Case for a Fishing Fee: A Non-
technical Introduction,” Marine Policy 25, 303-312.
Metcalf, G. E. (2007). “A Green Employment Tax Swap: Using a Carbon Tax to Finance
Payroll Tax Relief, Policy Brief,” Brookings Institution and the World Resources
Institute.

17
Newfarmer, R., W. Shaw, and P. Walkenhorst (eds.) (2009). Breaking into New Markets:
Emerging Lessons for Export Diversification, World Bank, Washington, D.C.
Ramsay, K. W. (2011). “Natural Disasters, the Price of Oil, and Democracy,” International
Organization 65, Summer, 507-529.
Sachs, J. D., and A. M. Warner (1995, revised 1997, 1999). “Natural Resource Abundance
and Economic Growth,” NBER Working Paper 5398, Cambridge, Massachusetts.
Stern, N. (2006). The Economics of Climate Change, Cambridge University Press,
Cambridge, England.
Stern, N. (2015). Why Are We Waiting? The Logic, Urgency, and Promise of Tackling
Climate Change, MIT Press, Cambridge, Massachusetts, and London, England.
Tavares, J., and R. Wacziarg (2001). “How Democracy Affects Growth,” European
Economic Review 45 (8), August, 1341-1378.
Van der Ploeg, F. (2011). “Natural Resources: Curse or Blessing?” Journal of Economic
Literature 49 (2), 366-420.
Van der Ploeg, F. (2014). “Untapped Fossil Fuel and the Green Paradox,” OxCarre
Working Papers 119, Oxford Centre for the Analysis of Resource Rich Economies,
Oxford University.
Wijkman, P. M. (1976). “Comments on the Exploitation of Common Property Natural
Resources,” Fjármálatíðindi 22 (2), Central Bank of Iceland.
World Bank, World Development Indicators, World Bank, Washington. D.C.
Zafar, Ali (2011). “Mauritius: An Economic Success Story,” Ch. 5 in P. Chuhan-Pole and
M. Angwafo (eds.), Yes Africa Can: Success Stories from a Dynamic Continent, World
Bank, Washington, D.C.

18
Figure 1. Covariation of Economic Diversification Indices across Countries
y = 1.0115x + 29.964
R² = 0.47080
20
40
60
80
100
120
0 10 20 30 40 50 60 70 80
A. Hirschman-Herfindahl vs. Finger-Kreinin (222 countries,
averages for 1995-2014)
y = 11.182x - 16.298
R² = 0.7470
10
20
30
40
50
60
70
80
0 1 2 3 4 5 6 7 8
B. Finger-Kreinin vs. Theil (164 countries, averages for 1995-
2014 and 1962-2010, respectively)
y = 15.526x - 2.9218
R² = 0.78210
20
40
60
80
100
120
0 1 2 3 4 5 6 7 8
C. Herfindahl-Hirschman vs. Theil (164 countries, averages for
1995-2014 and 1962-2010, respectively)

19
Figure 2. Economic Diversification and Growth across Countries
y = 0.046x + 7.596
R² = 0.33035
6
7
8
9
10
11
12
13
0 10 20 30 40 50 60 70 80
A. Log GNI Per Capita 2014 vs. Finger-Kreinin Average 1995-
2014 (178 countries, excluding six GCC countries)
y = 0.0224x + 7.6637
R² = 0.15295
6
7
8
9
10
11
12
13
0 20 40 60 80 100
B. Log GNI Per Capita 2014 vs. Herfindahl-Hirschman Average
1995-2014 (178 countries, excluding six GCC countries)
y = 0.5688x + 6.5774
R² = 0.30215
6
7
8
9
10
11
12
13
0 1 2 3 4 5 6 7 8
C. Log GNI Per Capita 2014 vs. Theil Index Average 1962-2010
(165 countries, not including GCC countries)
20
Figure 3. Covariation of Political Diversification Indices across Countries
y = 0.8479x + 0.7022
R² = 0.95240
1
2
3
4
5
6
7
8
0 1 2 3 4 5 6 7 8
A. Civil Liberties vs. Political Rights (179 countries,
averages for 1972-2014)
y = 0.2663x + 3.8695
R² = 0.73870
1
2
3
4
5
6
7
8
-12 -10 -8 -6 -4 -2 0 2 4 6 8 10 12
B. Political Rights vs. Democracy (155 countries, averages
for 1972-2014 and and 1960-2012, respectively)
y = 0.2311x + 3.9381
R² = 0.72470
1
2
3
4
5
6
7
8
-12 -10 -8 -6 -4 -2 0 2 4 6 8 10 12
C. Civil Liberties vs. Democracy (155 countries, averages
for 1972-2014 and and 1960-2012, respectively)

21
Figure 4. Covariation of Economic and Political Diversification Indices
y = 5.4402x + 40.909
R² = 0.17260
10
20
30
40
50
60
70
80
90
100
0 1 2 3 4 5 6 7 8
A. Herfindahl-Hirschman vs. Civil Liberties (178 countries,
averages for 1995-2014 and 1972-2014, respetively)
y = 4.1853x + 15.029
R² = 0.2934
0
10
20
30
40
50
60
70
80
0 1 2 3 4 5 6 7 8
B. Finger-Kreinin vs. Political Rights (178 countries, averages
for 1995-2014 and 1972-2014, respetively)
y = 0.1202x + 4.4361
R² = 0.3593
0
1
2
3
4
5
6
7
8
-12 -10 -8 -6 -4 -2 0 2 4 6 8 10 12
C. Theil vs. Democracy (139 countries, averages for 1962-2010
and 1960-2012, respectively)
22
Figure 5. Political Diversification and Growth across Countries
y = 0.3306x + 7.6374
R² = 0.29485
6
7
8
9
10
11
12
0 1 2 3 4 5 6 7 8
A. Log GNI Per Capita 2014 and Political Rights Average 1972-
2014 (171 countries, excluding six GCC countries)
y = 0.3855x + 7.3839
R² = 0.30365
6
7
8
9
10
11
12
0 1 2 3 4 5 6 7 8
B. Log GNI Per Capita 2014 and Civil Liberties Average 1972-
2014 (171 countries, excluding six GCC countries)
y = 0.1112x + 8.9387
R² = 0.31075
6
7
8
9
10
11
12
-12 -10 -8 -6 -4 -2 0 2 4 6 8 10 12
C. Log GNI Per Capita 2014 vs. Democracy Average 1960-2012
(147 countries, excluding five GCC countries)

23
Notes on Figures
Fig. 1. The Herfindahl-Hirschman Index (HHI) and the Finger-Kreinin Index (FKI) are
presented as 100*(1 – HHI) and 100*(1 – FKI) to have inverted indices that rise from 0
(no dispersion, no diversification) to 100 (full dispersion, full diversification). Likewise,
the Theil export diversification index (EDI) is presented as 8 – EDI to have an inverted
index that rises from 1 (no diversification) to 7 (full diversification). Hence, rising
curves mean more diversification. Author´s computations are based on data from
UNCTAD and IMF (Figs. 1B and 1C). In Figs. 1A and 1C, the inverted Herfindahl-
Hirschman is shown on the vertical axis. In Fig. 1B, the inverted Finger-Kreinin Index is
on the vertical axis.
Fig. 2. Log of per capita GNI is shown on vertical axes, taken from World Bank, World
Development Indicators. The six GCC countries excluded from Figs. 2A and 2B are
Bahrain, Kuwait, Oman, Qatar, Saudi Arabia, and United Arab Emirates. The ECI is not
available for Bahrain so only the remaining five GCC countries are excluded from Fig. 2C.
Fig. 3. The Political Liberties Index (PLI) and the Civil Rights Index (CRI) are
presented as 8 – PLI and 8 – CRI to have inverted indices that rise from 1 (no liberties,
no rights) to 7 (full liberties, full rights). Hence, rising curves mean more freedom.
Author´s computations are based on data from Freedom House and Polity IV Project
(Figs. 3B and 3C). In Figs. 3A and 3C, the inverted civil liberties index is shown on the
vertical axes. In Fig. 3B, the inverted political liberties index is on the vertical axis. In
Figs. 3B and 3C, the Polity2 index of democracy is on horizontal axis.
Fig. 4. Variables are defined as in Figs. 1and 3. In Fig. 4A, the inverted Herfindahl-
Hirschman is shown on the vertical axis. In Fig. 4B, the inverted Finger-Kreinin is on the
vertical axis. In Fig. 4C, the inverted Theil is on the vertical axis.
Fig. 5. See Fig. 2.