Growth and Yield of Chilli Influenced By Nitrogen And ... · Growth and Yield of Chilli Influenced...
15
IOSR Journal of Agriculture and Veterinary Science (IOSR-JAVS) e-ISSN: 2319-2380, p-ISSN: 2319-2372. Volume 11, Issue 5 Ver. II (May 2018), PP 54-68 www.iosrjournals.org DOI: 10.9790/2380-1105025468 www.iosrjournals.org 54 | Page Growth and Yield of Chilli Influenced By Nitrogen And Phosphorus Md. Rizvi Islam 1 , Tania Sultana *2 , Md. Ahsanul Haque 3 , Md. Ismail Hossain 4 , Naima Sabrin 5 And Rabiul Islam 6 1, 4,5 (Department of Horticulture, Sher-e-Bangla Agricultural University, Bangladesh) *2, 3 (Departmentof Agroforestry & Environmental Science, Sher-e-Bangla Agricultural University, Bangladesh) 6( Department of Agricultural Chemistry, Sher-e-Bangla Agricultural University, Bangladesh) *Corresponding Author: Tania Sultana (Email: [email protected]) Abstract : A field experiment was carried out during the period from November 2015 to May 2016 at Horticultural farm of Sher-e-Bangla Agricultural University, Dhaka, Bangladesh to investigate the influence of nitrogen and phosphorus on growth and yield of chilli. The two factorial experiments were laid out in Randomized Complete Block Design with three replications. Four levels of nitrogen N 0 : 0 kg N ha -1 , N 1 : 100 kg N ha -1 , N 2 : 120 kg N ha -1 , N 3 : 140 kg N ha -1 and three levels of phosphorous P 0 : 0 kg P 2 O 5 ha -1 , P 1 : 30 kg P 2 O 5 ha -1 , P 2 : 45 kg P 2 O 5 ha -1 and P 3 : 60 kg P 2 O 5 ha -1 were used in this experiment. Growth and yield contributing parameters significantly influenced by different doses of nitrogen and phosphorus fertilizers. The dose of N 2 gave the highest plant height (cm) and most of the growth parameters increased with increasing nitrogen levels up to N 3 . The dose of P 2 gave the highest plant height (cm) and most of the growth parameters increased with increasing phosphorus levels up to P 3 .The treatment combinationN 3 and P 3 gave the highest plant canopy(33.25 cm), fruit diameter (0.95 cm), fruit pedicel (2.87 cm), fruit length (5.60 cm), yield of fruits plant -1 (235.00 g), average fruit yield plot -1 (3.39 kg), individual fruit weight (2.52 g) and average fruit yield (12.32 tha -1 ). Based on the present results, it can be suggested that the combined use of 140 kg N ha -1 with 60 kg P 2 O 5 ha -1 increased plant growth and fruit yield of chilli. Keywords : Chilli, Growth, Nitrogen, Phosphorus, Yield --------------------------------------------------------------------------------------------------------------------------------------- Date of Submission: 20-05-2018 Date of acceptance: 05-06-2018 --------------------------------------------------------------------------------------------------------------------------------------- I. Introduction Chilli (Capsicum frutescens) is an important spice belongs to the family Solanaceae. The genus Capsicum contains about 20 species and now five domesticated species Capsicum annum, Capsicum frutescens, Capsicum chinense, Capsicum baccatum, Capsicum pubescensare only recognized. Pepper cultivars of Capsicum frutescens can be annual or short-lived perennial plants. Capsicum has different color-range from green to yellow, red, orange, purple and black. Other capsicum include the red, heart-shaped; the pale green, slender and curved bull’s horn which range in color from yellow to red and sweet ba nana pepper which is yellow and banana shaped (TeshmTadesse Michael et al.,1999). The chilli is a plant of tropical and sub-tropical region. Tropical south America especially Brazil is thought to be the original home of pepper (Shoemaker and Teskey, 1995). The profit from the use of commercial fertilizer has been so often demonstrated by experiment that there is no doubt about the necessity of using the right fertilizer and the economic returns resulting from them. The optimum proportion of fertilizer enhances the growth and development of a crop as well as ensures the availability of other essential nutrients for the plant. Use of inorganic and organic fertilizers has amused a great significance in recent years in vegetables production, for two reasons. Firstly, the need for continued increase production and per hectare yield of chilli requires the increase amount of nutrients. Secondly, the results of a large number of experiments on inorganic and organic fertilizers conducted in several countries reveal that inorganic fertilizer alone cannot sustain the productivity of soils under highly intensive cropping systems (Singh, 2004). Fertilizer rates influenced capsaicin content and colour of powdered pepper (Yodpetch, 1997). The mineral nutrients, N, P and K are known to affect growth and yield of the capsicums. In Bangladesh, urea is mostly used as the source of Nitrogen and split application of this fertilizer is commonly practiced(Hossain, 1990). On the other hand nutrient availability in a soil depends on some factors.Growth, development and yield of chilli depends on various factors among them balanced fertilizer is important one. Many researchers reported that different varieties of crop have different effect for the reducing higher rate of flower/ fruit dropping and fruit setting condition as well as the marketable yield of chilli. Different varieties respond to differential
Transcript of Growth and Yield of Chilli Influenced By Nitrogen And ... · Growth and Yield of Chilli Influenced...

IOSR Journal of Agriculture and Veterinary Science (IOSR-JAVS)
e-ISSN: 2319-2380, p-ISSN: 2319-2372. Volume 11, Issue 5 Ver. II (May 2018), PP 54-68
www.iosrjournals.org
DOI: 10.9790/2380-1105025468 www.iosrjournals.org 54 | Page
Growth and Yield of Chilli Influenced By Nitrogen And
Phosphorus
Md. Rizvi Islam1, Tania Sultana
*2, Md. Ahsanul Haque
3, Md. Ismail Hossain
4 ,
Naima Sabrin5 And Rabiul Islam
6
1, 4,5(Department of Horticulture, Sher-e-Bangla Agricultural University, Bangladesh)
*2, 3(Departmentof Agroforestry & Environmental Science, Sher-e-Bangla Agricultural University, Bangladesh)
6(Department of Agricultural Chemistry, Sher-e-Bangla Agricultural University, Bangladesh)
*Corresponding Author: Tania Sultana (Email: [email protected])
Abstract : A field experiment was carried out during the period from November 2015 to May 2016 at
Horticultural farm of Sher-e-Bangla Agricultural University, Dhaka, Bangladesh to investigate the influence of
nitrogen and phosphorus on growth and yield of chilli. The two factorial experiments were laid out in
Randomized Complete Block Design with three replications. Four levels of nitrogen N0: 0 kg N ha-1
, N1: 100 kg
N ha-1
, N2: 120 kg N ha-1
, N3: 140 kg N ha-1
and three levels of phosphorous P0: 0 kg P2O5 ha-1
, P1: 30 kg P2O5
ha-1
, P2: 45 kg P2O5 ha-1
and P3: 60 kg P2O5 ha-1
were used in this experiment. Growth and yield contributing
parameters significantly influenced by different doses of nitrogen and phosphorus fertilizers. The dose of N2
gave the highest plant height (cm) and most of the growth parameters increased with increasing nitrogen levels
up to N3. The dose of P2gave the highest plant height (cm) and most of the growth parameters increased with
increasing phosphorus levels up to P3.The treatment combinationN3 and P3 gave the highest plant canopy(33.25
cm), fruit diameter (0.95 cm), fruit pedicel (2.87 cm), fruit length (5.60 cm), yield of fruits plant-1
(235.00 g),
average fruit yield plot-1
(3.39 kg), individual fruit weight (2.52 g) and average fruit yield (12.32 tha-1
). Based
on the present results, it can be suggested that the combined use of 140 kg N ha-1
with 60 kg P2O5 ha-1
increased
plant growth and fruit yield of chilli.
Keywords : Chilli, Growth, Nitrogen, Phosphorus, Yield
----------------------------------------------------------------------------------------------------------------------------- ----------
Date of Submission: 20-05-2018 Date of acceptance: 05-06-2018
----------------------------------------------------------------------------------------------------------------------------- ----------
I. Introduction
Chilli (Capsicum frutescens) is an important spice belongs to the family Solanaceae. The genus
Capsicum contains about 20 species and now five domesticated species Capsicum annum, Capsicum frutescens,
Capsicum chinense, Capsicum baccatum, Capsicum pubescensare only recognized. Pepper cultivars of
Capsicum frutescens can be annual or short-lived perennial plants. Capsicum has different color-range from
green to yellow, red, orange, purple and black. Other capsicum include the red, heart-shaped; the pale green,
slender and curved bull’s horn which range in color from yellow to red and sweet banana pepper which is
yellow and banana shaped (TeshmTadesse Michael et al.,1999). The chilli is a plant of tropical and sub-tropical
region. Tropical south America especially Brazil is thought to be the original home of pepper (Shoemaker and
Teskey, 1995).
The profit from the use of commercial fertilizer has been so often demonstrated by experiment that
there is no doubt about the necessity of using the right fertilizer and the economic returns resulting from them.
The optimum proportion of fertilizer enhances the growth and development of a crop as well as ensures the
availability of other essential nutrients for the plant. Use of inorganic and organic fertilizers has amused a great
significance in recent years in vegetables production, for two reasons. Firstly, the need for continued increase
production and per hectare yield of chilli requires the increase amount of nutrients. Secondly, the results of a
large number of experiments on inorganic and organic fertilizers conducted in several countries reveal that
inorganic fertilizer alone cannot sustain the productivity of soils under highly intensive cropping systems
(Singh, 2004). Fertilizer rates influenced capsaicin content and colour of powdered pepper (Yodpetch, 1997).
The mineral nutrients, N, P and K are known to affect growth and yield of the capsicums. In Bangladesh, urea is
mostly used as the source of Nitrogen and split application of this fertilizer is commonly practiced(Hossain,
1990). On the other hand nutrient availability in a soil depends on some factors.Growth, development and yield
of chilli depends on various factors among them balanced fertilizer is important one. Many researchers reported
that different varieties of crop have different effect for the reducing higher rate of flower/ fruit dropping and
fruit setting condition as well as the marketable yield of chilli. Different varieties respond to differential

Growth And Yield Of Chilli Influenced By Nitrogen And Phosphorus
DOI: 10.9790/2380-1105025468 www.iosrjournals.org 55 | Page
cultivation practices and prevailing environmental condition during growing season.Generally large amount of
nitrogen is required for the production of vegetable (Openaet al., 1988). It is also the most essential element to
manage in a fertilization system such that an adequate, but not excessive amount of nitrogen is available during
the entire growing season (Anon., 1972).
Nitrogen plays a vital role as a constituent of protein, nucleic acid and chlorophyll (Devlin, 1972).
Nitrogen is essential for building up protoplasm and protein, which induce cell division and initial meristematic
activity when applied in optimum quantity (Singh and Kumar, 1969). Adequate nitrogen increases the quality,
fruit size, keeping quality, color and taste (Shukla and Nair, 1993). Nitrogen influences flower development of
several vegetable crops including pepper, tomato and cucumber (Kinetet al 1985). According to Bhatnagar and
Panditu (1981), increase in nitrogen levels and spacing resulted in the production of quality fruits. Adequate
supply of nitrogen is essential for vegetative growth, and desirable yield (Yoshizawaet al., 1981). Excessive
application of nitrogen on the other hand is not only uneconomical but also induces physiological disorder and
pollutes the environment.
Phosphorus is also one of the important macro essential element for normal growth and development of
plant Phosphorus requirements vary depending upon the nutrient content of the soil (Bose and Som, 1986).
Phosphorus shortage restricted the plant growth and remains immature (Hossain, 1990). The effect of
phosphorus on the formation and translocation of carbohydrates, roots development, nodulation, growth and
other agronomic characters are well recognized. Phosphorus induces earliness in flowering and fruiting
including seed formation (Buckman and Brady, 1980). Again secondary mechanism of interference was the
absorption of phosphorus from the soil through luxury consumption, increasing the tissue content without
enhancing smooth biomass accumulation (Santos et al., 2004).To attain considerable production and quality
yield for chilli it is necessary to proper management including ensuring the availability of essential nutrient
components in proper doses. Considering the importance of chilli cultivation, the present research work has
been undertaken with the objectives: a) to study the effect of nitrogen and phosphorus fertilizers on growth and
yield of chilli cv. BARI Morich-1. b) to determine the optimum doses of nitrogen and phosphorus fertilizers on
growth and yield of chilli cv. BARI Morich-1.
II. Methods And Materials The experiment was laid out in Randomized Complete Block Design (RCBD) having two factors with
three replications. An area of 25.5 m x 5.5 m was divided into three equal blocks. Each block was consists of 16
plots where 16 treatments were allotted randomly. There were 48 unit plots in the experiment. The size of each
plot was 1.2 m x 1.2 m, which accommodated 4 plants at a spacing 0.3 m x 0.3 m. The distance between two
blocks and two plots were kept 1.0 m and 0.5 m respectively. Chilli seedlings were raised in different polybags.
The soil was well prepared and converted into loose friable and dried mass by spading. All weeds and stubbles
were removed and 5 kg well rotten cow dung was mixed with the soil. 3-5 seeds was sown on each polybag on
15th
November 2013. After sowing, seeds were covered with light soil. The emergence of the seedlings took
place within 5 to 6 days after sowing. Weeding, mulching and irrigation were done as and when required. After
25 days of seed sowing they are ready for transplanting. The experiment was consisted on four levels of nitrogen
N0: 0 kg N ha-1
, N1: 100 kg N ha-1
, N2: 120 kg N ha-1
, N3: 150 kg N ha-1
and four levels of phosphorous P0: 0 kg
P2O5 ha-1
, P1: 30 kg P2O5 ha-1
, P2: 45 kg P2O5 ha-1
and P3: 60 kg P2O5 ha-1
. There were in total 16 (4×4) treatment
combinations such as: N0P0, N0P1, N0P2, N0P3, N1P0, N1P1, N1P2, N1P3, N2P0, N2P1, N2P2, N2P3, N3P0, N3P1,
N3P2, N3P3. Urea, triple super phosphate (TSP), muriate of potash (MP) and borax were used as source of
nitrogen, phosphorus, potassium and boron, respectively. Well decomposed cowdung was also applied to the
field before final ploughing. Total amount of TSP, MP, borax and 50% of urea were applied as basal doses
during final land preparation. The remaining 50% urea was applied as top dressing at 40 days after transplanting
during flowering and fruiting start stage. Healthy and uniform 25 days old seedlings were uprooted separately
from the polybag and were transplanted in the experimental plots in 20th December, 2013 maintaining a spacing
of 30 cm x 30 cm between the plants and rows respectively. This allowed an accommodation of 16 plants in
each plot. The seedlings were watered after transplanting. Seedlings were also planted around the border area of
the experimental plots for gap filling. After transplanting the seedlings, different intercultural operations were
accomplished for better growth and development of the plants. Five plants were selected randomly from each
plot for data collection in such a way that the border effect could be avoided for the highest precision. Data on
the following parameters were recorded from the sample plants during the course of experiment. The data on
pant height, number of leaves per plant, leaf length of plant, leaf breadth of plant, number of branches per plant,
canopy of plant, length of fruit, diameter of fruit, length of pedicel, individual fruit weight, yield of fruits per
plant, yield of fruits per plot and yield of fruits per hectare were recorded. The recorded data on various
parameters were statistically analyzed using MSTAT-C statistical package programme. The mean for all the
treatments was calculated and analysis of variance for all the characters were performed by F- Difference

Growth And Yield Of Chilli Influenced By Nitrogen And Phosphorus
DOI: 10.9790/2380-1105025468 www.iosrjournals.org 56 | Page
between treatment means were determined by Duncan`s Multiple Range Test (DMRT) according to Gomez and
Gomez, (1984) at 5% level of significance.
III. Results And Discussions The results obtained with different levels of nitrogen (N) and phosphorus (P) and their combinations
are presented and discussed in this chapter. Data about growth parameters, yield contributing characters and
yield of chilli have been presented in both Tables and Figures and analyzes of variance and corresponding
degrees of freedom have been shown in Appendix.
3.1 Plant height:
The plant height of chilli was statistically significant with various levels (25, 40, 55, 70 and 85 DAT)
of nitrogen (Table 1 and Appendix V). The result revealed that at 25 DAT the tallest plant was recorded from N2
(14.06 cm) which was statistically similar with N1 (13.53 cm) and N3 (13.09 cm) whereas the shortest plant
height was found from N0 (11.98). At 40 DAT the highest plant height (20.19 cm) was observed from the N2
treatment which was statistically similar to N1 (20.06 cm) whereas, the lowest (17.81 cm) was observed in N0
treatment. At 55 DAT the highest plant height (25.27 cm) was observed from the N2 treatment which was
statistically similar to N1 (24.34 cm) whereas, the lowest (22.08 cm) was observed from N0 treatment which was
statistically similar with N3 (23.29 cm). At 70 DAT the highest plant height (27.35 cm) was observed from the
N2 treatment which was statistically similar with N1 (27.17 cm), N3 (27.79 cm) whereas, the lowest (25.21 cm)
was observed from N0 treatment. At 85 DAT the highest plant height (30.96 cm) was observed from the N1
treatment which was statistically similar with N2 (30.63 cm) whereas, the lowest (27.45 cm) was observed from
N0 treatment. It was revealed that increased plant height up to a certain level then decreases due to increasing the
nitrogen fertilizer. The result was similar with that of Lal and Pundrik (1973), Damke et. al. (1990) and Nicola
et. al.(1995). They observed an improvement on plant height with increasing nitrogen application.
Table 1. The effect of different levels of nitrogen and phosphorous on plant height of chilli Treatments Plant height (cm)
25 DAT 40 DAT 55 DAT 70 DAT 85 DAT
Levels of Nitrogen
N0 11.98 b 17.81 c 22.08 c 25.21b 27.45 c
N1 13.53 a 21.06 a 24.34 ab 27.17 a 30.96 a
N2 14.06 a 20.19 a 25.27 a 27.35 a 30.63 a
N3 13.09 a 19.04 b 23.29 bc 27.79 a 28.99 b
Levels of Phosphorus
P0 12.09 c 18.42 c 23.61 a 27.10 ab 29.54 ab
P1 12.50 bc 19.10 bc 23.08 a 26.04 b 28.90 b
P2 14.69 a 20.89 a 24.04 a 27.75 a 30.63 a
P3 13.38 b 19.69 b 24.25 a 26.63 ab 28.96 b
LSD(0.05) 0.502 0.520 0.598 0.571 0.605
CV% 9.34 6.53 6.17 5.20 5.02
N0: 0 kg N ha-1
(control); N1: 100 kg N ha-1
; N2: 120 kg N ha-1
; N3: 140 kg N ha-1
and P0: 0 kg P ha-1
(control);
P1: 30 kg P ha-1
; P2: 45 kg P ha-1
and P3: 60 kg P ha-1
Plant height of chilli varied significantly for different levels (25, 40, 70 and 85 DAT) of phosphorus but
except 55 DAT (Table 1 and Appendix V). At 25 DAT the tallest plant (14.69 cm) was observed from P2
whereas the shortest plant was observed from P0 (12.09 cm) which was statistically similar to P1 (12.50 cm). At
40 DAT the highest plant height (20.89 cm) was observed from P2 whereas the shortest plant was observed from
P0 (18.42 cm) which was statistically similar to P1 (19.10 cm). At 70 DAT the highest plant height (27.75 cm)
was observed from the P2 treatment which was statistically similar to P0 (27.10 cm), P3 (26.63 cm) whereas the
lowest (26.04 cm) was observed from P1 treatment. At 85 DAT the highest plant height was observed from the
P2 (30.63 cm) treatment which was statistically similar to P0 (29.54 cm) whereas the lowest was observed from
P1 (28.90 cm) treatment which was statistically similar to P3 (28.96 cm). It revealed that with the increase of
application of phosphorus, plant height showed increasing trend, but after a certain level plant height increases
very slowly.
Table 2. Combined effect of different levels of nitrogen and phosphorous on plant height of chilli Treatments Plant height (cm)
25 DAT 40 DAT 55 DAT 70 DAT 85 DAT
N0P0 7.92 g 13.00 i 20.33 g 22.33 e 25.00 g
N0P1 11.58 f 19.00 efg 21.83 efg 24.25 de 26.97 fg
N0P2 14.08 bcde 20.08 cdef 24.17 cde 25.50 cd 27.83 ef

Growth And Yield Of Chilli Influenced By Nitrogen And Phosphorus
DOI: 10.9790/2380-1105025468 www.iosrjournals.org 57 | Page
N0P3 14.33 bc 19.17 defg 26.17 bc 28.75 ab 30.00 cde
N1P0 14.77 ab 23.00 b 26.93 ab 28.50 ab 31.17 bc
N1P1 12.25 def 21.17 bcd 24.33 cd 29.00 ab 30.00 cde
N1P2 14.25 bcd 20.83 cde 20.83 g 24.33 de 32.50 ab
N1P3 12.83bcdef 19.25 defg 25.25 bc 26.83 bc 30.17bcde
N2P0 13.58bcdef 20.17 cdef 26.17 bc 28.58 ab 32.00 abc
N2P1 12.17 ef 15.42 h 24.50 bcd 26.17 cd 28.17 def
N2P2 16.50 a 26.67 a 28.83 a 30.67 a 34.17 a
N2P3 14.00 bcde 18.50 fg 21.58 fg 24.00 de 28.17 def
N3P0 12.08 ef 17.50 gh 21.00 g 29.00 ab 30.00 cde
N3P1 14.00 bcde 20.83 cde 21.67 fg 24.75 cd 30.48 bcd
N3P2 13.92 bcde 16.00 h 22.33defg 30.50 a 28.00 ef
N3P3 12.35 cdef 21.83 bc 24.00 cdef 26.93 bc 27.50 f
LSD(0.05) 1.004 1.041 1.197 1.142 1.211
CV% 9.34 6.53 6.17 5.20 5.02
N0: 0 kg N ha-1
(control); N1: 100 kg N ha-1
; N2: 120 kg N ha-1
; N3: 140 kg N ha-1
and P0: 0 kg P2O5 ha-1
(control); P1: 30 kg P2O5 ha-1
; P2: 45 kg P2O5 ha-1
and P3: 60 kg P2O5 ha-1
Combined effect of different levels of nitrogen and phosphorus showed significant variation on plant
height of chilli at 25, 40, 55, 70 and 85 DAT (Table 2 and Appendix V). At 25 DAT the tallest plant (16.50 cm)
was observed from N2P2 which was statistically similar to N1P0 (14.77 cm) whereas the shortest plant was
recorded from N0P0 (7.92cm). At 40 DAT the tallest plant (26.67 cm) was observed from N2P2 whereas the
shortest plant was recorded from N0P0 (13.00 cm). At 55 DAT the tallest plant was observed from N2P2 (28.83
cm) which was statistically similar with N1P0 (23.00 cm) whereas the shortest plant was recorded from N3P0
(20.33 cm) which was statistically similar to N0P0 (21.00 cm), N0P1 (21.83 cm), N1P2 (20.83 cm), N2P3 (21.58
cm). At 70 DAT the tallest plant was observed from N2P2 (30.67cm) which was statistically similar to N0P3
(28.75 cm), N1P0 (28.50 cm), N1P1 (29.00 cm), N2P0 (28.58 cm), N3P0 (29.00 cm) whereas the shortest plant was
recorded from N0P0 (22.33 cm) which was statistically similar to N0P1 (24.25 cm), N1P2 (24.33 cm), N2P3 (24.00
cm). At 85 DAT the tallest plant was observed from N2P2 (34.17 cm) which was statistically similar to N1P2
(32.50 cm) whereas the shortest plant was recorded from N0P0 (25.00 cm) which was statistically similar to N0P1
(26.97 cm). Similar results were found by Chauhan et al. (2005) They stated that among the various N and P
combinations, 120 kg N + 60 kg P ha-1
recorded the greatest plant height (64.83 cm). Sarma et al. (2004) were
also found similar results.
3.2 Number of leaves plant-1
Nitrogen fertilizer doses showed significant effect on number of leaves per plant of chilli at 25, 40, 55,
70 and 85 DAT (Table 3 and Appendix VI). At 25 DAT the highest number of leaves per plant (31.17) was
observed from the N3 treatment which was statistically similar to N1 (30.54) and N2 (30.69) whereas the lowest
(26.35) was observed from N0 treatment. At 40 DAT the highest number of leaves per plant (71.52) was
observed from the N3 treatment whereas the lowest (54.81) was observed from N0 treatment. At 55 DAT the
highest number of leaves per plant was observed from the N3 (143.45) treatment whereas the lowest was
observed from N0 (94.70) treatment. At 70 DAT the highest number of leaves per plant was observed from the
N3 (160.88) treatment which was statistically similar to N2 (159.58) whereas the lowest was observed from N0
(140.98) treatment. At 85 DAT the highest number of leaves per plant (200.83) was observed from the N3
treatment whereas the lowest (173.57) was observed from N1 treatment. As data shown, N fertilization increased
leaf number which were in agreement with findings of Ayodele (2002) and Boroujerdnia and Ansari (2007).
Number of leaves per plant of chilli varied significantly for different levels (25, 40, 55, 70 and 85
DAT) of phosphorus (Table 3 and Appendix VI). At 25 DAT the highest number of leaves (30.73) was recorded
in P1 which was statistically identical (29.96) to P2 whereas the lowest number of leaves was recorded from P0
(28.92) which was statistically similar to P3 (29.15). At 40 DAT the highest number of leaves (71.44) was
recorded in P1 whereas the lowest number of leaves was recorded from P3 (59.73) which was statistically similar
to P0 (60.02). At 55 DAT the highest number of leaves was recorded in P1 (143.73) whereas the lowest number
of leaves was recorded from P0 (102.98). At 70 DAT the highest number of leaves was recorded in P1 (167.93)
whereas the lowest number of leaves was recorded from P0 (125.79). At 85 DAT the highest number of leaves
(197.10) was recorded in P2 whereas the lowest number of leaves was recorded from P0 (165.73). The results
showed significant variation in number of leaves per plant with increasing phosphorus in P1 treatment up to P2
treatment.
Table 3. The effect of different levels of nitrogen and phosphorous on number of leaves plant-1
of chilli
Treatments Number of leaves plant-1
25 DAT 40 DAT 55 DAT 70 DAT 85 DAT

Growth And Yield Of Chilli Influenced By Nitrogen And Phosphorus
DOI: 10.9790/2380-1105025468 www.iosrjournals.org 58 | Page
Levels of Nitrogen
N0 26.35 b 54.81 d 94.70 d 140.98 c 181.00 c
N1 30.54 a 67.69 b 131.15 c 149.85 b 173.57 d
N2 30.69 a 66.00 c 139.79 b 159.58 a 186.83 b
N3 31.17 a 71.52 a 143.45 a 160.88 a 200.83 a
Levels of Phosphorus
P0 28.92 b 59.73 c 102.98 d 125.79 d 165.73 d
P1 30.73 a 71.44 a 143.73 a 167.93 a 194.45 b
P2 29.96 ab 68.83 b 128.12 c 166.08 b 197.10 a
P3 29.15 b 60.02 c 134.27 b 151.48 c 184.96 c
LSD(0.05) 0.650 0.639 0.585 0.900 0.810
CV% 5.37 2.41 1.13 1.44 1.07
N0: 0 kg N ha-1
(control); N1: 100 kg N ha-1
; N2: 120 kg N ha-1
; N3: 140 kg N ha-1
and P0: 0 kg P2O5 ha-1
(control); P1: 30 kg P2O5 ha-1
; P2: 45 kg P2O5 ha-1
and P3: 60 kg P2O5 ha-1
Table 4. Combined effect of different levels of nitrogen and phosphorous on number of leaves plant-1
of
chilli Treatments Number of leaves plant-1
25 DAT 40 DAT 55 DAT 70 DAT 85 DAT
N0P0 22.00 g 40.58 j 83.83 l 122.50 i 160.00 i
N0P1 29.08 de 74.17 c 106.33 i 148.17 f 183.83 f
N0P2 30.08 de 64.25 g 91.90 k 153.50 e 196.50 d
N0P3 24.25 fg 40.25 j 96.75 j 139.75 g 183.67 f
N1P0 34.00 ab 64.83 g 66.17 m 120.00 i 150.25 j
N1P1 33.58 ab 83.42 b 156.08 d 145.42 f 172.25 h
N1P2 25.17 f 52.17 i 142.17 e 170.17 c 188.30 e
N1P3 29.42 de 70.33 e 160.17 c 163.83 d 183.50 f
N2P0 28.25 e 66.42 fg 130.33 f 140.42 g 180.17 g
N2P1 30.08 de 54.08 hi 123.83 g 170.23 c 186.65 ef
N2P2 34.25 a 88.27 a 164.83 b 195.50 b 208.33 b
N2P3 30.17 cde 55.25 h 140.17 e 132.17 h 172.17 h
N3P0 31.42 bcd 68.25 ef 131.57 f 120.25 i 172.50 h
N3P1 30.17 cde 74.08 c 188.67 a 207.92 a 235.08 a
N3P2 30.33 cde 70.65 de 113.58 h 145.17 f 195.25 d
N3P3 32.75 abc 73.08 cd 140.00 e 170.17 c 200.50 c
LSD(0.05) 1.301 1.278 1.169 1.800 1.621
CV% 5.37 2.41 1.13 1.44 1.07
N0: 0 kg N ha-1
(control); N1: 100 kg N ha-1
; N2: 120 kg N ha-1
; N3: 140 kg N ha-1
and P0: 0 kg P2O5 ha-1
(control); P1: 30 kg P2O5 ha-1
; P2: 45 kg P2O5 ha-1
and P3: 60 kg P2O5 ha-1
Significant combined effect between nitrogen and phosphorus on number of leaves was observed of
chilli at 25, 40, 55, 70 and 85 DAT (Table 4 and appendix VI). At 25 DAT N2P2 showed the maximum (34.25)
number of leaves which was statistically similar to N1P0 (34.00), N1P1 (33.58), N3P3 (32.75) while N0P0
condition showed the minimum (22.00) number of leaves which was statistically similar to N0P3 (24.25). At 40
DAT N2P2 showed the maximum (88.27) number of leaves while N0P3 condition showed the minimum (40.25)
number of leaves which was statistically similar to N0P0 (40.58). At 55 DAT the maximum (186.67) number of
leaves observed in N3P1 while N1P0 condition showed the minimum (66.17) number of leaves. At 70 DAT N3P1
showed the maximum (207.92) number of leaves while N1P0 condition showed the minimum (120.0) number of
leaves which was statistically similar to N0P0 (122.50) and N3P0 (120.25). At 85 DAT the maximum (235.08)
number of leaves observed in N3P1 while N1P0 showed the minimum (150.25) number of leaves. The results
showed significant variation in interaction of nitrogen and phosphorus treatments. These results agree with
Manchanda and Singh (1988). They concluded that number of leaf per plant increased with increase fertilizer
dose of NP.
3.3 Plant canopy
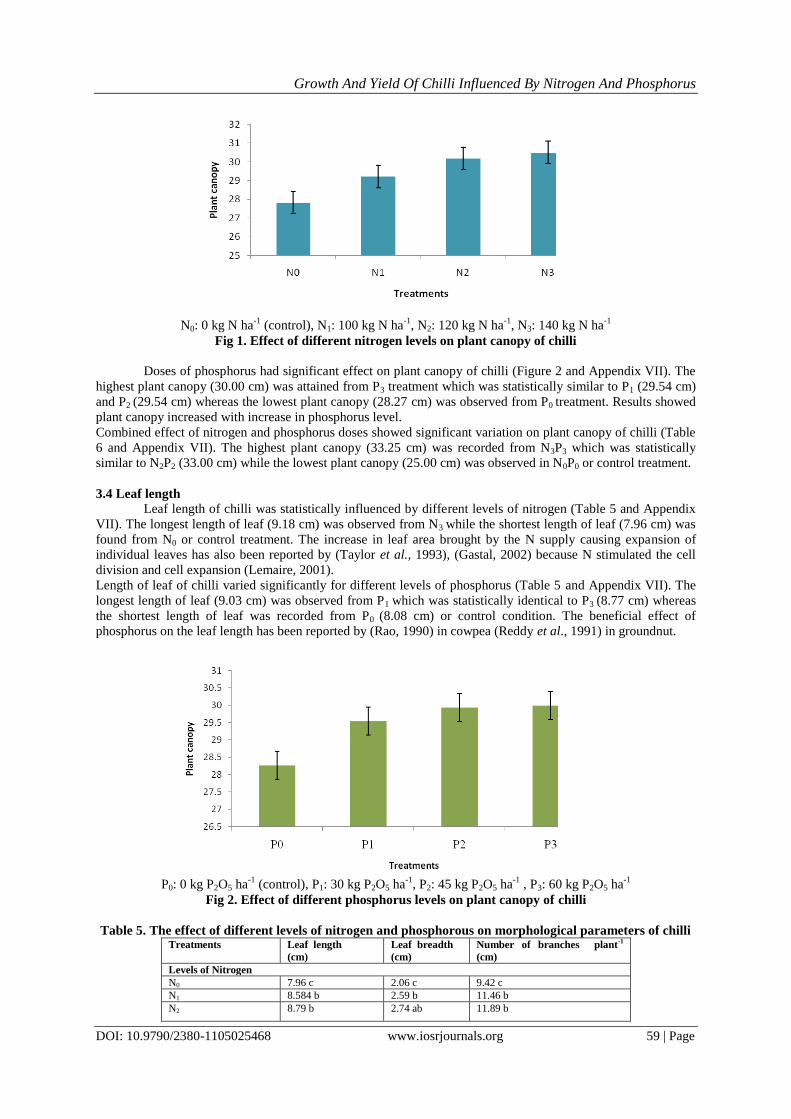
Nitrogen fertilizers doses had significant effect on plant canopy of chilli (Figure 1 and Appendix VII).
The highest plant canopy (30.50 cm) was attained from N3 treatment which was statistically similar to N2 (30.19
cm) while the lowest (27.83 cm) was observed from N0 treatment. The results showed that increased in nitrogen
treatment with increase in plant canopy but (Grindlay, 1997) reported that the nitrogen distribution between the
leaves of a canopy is not uniform.
Growth And Yield Of Chilli Influenced By Nitrogen And Phosphorus
DOI: 10.9790/2380-1105025468 www.iosrjournals.org 59 | Page
N0: 0 kg N ha
-1 (control), N1: 100 kg N ha
-1, N2: 120 kg N ha
-1, N3: 140 kg N ha
-1
Fig 1. Effect of different nitrogen levels on plant canopy of chilli
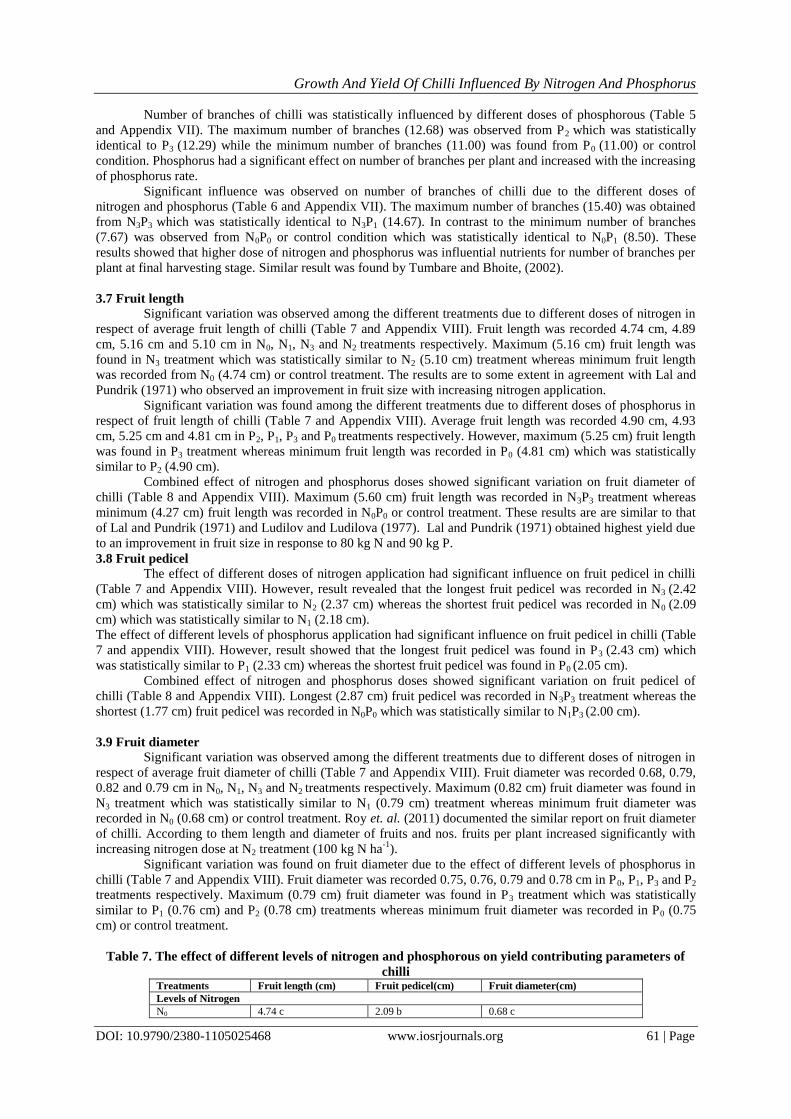
Doses of phosphorus had significant effect on plant canopy of chilli (Figure 2 and Appendix VII). The
highest plant canopy (30.00 cm) was attained from P3 treatment which was statistically similar to P1 (29.54 cm)
and P2 (29.54 cm) whereas the lowest plant canopy (28.27 cm) was observed from P0 treatment. Results showed
plant canopy increased with increase in phosphorus level.
Combined effect of nitrogen and phosphorus doses showed significant variation on plant canopy of chilli (Table
6 and Appendix VII). The highest plant canopy (33.25 cm) was recorded from N3P3 which was statistically
similar to N2P2 (33.00 cm) while the lowest plant canopy (25.00 cm) was observed in N0P0 or control treatment.
3.4 Leaf length
Leaf length of chilli was statistically influenced by different levels of nitrogen (Table 5 and Appendix
VII). The longest length of leaf (9.18 cm) was observed from N3 while the shortest length of leaf (7.96 cm) was
found from N0 or control treatment. The increase in leaf area brought by the N supply causing expansion of
individual leaves has also been reported by (Taylor et al., 1993), (Gastal, 2002) because N stimulated the cell
division and cell expansion (Lemaire, 2001).
Length of leaf of chilli varied significantly for different levels of phosphorus (Table 5 and Appendix VII). The
longest length of leaf (9.03 cm) was observed from P1 which was statistically identical to P3 (8.77 cm) whereas
the shortest length of leaf was recorded from P0 (8.08 cm) or control condition. The beneficial effect of
phosphorus on the leaf length has been reported by (Rao, 1990) in cowpea (Reddy et al., 1991) in groundnut.
P0: 0 kg P2O5 ha
-1 (control), P1: 30 kg P2O5 ha
-1, P2: 45 kg P2O5 ha
-1 , P3: 60 kg P2O5 ha
-1
Fig 2. Effect of different phosphorus levels on plant canopy of chilli
Table 5. The effect of different levels of nitrogen and phosphorous on morphological parameters of chilli Treatments Leaf length
(cm)
Leaf breadth
(cm)
Number of branches plant-1
(cm)
Levels of Nitrogen
N0 7.96 c 2.06 c 9.42 c
N1 8.584 b 2.59 b 11.46 b
N2 8.79 b 2.74 ab 11.89 b

Growth And Yield Of Chilli Influenced By Nitrogen And Phosphorus
DOI: 10.9790/2380-1105025468 www.iosrjournals.org 60 | Page
N3 9.18 a 2.88 a 13.73 a
Levels of Phosphorus
P0 8.08 c 2.36 b 11.00 b
P1 9.03 a 2.66 a 11.78 ab
P2 8.64 b 2.58 a 11.42 ab
P3 8.77 ab 2.67 a 12.29 a
LSD(0.05) 0.171 0.104 0.466
CV% 4.85 9.96 9.82
N0: 0 kg N ha-1
(control); N1: 100 kg N ha-1
; N2: 120 kg N ha-1
; N3: 140 kg N ha-1
and P0: 0 kg P2O5 ha-1
(control); P1: 30 kg P2O5 ha-1
; P2: 45 kg P2O5 ha-1
and P3: 60 kg P2O5 ha-1
Significant influence was observed on leaf length of chilli due to the different doses of nitrogen and
phosphorus (Table 6 and Appendix VII). The longest leaf length (10.91 cm) was obtained from N3P1. In contrast
to the lowest leaf length (6.85 cm) was observed from N0P0 or control condition.
3.5 Leaf breadth
Leaf breadth of chilli was statistically influenced by different doses of nitrogen (Table 5 and Appendix
VII). The highest leaf breadth (2.88 cm) was observed from N3 which was statistically identical to N2 (2.74 cm)
while the shortest leaf breadth (2.06 cm) was found from N0 or control condition. A critical observation of the
data indicated that leaf breadth increased with increasing levels of nitrogen up to 120 kg/ha and then a decrease
trend was observed with increase in nitrogen levels (Gupta and Sangar, 2000).
Breadth of leaf of chilli varied significantly for different levels of phosphorous (Table 5 and Appendix
VII). The highest leaf breadth (2.67 cm) was observed from P3 which was statistically identical to P1 (2.66 cm)
& P2 (2.58 cm) whereas the shortest length of leaf was recorded from P0 (2.36 cm) or control condition. The
report was supported by Chauhan et al.2005. They reported that a linear increase was observed on leaf breadth
with the increasing application of phosphorus up to 180 kg/ha.
Significant influence was observed on leaf length of chilli due to the different doses of nitrogen and phosphorus
(Table 6 and Appendix VII). The longest leaf length (3.40 cm) was obtained from N3P3 which was statistically
identical to N2P2 (3.00 cm) & N3P3 (3.03 cm). In contrast to the lowest leaf length (1.54 cm) was observed from
N0P0 or control condition.
3.6 Number of branches plant-1
Number of branches of chilli varied significantly for different levels of nitrogen (Table 5 and Appendix
VII). The maximum number of branches (13.73) was observed from N3 and the minimum number of branches
was recorded from N0 (9.42) or control condition. Nitrogen has a significant effect on number of branches per
plant as it activates vegetative growth. These results agree with the findings of Manchanda and Singh (1988).
They concluded that branches per plant increase with the increasing nitrogen rate.
Table 6. Combined effect of different levels of nitrogen and phosphorous on morphological parameters of
chilli Treatments Plant canopy (cm) Leaf length (cm) Leaf breadth (cm) Number of branches
plant-1 (cm)
N0P0 25.00 e 6.85 e 1.54 g 7.67 h
N0P1 29.08 bcd 8.20 d 2.03 f 8.50 gh
N0P2 29.25 bcd 8.56 bcd 2.2 ef 10.33 efg
N0P3 28.00 d 8.23 d 2.43 cdef 11.17 def
N1P0 29.00 bcd 8.57 bcd 2.79 bc 11.83 cde
N1P1 30.00 b 8.56 bcd 2.56 cde 9.83 fg
N1P2 28.08 cd 8.21 d 2.33 def 11.83 cde
N1P3 29.83 bc 9.00 bc 2.68bcd 12.33 cd
N2P0 29.58 bcd 8.71 bcd 2.77 bc 12.83 bcd
N2P1 28.75 bcd 8.46 cd 2.66 bcd 13.40 bc
N2P2 33.00 a 9.20 b 3.00 ab 10.33 efg
N2P3 29.17 bcd 8.79 bcd 2.53 cde 11.00 def
N3P0 29.50 bcd 8.18 d 2.32 def 11.67 cdef
N3P1 30.33 b 10.91 a 3.03 ab 14.67 ab
N3P2 29.17 bcd 8.60 bcd 2.77 bc 13.17 bc
N3P3 33.25 a 9.04 bc 3.40 a 15.40 a
LSD(0.05) 0.863 0.342 0.209 0.931
CV% 3.59 4.85 9.96 9.82
N0: 0 kg N ha-1
(control); N1: 100 kg N ha-1
; N2: 120 kg N ha-1
; N3: 140 kg N ha-1
and P0: 0 kg P2O5 ha-1
(control); P1: 30 kg P2O5 ha-1
; P2: 45 kg P2O5 ha-1
and P3: 60 kg P2O5 ha-1
Growth And Yield Of Chilli Influenced By Nitrogen And Phosphorus
DOI: 10.9790/2380-1105025468 www.iosrjournals.org 61 | Page
Number of branches of chilli was statistically influenced by different doses of phosphorous (Table 5
and Appendix VII). The maximum number of branches (12.68) was observed from P2 which was statistically
identical to P3 (12.29) while the minimum number of branches (11.00) was found from P0 (11.00) or control
condition. Phosphorus had a significant effect on number of branches per plant and increased with the increasing
of phosphorus rate.
Significant influence was observed on number of branches of chilli due to the different doses of
nitrogen and phosphorus (Table 6 and Appendix VII). The maximum number of branches (15.40) was obtained
from N3P3 which was statistically identical to N3P1 (14.67). In contrast to the minimum number of branches
(7.67) was observed from N0P0 or control condition which was statistically identical to N0P1 (8.50). These
results showed that higher dose of nitrogen and phosphorus was influential nutrients for number of branches per
plant at final harvesting stage. Similar result was found by Tumbare and Bhoite, (2002).
3.7 Fruit length
Significant variation was observed among the different treatments due to different doses of nitrogen in
respect of average fruit length of chilli (Table 7 and Appendix VIII). Fruit length was recorded 4.74 cm, 4.89
cm, 5.16 cm and 5.10 cm in N0, N1, N3 and N2 treatments respectively. Maximum (5.16 cm) fruit length was
found in N3 treatment which was statistically similar to N2 (5.10 cm) treatment whereas minimum fruit length
was recorded from N0 (4.74 cm) or control treatment. The results are to some extent in agreement with Lal and
Pundrik (1971) who observed an improvement in fruit size with increasing nitrogen application.
Significant variation was found among the different treatments due to different doses of phosphorus in
respect of fruit length of chilli (Table 7 and Appendix VIII). Average fruit length was recorded 4.90 cm, 4.93
cm, 5.25 cm and 4.81 cm in P2, P1, P3 and P0 treatments respectively. However, maximum (5.25 cm) fruit length
was found in P3 treatment whereas minimum fruit length was recorded in P0 (4.81 cm) which was statistically
similar to P2 (4.90 cm).
Combined effect of nitrogen and phosphorus doses showed significant variation on fruit diameter of
chilli (Table 8 and Appendix VIII). Maximum (5.60 cm) fruit length was recorded in N3P3 treatment whereas
minimum (4.27 cm) fruit length was recorded in N0P0 or control treatment. These results are are similar to that
of Lal and Pundrik (1971) and Ludilov and Ludilova (1977). Lal and Pundrik (1971) obtained highest yield due
to an improvement in fruit size in response to 80 kg N and 90 kg P.
3.8 Fruit pedicel
The effect of different doses of nitrogen application had significant influence on fruit pedicel in chilli
(Table 7 and Appendix VIII). However, result revealed that the longest fruit pedicel was recorded in N3 (2.42
cm) which was statistically similar to N2 (2.37 cm) whereas the shortest fruit pedicel was recorded in N0 (2.09
cm) which was statistically similar to N1 (2.18 cm).
The effect of different levels of phosphorus application had significant influence on fruit pedicel in chilli (Table
7 and appendix VIII). However, result showed that the longest fruit pedicel was found in P3 (2.43 cm) which
was statistically similar to P1 (2.33 cm) whereas the shortest fruit pedicel was found in P0 (2.05 cm).
Combined effect of nitrogen and phosphorus doses showed significant variation on fruit pedicel of
chilli (Table 8 and Appendix VIII). Longest (2.87 cm) fruit pedicel was recorded in N3P3 treatment whereas the
shortest (1.77 cm) fruit pedicel was recorded in N0P0 which was statistically similar to N1P3 (2.00 cm).
3.9 Fruit diameter
Significant variation was observed among the different treatments due to different doses of nitrogen in
respect of average fruit diameter of chilli (Table 7 and Appendix VIII). Fruit diameter was recorded 0.68, 0.79,
0.82 and 0.79 cm in N0, N1, N3 and N2 treatments respectively. Maximum (0.82 cm) fruit diameter was found in
N3 treatment which was statistically similar to N1 (0.79 cm) treatment whereas minimum fruit diameter was
recorded in N0 (0.68 cm) or control treatment. Roy et. al. (2011) documented the similar report on fruit diameter
of chilli. According to them length and diameter of fruits and nos. fruits per plant increased significantly with
increasing nitrogen dose at N2 treatment (100 kg N ha-1
).
Significant variation was found on fruit diameter due to the effect of different levels of phosphorus in
chilli (Table 7 and Appendix VIII). Fruit diameter was recorded 0.75, 0.76, 0.79 and 0.78 cm in P0, P1, P3 and P2
treatments respectively. Maximum (0.79 cm) fruit diameter was found in P3 treatment which was statistically
similar to P1 (0.76 cm) and P2 (0.78 cm) treatments whereas minimum fruit diameter was recorded in P0 (0.75
cm) or control treatment.
Table 7. The effect of different levels of nitrogen and phosphorous on yield contributing parameters of
chilli Treatments Fruit length (cm) Fruit pedicel(cm) Fruit diameter(cm)
Levels of Nitrogen
N0 4.74 c 2.09 b 0.68 c

Growth And Yield Of Chilli Influenced By Nitrogen And Phosphorus
DOI: 10.9790/2380-1105025468 www.iosrjournals.org 62 | Page
N1 4.89 b 2.18 b 0.79 ab
N2 5.10 a 2.37 a 0.79 b
N3 5.16 a 2.42 a 0.82 a
Levels of Phosphorus
P0 4.81 c 2.05 c 0.75 b
P1 4.93 b 2.33 ab 0.76 ab
P2 4.90 bc 2.24 b 0.78 ab
P3 5.25 a 2.43 a 0.79 a
LSD(0.05) 0.056 0.069 0.014
CV% 2.76 7.49 4.48
N0: 0 kg N ha-1
(control); N1: 100 kg N ha-1
; N2: 120 kg N ha-1
; N3: 140 kg N ha-1
and P0: 0 kg P2O5 ha-1
(control); P1: 30 kg P2O5 ha-1
; P2: 45 kg P2O5 ha-1
and P3: 60 kg P2O5 ha-1
Combined effect of nitrogen and phosphorus doses showed significant variation on fruit diameter of chilli
(Table 8 and Appendix VIII). Maximum (0.95 cm) fruit diameter was recorded in N3P3 treatment whereas
minimum (0.57 cm) fruit diameter was recorded in N0P0.
Table 8. Combined effect of different levels of nitrogen and phosphorous on yield contributing
parameters of chilli Treatments Fruit diameter (cm) Fruit pedicel (cm) Fruit length (cm)
N0P0 0.57 h 1.77 f 4.27 i
N0P1 0.72 fg 2.20 cde 4.67 gh
N0P2 0.69 g 2.23 bcde 5.00 cde
N0P3 0.74 efg 2.17 cde 5.03 cde
N1P0 0.82 bc 2.10 de 5.00 cde
N1P1 0.78 cdef 2.40 bc 4.87 efg
N1P2 0.74 efg 2.20 cde 5.13 bc
N1P3 0.85 b 2.00 ef 4.57 h
N2P0 0.80 bcd 2.16 cde 5.20 bc
N2P1 0.74 efg 2.33 bcd 5.10 bcd
N2P2 0.75 defg 2.50 b 4.90 def
N2P3 0.79 cde 2.30 bcd 4.73fgh
N3P0 0.82 bc 2.17 cde 5.13 bc
N3P1 0.80 bcd 2.40 bc 5.10 bcd
N3P2 0.77 cdef 2.40 bc 5.27 b
N3P3 0.95 a 2.87 a 5.60 a
LSD(0.05) 0.028 0.138 0.112
CV% 4.48 7.49 2.76
N0: 0 kg N ha-1
(control); N1: 100 kg N ha-1
; N2: 120 kg N ha-1
; N3: 140 kg N ha-1
and P0: 0 kg P2O5 ha-1
(control); P1: 30 kg P2O5 ha-1
; P2: 45 kg P2O5 ha-1
and P3: 60 kg P2O5 ha-1
3.10 Individual fruit weight
There was a significant variation in single fruit weight among different doses of nitrogen treatments
(Table 9 and Appendix VIII). Individual fruit weight was recorded 1.54, 2.00, 2.12 and 2.50 gm in N0, N1, N2
and N3 treatments respectively. Highest individual fruit weight (2.50) was found in N3 treatment whereas the
lowest individual fruit weight was found in N0 (1.54) or control treatment. The result showed increase in
nitrogen levels increases the fruit weight. The results also similar with Akanbi et al. (2007) who also reported
that increasing the rate of nitrogen fertilizers increases the average fruit weight and volume of pepper. This
result is also in agreement with Ahmed et al. (2007).
There was a significant variation in single fruit weight among different doses of phosphorus treatments
(Table 9 and Appendix VIII). Individual fruit weight was recorded 1.30, 1.82, 2.02 and 2.42 gm in P0, P1, P2 and
P3 treatments respectively. Highest individual fruit weight (2.42) was found in P3 treatment whereas the lowest
single fruit weight was found in P0 (1.30) or control treatment.
Table 9. The effect of different levels of nitrogen and phosphorous on yield contributing parameters of
chilli Treatments Individual fruit weight (g) Yield plant-1
(g)
Yield plot-1 (kg) Yield ha-1 (ton)
Levels of Nitrogen
N0 1.54 d 162.20 d 2.59 d 8.88 d
N1 2.00 c 200.00 c 3.20 c 10.95 c
N2 2.12 b 212.00 b 3.39 b 11.60 b

Growth And Yield Of Chilli Influenced By Nitrogen And Phosphorus
DOI: 10.9790/2380-1105025468 www.iosrjournals.org 63 | Page
N3 2.50 a 235.00 a 3.75 a 12.83 a
Levels of Phosphorus
P0 1.30 d 145.25 d 2.24 d 7.68 d
P1 1.82 c 170.55 c 2.72 c 9.33 c
P2 2.02 b 190.81 b 3.05 b 10.44 b
.P3 2.42 a 220.25 a 3.52 a 12.06 a
LSD0.05 0.016 1.297 0.021 0.0711
CV% 3.10 2.24 2.24 2.24
N0: 0 kg N ha-1
(control); N1: 100 kg N ha-1
; N2: 120 kg N ha-1
; N3: 140 kg N ha-1
and P0: 0 kg P2O5 ha-1
(control); P1: 30 kg P2O5 ha-1
; P2: 45 kg P2O5 ha-1
and P3: 60 kg P2O5 ha-1
Combined effect of nitrogen and phosphorus doses showed significant variation on single fruit weight
(Table 10 and Appendix VIII). Highest single fruit weight (2.52) was found in N3P3 treatment whereas the
lowest single fruit weight was found in N0P0 (1.56) or control treatment.
3.11 Yield of fruits plant-1
There was a significant variation on number of fruits per plant among different treatments (Table 9 and
Appendix IX). Highest number of fruits per plant was found in N3 (235.00) treatment whereas lowest number of
fruits per plant was found in N0 (162.20) or control treatment. It was revealed that at optimum level nitrogen
fertilizer gave highest yield plant-1
and increase nitrogen fertilization delayed flowering. Guohua et al. (2001)
found that flowering was delayed with increase in nitrogen fertilization due to diversion of photosynthates for
vegetative growth of plant. Shrivastava (2003) also found similar results.
Significant variation was found among the different treatments due to different doses of phosphorus in
respect of number of fruits per plant (Table 9 and Appendix IX). Highest number of fruits per plant was found in
P3 (220.25) treatment whereas lowest number of fruits per plant was found in P0 (145.25) or control treatment.
Bahuguna et al., (2014) also found an increase in fruits increasing per plant with the increasing levels of
phosphorus and the maximum number being at P2 levels in pea. Combined effect of nitrogen and phosphorus doses showed significant variation on number of fruits per
plant (Table 10 and Appendix IX). Highest number of fruits per plant (235.00) was found in N3P3 treatment
whereas whereas lowest (160.73) number of fruit per plant was found in N0P0. The high yield will obtain due to
high nitrogen and phosphorus rate. These results agree with the findings of Manchanda and Singh (1988) and
Nicola et. al. (1995) who obtained the maximum fruits per plant at higher rate of nitrogen and phosphorus.
3.12 Fruit yield plot-1
Yield of green fresh fruit of chilli was recorded 2.59, 3.20, 3.39 and 3.75 kg/plot in N0, N1, N2 and N3
treatments respectively (Table 9 and Appendix IX). Maximum (3.75 kg/plot) yield was obtained in N3 treatment
and minimum (2.59 kg/plot) was found in N0 treatment or control treatment. N fertilization significantly
increased fruit number, yield per plant and total yield comparing to control, that were in agreement with
Tumbare and Niikam (2004), Law-Ogbomo and Egharevba (2009). Jilani et al. (2008) reported that nitrogen
application @ 100 kg ha-1
significantly increased brinjal yield. Likewise, Bahuguna et al. (2014) also observed
the same results in pea.
Yield of fruits of chilli was recorded 2.24, 2.72, 3.05 and 3.52 kg/plot in P0, P1, P2 and P3 treatments respectively
(Table 9 and Appendix IX). Maximum (3.52 kg/plot) yield was obtained in P3 treatment and minimum (2.24
kg/plot) was found in P0 treatment or control treatment.
Significant influence was observed on yield of chilli per plot due to the different doses of nitrogen and
phosphorus (Table 10 and Appendix IX). The maximum yield 3.39 kg/plot was obtained from N3P3. In contrast
to the minimum (2.22 kg/plot) was observed from N0P0 or control condition. The result were similar with that of
Lal and Pundrik (1973) and Ludilov and Ludilova (1977). Lal and Pundrik (1971) obtained highest yield due to
an improvement in fruit size in response to 80 kg N, 90 kg P (N2P2). It means that recommended fertilization
will may affect the fruit size and other growth parameter as well.
Table 10. Combined effect of different levels of nitrogen and phosphorous on yield contributing
parameters of chilli Treatments Individual fruit
weight (g)
Yield plant-1
(g)
Yield plot-1 (kg) Yield ha-1 (ton)
N0P0 1.56 j 160.73 i 2.22 i 7.20 i
N0P1 1.72 hi 170.83 h 2.35 h 8.00 h
N0P2 1.66 i 206.67 def 2.78 def 9.04 def
N0P3 1.80 h 208.03 de 2.95 de 9.44 de
N1P0 1.88 g 209.33 d 3.06 d 9.74 d
N1P1 2.02 fg 188.17 gh 2.50 gh 8.13 gh

Growth And Yield Of Chilli Influenced By Nitrogen And Phosphorus
DOI: 10.9790/2380-1105025468 www.iosrjournals.org 64 | Page
N1P2 2.10 e 208.73 d 3.07 d 9.40 d
N1P3 1.89 g 189.40 fgh 2.42 fgh 8.25 fgh
N2P0 2.05 ef 215.80 c 3.15 c 10.26 c
N2P1 2.37 c 219.07 b 3.25 b 10.85 b
N2P2 2.40 b 218.17 b 3.22 b 10.82 b
N2P3 2.08 e 191.17 efg 2.65 efg 9.41 efg
N3P0 2.25 d 190.93 gh 2.58 gh 9.12 gh
N3P1 2.38 c 215.67 c 3.18 c 10.22 c
N3P2 2.36 c 216.33 c 3.17 c 10.45 c
N3P3 2.52 a 235.00 a 3.39 a 12.32 a
LSD(0.05) 0.033 2.594 0.042 0.1421
CV% 3.10 2.24 2.24 2.24
N0: 0 kg N ha-1
(control); N1: 100 kg N ha-1
; N2: 120 kg N ha-1
; N3: 140 kg N ha-1
and P0: 0 kg P2O5 ha-1
(control); P1: 30 kg P2O5 ha-1
; P2: 45 kg P2O5 ha-1
and P3: 60 kg P2O5 ha-1
3.13 Fruit yield ha-1
Yield of green fresh fruit of chilli was recorded 8.88, 10.95, 11.60 and 12.83 ton/ha in N0, N1, N2 and
N3 treatments respectively (Figure 3 and Appendix IX). Maximum (12.83 ton/ha) yield was obtained in N3
treatment and minimum (8.88 ton/ha) was found in N0 treatment or control treatment. Nitrogen fertilization
improved plant growth, but did not influence fruiting time. Jilani et al. (2008) reported that nitrogen application
@ 100 kg ha-1
significantly increased brinjal yield. In pea, Bahuguna et al. (2013) also found the same results.
N0: 0 kg N ha
-1 (control), N1: 100 kg N ha
-1, N2: 120 kg N ha
-1, N3: 140 kg N ha
-1
Fig 3. Effect of nitrogen on fruit yield ton ha-1
of chilli
Yield of fruits of chilli was recorded 7.68, 9.33, 10.44 and 12.06 ton/ha in P0, P1, P2 and P3 treatments
respectively (Figure 4 and Appendix IX). Maximum (12.06 ton/ha) yield was obtained in P3 treatment and
minimum (7.68 ton/ha) was found in P0 treatment or control treatment.
Significant influence was observed on yield of chilli per plot due to the different doses of nitrogen and
phosphorus (Figure 5 and Appendix IX). The maximum yield 12.32 ton/ha was obtained from N3P3. In contrast
to the minimum (7.20 ton/ha) was observed from N0P0 or control condition. These results are in accordance with
the findings of Tesfaw (2013) who assessed the growth and yield performance of hot pepper varieties to various
doses of nitrogen and phosphorous. Naeem et al. (2002) reported that different dozes of nitrogen and
phosphorus behaved significantly different for total yield.

Growth And Yield Of Chilli Influenced By Nitrogen And Phosphorus
DOI: 10.9790/2380-1105025468 www.iosrjournals.org 65 | Page
P0: 0 kg P2O5 ha
-1 (control), P1: 30 kg P2O5 ha
-1, P2: 45 kg P2O5 ha
-1 , P3: 60 kg P2O5 ha
-1
Fig 4. Effect of phosphorus on average fruit yield ton ha-1
of chilli
IV. Conclusion Considering the above mentioned results, it may be concluded that, different doses of nitrogen and
phosphorus varied significantly for growth and yield of chilli. The effect ofN @ 140 kg ha-1
with application
ofP2O5@ 60 kg ha-1
on chilliyield was statistically highest. It was revealed that application of 140 kg N ha-1
along with 60 kg P2O5 ha-1
(N3P3) produce maximum yield and yield contributing characters of chilli.
Refferences [1]. Ahmed, N., Baloch, M. H., Haleem, A., Ejaz, M. and Ahmed, N. 2007. Effect of different levels of nitrogen on the growth and
production of cucumber. Life Sci. Int. J., 1: 99–102. [2]. Akanbi, W. B., Togun, A. O., Akinfasoye, J. O. and Tairu, F. M. 2007. Physico-chemical properties of Eggplant (Solanum
melongena L.). fruit in response to nitrogen fertilizer and fruit size. Agricultural Journal, 2: 140-148.
[3]. Alabi, D. A. 2006. Effects of fertilizer phosphorus and poultry droppings treatments on growth and nutrient components of pepper (Capsicum annuum L.). Afr. J. Biotechnol., 5(8): 671-677.
[4]. Albaho, M., Ghloum, D., Thomas, B., Isathali, S. and George, P. 2012. Effect of two fertilizers on growth and yield of chilli pepper
and cherry tomato grown in a closed insulated pallet system. Available at the following web site: http://www.actahort.org/books/927/927_108.htm.
[5]. Aldana, M. E. 2005. Effect of phosphorus and potassium fertility on fruit quality and growth of tabasco pepper (Capsicum
frutescens) in hydroponic culture. An M. S. Thesis. Dept. of Horticulture, Louisiana State University.
[6]. Aliyu, L. 2000. Effect of organic and mineral fertilizers on growth, yield and composition of pepper (Capsicum annuum L.). An Int.
J. for Sustainable Production Systems. 18(1): 29-36.
[7]. Aliyu, L., Yahaya, R. A., Arunah, U. L. and Haruna, I. M. 2012. Response of two chilli pepper varieties (Capsicum frutescens L.) to harvesting frequency. Elixir Agric., 42: 6493-6495.
[8]. Alonso, B. M., Tijerina, C. L., Sanchez, G. P., Aceves, N. L. A., Escalante, E. A. J., Martinez G. A. 2002. Jalapeno pepper
production under fertigation as a function of soil-water tension, nitrogen and potassium nutrition. Terra Latinoamericana, 20(2): 209-215.
[9]. Aminifard, M. H., Aroiee, H., Ameri, A. and Fatemi, H. 2012. Effect of plant density and nitrogen fertilizer on growth, yield and
fruit quality of sweet pepper (Capsicum annum L.). Afr. J. Agric. Res., 7(6): 859-866. [10]. Anita, B., Nawirska, A. A., Alicja, K. and Sokol-Letowska, A. 2009. The effect of nitrogen fertilization methods on yield and
chemical composition of pumpkin (Cucurbita maxima) fruits before and after storage. Veg. Crops Res. Bulletin, 70: 203–211.
[11]. Anon. 1972. Vegetable production in the subtropics and tropics overseas. Technical Co-operation Agency Japan. Text Book Series, pp. 146-157.
[12]. Ayodele, O. J., Alabi, E. O. and Aluko, M. 2015. Nitrogen fertilizer effects on growth, yield and chemical composition of hot
pepper (Rodo). Int. J. Agric. Crop Sci., 8(5): 666-673. [13]. Ayodele, V. I. 2002. Influence of nitrogen fertilisation on yield of Amaranthus species. J. Acta. Hort., 571: 89–95.
[14]. Bahuguna, A., Singh, B. and Bahuguna, S. 2014. Consequence of optimum levels of fertilizer on enlargement and yield of vegetable
pea cv. VL ageti matar 7 under Uttarakhand hills condition, J. Agron., 13(3): 153-157. [15]. Bahuguna, A., Mengwal, B. S., Nautiyal, B. P. and Bahuguna, S. 2016. Effects of nitrogen, phosphorus and potash with
vermicompost efficiency on the growth and yield attributes of sweet pepper (Capsicum frutescens) under uttarakhand hills condition. World J. Pharmacy And Pharmaceutical Sci. 5(2): 588-597.
[16]. Bajaj, K. L., Kaur, G., Sing, J. and Brar, J. S. 1979. Effect of nitrogen and phosphorus levels on nutritive values of Sweet
Peppers (Capsicum annum L.) fruits. Qual. Pl., 28(4): 287-292. [17]. Baloch, P. A., Solangi, A. H. and Siddiqui, A. A. 2013. Growth and yield characteristics of chilli as affected by nitrogen in presence
and absence of phosphorus and potassium. Series B. Biological Sciences, 56(2): 70-75.
[18]. Bhatnagar, D. K. and Pandita, M. L. 1980. A note on the effect of nitrogen, phosphorus and spacing on growth and yield of tomato cultivar HS-102. Haryana J. Hort. Sci., 8(1/2): 73-75.
[19]. Bhuvaneswari, G., Sivaranjani, R., Reetha,; S. and Ramakrishan, K. 2014. Application of nitrogen fertilizer on plant density,
growth, yield and fruit of bell peppers (Capsicum annuum L.). Int. Letters Natural Sci., 13: 81-90. [20]. Boroujerdnia, M. and Ansari, N. 2007. Effect of different levels of nitrogen fertilizer and cultivars on growth, yield and yield
components of romaine lettuce (Lactuca sativa L.). Middle Eastern and Russian J. Plant Sci. and Biotech., 1: 47–53.
[21]. Bose, T. K. and Som, M. G. 1986. Vegetable crops in India. Naya Prokash, Calcutta-six. India. P. 44.

Growth And Yield Of Chilli Influenced By Nitrogen And Phosphorus
DOI: 10.9790/2380-1105025468 www.iosrjournals.org 66 | Page
[22]. Buckman, H. O. and Brady, N. C. 1980. The nature and properties of soils. Eurasis Publishing House (P) Ltd. New Delhi-110055.
pp. 456-457.
[23]. Chauhan, V. L., Singh, R. V. and Raghav, M. 2005. Optimum nitrogen and phosphorus fertilization in hybrid capsicum. Department of Vegetable Science, GBPUAT Hill Campus, Ranichauri 249 199 (Uttaranchal), India. Vegetable Sci., 32(2): 200-202.
[24]. Covarelli, G. 1977. The effect of manuring on the quantative and qualitative yield of capsicum. Rivista da Agronomis. 10: 178-186.
[25]. Damke, M. M., Kawarkhe, V. J. and Patil, C. U. 1990. Effect of phosphorus and potassium on the growth and yield of chilli, PKV Res. J., 12:110-114.
[26]. Devlin, R. M. 1972. Plant Physiology. Affiliated East West Press Ltd. New Delhi, p. 442.
[27]. Diaz, D. C., Seal, D., Mannion, C., Waddil, C. and Liburd, O. 2013. The effect of nitrogen on population dynamics of the chilli thrips, Scirtothrips dorsalis (Thysanoptera: Thripidae), on hydroponically grown jalapeño pepper (Capsicum annuum). Proc. Fla.
State Hort. Soc., 126: 136-141.
[28]. Emongor, V. E. and Mabe, O. 2012. Effects of phosphorus on growth, yield and yield components of chilli pepper (Capsicum annuum L.). Available at the following web site: http://www.actahort.org/books/936/936_42.htm.
[29]. GASTAL, F. AND LEMAIRE, G. 2002. N UPTAKE AND DISTRIBUTION IN CROPS: AN AGRONOMICAL AND ECOPHYSIOLOGICAL
PERSPECTIVE. J. EXP. BOT., 53: 789–799. [30]. Ghoneim, I.M. 2005. Effect of nitrogen fertilization and its application systems on vegetative growth, fruit yield and quality of
sweet pepper. J. Agric. Env. Sci., 4(2): 58-77.
[31]. Grindlay, D. J. C. 1997. Towards an explanation of crop nitrogen demand based on the optimization of leaf nitrogen per unit leaf area. J. Agril. Sci., Cambridge128: 377–396.
[32]. Guohua, X. U, W., S. and Kofkafi, U. 2001. Interaction effect of nutrient concentration and container volume on flowering, fruiting
and nutrient uptake of sweet pepper. J. Plant Nutri., 24(3): 479-501. [33]. Gupta, C. R. and Sangar, S. S. 2000. Response of tomato (Lycopersicon esculentum Mill.) to nitrogen and potassium fertilization in
acidic soil of Bastar. Veg. Sci., 27(1): 94-95.
[34]. Hasanuzzaman, S. M. 1999. Effect of hormone on yield of bell pepper (Capsicum annum L.) An MS thesis, BAU, Mymensingh, 2(5): 78-84.
[35]. Hassan, S. A., Abidin, R. Z. and Ramlan, M. F. 1995. Growth and yield of chilli (capsicum annuum l.) in response to mulching and
potassium fertilization. Pertanika. J. Trap. Agric. Sci. 18(2): 113-117. [36]. Hassan, S. A., Gerber, J. M. and Splittstoesser, W. E. 1993. Growth and yield potential of green pepper as affected by nitrogen at
transplanting. J. Trop. Agric. Sci., 16(2): 101-105.
[37]. Hochmuth, G. J., Shuler, K. D., Mitchell, R. L. and Gilreath, P. R. 1987. Nitrogen crop nutrient requirement demonstrations for mulched pepper in Florida. Proc. Fla. State Hort. Soc., 100: 205-209.
[38]. Hossain, M. Z. 1990. Effect of nitrogen and sulphur on growth, yield and nutrient content of rice. An M. Sc. thesis, Department of
Soil Science, Bangladesh Agricultural University, Mymensingh, P: 17. [39]. Huez-Lopez, M. A.., Ulery, A. L., Samani, Z., Picchioni, G. and Flynn, R. P. 2011. Response of chilli peeper (Capsicum annuum
L.) to salt stress and organic and inorganic nitrogen sources: II. Nitrogen and water use efficiencies and salt tolerance. Tropical and
Subtropical Agroecosystems, 14: 757-763. [40]. Iqbal, S., Inam, A. and Sahay, S. 2014. Promotion of biomass, photosynthetic rate, yield and quality characteristics of chilli
(Capcicum annuum L.) by interactive effect of nitrogenous fertilizers and wastewater. J. Glob. Bios., 3(1): 345-353. [41]. Jadhav, P. B., Dekhane, S. S., Saravaiya, S. N., Tekale, G. S., Patil, S. J., Patel, D. J. 2014. Effect of nitrogen fixing Azotobacter
and Azospirillum on growth and yield of chilli (Capsicum spp. l.) cv. Acharya. Int. J. Innovative Research and Studies, 3(5): 828-
832. [42]. Jilani, M. S., Afzaal, M. F. and Waseem, K. 2008. Effect of different nitrogen levels on growth and yield of brinjal. J. Agric. Res.,
46: 245–251.
[43]. Johnson, C. D. and Decoteau, D. R. 1996. Nitrogen and potassium fertility affects jalapeno pepper plant growth, pod yield, and pungency. Hort. Sci., 31(7): 1119-1123.
[44]. Khan, A., Shah, S. N. M., Sajid, M., Ali, K. Ahmed, A.and Faisal, S. 2014. Influence of nitrogen and potassium levels on growth
and yield of chillies (capsicum annuum L.). Intl. J. Farm Alli. Sci., 3(3): 260-264. [45]. Khan, M. S. I., Roy, S. S. and Pall, K. K. 2010. Nitrogen and phosphorus efficiency on the growth and yield attributes of capsicum.
Academic J. Pl. Sci., 3(2): 71-78.
[46]. Khan, Z., Tiyagi, S. A., Mahmood, I. and Rizvi, R. 2012. Effects of N fertilization, organic matter, and biofertilisers on the growth and yield of chilli in relation to management of plant-parasitic nematodes. Turk J. Bot., 36: 73-81.
[47]. Kinet, J. M., Sachs, R. M. and Bernier, G. 1985. The Physiology of Flowering. Vol. I. CRC Press Inc., pp. 93-160.
[48]. Knavel, D. E. 1977. The influence of nitrogen on pepper transplant growth and yielding potential of plants grown with different levels of soil nitrogen. Amer. Soc. Hort. Sd. 102: 533-535.
[49]. Kotur, S. C., Ramesh, P. R., Anjaneyulu, K. and Ramachandran, V. 2010. Direct and residual effect of nitrogen in high yielding
hybrid chilli (Capsicum annuum)–radish (Raphanus sativus) system. Indian J. Agri. Sci., 80(7). [50]. Lal, N. and Pundrik, K. C. 1971. Effect of nitrogen, phosphorus and potassium on the growth and yield of chilli. Punjab Hort. J.,
11:82-86.
[51]. Law-Ogbomo, K. E. and Egharevba, R. K. A. 2009. Effects of planting density and NPK fertilizer application on yield and yield components of tomato (Lycopersicum esculentum Mill.) in forest Location. World J. Agril. Sci., 5: 152–158.
[52]. Lemaire, G. 2001, Ecophysiology of grassland: Dynamic aspects of forage plant population in grazed swards. In Proceedings of the
XIX International Grassland Congress, Brazil. pp. 29-37. [53]. Locsacio, S. J., Fiskell, J. G. A. and Martin, F. C. 1981. Response of bell pepper to nitrogen sources. Amer. Soc. Hort. Sci., 106:
628-632.
[54]. Ludilov, V. A. and Ludilova, M. I. 1976. Application of high rate of mineral fertilizers in capsicum and eggplants. Nauchnya Trudy Nil Ovoshch. Kh-va. 3: 50-53.
[55]. Ludilov, V. A. and Ludilova, M. I. 1977. The effect of high fertilizer rate on the yield and quality of the sweet peppers.
Biryuchekutskaya Ovochnaya Stantsiya, USSR, 15: 50-53. [56]. Manchanda, A. K. and Singh, B. 1988. Effect of plant density and nitrogen on growth and fruit yield of bell paper. Indian J. Agric.,
33: 445-447.
[57]. Mavengahama, S., Ogunlela, V. B. and Mariga, D. I. K. 2003. Response of paprika (Capsicum annuum L.) to different basal fertilizers. African Crop Sci. Conference Proc., 6: 9-13.

Growth And Yield Of Chilli Influenced By Nitrogen And Phosphorus
DOI: 10.9790/2380-1105025468 www.iosrjournals.org 67 | Page
[58]. Medina-Lara, F., Echevarrıa-Machado, I., Pacheco-Arjona, R., Ruiz-Lau, N., Guzma n-Antonio, A., and Martinez-Estevez, M.
(2008). Influence of nitrogen and potassium fertilization on fruiting and capsaicin content in habanero pepper (Capsicum chinense
jacq.). Hort. Sci., 43(5): 1549-1554. [59]. Mozafar, A. 1993. Nitrogen fertilization and the amount of vitamins in plant. J. Plant Nutrition, 16: 2479–2506.
[60]. Mujiyati and Supriyadi 2009. Effect of manure and NPK to increase soil bacterial population of Azotobacter and Azospirillus in
chilli (Capsicum annum) cultivation. Biosci., 1(2): 59-64. [61]. Murugan, M. 2001. Quality of chilli (Capsicum annuum L.) variety Co-3 as influenced by levels and sources of phosphorus and
levels of nitrogen. J. Spices & Aromatic crops, 10(1): 1-5.
[62]. Naeem, N., Muhammad, I., Khan, J., Nabi, G., Muhammad, N. and Badshah, N. 2002. Influence of various levels of nitrogen and phosphorus on the growth and yield of chilli. Asian J. Pl. Sci., 1(5): 599-601.
[63]. Nicola, S., L. Basoccu, G. Serra, Tongoni, F. and Leoni, S. 1995. Pretransplant nutritional conditioning affects pepper seedling
growth and yield. International symposium on new cultivation systems in greenhouse, Cagliari, Italy, 26-30 April, 1993. Acta-Hort., 361:519-526.
[64]. Núñez-Ramírez, F., González-Mendoza, D., Grimaldo-Juárez, O., Diaz, L. C. 2011. Nitrogen fertilization effect on antioxidants
compounds in fruits of Habanero chili pepper (Capsicum chinense). Int. J. Agric. Biol., 13(5): 827-830. [65]. Obreza, T. A. and Vavrina, C. S. 1993. Production of root crops in relation to nitrogen source, rate and leaf nutrient concentration in
soil science and plant analysis, 24: 13-14.
[66]. Opena, R. T., Kuo, C.C. and J. Y. Yoon. 1988. Breeding and seed production of root crops in the tropics and subtropics. Tech. Bul. 17, AVRDC. P-97.
[67]. Pandey, A. K., Singh, A. K. and Singh, S. K. 2013. Effect of drip irrigation, spacing and nitrogen fertigation on productivity of
chilli (Capsicum annuum L.). Environ. Ecol., 31(1): 139-142. [68]. Payero, J. O., Bhangoo, M. S. and Steiner, J. J. 1990. Nitrogen fertilizer management practices to enhance seed production by
‘Anaheim Chili’ peppers. J. Amer. Soc. Hort. Sci., 115(2): 245-251.
[69]. Peck, N. H. and MacDonald, G. E. 1975. Plant response to concentrated superphosphate KCl fertilizer for sweat corn (Zea mays L.) var. rugosa. New York State Experimental Station Search, 2: 1-8.
[70]. Rao, D. G. and Subramanian, V. B. 1990. Effect of on nodulation, N harvest index and growth correlations between nodulation and
other plant parts in cowpea under well-watered and dryland conditions. Indian J. Plant Physiol. 33: 275-281. [71]. Reddy, K. B., Reddy, D. S. and Reddy, C. M. 1991. Evaluation of groundnut genotypes for phosphorus use efficiency. Indian J.
Plant Physiol., 34: 228-234.
[72]. Revanappa, U. G. N. and Madalageri, B. B. 1998. Influence of nitrogen on branching, dry matter production and yield of green chilli. Karnataka. J. Agric. Sci., 11(2): 458-461.
[73]. Reyes, L. M., Sanders, D. C. and Buhler, W.G. 2008. Evaluation of slow-release fertilizers on bell pepper. Hort. Technol., 18(3):
393-396. [74]. Roy, S. S., Khan, M. S. I. and Pall, K. K. 2011. Nitrogen and phosphorus efficiency on the fruit size and yield of capsicum. J. Exp.
Sci., 2(1): 32-37.
[75]. Sajan, K. M., Gowda, K. K., Kumar, S. N. and Sreeramu, B. S. 2002. Effect of bio-fertilizers on growth and yield of chilli (Capsicum annuum L.) cv Byadagi Dabba at different levels of nitrogen and phosphorus. J. Spices & Aromatic Crops., 11(1): 58-
61. [76]. SAJID, M., ISHTIAQ, M., AMIN, N., ARIF, M. AND REHMAN, Z. 2001. EFFECT OF NITROGEN AND PHOSPHOROUS ON GROWTH AND
YIELD OF RED CHILLIES. AVAILABLE AT THE FOLLOWING WEB SITE:
HTTP://AGRIS.FAO.ORG/AOS/RECORDS/PK2002000393?OUTPUT=XML. [77]. Santos, B. M., Dusky, J. A., Stall, W. M., Bewick, T. A. and Shilling, D. G. 2004. Mechanisms of interference of smooth pigweed
and common purslane on lettuce as influenced by phosphorus fertility. Weed Sci., 52(1): 78-82.
[78]. Sarma, U. J., Baruah, J. P. J., Suhrawardy, B. D. Narzary, and Chakravarty, M. 2004. Effect of various NPK levels on yield and capsaicin content in direct seeded chilli (Capsicum annum). Indian J. Hill Farming., 17(1/2): 15-18.
[79]. Shoemaker, J. S. and Teskey, B. J. E. 1995. Practical Horticulture. John Willy and Sons, Inc. New York., p. 371.
[80]. Shukla, V and Nair, L. B. 1993. Agro-techniques for solanaceous vegetable. Advanced in Hort., 5(1):371. [81]. Silva, M. A. G., Boaretto, A. E., Melo, A. M. T., Fernandes, H. M. G., Scivittaro, W. B. (1999). Fruit yield and quality of sweet
pepper grown in protected environment, influenced by nitrogen and potassium fertilization. Sci. Agric., 56(4).
[82]. Simon and Tesfaye 2014. Growth and productivity of hot pepper (Capsicum annuum L.) as affected by variety, nitrogen and phosphorous at Jinka, Southern Ethiopia. Res. J. Agric. Environ. Manage., 3(9): 427-433.
[83]. Singegol, H. Y., Patil, H. B. and Patil, D. R. 2007. Growth and yield of green chilli (Capsium annuum cv.) pusa jwala as influenced
by nitrogen and phosphorus. Asian J. Hort., 2(2): 184-187. [84]. Singh, D. K. and Jain, S. K. 2004. Interaction effect of nitrogen and phosphorus on yield and economics of chilli (Capsicum annum
L.), cv. Pant C-1. India. Sci. Hort., 9: 97-100.
[85]. Singh, k. and Kumar, S. 1969. Effect of nitrogen and phosphorus fertilization on the growth and yield of onion (Allium cepa L.). J. Res. Ludhiana., 6:764-768.
[86]. Singh, L. and Mukherjee, S. 2000. Effect of foliar application of urea and NAA on yield and yield attributes of chilli (Capsicum
annuum var : longum). J. Agril. Sci. Digest., 20(2): 116-117. [87]. Srivastava, B. K., Singh, M. P. and Joshi, K. 2003. Standardization of nitrogen and phosphorus requirement for capsicum hybrid.
Prog. Hort., 35(2): 202-204.
[88]. Stroehlein, J. L. and Oebker, N. F. 1979. Effects of nitrogen and phosphorus on yields and tissue analyses of chilli peppers. Communications in Soil Sci. and Plant Analysis. 10(3): 551-563.
[89]. Suryakumari, S., Bharathi, S.; Jyothi, K. U. and Reddy, P. V. 2015. Effect of nitrogen and potassium sources on yield attributes and
yield of chilli (Capsicum annuum L.). J. Spices & Aromatic crops. 24 (2): 137-140. [90]. Taylor, G., McDonald, A. J. S., Stadenberg, I. and Freer-Smith, P. H. 1993. Nitrate supply and the biophysics of leaf growth in
Salix viminalis. J. Exp. Bot., 44: 155– 164.
[91]. Tesfaw, A. N., Dechassa and Kebede, W. T. 2013. Performance of hot pepper (Cupsicum annuum L.) varieties as influenced by nitrogen and phosphorus fertilizers at bure, upper watershed of the blue nile in Northwestern Ethiopia. Int. J. Agric. Sci., 3(8): 599-
608.
[92]. Teshm Tadesse Michale, A.,Thomas, J. R. and Heilmm, M. D. 1999. Nutrient conductivity effects on sweet pepper plants grown using on a nutrient technique. New Zealand J. Crop & Hort. Sci., 5(1): 45-49.
[93]. Thomas, M. B. and Leong, A. G. B. 1985. The influence of nutrition on production of container-grown ornamental peppers.
Availabe at the following website: https://researcharchive.lincoln.ac.nz/handle/10182/2705.

Growth And Yield Of Chilli Influenced By Nitrogen And Phosphorus
DOI: 10.9790/2380-1105025468 www.iosrjournals.org 68 | Page
[94]. Tumbare, A. D. and Bhoite, S. U. 2002. Effect of solid soluble fertilizer applied through fertigation on growth and yield of chilli
(Capsicum annum). Mahatma Phule Krishi Vidyapeeth, Rahuri, Maharashtra 413 722, India. Indian J. Agric. Sci., 72(2): 109-111.
[95]. Tumbare, A. D. and Niikam, D. R. 2004. Effect of planting and fertigation on growth and yield of green chili (Capsicum annuum). Indian J. Agril. Sci., 74: 242–245.
[96]. Wahocho, N. A., Sheikh, Z. A., Jogi, Q., Talpur, K. H. and Leghari, S. J. 2016. Growth and productivity of chilli (Capsicum
annuum L.) under various nitrogen levels. Sci. Int. Lahore. 28(2): 1321-1326. [97]. Wiedenfeld, R. P. 1986. Rate, timing, and slowrelease nitrogen fertilizer on bell peppers and muskmelon. HortScience. 21: 233-235.
[98]. Yasuor, H., Ben-Gal, A. and Yermiyahu, U. 2013. Nitrogen management of greenhouse pepper production: agronomic, nutritional,
and environmental implications. HortScience, 48(10): 1241-1249. [99]. Yodpetch, C. 1997. Study on the optimum fertilizer rates on yield and quality of three long cayenne peppers (Capsicum annum L.).
J. Exp. Sci., 32(5): 37-45.
Tania Sultana. “Growth And Yield of Chilli Influenced By Nitrogen And Phosphorus." IOSR
Journal of Agriculture and Veterinary Science (IOSR-JAVS) 11.5 (2018): 54-68.


![Changes in composition of epigeic invertebrate communities (with accent on spiders) in Carpathian alpine meadows influenced by added nitrogen and phosphorus [Peter Gajdos]](https://static.fdocuments.in/doc/165x107/54c0656d4a79596e0b8b45ea/changes-in-composition-of-epigeic-invertebrate-communities-with-accent-on-spiders-in-carpathian-alpine-meadows-influenced-by-added-nitrogen-and-phosphorus-peter-gajdos.jpg)