Growing RMs’ Knowledge of Internet...
44
1 Tuesday, May 25, 2010 Tuesday, May 25, 2010 2:00 2:00 – 3:30 PM EDT 3:30 PM EDT Growing RMs’ Knowledge of Internet Marketing 2 Overview of Format and Topic Overview of Format and Topic Webinar Moderator Fran Brasseux Executive Vice President, HSMAI
Transcript of Growing RMs’ Knowledge of Internet...

1
Tuesday, May 25, 2010Tuesday, May 25, 20102:00 2:00 –– 3:30 PM EDT3:30 PM EDT
Growing RMs’ Knowledge of Internet Marketing
2
Overview of Format and TopicOverview of Format and Topic
Webinar ModeratorFran BrasseuxExecutive Vice President, HSMAI

3
HSMAI University Alliance PartnersHSMAI University Alliance Partners
4
POLL QUESTION #1POLL QUESTION #1How many people are participating in
this webinar at your location today?
� 1
� 2
� 3
� 4
� 5
� 6
� 7
� 8 or more

5
Panel Moderator: Jeff Higley, VP,
Digital Media & Communications
HotelNewsNow/STR STR/STR Global
6
TodayToday’’s Presenters: s Presenters: Panel Moderator: Jeff Higley, VP, Digital Media and Communications, HotelNewsNow.com/STR/STR Global
Panelists:
Bobby Bowers,
Senior VP, STR
Trevor Stuart-Hill,
President,
Revenue Matters
C. A. Clark, VP,
Electronic Publishing,
Miles Media
Nick Cohen,
Senior E-Marketing Mngr.,
Sabre Hospitality
Loren Gray,Director of E-Commerce,Ocean Properties, Ltd.

HSMAIRevPar – Past, Present & Future
25 May 2010 Bobby Bowers
Smith Travel Research /
STR Global
www.strglobal.com
615.824.8664 x3321
Want a copy of the STR portion of the presentation?
Have questions about the presentation?

Total United StatesKey Performance Indicators Percent ChangeApril 2010 – Trailing 12 Months & Year-to-Date
Total United StatesWeekday / Weekend Percent ChangeApril 2010 YTD
Weekends = Friday / Saturday

Total United StatesRevPAR - Monthly Percent ChangeJanuary 2008 – April 2010
20092008
Total United StatesOccupancy - Monthly Percent ChangeJanuary 2008 – April 2010
20092008

Total United StatesAverage Daily Rate - Monthly Percent ChangeJanuary 2008 – April 2010
20092008
Total United StatesRoom Supply/Demand Percent ChangeTwelve Month Moving Average – 1989 to April 2010
2008 Smith Travel Research, Inc.
2.9%
-1.7%
-1.1%
- 4.8%
-6.6

Total United StatesOccupancy/ADR Percent ChangeTwelve Month Moving Average – 1989 to April 2010
-3.4%
-6.8%
-4.5%
-7.4%
-4.7%
0.1%
Total United StatesRevPAR Percent ChangeTwelve Month Moving Average – 1989 to April 2010
2008 Smith Travel Research, Inc.
-10.5%
- 11.5%

Chain Scales
STR Chain ScalesSelected Brands by Category
• Luxury – Four Seasons, Ritz Carlton, Fairmont
• Upper Upscale – Marriott, Hilton, Hyatt, Sheraton
• Upscale – Cambria, Courtyard, Hilton Garden Inn
• Midscale with F&B – Ramada, Holiday Inn, Best Western
• Midscale no F&B – Comfort Inn, Fairfield Inn, H.I. Express
• Economy – Econolodge, Days Inn, Red Roof

Chain ScalesSupply/Demand Percent ChangeApril 2010 YTD
Chain ScalesOccupancy/ADR Percent ChangeApril 2010 YTD

Luxury, Upper Upscale, Upper Tier IndependentsTransient / Group - Percent ChangeApril 2010 YTD
Markets

Top 25 Markets versus rest of U.S.Key Performance Indicators Percent ChangeApril 2010 YTD
Key 15 MarketsRevPar Percent ChangeApril 2010 YTD
Excludes Las Vegas

Key 15 MarketsOccupancy Percent ChangeApril 2010 YTD
Excludes Las Vegas
Key 15 MarketsADR Percent ChangeApril 2010 YTD
Excludes Las Vegas

Projections
U.S. Economic OutlookBlue Chip Economic Indicators – May 2010
2009 2010F 2011F
Real GDP -2.4% +3.2% +3.1%
CPI -0.4% +2.0% +1.9%
Corporate Profits -3.8% +19.4% +8.1 %
Disp Personal Income +0.9% +1.3% +2.6%
Unemployment Rate 9.3% 9.6% 8.9%

Total United StatesActive Development Pipeline - RoomsChange From Prior Year
April 2010 April 2009 Change % Chg
In Construction 77,404 170,242 -92,838 -54.5%
“Planned” Pipeline 289,676 363,326 -73,650 -20.3%
Planned Pipeline includes projects in Final Plannin g and Planning phases
Source: STR / TWR / Dodge Construction Pipeline
Total United StatesKey Performance Indicators Percent ChangeFull Year 2009 Actual & 2010 / 2011 Forecast

Total United StatesKey Performance Indicator Outlook Scenario
2010E by Chain Scale
2010 Year End Scenarios
Chain Scale
Occupancy
(% chg)
ADR
(% chg)
RevPAR
(% chg)
Base Best Worst Base Best Worst Base Best Worst
Luxury 5.7 7.3% 4.6% -3.7 -2.3% -4.7% 1.8 4.9% -0.2%
Upper Upscale 3.3 4.8% 2.3% -2.0 -0.5% -3.0% 1.2 4.3% -0.8%
Upscale 2.6 4.1% 1.6% -4.5 -3.1% -5.5% -2.0 1.0% -3.9%
Midscale w/ F&B -1.0 0.5% -2.0% -2.3 -0.8% -3.3% -3.4 -0.4% -5.3%
Midscale w/o F&B 1.3 2.8% 0.3% -2.0 -0.5% -3.0% -0.7 2.4% -2.6%
Economy 1.0 2.3% -0.2% -4.3 -2.9% -5.3% -3.4 -0.6% -5.5%
Independent 1.9 3.4% 0.9% -2.3 -0.8% -3.3% -0.4 2.6% -2.4%
Takeaways
• Performance trough likely past• Supply growth slowing• Demand slowly improving• ADR weakness continues • Moderate improvement 2010• Meaningful growth anticipated 2011• Value is king

33
Trevor Stuart-Hill,
President,
Revenue Matters
34
The 5 Internet Models
� Retail
� Wholesale (Merchant)
� Opaque
� Auction
� Referral

35
Retail Model
Commissionable – normally 10%
36
Retail Model

37
Merchant Model (hotel only path)
•Net Rate Structure
•Merchant of Record
•Promotions
•On Line Advertising
•Direct Marketing
•Stores & Mini-Sites
Question: How well do you know your Market Manager?
38
Merchant Model

39
Opaque Model
•Net Rate Pricing
•Something is hidden from consumer
(Price or Product)
40
Opaque Model
� Room Only – “Brand Shield”
� Packages – “Price Shield”

41
Auction Model
•Net Rate Pricing
•Customers bid on Product
•May have an Opaque element to it
42
Auction Model

43
Referral Model
•Call to action is defined by supplier
•PPC, Listing Fees or Commissions
44
Referral Model
� Consumer Searches
� Links to your website for booking
� Channel Connect through RedX

45
Referral Model
� Web site
� Top 20 Newsletter
� Referral Model - Hotel Direct Bookings
� Advertising Program
46
Referral Model
� Travel journals, reviews and photos
� Travel planning
� CPC Advertising
� Targeted Text & Travel Deal Links
� On Line Advertising
� Pick of the Week Destination Advertising

47
Strategic Approach
RetailWholesaleWholesale 2OpaqueAuctionReferral
-365 -300 -240 -210 -150 -90 -60 -30 -15 -5 0
Integrated Model
Days prior to Arrival
One look at an integrated model of online distribution options.
48
Other Factors to Consider
� Contribution Potential (tracking)
� Room and Ancillary Revenue
� Distribution Costs (and production)
� Cannibalism
� Ease of Management
� Marketing Exposure (billboard effect)
� Relationships!

49
Nick Cohen,
Senior E-Marketing Mngr.,
Sabre Hospitality
50
Maintaining Revenue Management Strategy Through Your Proprietary Internet Presence
� Search Engine Optimization
� Search Engine Advertising (Pay-Per-Click)
� Linkage and Interactive Media

51
Search Engine Optimization
SEO is directly related to yourWebsite’s visibilityin the organic results of the Search Engines
52

53
Search Engine Optimization
As a revenue manager, are you thinking about the following?
� Based on my target markets, what keywords should my Website be appearing for and is my Website optimized for these terms?
� Am I talking to my team internally about my organic keyword strategy?
� Are the Search Engines driving qualified traffic to my Site and resulting in conversion?
� What keywords are my comp set appearing for in the Search Engines?
54
Search Engine Optimization
Tracking Search Engine Conversion
Keyword search
YOUR WEBSITE $
Booking Engine Transaction

55
Search Engine Optimization
Know your competitive set’s keyword strategy
Available Tools:
� SpyFu
� Google AdWords
56
Search Engine Advertising (Pay-Per-Click)

57
Search Engine Advertising (Pay-Per-Click)
As a revenue manager, are you thinking about the following?
� Am I targeting keywords to complement my SEO program?
� Are my keywords and ad copy constantly changing seasonally as Ipromote new rates/offers? Rate parity applies to PPC too!
� Is my PPC campaign driving qualified traffic to my Site and resulting in conversion?
� What keywords/ad copy are my comp set running in paid search?
58
Search Engine Advertising (Pay-Per-Click)
Strategies to keep in mind:
� Targeted and localized keywords will generally have higher conversion rates than broad terms (‘NYC boutique luxury hotels’ vs. ‘NYC hotels’)
� Buy Your Brand Name - This gives you more exposure in the SE’s (owning the search result page), allows you to promote offers, and places you amongst the 3rd party sites and competitors
Available Tools:
� SpyFu� Google AdWords

59
Linkage and Interactive Media
What is Link Building?
� Link popularity helps support SEO
� It’s not simply the number of links, but the quality of links which connect to your Site
� Consider directories (Yahoo, DMOZ) and localized linkage (CVB’s, University Sites)
60
Linkage and Interactive Media
Interactive Media Categories include:
� Annual (i.e. TripAdvisor, CitySearch)
� Branding (i.e. Yahoo Travel)
� Promotional (i.e. Kayak, SmarterTravel, TravelZoo)
61
Linkage and Interactive Media
Source: Google
Travel Site Visits Made Per Consumer 30 Days Before Booking
62
Linkage and Interactive Media
Promotional media is an excellent way to complement your revenuemanagement strategy
� Consider promotional media during your most important need periods
� Keep your booking window in mind when running this type of media
� Know what sites your competition is on
Available Tools:� AdGooRoo� Google AdPlanner

63
Emerging Technology
3rd Party and Search Engine content integration
64
Emerging Technology
Semantic Web

65
C. A. Clark, VP,
Electronic Publishing,
Miles Media
66
Measuring Performance
What should you be paying attention to?

67
Traffic
How many individuals looked at your site?
Measuring Traffic
Visits: browsing sessions in a time periodVisits: browsing sessions in a time period
Visitors: new vs. returningVisitors: new vs. returning
Uniques: by day, week or monthUniques: by day, week or month
69
Bounce Rate
How many people actually stayed long enough to do
something?
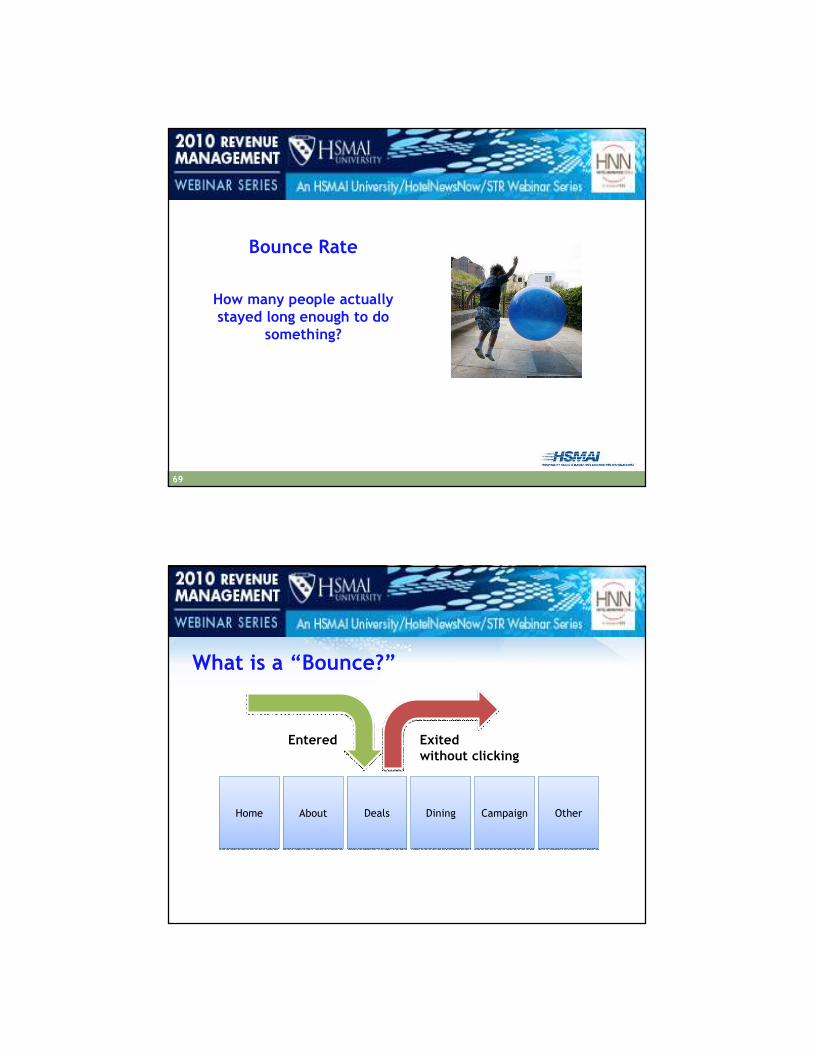
What is a “Bounce?”
HomeHome AboutAbout DealsDeals DiningDining CampaignCampaign OtherOther
Entered Exited without clicking

71
Why is Bounce important?
$10,000 Campaign
20,000 Visitors
20% Bounce
$.63/response
$10,000 Campaign
20,000 Visitors
80% Bounce
$2.50/response
72
Click Through Rate (CTR)
How many people clicked through

10%
15%
50%
30%
1%
Buying Funnel
Campaign or Advertisement
Landing Page
Room Types
Amenities
Booking Engine
BOOK!
74
Conversion Rate
The bottom line

2%
Look-to-Book
Campaign or Advertisement
Landing Page
Room Types
Amenities
Booking Engine
BOOK!
76
Loren Gray,Director of E-Commerce,Ocean Properties, Ltd.

77
Let’s Do Some Quick Math For PPC (Pay Per Click) Campaigns
1. Impressions – 10,000
2. ‘Click Through Rate’ (CTR) – 3.5% =350
3. ‘Bounce Rate’ – 40% (350-140)=210
4. Conversation Rate – 10% (210X.10)= 21 bookings
5. ‘Length of Stay’ (LOS) – 2.5 days (21X2.5)= 52.5 nights
6. ‘Average Daily Rate’ (ADR) - $100 (100X52.5)= $5,250
7. ‘Cost Per Click’ (CPC) - $1.10 (350X1.10)= $385
8. ‘Return On Investment’ (ROI) – 13 to 1 (5,250 / 385)
Now Some Questions to ask….
•What is the minimum acceptable ROI threshold?
•How do I calculate it?
•What is the benefit to my revenue management strategy?
78
Revenue Management Practices in eCommerce
Accounting For Market Segmentations And Their Percentage Contributions
35%
65%
% Cost Per Channel
Channel Contribution %
10%
20%*
25%
45%
10%*
20%
*Is represented in the reservation center if unbranded

79
Revenue Management By Channel Contribution
Transient Breakdown By Channel – example; $100 ADR Total Forecasted Revenue $100,000 (1000 RmNts)
•OTA- 100 Room Nights @ 25% cost = $75 ADR = $7,500
•Brand – 200 Room Nights @ 10% cost = $90 ADR = $18,000*
•Internet- 250 Room Nights @ 10% cost= $90 ADR = $22,500
•Reservation Center - 450 Room Nights @ 10% cost= $90 ADR = $40,500
•Corporate -100 Room Nights @ 15% cost= $85 ADR = $8,500*
•GDS – 200 Room Nights @ 15% cost= $85 ADR = $17,000
*would be absorbed into the Reservation center and the average % cost
would be modified accordingly
80
Modulating the Market Channels by Cost
OTA – Cost is fixed by contract
Brand – Cost is fixed by contract
Internet – Several Channel cost variables
Rez Center – Cost is a variable of volume
Corp – Cost is fixed by volume
GDS – Cost is fixed by flat rate
OTA – Inventory / Rate
Brand – Always on - controlled by ‘gates’
Internet – Specific to channel -Always on
Rez Center – Always on - controlled by ‘gates’
Corp – Inventory
GDS – Inventory
Cost Parameter by Channel Managed Control by Channel

81
How to Maximize Your Online Channel ‘Leverage’
82
To Answer A Question……
•Internet should represent at least 25% of your transient market source.
•As such it represents 25% of your attainable ADR.
•At 10% cost (averaged) makes a minimum ROI of 10 to 1 as baseline just for it’s segment.
•For it to affect any other channel contribution or cost it must perform at at .25 modifier per % point shift multiplied by the variable cost between its channel cost to that of the channel being replaced.
EX: ADR=$100 / Internet ADR=$90 / OTA ADR= $75
Objective: Shift 1% from OTA to Internet
Internet Cost%-OTA Cost%(10%-25%)=15% (15%X.25)=3.75 is the modifier, namely for every room sold above 25% total segment contribution by the internet it ‘removes’ 3.75 rooms needing to be sold via the OTA for the same revenue.

83
How to Maximize Your Online Channel ‘Leverage’
(The Last Slide…<smile>)
•The more SEO contributes to your site the lower the channel cost
•The higher the conversion % the more productive the channel
•The more you displace other more costly market channels you can extend the ‘logic’ of the modifier calculation to determine flow thru and forecasted revenue by segment
•Realize that online does not mean discounted
•Capturing more potential guests higher in the consumer funnel means less ROI but higher incremental Revenue.
•Sources of almost ‘zero’ channel cost are expanding, (social media, Mobile and geo targeted interactions)
•There’s a lot more math that can help but this is it…Thank You
84
Questions?Questions?Panel Moderator: Jeff Higley, VP, Digital Media and Communications, HotelNewsNow.com/STR/STR Global
Panelists:
Bobby Bowers,
Senior VP, STR
Trevor Stuart-Hill,
President,
Revenue Matters
C. A. Clark, VP,
Electronic Publishing,
Miles Media
Nick Cohen,
Senior E-Marketing Mngr.,
Sabre Hospitality
Loren Gray,Director of E-Commerce,Ocean Properties, Ltd.

85
Upcoming HSMAI University ProgramsUpcoming HSMAI University Programs
If you haven’t registered for the entire 10-part Revenue Management series going through December 14, 2010, you can do so now. Details on this series and other upcoming webinars at www.hsmaiuniversity.org
Next session: July 27, 2010 –
“Use Data to Drive Revenue Management Decision Making”
Also coming soon…
June 1, 2010: “Guess who's coming to visit?” - What to do when your property owner calls a meeting with your property leadership
July 1, 8, & 15: Mobile marketing, in-depth social media strategies, and social media case studies & best practices
86
June 21, 2010 ���� Orange County Convention Center
Orlando, Florida
Save the Date!
This leading conference is brought to you by the thought leaders at the forefront of the increasing convergence of the revenue management and internet marketing fields within the hospitality industry.
�You’ll learn about the latest trends and best practices in these two important disciplines – and what they can mean to you and your company.�It is a not-to-miss event especially if you are a senior or regional hospitality professional with direct responsibility forRevenue Optimization and Pricing and/or Online Marketing, or are a management leader with an interest in staying ahead of the curve.�The conference will address the issues and challenges that you are facing, summarize the implications, and provide solutions and strategies for 2010 and beyond.
revmanagement.org | travelinternetmarketing.org
June 21, 2010 ���� Orange County Convention Center
Orlando, Florida

87
The Evolving Dynamics of Revenue Management: A Comprehensive Revenue Optimization Road Map for
Hotel Owners, Operators and Practitioners
By Kathleen Cullen & Caryl HelselPublished by HSMAI Foundation in partnership with the HSMAI Revenue
Management SIG Advisory Board and TravelCLICK
Coming Soon!
Revenue Management has continued to grow as a science and an art over the past several years in many industries, and especially in the hospitality industry. On the most fundamental level, the basis for success is to have the right revenue management organization in place to support the revenue strategy. A solid understanding of revenue management is critical throughout an organization, from top to bottom. This HSMAI Foundation publication brings you and your property the very latest information on understanding the market, market segmentation, forecasting, revenue strategy, pricing, inventory control strategies, and performance analysis. Included are a plethora of case studies to help you optimize revenue at all levels.
Expected publishing date: July 1, 2010. Pre-order today at www.hsmaipublications.com.
88
EvaluationEvaluation
� Please take a moment now to click on the Evaluationlink in the LINKS box and complete the evaluation.
� Be sure to click on “Submit” when you have completed the evaluation to send us your responses.
� Your comments & suggestions are very important to us, and they help us to provide you with quality programming.
TodayToday ’’s webinar is copyright 2010 by the Hospitality Sale s & Marketings webinar is copyright 2010 by the Hospitality Sale s & Marketing Association International Association International with All Rights Reserved.with All Rights Reserved.