GROWING AREA WB Towns of Kittery and York Report … is a triennial report for growing area WB...
26
WB Triennial 2010 Effective Date 01/30/12 Page 1 of 26 GROWING AREA WB Towns of Kittery and York Triennial Report for 2008-2010 Report Date: 01-30-2012 Lorraine Morris APPROVAL Division Director: Kohl Kanwit 1/30/12 _________________________ _________________________ Date: ____________ Print name signature
Transcript of GROWING AREA WB Towns of Kittery and York Report … is a triennial report for growing area WB...

WB Triennial 2010 Effective Date 01/30/12
Page 1 of 26
GROWING AREA WB Towns of Kittery and York
Triennial Report for 2008-2010
Report Date: 01-30-2012
Lorraine Morris
APPROVAL Division Director:
Kohl Kanwit 1/30/12 _________________________ _________________________ Date: ____________ Print name signature

WB Triennial 2010 Effective Date 01/30/12
Page 2 of 26
TABLE OF CONTENTS Executive Summary ......................................................................................................................4 Growing Area Description .............................................................................................................4 Current Classification(s)................................................................................................................4 Activity during Review Period .......................................................................................................5 Conditionally Managed Area(s).....................................................................................................6 Documentation of Pollution Sources.............................................................................................6
Evaluation of New Pollution Sources ....................................................................................6 Re-Evaluation of Existing Pollution Sources .........................................................................6
Water Quality Review and Discussion ........................................................................................10 Upward Classification Changes ..................................................................................................13 Shoreline Survey Activity ............................................................................................................22 Aquaculture/Wet Storage Activity ...............................................................................................22 Recommendation for Future Work..............................................................................................22 References..................................................................................................................................22 Appendix A. Annual Review of York River Conditional Area Management Plan .......................23 Appendix B. Key to Water Quality Table Headers ......................................................................26 LIST OF TABLES Table 1. Growing Area WB Stream Samples...............................................................................8 Table 2. Geomean and P90 Scores, Growing Area WB, 2006-2010.........................................10 Table 3. York Harbor Seasonal Conditional Area, Open Status, 2005-2010.............................11 Table 4. WB Samples Collected in 2010 ...................................................................................11 Table 5. Brave Boat Harbor Geometric Mean and P90 scores, SRS Data Year Round............13 Table 6. WB 2, Seasonal and Rainfall Assessment, 2000-2010 ...............................................15 Table 7. WB 5, Seasonal and Rainfall Assessment, 2000-2010 ...............................................17 Table 8. Brave Boat Harbor Geomean and P90 Scores on data collected after cumulative rainfall >0.50 inches....................................................................................................................20 Table 9. York River Geomean and P90 Calculations for Conditional Stations Prior to Opening, Open status.................................................................................................................................24 Table 10. York River Geomean and P90 Calculations for Conditional Stations End of Year Review, Open status...................................................................................................................25 LIST OF FIGURES Figure 1. Growing Area WB, with Active Water Stations ..............................................................3 Figure 2. Growing Area WB Stream Sample Locations..............................................................23 Figure 3. Area WB P90 Scores for Prohibited Stations (expressed as the percent of the approved standard), 2008-2010 ................................................................................................12 Figure 4. Area WB P90 Scores for Conditionally Approved Stations (expressed as the percent of the approved standard), 2008-2010 ..........................................................................................12 Figure 5 Brave Boat Harbor P90 Trends, Year Round, 2008-2010 ............................................14 Figure 6. Brave Boat Harbor, with Proposed Classification ......................................................21

WB Triennial 2010 Effective Date 01/30/12
Page 3 of 26
Figure 1. Growing Area WB, with Active Water Stations

WB Triennial 2010 Effective Date 01/30/12
Page 4 of 26
Executive Summary This is a triennial report for growing area WB written in compliance with the requirements of the 2009 Model Ordinance and the National Shellfish Sanitation Program (NSSP). Growing area WB includes Seapoint Beach, Brave Boat Harbor, and the York River. Over the triennial review period there were two stations that were deactivated in Seapoint Beach due to the lack of resource. On January 12, 2009 all stations within area WB where reclassified to prohibited due to an expired shoreline survey. In October 2009, a shoreline survey was completed from the mouth of the York River to the Sewalls Bridge. A sanitary survey will be written for growing area WB in 2011, followed by annual reports in 2012 and 2013 and a triennial report in 2014.
Growing Area Description Growing area WB includes small portions of the towns of Kittery and York in Southern Maine (Figure 1). The growing area boundary begins at Sisters Point Kittery and includes Seapoint Beach, Brave Boat Harbor, and the York River ending at the northeast end of Western Beach, just outside the York River. A complete boundary description for this growing area can be found in the DMR central files. Existing pollution sources include two marinas in the lower portion of the York River, as well as 311 moorings and 155 slips managed by the Town of York. The marina area is frequented with summer traffic beginning in early May and tapering off by the end of October. Mooring and slip concentrations are highest starting south of Stage Neck to the Sewalls Bridge. The majority of the summer boating activity is transients with some fishing vessels and one live aboard boat. There are no municipal waste water facilities in this area.
Current Classification(s) At the end of the 2010 review year, shellfish growing area WB had areas classified as: Conditionally Approved
York River (4 stations, WB 23, 26, 26.5, 27)(Based on season) Prohibited
Brave Boat Harbor, Kittery and York (2 Stations, WB 2 and 5)(Non-point pollution and expired shoreline survey)
York River, York (4 stations, WB 16, 20, 21, 29)(Non-point Pollution) Please visit the DMR website to view legal notices:

WB Triennial 2010 Effective Date 01/30/12
Page 5 of 26
http://www.maine.gov/dmr/rm/public_health/closures/closedarea.htm#
Activity during Review Period 2008 There was no activity recorded for 2008. 2009 January 12, 2009 - Area No. 3 Seapoint to York River (Kittery and York). This amendment creates a large prohibited area from Sisters Point, Kittery to East Point, York including Seapoint and Crescent Beaches, Brave Boat Harbor, and the York River due to lack of and expired shoreline survey work and pollution source assessment. October 23, 2009 - A shoreline survey of the York River was done by Lorraine Morris (LSM) of DMR and David Webber (Head of Shellfish Committee) starting on the south side of the river on Ice House Point Road (Tax Map 106-7) and ending on Pine Island (Tax Map 104-083). A total of 27 properties were surveyed and there were no issues found. October 29, 2009 – Shoreline survey was continued by LSM of DMR on the south side of the York River starting from Windmill Acres (Tax Map 212-185) and ending at Seabury Road (Tax Map 101-079). A total of 42 properties were surveyed and there were no issues found. October 30, 2009 – Shoreline survey of the York River was finished by LSM of DMR starting with Seawall Hills (Tax Map 104-65) and ending on the north side of the river at Stage Neck Road (Tax Map 105-035). A total of 54 properties with septic systems were surveyed with no issues found as well as a drive through of 56 properties on town sewer. Town sewer begins on the north side of the river at Indian Trail (Tax Map 109-17) and continues along the river eastward to the mouth of the river with the exception of two properties that were surveyed. 2010 September 14, 2010 – DMR conducted a drive through survey for the 2010 Triennial report. A farm was documented on Southside Road with approximately 20 cows. The cows are kept on the opposite side of the road of the York River. Any drainages that run into the river empty into a prohibited area. There is a development off of Western Point Road called Sparhawk Reach. Currently only one of the seven lots has a house and this property is greater then 500 feet from shore. September 29, 2010 – DMR did a sanitary survey of Brave Boat Harbor and a portion of Chauncy Creek. A total of 110 properties were documented. There were no issues found with any of the private systems during this survey.

WB Triennial 2010 Effective Date 01/30/12
Page 6 of 26
December 28, 2010 - At the end of year review for the York Harbor Conditional Area, station WB 26.5 no longer meets the approved standard. This Conditional Area will be reevaluated and the closure line will have to be moved.
Conditionally Managed Area(s) There is one conditionally managed area based on seasonal variation located in the York River. There are four stations that monitor this conditional area; WB 23, 26, 26.5, and 27. At the end of the 2010 review year, station WB 26.5 no longer met the approved standard during the open status of November 16 – April 30. The conditional area was modified on Jan 10, 2011. Please refer to Appendix A for a detailed review of this conditional area.
Documentation of Pollution Sources The following sections include information on pollution sources which do or may impact water quality in growing area WB. Pollution sources that are reviewed in this section include domestic waste (both private, in-ground systems and over board discharges), marinas and mooring fields, non-point source pollution (streams and storm-water runoff), agricultural activities, domestic animals, wildlife areas, and recreational areas.
Evaluation of New Pollution Sources There were no new actual pollution sources documented during the triennial review period.
Re-Evaluation of Existing Pollution Sources The following sections are a review of existing pollution sources in growing area WB. Pollution problems are associated with domestic waste. Domestic Waste (IG Systems and OBDs) There were no actual pollution sources associated with private in-ground systems documented during the last sanitary shoreline survey in 2009 and 2010. There are no OBDs located in growing area WB. Municipal WWTP There are no municipal sewage treatment plants in growing area WB. Industrial Pollution There are no permitted industrial discharges into growing area WB.

WB Triennial 2010 Effective Date 01/30/12
Page 7 of 26
Marinas The lower portion of the York River has two marinas (Figure 1), as well as 311 moorings and 155 slips managed by the Town of York. The marina area is frequented with summer traffic beginning in early May and tapering off by the end of October. Mooring and slip concentrations are highest starting south of Stage Neck to the Sewalls Bridge. The majority of the summer boating activity is transients with some fishing vessels and one live aboard boat. Stormwater Stormwater runoff is generated when precipitation from rain and snowmelt events flows over land or impervious surfaces and does not percolate into the ground. As the runoff flows over the land or impervious surfaces (paved streets, parking lots, and building rooftops), it accumulates debris, chemicals, sediment or other pollutants that could adversely affect water quality if the runoff is discharged untreated (US EPA 2009). Thus, stormwater pollution is caused by the daily activities of people within the watershed. Currently, polluted stormwater is the largest source of water quality problems in the United States. The primary method to control stormwater discharges is the use of best management practices (BMPs). In addition, most major stormwater discharges are considered point sources and require coverage under an National Pollution Discharge Elimination System (NPDES) permit. In 1990, under authority of the Clean Water Act, the U.S. EPA promulgated Phase I of its stormwater management program, requiring permitting through the NPDES. The Phase I program covered three categories of discharges: (1) “medium” and “large” Municipal Separate Storm Sewer Systems (MS4s) generally serving populations over 100,000, (2) construction activity disturbing 5 acres of land or greater, and (3) ten categories of industrial activity. In 1999, US EPA issued Phase II of the stormwater management program, expanding the Phase I program to include all urbanized areas and smaller construction sites. Although it is a federal program, in the state of Maine, the Phase II Stormwater permit is issued and regulated by the Maine DEP (Chapter 500 and 502). Under the MS4 regulations, each municipality must implement the following six Minimum Control Measures: (1) Public education and outreach, (2) Public participation, (3) Illicit discharge detection and elimination, (4) Construction site storm water runoff control, (5) Post-construction stormwater management, and (6) Pollution prevention/good housekeeping. The permit required each city or town to develop a draft Stormwater Management Plan by September 3, 2003 that will establish measurable goals for each of the Minimum Control Measures. The Town must document the implementation of the Plan, and provide annual reports to the Maine DEP. Currently the discharge of stormwater from 28 Maine municipalities is regulated under the Phase II permit requirements, however, no municipalities located within the boundaries of growing area WQ fall under these regulations. Additionally, the Maine Stormwater Management Law provides stormwater standards for projects located in organized areas that include one acre of more of disturbed area (Maine DEP 2009).

WB Triennial 2010 Effective Date 01/30/12
Page 8 of 26
Non-Point Pollution Sources (streams, etc) Streams are a source of fresh water to the York River and Brave Boat Harbor, and may carry stormwater, snowmelt and groundwater into the coastal estuaries. Waste, including that containing fecal matter, which is deposited on land, may be carried by streams to shellfish growing areas, contributing to elevated fecal counts in waters that are filtered by shellfish. In 2010, three streams were evaluated (Table 1 and Figure 2). Stream S1WB 26 flows into the conditionally approved area of the York River. Streams S1WB2 and S2WB2 drain into the head of Brave Boat Harbor and have the potential to impact station WB 2. Table 1. Growing Area WB Stream Samples Date Sampled Date Sampled Date Sampled Date Sampled
Stream ID # 9/14/2010 11/1/2010 11/16/2010 12/8/2010
MFCount MFCount MFCount MFCount
S1WB026.00 520 92 110 N/A
S1WB002.00 60 8 36 N/A
S2WB002.00 960 4 12 4

WB Triennial 2010 Effective Date 01/30/12
Page 9 of 26
Figure 2 Growing Area WB Stream Sample Locations

WB Triennial 2010 Effective Date 01/30/12
Page 10 of 26
Agricultural Activities, Domestic Animals and Wildlife Activity There are two farms located within growing area WB that have the potential to impact water quality (Figure 2). One farm is located on Southside Road in York with approximately 20 cows. The cows are fenced on the opposite side of the road of the York River. Any drainages that run into the river empty into a prohibited area. The second farm is located on the corner of Brave Boat Harbor Rd and Payne Road in York. There are 2 to 3 cows that are fenced 150 ft from the stream that drains into the head of Brave Boat Harbor. This property also has a kennel for dogs and cats. All manure from the animals kept on this property is composted in a small covered bunker. Conservation/Recreation Areas There is approximately 800 acres around Brave Boat Harbor that is part of the Rachel Carson Preserve. There are a number of migratory birds and other wildlife that have the potential to contribute to non-point pollution.
Water Quality Review and Discussion Table 2 lists all active prohibited stations in Growing Area WB, with their respective Geomean and P90 calculations for 2010. Please refer to Appendix B for a key to interpreting the headers on the columns of Table 2. The approved and restricted standards for each station are also displayed in Table 2. These standards will fluctuate yearly as a result of the DMR transition from a most probable number (MPN) fecal coliform test method to a membrane filtration (MF) method and are dependent on the number of sample analyzed by MPN verses MF. The total number of data points used in the calculations is displayed in the Count column and includes both MPN and MF values. The number of data points analyzed by MF is displayed in the MFCNT column. This fluctuating standard will cease when all 30 data points have been analyzed by the MF method. A more detailed explanation of this transition can be found in central files. Based on the current review of water quality data, prohibited stations WB 2 and 5 are meeting the approved NSSP standard. Station WB 2 will remain prohibited due to the presence of two streams located in the vicinity of this station and their potential to impact water quality. Station WB 5 is being recommended for an upgrade in classification to approved year round. Please refer to the Recommendations for Upward Classification section of this report for a more detailed water quality assessment of this station. Table 2. Geomean and P90 Scores, Growing Area WB, 2006-2010
Station Class Count MFCount GM SDV MAX P90 Appd Std Restr StdWB002.00 P 30 28 5.2 0.48 42 21.8 31 169WB005.00 P 30 28 2.9 0.34 44 8.1 31 169WB016.00 P 30 26 7.9 0.56 158 42.1 32 176WB020.00 P 30 26 11.8 0.74 1700 106.7 32 176

WB Triennial 2010 Effective Date 01/30/12
Page 11 of 26
Station Class Count MFCount GM SDV MAX P90 Appd Std Restr StdWB021.00 P 30 26 7.1 0.52 82 33.9 32 176WB026.50 P 30 30 4.2 0.65 1320 29.1 31 163WB029.00 P 30 26 3.5 0.5 300 15.3 32 176 Table 3 lists all conditionally approved stations in the York River seasonal/marina conditional area with their respective Geomean and P90 calculations for 2010. Data for conditionally approved stations reflects only the open status. All stations except for WB 26.5 met the approved standard during open status of November 16-April 30. Table 3. York Harbor Seasonal Conditional Area, Open Status, 2005-2010
Station Class Count MFCount GM SDV MAX P90 Appd_Std Restr_StdWB023.00 CA 30 25 3.4 0.44 130 12.9 33 180WB026.00 CA 30 23 4.4 0.46 122 17.1 34 187WB026.50 CA 30 25 4.8 0.68 1320 36.7 33 180WB027.00 CA 30 25 2.6 0.39 240 8.4 33 180 All stations that were active at the beginning of 2010 were sampled at least 6 times following the systematic random sampling (SRS) schedule (Table 4). Station WB 26.5 served as a re-opening sample station after flood events, and was sampled 10 times under adverse conditions. The York Harbor conditionally approved stations (WB 23, 26, 26.5, and 27) were sampled 6 times in the open status. Table 4. WB Samples Collected in 2010
Adverse Extra Random Station Class Closed Closed Closed Open Total Comments
WB002.00 P 1 7 8 WB005.00 P 1 7 8 WB016.00 P 6 6 WB020.00 P 6 6 WB021.00 P 6 6 WB023.00 CA 4 6 10 WB026.00 CA 4 6 10 WB026.50 CA 10 4 6 20 WB027.00 CA 4 6 10 WB029.00 P 6 6
Figures 3 and 4 show the P90 trends over the past three years for all prohibited and conditionally approved stations in growing area WB. During the transition from MPN to MF analysis method, the approved standard will decrease every year, until all samples have been analyzed by the MF method. In order to show the trend of the P90 value over the years, the calculated P90 scores are expressed as a percentage of the approved standard; any station showing the 2010 column on or above the 100 percent line does not meet the standard for approved classification.

WB Triennial 2010 Effective Date 01/30/12
Page 12 of 26
Prohibited stations WB 20, 21, and 29 have shown an increase in P90 scores over the last three review years. Station WB 2 has shown a downward trend (improved water quality) however, this station will remain prohibited due to the presence of two streams located in the vicinity of this station and their potential to impact water quality. Station WB 5 continues to remain well below the approved standard and is being recommended for an upward classification from prohibited to approved. Conditionally approved station WB 26.5 did not meet the approved standard during the open status of November 16-April 30 in the 2010 review year. This station was downgraded in class from conditionally approved to prohibited on January 10, 2011. Figure 3. Area WB P90 Scores for Prohibited Stations (expressed as the percent of the approved standard), 2008-2010
0
50
100
150
200
250
300
350
400
WB 2 WB 5 WB 16 WB 20 WB 21 WB 29
Water Quality Stations
% o
f A
pp
rove
d S
tan
dar
d
2008
2009
2010

WB Triennial 2010 Effective Date 01/30/12
Page 13 of 26
Figure 4. Area WB P90 Scores for Conditionally Approved Stations (expressed as the percent of the approved standard), 2008-2010
0
20
40
60
80
100
120
WB 23 WB26 WB 26.5 WB 27
Water Quality Stations
% o
f A
pp
rove
d S
tan
dar
d
2008
2009
2010
Recommendations for Upward Classification Brave Boat Harbor On January 12, 2009, stations WB 2 and WB 5 were reclassified from restricted and approved to prohibited due to an expired shoreline survey. On September 29, 2010, a sanitary survey of Brave Boat Harbor was completed. There were no additional potential or actual problems identified at any of the properties. At the end of 2010, both of the stations located in Brave Boat Harbor were meeting the approved classification standard (Table 5). Figure 5 shows the P90 trends for stations WB 2 and WB 5 for the past three years. Station WB 2 met the approved standard in 2010, but exceeded the standard in 2008 and 2009. Over the last three years, station WB 5 has shown little change in P90 scores and continues to meet the approved standard. In considering an upward classification upgrade for this area, a seasonal and rainfall analysis was completed. For this analysis, all data collected from 2000 through 2010 at stations WB 2 and WB 5 were considered. Tables 6 and 7 show results from all random and extra (excluding flood) samples collected between 2000 and 2010; the data points are sorted by month and by cumulative rainfall amounts; scores which exceeded the variability standard in the proposed open status are highlighted in yellow. In all tables presented in this section, ‘Rain 3 Days’ refers to cumulative rainfall occurring three days before sample was collected; ‘Rain 4 Days’ refers to cumulative rainfall 3 days prior, plus the day of collection. Since 2000, station WB 2 has exceeded the variability standard seven times. These elevated scores occurred both with little

WB Triennial 2010 Effective Date 01/30/12
Page 14 of 26
to no rain and after significant rainfall (Table 6). Station WB 5 exceeded the variability standard two times (Table 7). The most recent elevated score was in September of 2009 and did take place after rainfall. To confirm that the data will meet the approved standard for each month that the area is open to shellfish harvesting, a geometric mean was calculated for each station, and for each month; these geometric scores are noted in the last row of each of the Tables 6 and 7. Station WB 2 met the approved classification geometric mean standard of 14, for each month that the area is in the open status except for the month of August. Station WB 5 met the approved classification geometric mean standard year round. An additional assessment was completed to determine the effect of precipitation (cumulative rainfall of 0.5 inches or more within four days of collection and on sample day, excluding flood events) on the geometric mean and P90 scores (Table 8). For this assessment, all SRS and extra data (excluding flood data) were considered. Station WB 5 continued to meet the geometric mean and P90 approved standard, using a dataset limited to rainfall data.
Table 5. Brave Boat Harbor Geometric Mean and P90 scores, SRS Data Year Round
Station Class Count MFCount GM SDV MAX P90 Appd_Std Restr_StdWB002.00 P 30 28 5.2 0.48 42 21.8 31 169WB005.00 P 30 28 2.9 0.34 44 8.1 31 169 Figure 5. Brave Boat Harbor P90 Trends, Year Round, 2008-2010
0
20
40
60
80
100
120
140
WB 2 WB 5
WQ Stations
% o
f A
pp
rove
d S
tan
dar
d
2008
2009
2010

WB Triennial 2010 Effective Date 01/30/12
Page 15 of 26
Table 6. WB 2, Seasonal and Rainfall Assessment, 2000-2010 Rain 3 Rain 4 Date Strategy Adv Tide Sal Jan Feb Mar Apr May Jun Jul Aug Sep Oct Nov Dec
0 0.01 16-Apr-08 R X E 20 1.9 0 0 07-May-00 R NP 30 3.6 0 0 07-May-02 R X 23 0 0 16-Mar-09 R X F 24 1.9 0 14 19-Nov-08 R X 25 2 0 0 12-Dec-06 R X 26 1.90 0 18-Jun-07 R P 30 2 0 0 28-Sep-04 R X 23 0 0 21-Oct-01 R X 31 2.9 0 0 10-Sep-02 R X 23 0 0 13-Apr-10 R X 28 6 0 0.31 10-Jun-03 R P 30 23 0 0.56 14-Jul-03 R X 9.1 0 0.02 01-Oct-00 R X 2.9 0 0 10-Jun-01 R X 2.9 0 0.53 07-Oct-03 R X 31 23
0.01 0.01 22-Jun-04 R P 26 23 0.01 0.04 01-Jun-10 R X 5.5 0.01 0.01 09-Sep-03 R 2.9 0.01 0.2 26-Aug-09 R 2 0.01 0.01 01-Dec-10 R X 1.90.02 0.02 19-Aug-01 R 23 0.02 0.02 07-Jun-05 R 2.9 0.02 0.03 26-Jul-10 R 5.5 0.02 0.02 25-Oct-10 R 1.9 0.03 0.03 06-May-01 R 9.1 0.03 0.03 09-Jul-02 R 23 0.04 0.04 19-Apr-06 R 2.9 0.05 0.05 20-Aug-00 R W 2.9 0.06 0.06 19-Jul-05 R P 240

WB Triennial 2010 Effective Date 01/30/12
Page 16 of 26
Rain 3 Rain 4 Date Strategy Adv Tide Sal Jan Feb Mar Apr May Jun Jul Aug Sep Oct Nov Dec 0.06 0.06 04-Jun-00 R NP 31 3.6 0.08 0.08 08-Aug-06 R X 23 0.08 1.46 30-Nov-09 R X HE 23 12 0.11 0.11 23-Jul-00 R NWP 3.6 0.12 0.17 13-Aug-07 R W 32 1.9 0.15 0.15 24-Jul-07 R P 30 10 0.18 0.21 15-Jul-01 R 2.9 0.19 0.19 13-Feb-06 R X 28 2.9
0.2 0.2 20-Jul-04 R P 28 9.1 0.22 0.96 31-Mar-08 R 2
0.3 0.45 15-Sep-08 R 42 0.36 1.13 09-Oct-07 R 25 0.39 0.39 02-Jun-08 R X 31 1.9
0.4 0.41 29-Sep-10 R 18 0.44 0.44 12-Aug-03 R P 32 2.9 0.47 0.47 11-Jun-02 R 2.9 0.49 0.49 30-Sep-01 R X 32 2.9 0.53 0.53 30-Jan-06 R X H 18 3.6 0.59 0.59 12-Aug-09 R P 27 33 0.66 0.66 02-Jan-07 R P 28 1.9 0.76 0.93 18-May-04 R P 29 3.6 0.78 0.79 09-Apr-00 R PN 31 2.9 0.82 0.82 19-Sep-06 R 27
0.9 0.9 03-Aug-04 R 93 0.95 0.95 06-Sep-05 R 3.6 0.96 0.96 29-Sep-09 R 16
1 1 13-May-03 R P 30 3.6 1.35 1.35 17-Nov-10 E X H 26 28 1.35 1.55 16-Aug-05 R 43 1.85 2.12 22-Jul-08 R P 29 2 1.88 1.88 24-Feb-10 R P 25 8

WB Triennial 2010 Effective Date 01/30/12
Page 17 of 26
Rain 3 Rain 4 Date Strategy Adv Tide Sal Jan Feb Mar Apr May Jun Jul Aug Sep Oct Nov Dec 2.48 2.96 24-May-05 R P HF 10 43
No Data No Data 13-Aug-02 R 240 No Data 0.42 17-Jun-09 R 4 No Data No Data 26-Oct-04 R 3.6 No Data No Data 04-Oct-05 R 93 No Data 0.01 08-Oct-02 R 23 No Data 1.75 05-Mar-07 R 1.9 Geomean by Month 2.62 4.82 1.93 3.13 8.65 4.56 9.31 14.89 12.02 9.58 8.76 1.90
Table 7. WB 5, Seasonal and Rainfall Assessment, 2000-2010
Rain 3 Rain 4 Date Strategy Tide Adv Sal Jan Feb Mar Apr May Jun Jul Aug Sep Oct Nov Dec 0 0 07-May-00 R H P 30 2.9 0 0.02 01-Oct-00 R H X 30 2.9 0 0 10-Jun-01 R HF WH 30 2.9 0 0 21-Oct-01 R H H 31 2.9 0 0 07-May-02 R E X 30 43 0 0 13-Aug-02 R F X 30 3.6 0 0 10-Sep-02 R F X 32 3.6 0 0.01 08-Oct-02 R F X 30 3.6 0 0.31 10-Jun-03 R HE P 31 2.9 0 0.56 14-Jul-03 R H X 30 3.6 0 0.53 07-Oct-03 R HF X 31 2.9 0 0 28-Sep-04 R F X 30 7.3 0 0 26-Oct-04 R H X 30 2.9 0 0 04-Oct-05 R HF X 30 3.6 0 0 18-Dec-06 R E X 30 1.90 1.75 05-Mar-07 R HF X 33 1.9 0 0 18-Jun-07 R F P 30 2 0 14 19-Nov-08 R F X 30 1.9 0 0 16-Mar-09 R F X 30 1.9

WB Triennial 2010 Effective Date 01/30/12
Page 18 of 26
Rain 3 Rain 4 Date Strategy Tide Adv Sal Jan Feb Mar Apr May Jun Jul Aug Sep Oct Nov Dec 0 0.42 17-Jun-09 R E X 30 4 0 0 13-Apr-10 R H X 30 1.9
0.01 0.01 09-Sep-03 R HF X 32 3.6 0.01 0.01 22-Jun-04 R F P 29 7.3 0.01 0.2 26-Aug-09 R H X 30 1.9 0.01 0.04 01-Jun-10 R F X 31 4 0.01 0.01 01-Dec-10 R HE X 31 1.90.02 0.02 19-Aug-01 R HE WH 30 9.1 0.02 0.02 07-Jun-05 R F X 30 2.9 0.02 0.03 26-Jul-10 R H X 30 1.9 0.02 0.02 25-Oct-10 R HF X 32 1.9 0.03 0.03 06-May-01 R E W 30 3.6 0.03 0.03 09-Jul-02 R H H 30 9.1 0.04 0.04 19-Apr-06 R F X 31 7.3 0.05 0.05 20-Aug-00 R H P 30 2.9 0.06 0.06 19-Jul-05 R HE X 30 9.1 0.08 0.08 08-Aug-06 R H X 32 9.1 0.08 0.95 04-Feb-08 R E X 30 1.9 0.08 1.46 30-Nov-09 R HE X 30 1.9 0.11 0.11 23-Jul-00 R F PW 30 2.9 0.12 0.17 13-Aug-07 R HF X 30 1.9 0.14 0.14 26-Jul-00 R H H 31 3.6 0.15 0.15 24-Jul-07 R H P 30 2 0.18 0.21 15-Jul-01 R F WP 30 2.9 0.19 0.19 13-Feb-06 R H X 30 2.9
0.2 0.2 20-Jul-04 R HF P 32 2.9 0.22 0.96 31-Mar-08 R E X 30 1.9
0.3 0.45 15-Sep-08 R F P 31 8 0.36 1.13 09-Oct-07 R HF X 31 2 0.39 0.39 02-Jun-08 R E X 30 2
0.4 0.41 29-Sep-10 R F X 30 8

WB Triennial 2010 Effective Date 01/30/12
Page 19 of 26
Rain 3 Rain 4 Date Strategy Tide Adv Sal Jan Feb Mar Apr May Jun Jul Aug Sep Oct Nov Dec 0.44 0.44 12-Aug-03 R HF P 32 2.9 0.47 0.47 11-Jun-02 R F X 30 2.9 0.49 0.49 30-Sep-01 R E W 32 2.9 0.53 0.53 30-Jan-06 R H X 32 3.6 0.59 0.59 12-Aug-09 R F P 30 4 0.66 0.66 02-Jan-07 R E P 30 1.9 0.76 0.93 18-May-04 R H P 32 2.9 0.78 0.79 09-Apr-00 R HF P 33 3.6 0.82 0.82 19-Sep-06 R H X 31 1.9
0.9 0.9 03-Aug-04 R F X 31 2.9 0.95 0.95 06-Sep-05 R F X 30 3.6 0.96 0.96 29-Sep-09 R H P 30 44
1 1 13-May-03 R H P 30 3.6 1.35 1.55 16-Aug-05 R E P 30 3.6 1.35 1.35 17-Nov-10 E HE X 30 14 1.85 2.12 22-Jul-08 R HF P 30 1.9 1.88 1.88 24-Feb-10 R E P 31 1.9 2.48 2.96 24-May-05 R H P 21 23
Geomean by Month 2.62 2.19 1.90 3.68 6.90 3.18 3.37 3.61 5.58 2.77 3.70 1.90

XX Triennial 20XX Effective Date 01/30/12
Page 20 of 26
Table 8. Brave Boat Harbor Geomean and P90 Scores on data collected after cumulative rainfall >0.50 inches
Station Class Count MFCount GM SDV MAX P90 Appd_Std Restr_StdWB002.00 P 68 28 7.2 0.55 240 37.4 40 233WB005.00 P 68 28 3.5 0.3 44 8.7 40 233 Based on the current assessment of water quality in Brave Boat Harbor and the completion of the required shoreline survey, the lower portion of the harbor, monitored by station WB 5 may be reclassified from prohibited to approved. There are two streams that feed into the head of the harbor above, in the vicinity of where station WB 2 is collected. There is a farm that borders one of these streams that has the potential to impact the harbor, especially after heavy rainfall. Station WB 2 is currently recommended to stay classified as prohibited until an accurate dilution calculation can be completed on the two streams. The proposed classification lines are shown in Figure 6. This classification change proposal was reviewed and approved on February 28, 2001, and completed on March 3, 2011.

XX Triennial 20XX Effective Date 01/30/12
Page 21 of 26
Figure 6. Brave Boat Harbor, with Proposed Classification

XX Triennial 20XX Effective Date 01/30/12
Page 22 of 26
Shoreline Survey Activity October 23, 2009 - A shoreline survey of the York River was done by DMR and David Webber (Head of Shellfish Committee for York) starting on the south side of the river on Ice House Point Road (Tax Map 106-7) and ending on Pine Island (Tax Map 104-083). A total of 27 properties were surveyed and there were no issues found. October 29, 2009 – Shoreline survey was continued by DMR on the south side of the York River starting from Windmill Acres (Tax Map 212-185) and ending at Seabury Road (Tax Map 101-079). A total of 42 properties were surveyed and there were no issues found. October 30, 2009 – Shoreline survey of the York River was finished by DMR starting with Seawall Hills (Tax Map 104-65) and ending on the north side of the river at Stage Neck Road (Tax Map 105-035). A total of 54 properties with septic systems were surveyed with no issues found as well as a drive through of 56 properties on town sewer. Town sewer begins on the north side of the river at Indian Trail (Tax Map 109-17) and continues along the river eastward to the mouth of the river with the exception of two properties that were surveyed. September 14, 2010 – DMR conducted a drive through survey for the 2010 Triennial report. A farm was documented on Southside Road with approximately 20 cows. The cows are kept on the opposite side of the road of the York River. Any drainages that run into the river empty into a prohibited area. There is a development off of Western Point Road called Sparhawk Reach. Currently only one of the seven lots has a house and this property is greater then 500 feet from shore. September 29, 2010 – DMR did a sanitary survey of Brave Boat Harbor and a portion of Chauncy Creek. A total of 110 properties were documented. There were no issues found with any of the private systems during this survey.
Aquaculture/Wet Storage Activity There is no aquaculture or wet storage sites in area WB.
Recommendation for Future Work The following work is recommended to be completed prior to the next sanitary survey evaluation:
1. Additional sampling stream sampling around Brave Boat Harbor and the seasonal conditional area in the York River.
References Rachel Carson National Wildlife Refuge, http://www.fws.gov/northeast/rachelcarson/

XX Triennial 20XX Effective Date 01/30/12
Page 23 of 26
Appendix A. Annual Review of the York River Marina/Seasonal Conditional Area Management Plan, 2010 Scope
The marina /seasonal portion of the York River is located from the easternmost point of Stage Neck at the mouth of the river to the Sewall’s Bridge. Water quality in the area is monitored by stations WB 23, 26, 26.5, and 27.
XX Triennial 20XX Effective Date 01/30/12
Page 24 of 26
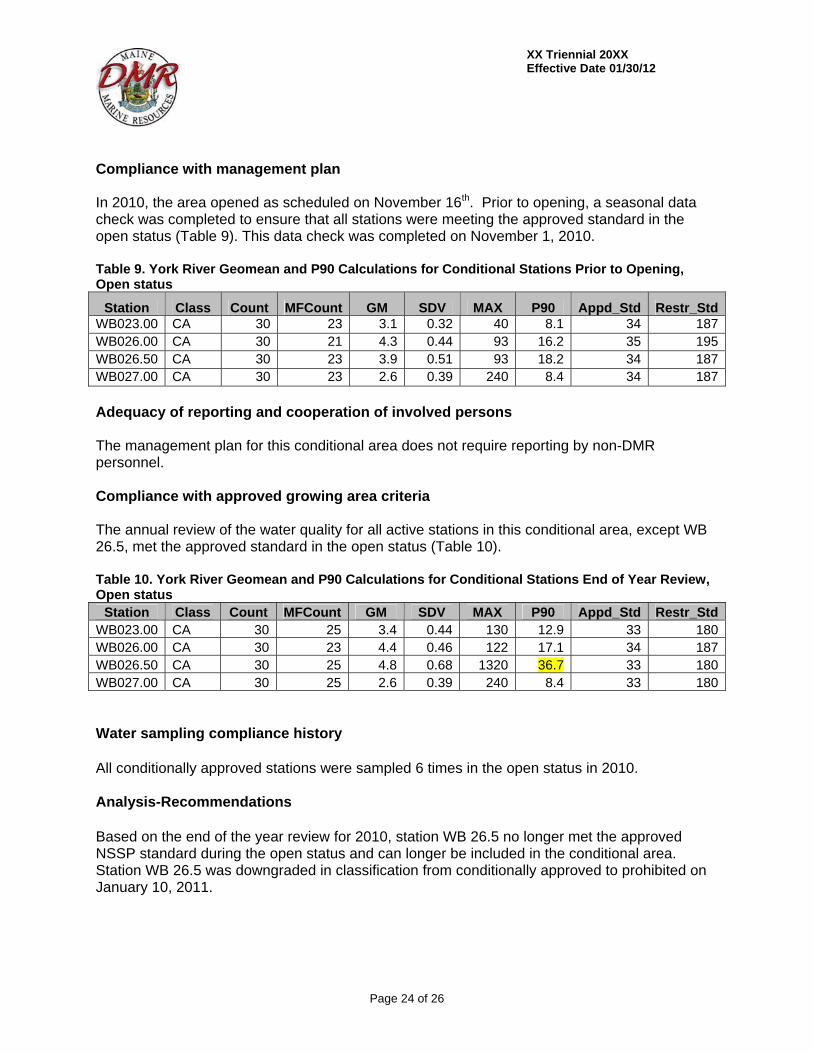
Compliance with management plan In 2010, the area opened as scheduled on November 16th. Prior to opening, a seasonal data check was completed to ensure that all stations were meeting the approved standard in the open status (Table 9). This data check was completed on November 1, 2010. Table 9. York River Geomean and P90 Calculations for Conditional Stations Prior to Opening, Open status
Station Class Count MFCount GM SDV MAX P90 Appd_Std Restr_StdWB023.00 CA 30 23 3.1 0.32 40 8.1 34 187WB026.00 CA 30 21 4.3 0.44 93 16.2 35 195WB026.50 CA 30 23 3.9 0.51 93 18.2 34 187WB027.00 CA 30 23 2.6 0.39 240 8.4 34 187
Adequacy of reporting and cooperation of involved persons The management plan for this conditional area does not require reporting by non-DMR personnel. Compliance with approved growing area criteria The annual review of the water quality for all active stations in this conditional area, except WB 26.5, met the approved standard in the open status (Table 10). Table 10. York River Geomean and P90 Calculations for Conditional Stations End of Year Review, Open status
Station Class Count MFCount GM SDV MAX P90 Appd_Std Restr_StdWB023.00 CA 30 25 3.4 0.44 130 12.9 33 180WB026.00 CA 30 23 4.4 0.46 122 17.1 34 187WB026.50 CA 30 25 4.8 0.68 1320 36.7 33 180WB027.00 CA 30 25 2.6 0.39 240 8.4 33 180 Water sampling compliance history All conditionally approved stations were sampled 6 times in the open status in 2010. Analysis-Recommendations Based on the end of the year review for 2010, station WB 26.5 no longer met the approved NSSP standard during the open status and can longer be included in the conditional area. Station WB 26.5 was downgraded in classification from conditionally approved to prohibited on January 10, 2011.

XX Triennial 20XX Effective Date 01/30/12
Page 25 of 26

XX Triennial 20XX Effective Date 01/30/12
Page 26 of 26
Appendix B. Key to Water Quality Table Headers Station = water quality monitoring station Class = classification assigned to the station; prohibited (P), restricted (R), conditionally restricted (CR), conditionally approved (CA) and approved (A). Count = the number of samples evaluated for classification, must be a minimum of 30. MFCNT = the number of samples evaluated with the MTec method (included in the total Count column) Geo_Mean = means the antilog (base 10) of the arithmetic mean of the sample result logarithm (base 10). SDV = standard deviation Max = maximum score of the 30 data points in the count column P90 = 90th percentile APPD_STD = the 90th percentile, at or below which the station would meet approved criteria in the absence of pollution sources or poisonous and deleterious substances. RESTR_STD = the 90th percentile, at or below which the station would meet restricted criteria.