GroupO1 OPM1 Scharffen Berger
14
Transcript of GroupO1 OPM1 Scharffen Berger

8/10/2019 GroupO1 OPM1 Scharffen Berger
http://slidepdf.com/reader/full/groupo1-opm1-scharffen-berger 1/14

8/10/2019 GroupO1 OPM1 Scharffen Berger
http://slidepdf.com/reader/full/groupo1-opm1-scharffen-berger 2/14
It was founded in 1996 by Robert Steinberg and JohnScharffenberger.
By 2000, they expanded their business. They acquired a27,000 sq. ft. warehouse where the production and retailinghappened.
In 2003, Jim Harris was recruited as the Chief Operating
Officer and was made to handle company’s growth.
As of May 2005, they were around 60 employees with 24 inproduction area, 18 in retail stores and another 18 inadministration.
2

8/10/2019 GroupO1 OPM1 Scharffen Berger
http://slidepdf.com/reader/full/groupo1-opm1-scharffen-berger 3/14
There are two categories in chocolate industry: mass market& premium category. The company falls in the latter of thetwo.
It was competing in a market of $1.2 bn. where in theproducts were priced in a range of $10 to $100 per pound.
The premium industry projected a growth of 15-20% between
2000 – 2010
Being at the higher end in premium category, its majorcompetitors were brands such as Godiva, Ghirardelli/Lindtand so on.
3

8/10/2019 GroupO1 OPM1 Scharffen Berger
http://slidepdf.com/reader/full/groupo1-opm1-scharffen-berger 4/14
The primary products are: unsweetened(99% cocoa, by weight),extra dark(82%), bittersweet(70%), semi-sweet(62%),mocha(62%), mint(62%), rubby bar(62%) and milkchocolate(41%).
The derivative products are: chocolate sauce, cocoa powderand chocolate-covered figs.
Sales of these products grew from $1.1 mn in 1999 to $10 mn in2004.
The products were sold through their five retail stores, distributionto retail stores and their website.
Price of their products stand as:
Weight Price($)
5 gram 0.50
1 oz. 2.00
3 oz. 4.00
10 oz. 10.004

8/10/2019 GroupO1 OPM1 Scharffen Berger
http://slidepdf.com/reader/full/groupo1-opm1-scharffen-berger 5/14
i
nput
Bean Cleaner
time = 15mins
Capacity = 200kg
Bins
96 Kg100 kg
Of 100 kg
Capacity = 250kg
Roaster
time = 75mins
rack
Cooling = 15mins
Winnower
Capacity = 450kg
time = 7.5mins
Bins
Melangeur
Capacity = 115kg
time = 75mins
Conche1
conche2
Capacity = 1400kg
time = 50mins
rack
TemperingMoldingPackaging
185 Kg
Of 250 kg
Capacity = 140kg Capacity = 140kg
time = 20mins time = 60mins
5

8/10/2019 GroupO1 OPM1 Scharffen Berger
http://slidepdf.com/reader/full/groupo1-opm1-scharffen-berger 6/14
Process Output in
onecycle(kg)
Time taken
(minutes)
8-Hour shifts End of day
production(kg per day)
BeanCleaner
96 15 1 3072
Roaster 250 75 1 1600Winnower 185 15 1 5920
Melangeur 115 75 2 1472
Conches (2in number)
1400 1500(avg. ofboth)
3 1344
Temper 140 60 2 2240
Mold 140 20 2 6720
End of day production = (o/p in one cycle)/(time taken)*60*shifts
6
Table 1
8/10/2019 GroupO1 OPM1 Scharffen Berger
http://slidepdf.com/reader/full/groupo1-opm1-scharffen-berger 7/14
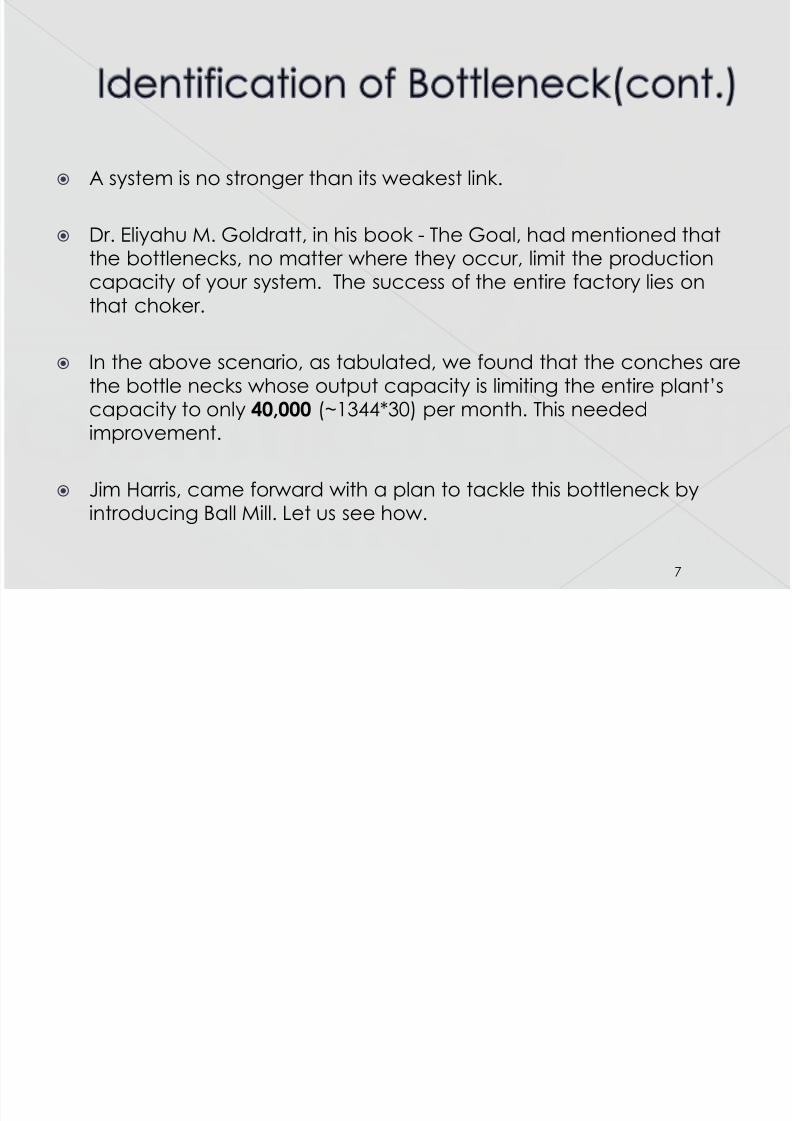
A system is no stronger than its weakest link.
Dr. Eliyahu M. Goldratt, in his book - The Goal, had mentioned thatthe bottlenecks, no matter where they occur, limit the production
capacity of your system. The success of the entire factory lies onthat choker.
In the above scenario, as tabulated, we found that the conches arethe bottle necks whose output capacity is limiting the entire plant’s
capacity to only 40,000 (~1344*30) per month. This neededimprovement.
Jim Harris, came forward with a plan to tackle this bottleneck byintroducing Ball Mill. Let us see how.
7

8/10/2019 GroupO1 OPM1 Scharffen Berger
http://slidepdf.com/reader/full/groupo1-opm1-scharffen-berger 8/14
Jim Harris expected the Ball Mill to reduce the refining timeto15 hours as opposed to some odd 50 hours taken by theconches.
Effect on output(in kg per day) – › Output in one cycle(kg) = 1400
› Time taken in minutes = 450
› Total hours deployed = 8*(3shifts) = 24 hours
› End of day production = (1400/450)*60*24 = 4480
* We observe that the refining process which, initially, was a bottleneck at1344 kg per day now produces 4480 kg per day. Definitely not thebottleneck anymore!! So who is new the bottleneck?
8

8/10/2019 GroupO1 OPM1 Scharffen Berger
http://slidepdf.com/reader/full/groupo1-opm1-scharffen-berger 9/14
Referring to ‘Table 1’, we find that the Melangeur is now anew bottleneck as it processes the least in a given day as itwas processing just higher than the bottleneck but not ashigh as others.
End of month production of the mixer = 1472*(30)= 44160 kg in a month
Good News. The net production capacity finally increased to44,160 kg per month from 40,000 kg per month. Registering anincrease of 10%!!
9

8/10/2019 GroupO1 OPM1 Scharffen Berger
http://slidepdf.com/reader/full/groupo1-opm1-scharffen-berger 10/14
Goldratt’s idea of maximizing capacity was by eliminatingthe bottlenecks. All of them.
Once the bottleneck is cleared, we can now increase the
shifts of other processes.
We work on the similar lines. Invest $50,000 refurbishing theMelangeur and also getting a new one so the cycle time for115 kg now reduces to 37.5 min. from 75 min. because there
are 2 mixers now and also their 8 hour shifts are increased to 3 in number.
End of day production of Melangeur =(115)/(37.5)*24*604416 kg per day
10

8/10/2019 GroupO1 OPM1 Scharffen Berger
http://slidepdf.com/reader/full/groupo1-opm1-scharffen-berger 11/14
Therefore, we now a new bottleneck, Temper End of the month production = 2240*(30)
= 67200 kg per month
We see a substantial increase of around 68% from theprevious scenario where in we were not using any Ball Milland no refurbishing of Melangeur was done.
This is directly in line with what Goldratt had proposed thatmaximum capacity production can be achieved bytargeting and eliminating the bottleneck one after the other.
11

8/10/2019 GroupO1 OPM1 Scharffen Berger
http://slidepdf.com/reader/full/groupo1-opm1-scharffen-berger 12/14
But the target to be achieved is around 150% by the start of2006 because their production is driven by demand in themarket.
Following on the previous lines of elimination of bottlenecksby increasing the shifts and machines we see that a growth incapacity is possible.
12

8/10/2019 GroupO1 OPM1 Scharffen Berger
http://slidepdf.com/reader/full/groupo1-opm1-scharffen-berger 13/1413
Process Output inonecycle(kg)
Machinesinstalled
Timetaken(minutes)
8-Hourshifts
End ofdayproduction
(kg perday)
BeanCleaner
96 1 15 2 6144
Roaster 250 1 75 3 4800
Winnower 185 1 15 1 5920
Melangeur 115 2 37.5 3 4416
Ball Mill 1400 2 450(avg.of both)
3 4480
Temper 140 1 60 3 3360
Mold 140 1 20 2 6720

8/10/2019 GroupO1 OPM1 Scharffen Berger
http://slidepdf.com/reader/full/groupo1-opm1-scharffen-berger 14/14
In the final process, the ultimate bottleneck turns out to beTemper whose production in kg in one day is 3,360 kg in aday.
End of month production = 3360*30 = 1,00,800 kg per month.
Hence, the percentage increase in production capacity= [(100800-40000)/40000]*100
= [60800/40000]*100= 152%
14