UCF REU: Weeks 1 & 2. Gradient Code Gradient Direction of the Gradient: Calculating theta.

Groundwater Pollution
Water Pollution III• Types of Aquifers
• Groundwater Flow Physics
➔ Darcy’s Law and Hydraulic Gradient
➔ Movement of Underground Plumes
➔ Cleanup
• Stormwater Flows
➔ Contamination Sources
➔ Impacts, Solutions
• 1980 Comprehensive Environmental
Response, Compensation and Liability
Act (CERCLA), more commonly known
as Superfund.
• 300,000 – 400,000 sites need
remediation. Many can be cleaned up
for ~$100,000, but some require
millions. Total ~0.5–1 trillion dollars.
➔ The annual Gross Domestic Product (GDP)
is currently 10 trillion dollars.
Groundwater Pollution Facts
• To date, roughly 10 billion has been spent on superfund site remediation.
• 1984 Resource Conservation and
Recovery Act (RCRA). This legislation hopes to avoid more superfund sites.
1
2
3
4

Groundwater Structure
Unconfined aquifers: typically bounded
below by a non-porous layer but are not
bounded above.
Confined aquifers: sandwiched between
two rock layers.
The quantity of water in an aquifer is determined by its porosity.
➔ Fails to account for the amount of water
that will be retained due to surface tension
at the solid interfaces.
• The specific yield tells the amount of water that can actually be withdrawn
(of the total volume).
Porosity η( ) = volume of voidsvolume of voids and solids
Material Porosity (%) Specific Yield (%)Clay 45 3Sand 34 25
Gravel 25 22Gravel and Sand 20 16
Sandstone 15 8Limestone or Shale 5 2Quartz or Granite 1 0.5
For an aquifer of sand with cross sectional area
of 1 m2 and depth of 2 m, the volume of water is:
Volume of water = Porosity( ) Vol. of material( ) = 0.34 × 2 m3 = 0.68 m3
Yield of water = Specific yield( ) Vol. of material( ) = 0.25 × 2 m3 = 0.5 m3
5
6
7
8

Groundwater FlowThe hydraulic gradient is defined as:
Where hi are the vertical heights
L is the horizontal distance.
The gradient is dimensionless, and can be
expressed as:
Hydraulic gradient =h2 − h1
L
Hydraulic gradient =dhdL
Darcy’s Law for flow through porous media
Q = flow rate (m3/day)
K = hydraulic conductivity (m/day)
A = cross-sectional area (m2)
Material Hydraulic Conductivity (m/day)*Clay 0.0004
Sand 41Gravel 4100
Gravel and Sand 410Sandstone 4.1
Limestone, Shale 0.041Quartzite, Granite 0.0004
*Note that the actual values can vary by several orders
of magnitude, and aquifers are highly non-homogeneous.
Q = KAdhdL
Example
A confined aquifer 20 m thick has two wells
spaced 500 m apart, and the difference in the
water levels at the two wells is 2 m. The
hydraulic conductivity is 50 m/day (assume an
arbitrary width of 1 m). What is the flow rate?
Q = KA dhdL
= 50 mday
⎛⎝⎜
⎞⎠⎟
1 m( ) 20 m( ) 2 m500 m
= 4 m3
day (per meter of width)
From Darcy’s Law,
we can get the Darcy Velocity:
Q = KAdhdL
v =QA
9
10
11
12

• Darcy’s Law Velocity is for flow through the total porous media per m3 of aquifer volume
➔ Underestimates the actual groundwater
flow in proportion to the porosity.
➔ The cross-sectional area available for
flow, A′, is less than the overall cross-
sectional area of the aquifer A.
Movement of Toxic Plumes
(using an arbitrary length, L)
Then,
Porosity
Q = Av = ′A ′v
′v =ALv′A L
=Total Volume × ′v
Void Volume
η =Volume of voids
Volume of voids and solids
′v =Darcy velocity
Porosity=
vη
=Kη
dhdL
⎛⎝⎜
⎞⎠⎟
ExampleSuppose the second well in the earlier
example was a drinking water well, and the
first (upstream) well was a monitoring well. If
a toxic plume is detected at the first well, how
long will it take before it arrives at the second
well? The porosity is 35%.
Note that the Darcy velocity was
The time to travel the 500 m is:
′v =Darcy velocity
Porosity=
vη
=Kη
dhdL
⎛⎝⎜
⎞⎠⎟
⇒ ′v =50 m
day
0.35×
2 m500 m
= 0.57 mday
v = 50 mday
× 0.004 = 0.2 mday
t =500 m0.57 m
day= 877 days = 2.4 yr
This value isn’t very accurate because of the
following 3 assumptions:
1. We ignored diffusion and dispersion of the
plume, but it does spread out
2. We assumed that the plume moves at the
same speed as groundwater—it doesn’t.
3. We ignored the “pulling” effect of the well.
13
14
15
16
• Diffusion involves the random motion of molecules
➔ The macroscopic velocity is an average of
molecular velocities
➔ The molecular velocities have a
distribution of speeds that follows a
Boltzmann distribution.
Diffusion and Dispersion
• Dispersion results from the inhomogeneity in the porous media.
➔ Some parts of the flow find areas where
the pores are larger and move more
quickly
➔ Some are retarded by other parts of the
media.
• Diffusion and dispersion combine to create
hydrodynamic dispersion. They smear out the
edge of the plume.
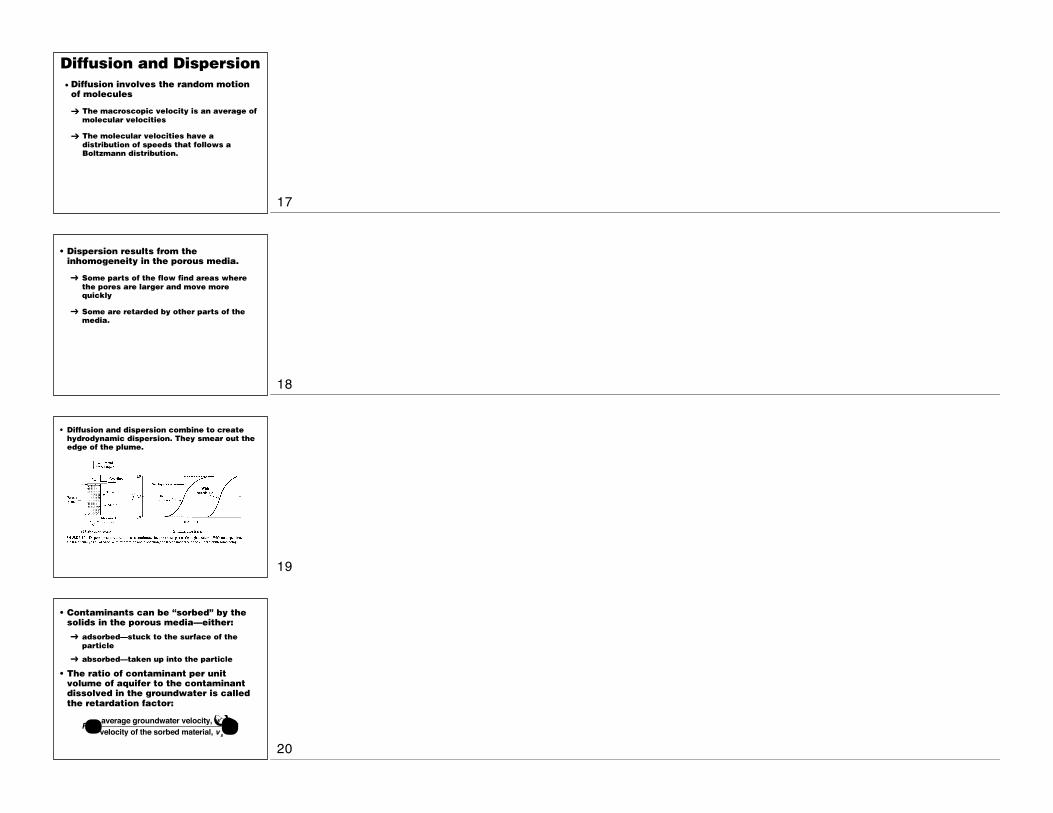
• Contaminants can be “sorbed” by the solids in the porous media—either:
➔ adsorbed—stuck to the surface of the
particle
➔ absorbed—taken up into the particle
• The ratio of contaminant per unit volume of aquifer to the contaminant dissolved in the groundwater is called
the retardation factor:
R =average groundwater velocity, ′vvelocity of the sorbed material, vs
≥ 1
17
18
19
20
Cl– has a retardation factor of 1, since it is
completely dissolved in the ground water.
Retardation of 5 means ?? % is in the
water.
Implication for water treatment:
You have to pump and treat more than
once to get the water clean!
Groundwater and Stormwater
Contamination
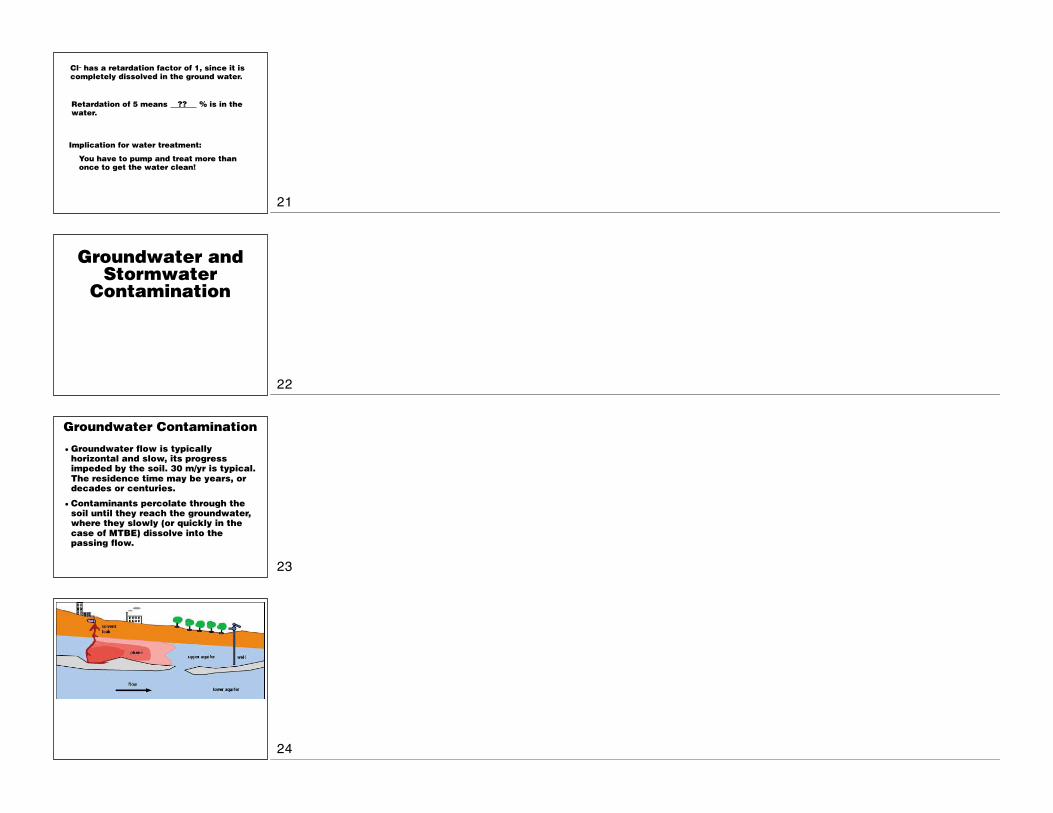
• Groundwater flow is typically horizontal and slow, its progress impeded by the soil. 30 m/yr is typical.
The residence time may be years, or decades or centuries.
• Contaminants percolate through the soil until they reach the groundwater, where they slowly (or quickly in the
case of MTBE) dissolve into the passing flow.
Groundwater Contamination
21
22
23
24

In the San
Fernando Valley,
groundwater
follows the path of
the L. A. River,
flowing from west
to east across the
valley (~5 feet/yr),
then funneling
south through the
LA River Narrows
(~1300 feet/yr.)
• There are three key water-bearing zones:
upper alluvium, lower alluvium, and deep zone.
Alluvial aquifers are water-bearing layers of
sand and gravel from the slowly eroding
surrounding mountains.
• The upper alluvium is from the surface to 200–
250 feet, is not fully saturated, and is quite
sensitive to recharge and water usage.
• The lower alluvium extends to depths of 400–
600 feet, separated from the upper zone by a
layer of about 50 feet of finer sediments,
which somewhat protects the lower zone from
water quality problems.
Historical depths for Well 3700A (near Reseda) and
Well 3914H (near Glendale). For both wells, water
was at high water levels into the late 1940’s followed
by a steady decline due to drought and continued by
increased water demands.
In 1980, traces of industrial solvents, especially
TCE and PCE, were detected in San Fernando
Valley production wells.
This discovery led to drastic reductions in
groundwater extraction, particularly in the
highly industrialized eastern end of the basin.
The soils underlying many prominent factories
of The Valley were affected by spills and leaks
of these compounds and other toxic chemicals.
The reduced pumping of the late 1970s may
have first brought the groundwater in contact
with many of these spills!
The San Fernando Valley had become a gigantic
Superfund site.
25
26
27
28

~17 miles long with ~200 trillion gallons of
contaminated groundwater.
The time-frame for cleanup (extraction and
cleaning of the water) is three decades or
longer.
Trichloroethylene
(TCE) in San
Fernando Valley's
upper aquifer in
the San Fernando
Valley in the
Spring of 1996
• Exploratory drilling and well sampling to characterize the spill and engineer cleanup strategies (~several years).
➔ Long legal battles (~decade).
➔ Pump and treat the water (~decades).
Cleaning Groundwater
• This water moves at about 1 km/year.
• Burbank actually pumps and treats water. They
spray the water and send the vapor to an
activated charcoal filter, which eventually gets
saturated, landfilled and replaced.
Stormwater Pollution
29
30
31
32
• Most of the contaminated water reaching our beaches and coastal waters is through stormwater
discharges.
➔ Crosses yards, roof tops, parking lots and
freeways on its way to the ocean.
• Lawns and gardens release nutrients and pesticides, streets release
hydrocarbons, oil and grease and heavy metals associated with motor vehicles.
Stormwater
• Ballona Creek stormwater is elevated in many pollutants, such as heavy metals (zinc, lead, copper, and nickel).
• Another problem with storm drains is dry weather flow➔ natural drainage➔ Excessive irrigation of
lawns, leakage, car washing, hosing down of streets and sidewalks, and other small sources.
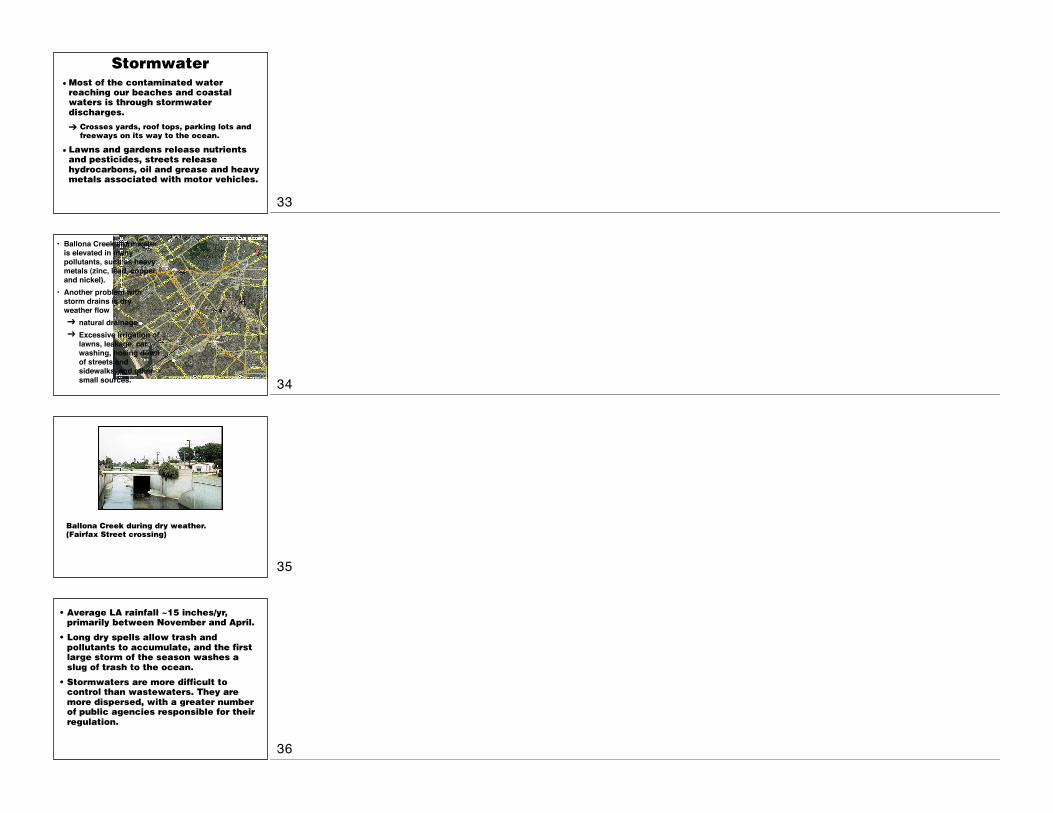
Ballona Creek during dry weather.
(Fairfax Street crossing)
• Average LA rainfall ~15 inches/yr, primarily between November and April.
• Long dry spells allow trash and
pollutants to accumulate, and the first large storm of the season washes a
slug of trash to the ocean.
• Stormwaters are more difficult to control than wastewaters. They are
more dispersed, with a greater number of public agencies responsible for their
regulation.
33
34
35
36

• Stormwater flow= (rainfall)(surface area)(runoff coeff.)
➔ The runoff coefficient depends on the land
surface permeability.
–Open areas, with vegetation have low
runoff coefficients (< 20–30% of the rain
flows to the storm drain)—most of the
water percolates into the soil.
–Paved areas have higher runoff
coeficients.
Source of Stormwater
–In West LA, 60% of rainfall becomes runoff.
–In greater LA, 5% of rainfall once ran into
the ocean; now about 50% does.
–Currently we allow $100 million/year of
water we could use to recharge our
aquifers just flow into the ocean.
Where does the stormwater go?
• Stormwater makes its way from the street in front of your house or your roof drains directly to the ocean
through a series of increasingly larger pipes, channels, creeks and rivers.
• Stormwater reaches the ocean untreated.
The stormwater may overload the sanitary
sewer and cause it to overflow at a
downstream location. This contains bacteria
and other pollutants that can cause a serious
health risk at the beach.
Ballona Creek during a
large storm.
37
38
39
40
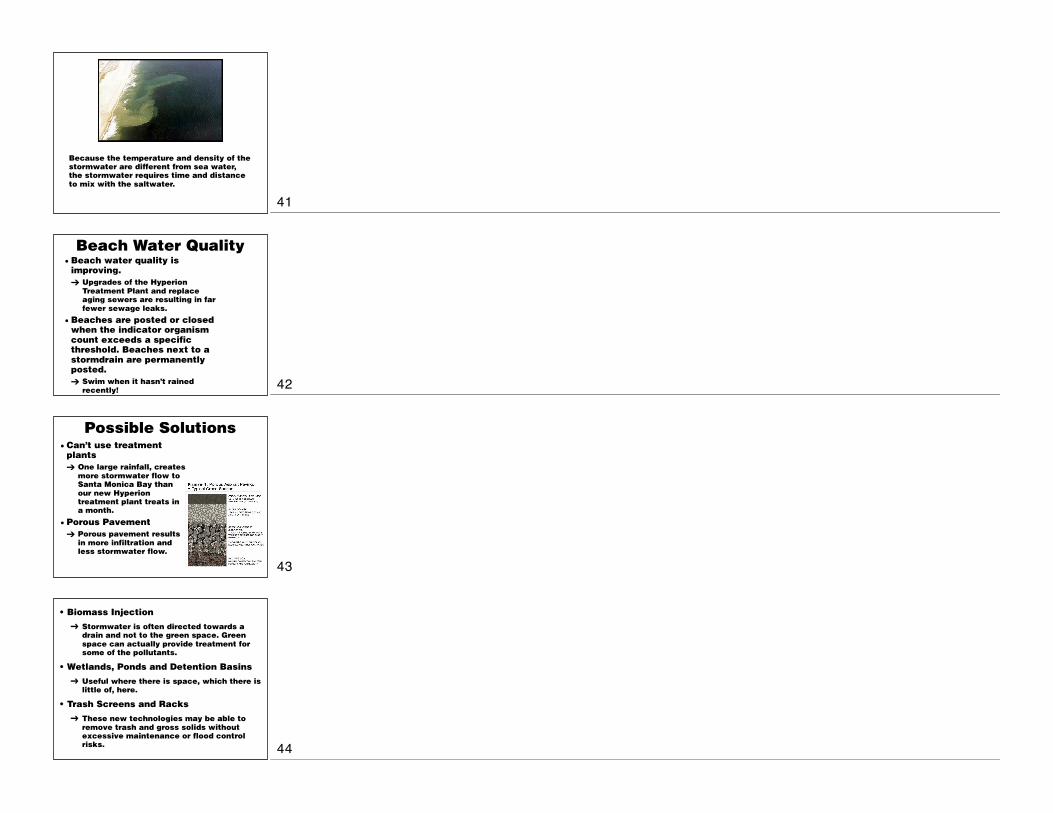
Because the temperature and density of the
stormwater are different from sea water,
the stormwater requires time and distance
to mix with the saltwater.
Beach Water Quality• Beach water quality is
improving.
➔ Upgrades of the Hyperion
Treatment Plant and replace
aging sewers are resulting in far
fewer sewage leaks.
• Beaches are posted or closed when the indicator organism
count exceeds a specific threshold. Beaches next to a
stormdrain are permanently posted.
➔ Swim when it hasn’t rained
recently!
Possible Solutions
• Can’t use treatment plants
➔ One large rainfall, creates
more stormwater flow to
Santa Monica Bay than
our new Hyperion
treatment plant treats in
a month.
• Porous Pavement
➔ Porous pavement results
in more infiltration and
less stormwater flow.
• Biomass Injection
➔ Stormwater is often directed towards a
drain and not to the green space. Green
space can actually provide treatment for
some of the pollutants.
• Wetlands, Ponds and Detention Basins
➔ Useful where there is space, which there is
little of, here.
• Trash Screens and Racks
➔ These new technologies may be able to
remove trash and gross solids without
excessive maintenance or flood control
risks.
41
42
43
44

• Low Flow Diversion
➔ It is possible to pump the dry weather flow
from stormdrains to sanitary sewers.
• Street Sweeping and Catch Basin Cleaning
➔ Street sweeping prevents trash and gross
pollutants from entering stormdrains. Need
to increase the recovery of small particles.
• Product Replacement and Pollution Prevention
➔ Certain products are more polluting than
others. Some automobile brake pads have
high metal content, some do not. Cover for
product inventory, reduce leaks, etc. etc.
• Find and eliminate illegal connections to stormdrains
➔ Many small businesses send some or all of
their waste to storm drains.
• Parks, ponds, porous swails
• Most or all of the above.
• Increase capacity of sewers?
• Fix sewer leaks?
45
46
47


![The Conjugate Gradient Method...Conjugate Gradient Algorithm [Conjugate Gradient Iteration] The positive definite linear system Ax = b is solved by the conjugate gradient method.](https://static.fdocuments.in/doc/165x107/5e95c1e7f0d0d02fb330942a/the-conjugate-gradient-method-conjugate-gradient-algorithm-conjugate-gradient.jpg)