
Groundwater Modeling Presentation - Universität Kassel · Khezr-zende Spring Khezr-elias Spring...
21
Studying the effects of an irrigation/drainage network on groundwater table fluctuations using 3D groundwater flow modeling Mohammad Zare Manferd Koch Dept. of Geotechnology and Geohydraulics, University of Kassel, Kassel, Germany
-
Upload
phungquynh -
Category
Documents
-
view
215 -
download
0
Transcript of Groundwater Modeling Presentation - Universität Kassel · Khezr-zende Spring Khezr-elias Spring...

Studying the effects of an irrigation/drainage network on groundwater table fluctuations using 3D
groundwater flow modeling
Mohammad ZareManferd Koch
Dept. of Geotechnology and Geohydraulics, University of Kassel, Kassel, Germany
� Changing hydrological conditions occurring, for example,future climate change by alterations of temperatures andprecipitation will have detrimental effects on the surface andgroundwater resources in many areas of the world
� Responding to all these water demands and converting weakpoints and threats to this resource to newcapabilities andopportunities necessitates the use of appropriate waterresources management strategies more than ever before.
Conclusions Results and Discussion Material and Methods Introduction
1
Introduction

� finding suitable methods and models for conjunctive use ofsurface water and groundwater resources, that have maximumefficiency, is one main priority in water resourcesmanagement.
� This holds particularly for regions and countries which arealready nowadays affected by water scarcity, such as theMiddle Eastern region, including Iran.
Conclusions Results and Discussion Material and Methods Introduction
2
Introduction

� One particularly water-affected region in the west of Iran is theMiandarband plain, where groundwater serves as the mainsource of agricultural irrigation.
� The construction of the Gavoshan Dam’s irrigation anddrainage network is a national project in Miandarband plainthat is supposed to be realized in the near future. Although themain goal of this project is the agricultural development in thebasin, some of its effects could also be undesirable, due to alack of effective water resources management.
Conclusions Results and Discussion Material and Methods Introduction
3
Introduction

� In present study, groundwater flowin the Miandarband plainwill be studied and then the effects of the construction of theGavoshan Dam’s irrigation and drainage network on thegroundwater resources in the region will be simulated, usingthe MODFLOW groundwater flowmodel in the GMS 6.5environment.
Conclusions Results and Discussion Material and Methods Introduction
4
Introduction

Conclusions Results and Discussion Material and Methods Introduction
5
Literature Review
year Researcher Description
2006 Kim&Soltan
simulated the impacts of an irrigation and drainage network on theNubian aquifer’s, Egypt, groundwater resources usingMODFLOW
2009 Kumaret al simulated groundwater flow in a section of the Western YamunaCanal (WYC) in Haryana state (India) during May 1985– May2004 by Visual-MODFLOW
2012 Kochet al Groundwater resources problems in Thailand have beennumerically analyzed

� The Miandarband plain is located in western Iran, near the cityof Kermanshah. This region is geographically limited in theNorth by the Gharal and Baluch mountains and in the South bythe Gharsu River and has a surface area of about 280km2
Conclusions Results and Discussion Material and Methods Introduction
6
The Study Area

� Meteorological as well as hydrological data are required forthe development and calibration of a mathematical and/ornumerical groundwater model. In the present study datarecorded over a period of 35 years are employed
� long-term averages of the monthly inflowand outflowdischarge data at the three gauging stations used in theanalysis.
Conclusions Results and Discussion Material and Methods Introduction
7
Hydro-meteorological data
Annual. Mar Feb Jan Dec Nov Oct Sep Aug Jul Jun May Apr Parameter 447 79.1 76.6 49.9 60.5 49.2 11.2 0.7 0.25 0.1 2.1 41.1 76.1 Precipitation (mm)
1747.7 55.6 34.2 23.7 32.7 78.6 157.4 255.6 312.4 308.8 231.5 149 107.9 Potential ET. (mm) 13.8 6.5 2.5 2.1 5 10.1 16.1 21.9 26.5 26.4 21.5 16.1 11.6 Temperature (Co)
Annual Mar Feb Jan Dec Nov Oct Sep Aug Jul Jun May Apr Station 5.93 60.72 9.6 4.94 4.92 1.26 0.17 0.1 0.16 0.42 1.71 10.24 22.41 Pirmazd 7.86 19.15 12.19 7.08 5.36 2.71 1.46 1.36 1.59 2.29 4.66 13.93 22.49 Hojatabad 5.15 13.06 6.33 4.22 3.95 2.27 1.19 0.95 1.16 1.84 3.05 8.6 15.23 Doab-mereg

� With regard to hydrogeological data, there are 1,160 wells and7 springs in the study area
� According to the water statistics for year 2003, agricultureused 151.928 MCM/year of groundwater reservoir whichcorresponds to an average pumping rate of 4.15L/s for eachwell.
Conclusions Results and Discussion Material and Methods Introduction
8
Hydrogeological data

Bernjan Spring
Varmenje Spring
Sourkal Spring
Razavar River
Khezr-zende Spring
Khezr-elias Spring
Hashilan Spring
Yavari Spring
Gharasoo River
Natural Stream

� Based on the geological information inferred fromthe drillinglog cores at the 8 well locations the groundwater aquifer isdivided vertically into 11 horizontal layers, These layers aremade of the following soils/soil-mixtures: 1. clay, 2. clay-sand,3. clay-gravel, and 4. gravel-stone. Each of these soil materialshas a certain permeability or, more important for groundwatermodeling studies, a hydraulic conductivity k, which will beused and refined in the later model calibration task.
Conclusions Results and Discussion Material and Methods Introduction
9
Stratigraphy layering

� Groundwater flowdirection, recharge and discharge areas,hydraulic interaction of surface-groundwater resources andother hydrogeological characteristics of the Miandarband plainhave been obtained frompiezometric head data recorded on amonthly base at 24 wells during the time period 1991-2008.
� The piezometric isolines generated fromthe pointmeasurements made in April 2006 using an inverse distanceweighting (IDW) interpolation
Conclusions Results and Discussion Material and Methods Introduction
10
Groundwater characteristics of the Miandarband plain
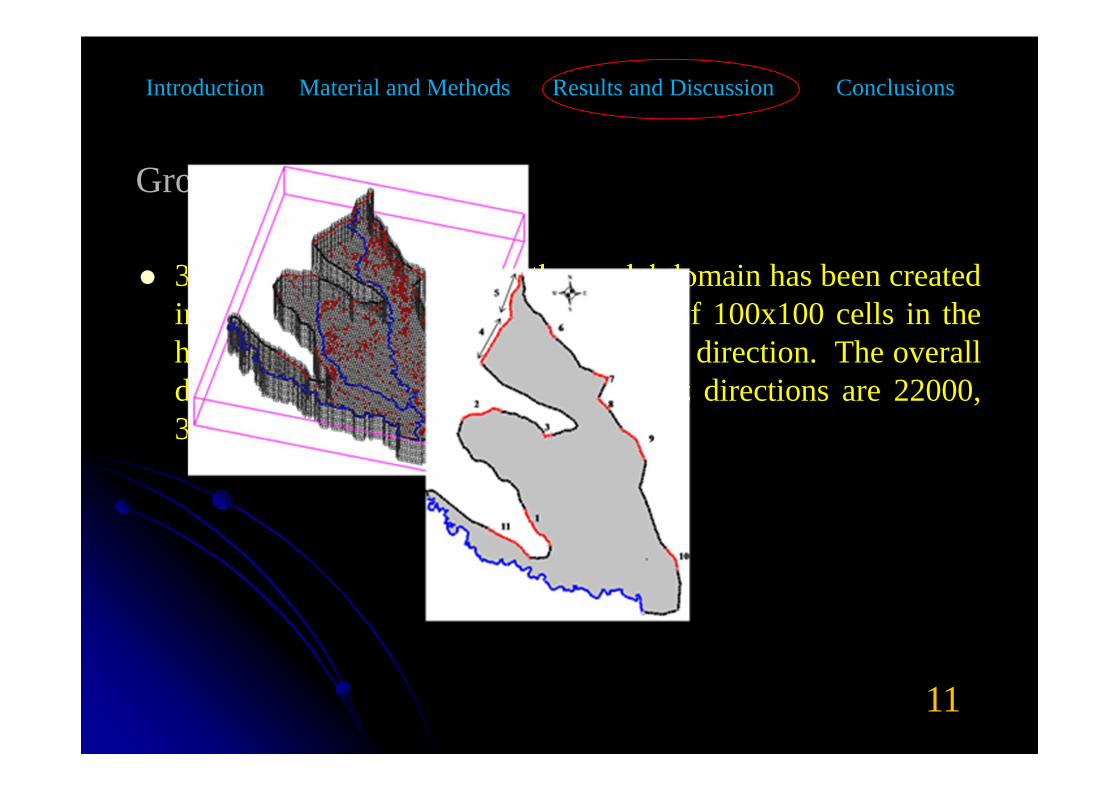
� 3D finite difference grid of the model domain has been createdin the GMS- environment, consisting of 100x100 cells in thehorizontal-, and 11 layers in the vertical direction. The overalldimensions of the model in x, y and z directions are 22000,30000 and 203 meters, respectively
Conclusions Results and Discussion Material and Methods Introduction
11
Groundwater flow model

� Surficial aquifer recharge frominfiltration of rainwater is notincluded in the sink&source layer menu and must be specifiedextra. For calculating the monthly recharge (infiltration) R, thefollowing FAO equations have been used
where P is the monthly precipitation (mm); E, the monthlypotential evapotranspiration (mm), and C is a constant coefficientthat is related to the monthly average temperature T (Co).
Conclusions Results and Discussion Material and Methods Introduction
12
Surficial aquifer recharge
Annual Mar Feb Jan Dec Nov Oct Sep Aug Jul Jun May Apr Parameter 520.75 16.5 184.75 88.75 18.25 86.25 0 0 0 0 0 45.5 80.75 P (mm) 1254.38 52.15 18.55 8.33 23.38 52.71 106.2 174.2 241.2 244..3 167.7 90.09 75.67 E (mm)
---- 6.45 2.5 2.15 5 10.1 --- --- --- --- --- 16.05 11.55 T (oC) ---- 1.45 1 0.94 1.31 1.74 --- --- --- --- --- 2.09 1.83 C
44.03 2.97 10.84 7.5 3.24 7.3 0 0 0 0 0 5.15 7.03 R (mm) 12.23 0.83 3.03 2.1 0.91 2.04 0 0 0 0 0 1.44 1.97 VR (MCM)
� An important part of any groundwater modeling task is themodel calibration process.
� the model calibrations have been done in both steady-state andtransient mode, whereby the hydraulic conductivity K has beencalibrated for steady-state conditions, and the specific yieldSyand the two conductancesCond used in the general headboundary condition (CGHB) and for the streambed in the riverpackage (CRIV) have been calibrated in the transient simulationmode
Conclusions Results and Discussion Material and Methods Introduction
13
Model calibration

� For the transient calibrations, the model was run for the May2007 to March 2008 time period, using the head results of theoptimal steady-state April 2007 calibration run as startingheads. To calibrate Sy, CGHB and CRIV by trial and error, themodel had to be run more than 200 times. For Sy a value of0.022 was finally obtained..
Conclusions Results and Discussion Material and Methods Introduction
14
Model calibration

� Model verification serves to check if the calibrated model isable to predict observed hydraulic heads for later time periodsnot yet used in the calibration process. As the transientcalibration was performed for the May 2007 - March 2008-period, for verification the heads measured in the subsequentmonth, April 2008, is used. The results showa very goodagreement between simulated and observed groundwaterheads, with a coefficient of determination R2= 0.99, is alsoobtained for this month of verification
Conclusions Results and Discussion Material and Methods Introduction
15
Model verification

� It is expected that this irrigation & drainage network willconvey about 176.2 MCM/year of surface water fromtheGavoshan Daminto the Miandarband plain, where it will beused for agricultural irrigation. It is expected that the futureuse of groundwater will then be reduced or even stopped, sothat the groundwater table may rise and waterloggingconditions may occur.
Conclusions Results and Discussion Material and Methods Introduction
16
Effects of the construction of an irrigation & drainage network on the groundwater table

� The results shows after 1 year the groundwater table in thecenter of the plain has risen by 1.8 m which goes up to 3.2mand 5.2 m after 5 and 10 years, respectively. The resultsindicate further that after 1, 5 and 10 years of the irrigationoperation 6.59%, 37.91% and 56.28% , respectively, of theplain’s surface area will be waterlogged..
Conclusions Results and Discussion Material and Methods Introduction
17
Effects of the construction of an irrigation & drainage network on the groundwater table

� The results showthat already after 10 years of irrigationoperation more than 50% of the plain’s surface will bewaterlogged. Therefore, an effective water resourcesmanagement strategy is required to prevent this imminentwaterlogging problem.
� One well-suited policy approach to that regard would be theapplication of optimally managed conjunctive surface-groundwater operations
Conclusions Results and Discussion Material and Methods Introduction
18
THANK YOU


