Groundwater flow and phosphate dynamics surrounding a high discharge wastewater disposal well in the...
18
Groundwater flow and phosphate dynamics surrounding a high discharge wastewater disposal well in the Florida Keys Kevin Dillon a, * , William Burnett a , Guebuem Kim a,1 , Jeffrey Chanton a , D. Reide Corbett a,2 , Katherine Elliott b,3 , Lee Kump b a Department of Oceanography, The Florida State University, Room 325 OSB, West Call Street, Tallahassee, FL 32306-4320, USA b Department of Geosciences, The Pennsylvania State University, University Park, PA 16802-2712, USA Received 27 August 2002; accepted 1 August 2003 Abstract Two artificial tracer experiments (June 1998 and September 1999) were conducted in a groundwater system surrounding a high-volume (500 – 1200 m 3 /d) wastewater disposal well in the Florida Keys to determine the fate of wastewater borne phosphate in the subsurface. SF 6 served as the conservative groundwater tracer in both experiments. Groundwater transport rates are bimodal in nature, both horizontally and vertically. Diffusive/dispersive-type flow attributed to the limestone’s primary porosity was estimated to have rates below 0.3 m/d. The most rapid conduit flow due to the limestone’s secondary porosity was as high as 20 m/d in the well field and even higher, up to 123.3 m/d, immediately adjacent to the point of injection. Typical transport rates were approximately five times higher in the 1999 experiment than those observed in 1998 commensurate with a wastewater discharge increase from 0.63 £ 10 6 to 2.32 £ 10 6 l/d. The second experiment used radiolabelled phosphate as the reactive tracer and showed that 32 PO 4 was rapidly adsorbed onto Key Largo limestone. Recirculation experiments using core material from the site and phosphate-rich water showed a rapid initial uptake of phosphate followed by a slower adsorption until an equilibrium concentration of approximately 26 mM was reached. Addition of phosphate-free water to the same core material showed a release of PO 4 into solution until the same equilibrium concentration was reached. The limestone matrix underlying the study site appears to act as a phosphate buffer once exposed to phosphate-rich water. The mechanisms controlling this buffering capacity are poorly understood at this time. q 2003 Published by Elsevier B.V. Keywords: Phosphate adsorption; Artificial groundwater tracers; Limestone; Nutrients; Sulfur hexafluoride; Phosphate; Radiolabelled phosphate 1. Introduction Although sewage disposal practices are becom- ing more efficient at nutrient removal, the sheer volume of wastewater continues to increase at an alarming rate. In addition, monetary constraints and logistics often limit the degree to which wastewater 0022-1694/$ - see front matter q 2003 Published by Elsevier B.V. doi:10.1016/j.jhydrol.2003.08.001 Journal of Hydrology 284 (2003) 193–210 www.elsevier.com/locate/jhydrol 1 Present address: School of Earth and Environmental Sciences, Seoul National University, Seoul 151-742, South Korea. 2 Present address: Department of Geology, Coastal Resources Management, East Carolina University, Greenville, NC 27858, USA. 3 Present address: URS Greiner Corporation, Blue Bell, PA 19422, USA. * Corresponding author. Tel.: þ1-850-644-6525; fax: þ 1-850- 644-2581. E-mail address: [email protected] (K. Dillon).
-
Upload
kevin-dillon -
Category
Documents
-
view
213 -
download
0
Transcript of Groundwater flow and phosphate dynamics surrounding a high discharge wastewater disposal well in the...

Groundwater flow and phosphate dynamics surrounding a high
discharge wastewater disposal well in the Florida Keys
Kevin Dillona,*, William Burnetta, Guebuem Kima,1, Jeffrey Chantona,D. Reide Corbetta,2, Katherine Elliottb,3, Lee Kumpb
aDepartment of Oceanography, The Florida State University, Room 325 OSB, West Call Street, Tallahassee, FL 32306-4320, USAbDepartment of Geosciences, The Pennsylvania State University, University Park, PA 16802-2712, USA
Received 27 August 2002; accepted 1 August 2003
Abstract
Two artificial tracer experiments (June 1998 and September 1999) were conducted in a groundwater system surrounding a
high-volume (500–1200 m3/d) wastewater disposal well in the Florida Keys to determine the fate of wastewater borne
phosphate in the subsurface. SF6 served as the conservative groundwater tracer in both experiments. Groundwater transport
rates are bimodal in nature, both horizontally and vertically. Diffusive/dispersive-type flow attributed to the limestone’s primary
porosity was estimated to have rates below 0.3 m/d. The most rapid conduit flow due to the limestone’s secondary porosity was
as high as 20 m/d in the well field and even higher, up to 123.3 m/d, immediately adjacent to the point of injection. Typical
transport rates were approximately five times higher in the 1999 experiment than those observed in 1998 commensurate with a
wastewater discharge increase from 0.63 £ 106 to 2.32 £ 106 l/d. The second experiment used radiolabelled phosphate as the
reactive tracer and showed that 32PO4 was rapidly adsorbed onto Key Largo limestone. Recirculation experiments using core
material from the site and phosphate-rich water showed a rapid initial uptake of phosphate followed by a slower adsorption until
an equilibrium concentration of approximately 26 mM was reached. Addition of phosphate-free water to the same core material
showed a release of PO4 into solution until the same equilibrium concentration was reached. The limestone matrix underlying
the study site appears to act as a phosphate buffer once exposed to phosphate-rich water. The mechanisms controlling this
buffering capacity are poorly understood at this time.
q 2003 Published by Elsevier B.V.
Keywords: Phosphate adsorption; Artificial groundwater tracers; Limestone; Nutrients; Sulfur hexafluoride; Phosphate; Radiolabelled
phosphate
1. Introduction
Although sewage disposal practices are becom-
ing more efficient at nutrient removal, the sheer
volume of wastewater continues to increase at an
alarming rate. In addition, monetary constraints and
logistics often limit the degree to which wastewater
0022-1694/$ - see front matter q 2003 Published by Elsevier B.V.
doi:10.1016/j.jhydrol.2003.08.001
Journal of Hydrology 284 (2003) 193–210
www.elsevier.com/locate/jhydrol
1 Present address: School of Earth and Environmental Sciences,
Seoul National University, Seoul 151-742, South Korea.2 Present address: Department of Geology, Coastal Resources
Management, East Carolina University, Greenville, NC 27858,
USA.3 Present address: URS Greiner Corporation, Blue Bell, PA
19422, USA.
* Corresponding author. Tel.: þ1-850-644-6525; fax: þ1-850-
644-2581.
E-mail address: [email protected] (K. Dillon).

can practically be treated and disposed. The Florida
Keys are a prime example of a coastal community
that is very limited in their ability to dispose of
treated wastewater. The isolation of these popular
islands limits the disposal methods to on-site
treatment facilities such as septic tanks and small
treatment plants; the latter typically disposing of
advanced treated wastewater (ATW) via injection
wells (IWs) that are 18–27 m deep. The fate of
these disposed nutrients in the subsurface has
become a concern as the quality of the historically
oligotrophic water near the Keys has declined in
recent years (Phlips and Badylak, 1996; Phlips
et al., 1995, 1999; Fourqurean and Robblee, 1999).
Previous studies in the Keys have shown that
substances injected into the subsurface, whether it
be via septic tanks or disposal wells (18–27 m
depths), can be transported to nearby surface waters
in a matter of hours to days (Paul et al., 1997;
Dillon et al., 1999; Dillon et al., 2000) due to the
high permeability of the Key Largo Limestone
(KLL) underlying the upper Keys (north of Big
Pine Key).
KLL is composed of ancient hermatypic corals
with intra and interbedded calcarenites and thin beds
of quartz sand (Halley et al., 1995). The formation is
extremely porous due to conduits and interconnected
pore spaces created by ancient coral growth and
meteoric diagenesis (Harrison and Coniglio, 1985;
Dodd and Siemers, 1971; Vacher et al., 1992).
Porosity estimates from cores collected on Long
Key were ,50% in cores obtained with complete
recovery (Monaghan, 1996). Elliott (1999) found
small (1–2 cm) conduits in cores from Key Colony
Beach (KCB). Larger void areas, characterized by
poor core recovery, were common in these cores,
suggesting that void areas or highly permeable units
may be rather common. Estimates of hydraulic
conductivity (K) for KLL range from 1400 to
38,400 m/d (Vacher et al., 1992; Halley et al., 1995;
Dillon et al., 1999).
Estimates of horizontal groundwater transport rates
of less than 3.4 m/d have been associated with the
KLLs primary porosity while rates as high as 78.7 m/d
have been attributed to rapid conduit flow (Dillon
et al., 1999, 2000). In the case of disposal wells, it has
been shown that fresh wastewater buoys upwards after
injection due to the density differences between
the wastewater and the ambient hypersaline ground
waters at rates as high as 8.4 m/d (Shinn et al., 1994;
Dillon et al., 2000). Conduits or preferential flow
paths may also act to channel the wastewater upward.
Elevated nutrient concentrations have been
observed in canals and nearshore waters in the
Keys (Lapointe et al., 1990; Lapointe and Clark,
1992). Due to the oligotrophic nature of the aquatic
ecosystem of the Florida Keys, even small increases
in nutrient levels may have severe environmental
impacts such as an increase in coral reef mortality,
proliferations of nuisance algae and decreases in
seagrass abundances. Phosphate (PO4) is of particu-
lar concern as it has been shown to be the limiting
nutrient in Florida Bay (Powell et al., 1989;
Fourqurean et al., 1992a,b, 1993) as well as
nearshore waters of the Keys (Lapointe, 1989;
Lapointe and Clark, 1992).
The ability of calcium carbonate to adsorb PO4
has been documented by many researchers (Cole
et al., 1953; Kuo and Lotse, 1972; Griffin and
Jurinak, 1973; McGlathery et al., 1994). Corbett
et al. (2000) investigated the fate of wastewater-
borne nutrients at a low discharge (2600 l/d) ATW
disposal well on Long Key and determined that both
phosphate and nitrate (to a lesser degree) were
removed from solution in the subsurface. There was
an initial rapid uptake of PO4 presumably due to
adsorption to the KLL followed by a removal at a
slower rate, which was hypothesized to be due to
adsorption–desorption processes. These geochem-
ical processes removed most of the PO4 (85%) from
solution. Nitrate removal was also observed to a
lesser degree most likely due to denitrification in the
anoxic carbon-rich waters surrounding the IW. The
results from that study suggested that nutrients are
removed from solution and thus may not have a
significant impact on surface waters. However,
Corbett et al. (2000) pointed out that their study
was conducted at a low discharge well and that
processes may be different at a larger volume IW
due to saturation of available adsorption sites and
higher organic substrate availability.
This report investigates the largest wastewater
disposal well in the Keys using a dual-tracer
approach similar to that of Corbett et al. (2000) to
evaluate groundwater flow patterns as well as the
fate of PO4 in the subsurface environment. To
K. Dillon et al. / Journal of Hydrology 284 (2003) 193–210194

evaluate the fate of a reactive compound, such as
PO4, one needs to employ a conservative tracer that
can be used to account for dispersion and diffusion
processes that affect the solutions being injected. In
this case, sulfur hexafluoride (SF6) was employed as
such a tracer. Previous studies have shown that it
behaves conservatively in subsurface mediums such
as sand and KLL (Wilson and Mackay, 1993;
Corbett et al., 2000). It also has the advantage of a
low detection limit making it an effective tracer in
systems with high dispersion rates (Wanninkhof
et al., 1991).
Radiolabelled phosphate (32PO4) was chosen as
our reactive tracer for several reasons. A tracer was
requited that would behave similarly to stable PO4
that would allow for discrimination between the
injected tracer and the elevated concentrations of
ambient PO4 that have developed after 5 years of
injection into the disposal wells. In addition,
sample collection and processing needed to be
rapid due to the large numbers of samples that
would be generated in a short time. Another
advantage of 32PO4 is that its short half life (14.3
days) results in the decay of the tracer to
undetectable activities in a matter of months,
making additional tracer studies possible without
concern with residual tracer affecting the results. A
permit was required from the Florida Department
of Environmental Protection to use radiolabelled
phosphate and was contingent on obtaining per-
mission from the City of KCB.
The main objective of this study was to replicate
the study of Corbett et al. (2000) at a high discharge
site to determine if the 32PO4 would behave
differently under high ATW discharge conditions.
We hypothesized that phosphate adsorption rates
would not be as great due to higher flow and greater
nutrient and organic loading. We hypothesized that
the PO4 removal properties of the limestone would be
overwhelmed or saturated in this high volume
situation. Our objectives were to test these hypotheses
as well as to determine groundwater flow rates
(vertical and horizontal) using artificial groundwater
tracers. Additional objectives were to characterize the
size of the ATW plume and to document the evolution
of such a plume beneath a high volume wastewater
facility.
2. Methods
2.1. Study site and injection methods
KCB is a man-made island on the Atlantic side of
the Florida Keys just northeast of the city of Marathon
(Fig. 1). The island was built up over low lying
carbonate shoals in the 1950s using dredge material
from newly excavated canals and an imported marl-
like mud, which was laid over the limestone dredge
material. Like all of the upper Keys, the ambient
groundwater is typically saline to hypersaline
(.35 psu, practical salinity units), so it is not portable
and cannot be used for irrigation. Work from this and
a companion study (Elliott, 1999) shows that the mud
layer has very low permeability, extends to depths of
approximately 3–6 m and is underlain by KLL which
made up the original carbonate shoal. Elliott (1999)
calculated porosities of 52–60% in cores from KCB
with high recovery (.90%).
The approximately 500–1200 m3 of ATW (tertiary
treatment) that is generated daily on the island by an
on-site wastewater treatment facility is injected into
the subsurface to a depth of 18–27 m via an array of 5
IWs. Each well is cased to 18 m and screened to 27 m.
Under most conditions the effluent is injected into
only 1 or occasionally 2 of the centermost IWs.
Twelve monitoring well clusters have been installed
around the centermost IW, which receives the bulk of
the effluent. Each monitoring well cluster was
installed into a 15 cm diameter borehole drilled to
the maximum depth (usually 18.3 m) of the cluster.
To construct each well, PVC pipe was inserted into
the borehole to the desired depth, screened section
first. Monitoring well screens were 1 m in length. The
borehole was then backfilled with quartz sand to pack
around the sampling interval. Portland cement was
poured into grout the hole up to the depth for the next
well. Once the cement grout had set, the procedure
was carried out for the next well. After the desired
wells were installed, the upper 30 cm of the borehole
was cased with a 15 cm diameter PVC pipe and
backfilled with cement to about 10 cm from the
ground surface to fix the position of the wells. PVC
caps were then fit onto each well and then the cluster
was sealed with a rubber tension well cap. Each
cluster contains two or three monitoring wells placed
at various depths ranging from 3 to 18 m. Initially,
K. Dillon et al. / Journal of Hydrology 284 (2003) 193–210 195

only seven well clusters were installed (clusters A–G)
in order to conduct a preliminary tracer experiment to
determine groundwater flow rates and directions.
Wells are referred to by their cluster letter followed by
their depths, rounded to the nearest meter. For
example, the 18.3 m well in cluster A is referred to
as A-18.
The first tracer experiment was conducted in June
1998. A tracer injection slug was prepared by
sparging a 900 l parcel of tap water with SF6 for
80 min to saturate the slug with this gaseous tracer.
After the slug was prepared, it was sampled for SF6
and then pumped into the center disposal well at a
rate of 70 l/min. The surrounding monitoring well
clusters were subsequently sampled for the presence
of the tracer for 83 days. Canals to the east and west
of the well field were also sampled for SF6. The
staff of the KCB sewage treatment plant provided
daily disposal well flow rates. Nutrient samples
(NH4, NO2 þ NO3, and PO4) were collected from
each well on June 6, 1998.
After the initial experiment was completed, the
well field was reevaluated and five more monitoring
well clusters (clusters H–L, Fig. 1) were installed in
May 1999 to obtain better coverage of the subterra-
nean wastewater plume. After these new wells were
developed and allowed to equilibrate for several
months, the dual-tracer experiment (SF6/32P) was
conducted in September 1999. An injection slug was
prepared by sparging 1040 l of tap water with SF6 for
90 min. Next, 500 mCi of radiolabelled PO4 was
added to the slug as H3PO4. After mixing the slug with
a high-volume circulation pump, it was injected into
the centermost IW at a rate of 90 l/min. The
surrounding monitoring well clusters were then
sampled for SF6 and 32PO4 for 30 days. The hydraulic
head of each monitoring well were measured
regularly during the experiment in order to determine
the piezometric surface and the resultant flow
directions at various depths of the well field. In
addition, salinity was measured and nutrient samples
(NH4, NO2, NO3 and PO4) were collected from each
Fig. 1. Map of Key Colony Beach, FL. Well cluster positions are shown by their identification letter in the blowup. The centermost injection
well, which receives the majority of the ATW, is located between monitoring well clusters H and I.
K. Dillon et al. / Journal of Hydrology 284 (2003) 193–210196

well on day 8 of the experiment to evaluate the size of
the wastewater plume.
Horizontal groundwater transport rates were deter-
mined for each sampling location by dividing the
distance from the IW by the arrival time of the peak
SF6 concentration. Multiple well depths at each well
cluster also allowed vertical transport rates (VTRs) to
be calculated. For these vertical estimates, the
monitoring wells’ depths were subtracted from the
minimum injection depth (18.3 m) and then divided
by the arrival time of peak tracer concentration. These
vertical rates are therefore lower limits if the
wastewater injectate is originally injected to depths
deeper than 18.3 m. Previous work in the Keys has
shown that after injection, wastewater rises rapidly
due to the buoyancy of the wastewater plume and is
then advected in the direction of local groundwater
flow (Shinn et al., 1994; Dillon et al., 2000). Since
radial flow is limited to the immediate vicinity of the
point of injection, linear flow calculations rather than
radial flow calculations were used to characterize the
movement of wastewater beneath KCB.
2.2. Sampling methods
For the second experiment, the water level in each
monitoring well was measured with a Solinst water
level meter (Model 101) before the well was pumped.
Well heights for monitoring well clusters A through G
were surveyed with a computerized theodolite
surveying system, which could reproduce measure-
ments with an average standard deviation of 0.5 cm.
Each well’s height was measured relative to a USGS
monument designation with a stated elevation relative
to mean sea level. Hydraulic head measurements were
corrected to freshwater head (Custodio, 1987).
Salinity was measured with a hand-held refract-
ometer, which is accurate to ^1 psu.
Each well was purged for three well volumes
before being sampled for salinity, nutrients and/or
artificial tracers during this entire study. Due to the
tendency for SF6 to bind to plastics, each well had its
own unique piece of sampling tubing to prevent cross-
contamination. All samples were collected with a
peristaltic pump. SF6 samples from wells were
collected in 30 ml serum bottles while those from
canals were collected in 160 ml serum bottles. After
rinsing the tubing and the serum bottle three times,
each sample was pumped into the bottle with the
tubing at the bottom and allowed to overflow for
approximately three volumes. The sample was then
sealed with a rubber septum. To prevent loss of SF6
through the septa, the samples were stored upside
down until analysis.
Sample containers for 32PO4 analysis were not
rinsed with sample water prior to sample collection
due to the tendency of 32P to bind to surfaces. Tubing
was rinsed with sample water prior to sample
collection. The 1 l samples were pumped into clean
plastic containers, which were then sealed and
transported to the Keys Marine Laboratory where
the samples were processed and preliminary measure-
ments was made with a portable scintillation counter,
which was very helpful in the field to obtain real time
data. More accurate counts (which are reported here)
were made on all 32PO4 samples upon arrival at the
FSU Environmental Radioactivity Research Facility.
Nutrient samples from June 1998 were pumped
directly into 500 ml polyethylene bottles without
filtration due to an equipment failure. These samples
were frozen, transported back to the lab then thawed
and filtered before analysis was conducted. The
September 1999 nutrient samples were filtered
through ashed glass fiber filters (Whatman GF/F,
nominal pore size ¼ 0.7 mm) and collected in 250 ml
polyethylene bottles. Nutrient sample bottles were
rinsed with sample water three times, filled and frozen
until analysis could be performed. All nutrient
samples were analyzed within one month of
collection.
2.3. Sulfur hexafluoride analysis
Sulfur hexafluoride samples were analyzed with a
Shimadzu model 8A gas chromatograph equipped
with an electron capture detector. The gas chromato-
graph contained a stainless steel column
(180 cm £ 0.1 cm ID) packed with molecular sieve
5 A (80/100 mesh). Ultra-high purity nitrogen was
used as the carrier gas. Column and detector
temperatures were set at 90 and 220 8C, respectively.
Duplicate samples were collected for 10% of the
samples. In addition, duplicate measurements were
conducted on 20% of all the samples collected.
SF6 was extracted from the samples with a
variation of a headspace extraction technique:
K. Dillon et al. / Journal of Hydrology 284 (2003) 193–210 197

samples were extracted in the lab by adding a small
headspace (typically 4 ml) of ultra-high purity nitro-
gen to the sample. To allow room for the added
headspace, a volume of water from the sample bottle
had to be simultaneously removed and discarded. The
serum bottles were slightly over pressurized with
1 cm3 of nitrogen to allow several injection volumes
(100 ml or less) for the gas chromatograph (GC) to be
pulled from each sample. The samples were shaken
for 2 min to extract the SF6 from solution into the
headspace. The minimum detection limit for this
method is 1.0 pM (1 pM ¼ 10212 M) for 30 ml
samples and 0.1 pM for 160 ml samples. A more
detailed description of this headspace extraction
technique can be found in Dillon et al. (2000).
2.4. Radioactive phosphate (32PO4) analysis
The 1 l 32PO4 samples were first acidified with
concentrated HCl to pH ,2. Then, 1 ml 20 mM of
PO4 carrier (KH2PO4) was added for a final carrier
concentration of 20 mM, which is on the same order of
expected natural PO4 concentration in the pure
wastewater. The samples were then vigorously stirred
to equilibrate the natural PO4, the radioactive PO4,
and the carrier PO4. Next, 1 ml 300 mM of zirconium
carrier (ZrOCl2·8H2O dissolved in water) was added
to precipitate all the phosphate as ZrPO4. The samples
were stirred again while the precipitates formed. The
samples were allowed to settle for at least 30 min and
were then filtered through Whatman GF/B filters.
Filters were subsequently placed in a scintillation vial
with a cocktail/acid mixture and counted with a
Wallac 1414 liquid scintillation counter. After each
sample batch, all filtration apparatus were thoroughly
cleaned then rinsed with 6 M HCl followed by
deionized water to prevent cross-contamination. All32P activities were decay corrected back to the time of
injection. The detection limit for this method was
below the background beta activity (,32 dpm/l) for
groundwater at KCB. A more thorough description
and discussion of this protocol can be found in Kim
et al. (2001).
2.5. Nutrient analysis
For the June 1998 sampling campaign ammonia,
nitrate þ nitrite, and phosphate were measured by
automated spectrophotometry on a Technicon Auto-
analyzer II according to EPA methods. Lower limits
of detection for NH4, NO2 þ NO3 and PO4 were 1.8,
0.1, and 0.3 mM, respectively. Nutrient analyses for
the September 1999 sampling campaign are as
follows. Nitrate þ nitrite was measured with a
chemiluminescence detector (Braman and Hendrix,
1989) after being reduced to nitric oxide in an acidic
medium containing vanadium (III) at 80–90 8C.
Nitrite concentrations were determined colormetri-
cally as described by Strickland and Parsons (1972).
Nitrate concentrations were then determined by the
difference. The lower limit of detection for NO3 and
NO2 were 0.5 and 0.1 mM, respectively. Ammonium
was measured colormetrically with a modification of
the phenol-hypochlorite method described by Bower
and Holm-Hansen (1980). Soluble reactive phosphate
was also determined colormetrically as described by
Strickland and Parsons (1972). The lower limits of
detection for NH4 and PO4 were both 0.5 mM.
3. Results
3.1. First artificial tracer experiment: June 1998
Nutrient concentrations and salinity of ground-
water from each well on June 6, 1998 are presented in
Table 1. A cross-section of the well field’s salinity
values along a west to east transect (well clusters E, B,
A, C, and D) is shown in Fig. 2. On June 6, 1998 the
injected wastewater had a PO4 concentration of
93.0 mM and a salinity of 4 psu. Wells A-18, B-18
and C-9 had PO4 concentrations of 52.63, 50.69 and
25.51 mM, respectively. Well F-8 located 80 m north
of the IW had a PO4 concentration of 9.69 mM. Wells
E-9 and G-9 had respective PO4 concentrations of
1.94 and 1.61 mM. Wells D-9, D-14, and G-18 all had
PO4 concentrations of 0.65 mM. All other wells (A-9,
B-9, E-18, F-14 and F-18) had undetectable PO4
concentrations (,0.1 mM).
During the first 11 days of the June 1998
experiment, the average wastewater injection rate
was 6.3 ^ 0.8 £ 105 l/d. During this time, the center-
most IW was the only IW receiving wastewater. The
900 l injection slug injected on June 8, 1998 had a SF6
concentration of 27.32 ^ 3.41 mM. Peak tracer con-
centrations and times are summarized in Table 2
K. Dillon et al. / Journal of Hydrology 284 (2003) 193–210198

along with the calculated transport rates. At no time
during this experiment was tracer observed in any of
the shallow wells (4.6 m), which are located within
the impermeable mud layer. Elliott (1999) has shown
that water from this depth is anoxic and ammonium
rich. The mud layer appears to act as an aquitard,
preventing exchange between groundwater below the
mud layer and recharge from above.
The first major tracer flow path observed was
toward well C-9 (15 m southeast of IW). SF6
concentrations here rose rapidly, reaching a peak
concentration of 3.98 ^ 0.05 nM after 5.9 days
(Fig. 3a), a concentration approximately 6900 times
less than the injection slug. The normalized SF6 ratio,
which is the tracer concentration measured at a well
divided by the injection slug’s concentration multi-
plied by 106 (to put the ratio on a more convenient
scale) was 146. The low salinity at this well (6.7 psu)
indicates that the decrease in tracer concentration was
primarily from dispersion and diffusion of the tracer
into wastewater that has accumulated under the study
site. A horizontal transport rate (HTR) of 2.52 m/d
and a VTR of 1.54 m/d were calculated from these
results. No SF6 was detected in the deep well (18.3 m)
at well cluster C. At well cluster B (15 m southwest of
the disposal well), SF6 was only observed at the deep
well (18.3 m) reaching a maximum concentration of
1.96 ^ 0.01 nM (normalized SF6 ratio ¼ 71.7) at
10.0 days, yielding a HTR of 1.50 m/d (Fig. 3b).
Due to the heterogeneity of the limestone matrix,
buoyancy of the ATW plume, the variable wastewater
injection rate and the constant rise and fall of the water
Table 1
Salinity, ammonia, nitrate þ nitrite, and phosphate concentrations
from samples collected June 6, 1998
Sample Salinity
(psu)
[NH4]
(mM)
[NO2 þ NO3]
(mM)
[PO4]
(mM)
A-9 6.1 7.86 584 bd
A-18 29.5 bd 293 52.6
B-9 7.1 22.9 72.1 bd
B-18 13 bd 512 50.7
C-9 6.7 bd 821 25.6
C-18 38.8 4.29 bd 0.65
D-9 4.9a bd 435 0.65
D-14 36.9 22.1 0.79 0.65
E-9 6.4 7.14 33.8 1.94
E-18 29.8 22.1 2.43 bd
F-8 9.7 329 bd 9.69
F-14 35.4 22.1 43.5 bd
F-18 37.2 8.57 bd bd
G-9 8 52.1 2.50 1.61
G-18 36.6 23.6 1.00 0.65
ATW 4.8 36.4 1307 93.0
a ‘bd’ indicates the parameter was below the limit of detection
(1.39, 0.03 and 0.10 mM for NH4, NO2 þ NO3 and PO4, respect-
ively). Salinity at well D-9 was calculated from Naþ concentration
using the equation: Salinity ¼ 0.0208 þ 0.004385 £ [Naþ]
ðr2 ¼ 0:86Þ from data collected by Elliott (1999).
Fig. 2. Cross-section contour plot of salinity data from June 1998.
Data from well clusters along the west to east transect was used to
generate the plot. The main injection well is located 15 m due north
of well cluster A. The black dots show the location of the bottom of
each well screen in the cross-section.
Table 2
Peak SF6 concentrations, times and calculated transport rates for the
June 1998 artificial tracer experiment
Well Time
(days)
Peak
concentration
(nM)
Normalized
SF6 ratio
VTR
(m/d)
HTR
(m/d)
A-9 55.1 0.51 18.7 0.17 0.27
A-18 18.8 0.33 12.1 – 0.8
B-18 10 1.96 71.7 – 1.5
C-9 5.94 3.98 146 1.54 2.52
C-18 3.95 0.01 0.4 – 3.8
D-9 55.1 0.81 29.7 0.17 1.41
West canal 55.1 1.21 £ 1023 0.04 – 1.52
East canal 65 4.15 £ 1023 0.15 – 3.08
VTR is the vertical transport rate and HTR is the horizontal
transport rate. The normalized SF6 ratio is the peak SF6
concentration at a well divided by the injections slug’s SF6
concentration and then multiplied by 106 to put the numbers on a
more convenient scale.
K. Dillon et al. / Journal of Hydrology 284 (2003) 193–210 199

table due to tidal pumping, the large decrease in tracer
concentrations observed in the well field is likely the
result of a high degree of mechanical (transverse and
longitudinal) dispersion and possibly matrix diffusion
as the ATW is injected and rises towards the mud
layer.
The tracer was observed at both depths at well
cluster A, 15 m due south of the IW (Fig. 3c). After
18.8 days, the deep well (A18) reached a peak
concentration of 0.33 ^ 0.08 nM (normalized
ratio ¼ 12.1; HTR ¼ 0.80 m/d) while at the shallower
well (A-9) concentrations began to rise slowly after
about 2 weeks eventually rising to 0.51 nM (normal-
ized ratio ¼ 18.7) after 55.1 days (HTR ¼ 0.27 m/d,
VTR ¼ 0.17 m/d). Tracer was next observed in well
cluster D (,78 m east of IW) at a depth of 9.1 m after
approximately 3 weeks and continued to climb to
0.81 nM (normalized ratio ¼ 29.7) after 55.1 days
and remained at this concentration until day 65. This
concentration is only four times less than that
observed at well at C-9, which is 65 m closer to
the IW. After these peak tracer concentrations, SF6
concentrations at well D-9 fell to 0.08 nM (normali-
zed ratio ¼ 2.9) at day 83 and continued to fall to
6 pM (normalized ratio ¼ 0.2) at day 130.
Canals to the east and west were also sampled for
SF6 at three different locations along each canal. The
west canal is 84 m from the wastewater IW while the
east canal is 200 m away. Despite the large disparity
in their distances from the IW, both canals began to
show traces of SF6 after 35 days (Fig. 4). The west
canal reached a peak concentration of
1.24 ^ 0.01 pM (normalized ratio ¼ 0.04) after 55
days. The east canal, however reached a higher
maximum concentration of 4.2 ^ 1.1 pM (normalized
ratio ¼ 0.15) after 65 days. HTRs of 3.1 and 1.5 m/d
were calculated for the east and west canal, respect-
ively. The higher SF6 concentrations observed in
the east canal, the more rapid transport to the east, the
hydraulic gradient and the salinity data all indicate
Fig. 3. SF6 breakthrough curves for well clusters A, B, and C from
the June 1998 tracer experiment. Error bars represent the standard
deviation either between duplicate samples or duplicate measure-
ments on an individual sample.
Fig. 4. SF6 breakthrough curves for East and West canals for June
1998 tracer experiment. Error bars represent the standard deviation
either between duplicate samples or duplicate measurements on an
individual sample.
K. Dillon et al. / Journal of Hydrology 284 (2003) 193–210200

that the bulk of the wastewater plume was transported
to the east during June 1998.
3.2. Dual-tracer experiment: September 1999
In May 1999, five more wells were installed to
obtain better coverage of the plume for the dual-tracer
experiment. Monitoring well clusters H and I were
installed less than 5 m to the north and south of the IW
in order to evaluate vertical transport and the rapidity
of PO4 removal. Well clusters J and K were installed
along the eastern transect of well clusters at distances
of 38 and 160 m, respectively, away from the center
IW to better describe the eastern transport of the
wastewater plume. Well L was placed approximately
50 m north of the IW to determine whether any of the
plume was transported northward. Well B-9 was lost
after it became clogged with sediment during
Hurricane Georges and could not be cleared for this
experiment.
The average wastewater injection flow during the
first 19 days of the experiment was
1.65 ^ 0.59 £ 106 l/d. This average is a minimum
value representing 11 of the 19 days as access to the
treatment plant was not allowed on weekends and thus
measurements were not made when tourist numbers
are highest. The concentration of both NO3 and PO4
were much less than those measured during the June
1998 experiment (Table 3) due to technological
improvements made in the treatment plant.
Table 3
Salinity and nutrient concentrations for monitoring wells at Key Colony Beach
Sample Salinity (psu) [NH4] (mM) St. dev. [PO4] (mM) St. dev. [NO2] (mM) St. dev. [NO3] (mM) St. dev.
A-18 6 0.40 0.04 28.9 0.06 0.16 0.04 390 0.21
A-9 9 12.34 0.12 7.75 0.02 13.3 0.06 232 0.70
B-18 7 bd 32.2 0.02 0.28 0.00 413 0.33
C-18 21 bd 26.3 0.03 bd 384 0.13
C-9 5 bd 26.0 0.16 bd 380 1.15
D-14 37 10.1 0.05 1.45 0.04 bd bd
D-9 7 5.82 0.19 6.19 0.03 7.38 0.04 276 0.56
E-18 22 20.5 0.79 0.73 0.10 0.13 0.02 bd 0.02
E-9 10 27.4 5.79 1.23 0.13 7.63 0.05 69.2 0.15
East Canal 36 1.05 0.12 bd 0.27 0.02 3.97 0.07
F-14 35 12.2 0.45 3.18 0.02 bd bd
F-18 40 6.55 0.25 1.61 0.04 bd bd
F-8 13 124 1.96 0.92 0.01 0.12 0.01 0.55
G-18 39 13.1 0.12 2.80 0.11 bd bd
G-9 10 77.7 0.18 2.28 0.02 0.98 0.00 6.11 0.05
H-13 5 0.76 0.32 20.4 0.09 bd 377 0.57
H-60 5 bd 30.09 0.08 bd 370 0.52
H-9 5 bd 22.4 0.11 bd 340 0.06
I-14 4 bd 19.6 0.00 bd 352 0.56
I-18 4 bd 27.2 0.21 bd 366 0.60
I-9 3 9.25 14.16 26.0 0.06 bd 380 0.15
J-14 32 1.90 0.92 0.76 0.06 1.61 0.05 5.60 0.10
J-14 dup 32 0.94 0.07 0.83 0.12 1.46 0.03 5.40 0.19
J-18 37 4.10 0.01 0.52 0.01 bd bd 0.01
J-6 6 148 0.75 3.78 0.09 0.27 0.09 86.9 0.47
K-5 6 43.4 0.15 0.77 0.09 5.84 0.04 103 0.39
K-8 7 bd 7.84 0.03 13.3 0.01 491 0.87
K-8 dup 7 bd 7.96 0.00 13.4 0.04 493
ATW 4 bd 25.9 0.09 bd 383 0.22
ATW dup 4 bd 26.1 0.06 bd 380 0.15
Salinity measurements were made September 26, 1999. Nutrient samples were collected October 5, 1999. ‘bd’ indicates the parameter was
below the limit of detection (0.5, 0.5, 0.1 and 0.5 mM for NH4, PO4, NO2, and NO3, respectively).
K. Dillon et al. / Journal of Hydrology 284 (2003) 193–210 201

Hydraulic head measurements were made through-
out the dual-tracer experiment. Hydraulic heads at all
well clusters oscillated with the Atlantic tide. There
was no measurable time lag (.30 min) between well
fluctuations and the Atlantic tide, indicating a very
high hydraulic conductivity for the KLL at this
location. Since the hydraulic head fluctuations at all
monitoring wells were synchronized, there was very
little overall variation in the hydraulic gradient across
the study site during the time of the experiment.
Fig. 5 shows typical piezometric surfaces at two
different depths of the well field and illustrates the
driving force for groundwater movement at this site.
Arrows indicate groundwater flow directions. At
18.3 m, there was radial movement of wastewater
away from the ‘mound’ of water caused by continuous
injection of wastewater. Water levels could not be
measured in the IW due to the continuous injection of
ATW so the piezometric surface contours shown here
appear to be centered around well clusters A and B. At
9.1 m, the hydraulic gradient was sloped from the
west to the east. The hydraulic gradient was
determined to have an average value of
1.53 £ 1023 ^ 1.74 £ 1024 ðn ¼ 9Þ from September
28 to October 7, 1999. After buoying up to the mud
layer due to density differences with the saline
groundwater, the wastewater plume is advected
down gradient primarily in an easterly direction.
Nutrient and salinity measurements made from the
monitoring well clusters during September 1999
(Table 3) also illustrate the movement of the
wastewater plume beneath KCB. Low salinity water
(5–13 psu) was present at 8–9 m depth across the
entire well field. Map views of the plume’s phosphate
concentrations at 9.1 and 18.3 m depths of the well
field can be seen in Fig. 6. Phosphate concentrations
as high as injected wastewater (25.85 mM) were found
up to 15 m from the disposal well at various depths of
the well field. Concentrations at the 18.3 m wells drop
rapidly with increasing distance from the IW to
Fig. 5. Piezometric surface contours at (a) 18.3 m and (b) 9.1 m depths in the well field at Key Colony Beach, FL on September 27, 1999. The
location of the injection well is designated as ‘IW’. Arrows illustrate the direction of groundwater movement. Each tick mark on the axis
represents a distance of 15 m. Contour values in meters represent the water levels in the wells relative to mean sea level.
K. Dillon et al. / Journal of Hydrology 284 (2003) 193–210202

concentrations of 0.73, 0.52, and 1.61 mM at wells E-
18, J-18 and F-18, respectively. Well cluster G’s deep
well (G-18) showed a slightly higher concentration of
2.8 mM.
At a depth of approximately 9 m, the wastewater
plume extended at least as far as well cluster K, 160 m
away from the IW, where the salinities were 7 and
6 psu at K-8 and K-5, respectively. Phosphate levels
were higher at well K-8 (7.90 ^ 0.08 mM) than at
well D-9 (6.19 ^ 0.03 mM) even though well cluster
K is 82 m further from the IW than cluster D. Nitrate
concentrations at well K-8 (492.39 ^ 1.52 mM) were
much higher than that of the wastewater being
injected at the time of sampling (381.40 ^
1.99 mM). These data most likely indicate that
wastewater richer in nutrients was injected weeks or
months prior to our experiment. The phosphate
concentration in the east canal was below detection
while the NO3 concentration was 3.97 mM (Table 3).
On September 29, 1999 the 1040 l injection slug,
saturated with SF6 and containing approximately
500 mCi 32PO4, was injected into the centermost
disposal well at a rate of 87 l/min. During the tracer
injection, the centermost well was the only one
observed receiving ATW. The SF6 concentration of
the slug was 23.81 ^ 1.58 M and the 32P activity was
9.34 £ 108 dpm/l. For convenience, both SF6 and32PO4 data have been normalized to the injections
slug’s SF6 concentration and 32P activity, respect-
ively, and then multiplied by 106 to put the numbers
on a more convenient scale. Treating the data in this
fashion allows differences in the tracers’ subsurface
behaviors to be easily seen. If both tracers acted
conservatively, their normalized breakthrough curves
would be identical. If the 32PO4 curve lies beneath that
of the SF6 then PO4 removal by adsorption reactions
can be inferred.
Canals were not sampled for 32PO4 during the
dual-tracer experiment due to the short half-life of 32P,
high dispersion rates, phosphate adsorption (as
observed by Corbett et al., 1999) and dilution of the
tracer within the canals. It was reasoned that the
radioactive tracer would be undetectable by the time it
reached the canals due to these mechanisms and both
field and laboratory time would be better invested
concentrating sampling efforts on the well field rather
than the canals.
A summary of peak tracer ratios and the corre-
sponding times as well as the calculated transport
rates (both horizontal and vertical) from the dual-
tracer experiment are summarized in Table 4. Both
tracers were seen rapidly at well clusters H (3.7 m
south of the IW) and I (2.5 m north of IW). These
clusters each have three wells with depths of 9.1, 13.7,
and 18.3 m. Peak tracer concentrations were
measured within 48 and 74 min (for H and I,
respectively) of injection at the deepest wells at
these two clusters. The breakthrough curves for both
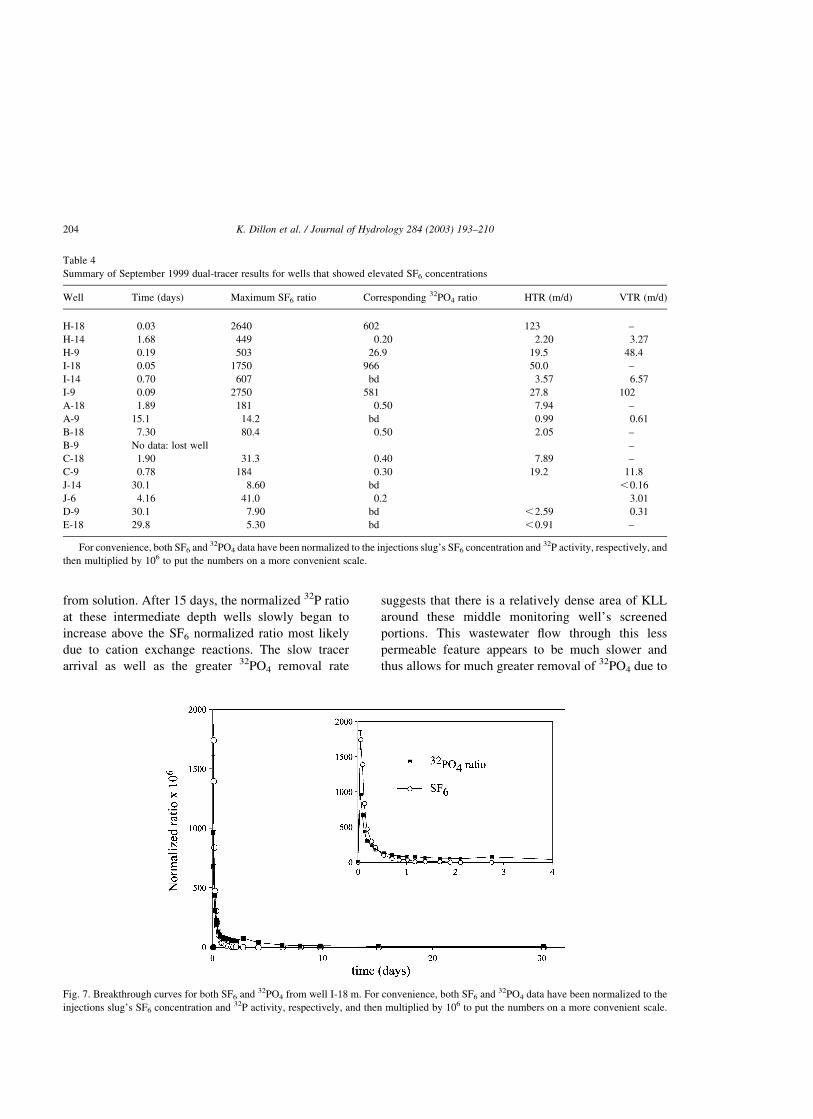
tracer ratios at well I-18 are shown in Fig. 7.
Approximately 45% of the 32PO4 was immediately
removed from solution as can be seen by the disparity
between the peaks of the two tracers’ normalized
breakthrough curves. After about 0.5 days, the
normalized 32P ratio this well slowly began to
increase above the SF6 normalized ratio most likely
due to cation exchange reactions. The deep well at
cluster H indicated even more removal with 77% of
the 32PO4 being stripped from solution (Table 4).
Tracer concentrations in the shallowest wells (9.1 m)
of clusters I and H peaked after 2.2 and 4.5 h and
indicated removal of 79 and 95% of the PO4,
respectively.
The mid-depth (13.7 m) wells at clusters H and I
showed a different pattern as can be seen in Fig. 8a
and Table 4. At these intermediate depth wells, the
peak SF6 concentrations took much longer to arrive
(Table 4) than the 9.1 m wells. Corresponding 32PO4
activities were near or below background levels,
indicating total removal of the radiolabelled tracer
Fig. 6. Phosphate concentration (mM) contours at (a) 18.3 m and (b)
9.1 m depths of the well field at Key Colony Beach, FL during the
September 1999 dual-tracer experiment.
K. Dillon et al. / Journal of Hydrology 284 (2003) 193–210 203
from solution. After 15 days, the normalized 32P ratio
at these intermediate depth wells slowly began to
increase above the SF6 normalized ratio most likely
due to cation exchange reactions. The slow tracer
arrival as well as the greater 32PO4 removal rate
suggests that there is a relatively dense area of KLL
around these middle monitoring well’s screened
portions. This wastewater flow through this less
permeable feature appears to be much slower and
thus allows for much greater removal of 32PO4 due to
Table 4
Summary of September 1999 dual-tracer results for wells that showed elevated SF6 concentrations
Well Time (days) Maximum SF6 ratio Corresponding 32PO4 ratio HTR (m/d) VTR (m/d)
H-18 0.03 2640 602 123 –
H-14 1.68 449 0.20 2.20 3.27
H-9 0.19 503 26.9 19.5 48.4
I-18 0.05 1750 966 50.0 –
I-14 0.70 607 bd 3.57 6.57
I-9 0.09 2750 581 27.8 102
A-18 1.89 181 0.50 7.94 –
A-9 15.1 14.2 bd 0.99 0.61
B-18 7.30 80.4 0.50 2.05 –
B-9 No data: lost well –
C-18 1.90 31.3 0.40 7.89 –
C-9 0.78 184 0.30 19.2 11.8
J-14 30.1 8.60 bd ,0.16
J-6 4.16 41.0 0.2 3.01
D-9 30.1 7.90 bd ,2.59 0.31
E-18 29.8 5.30 bd ,0.91 –
For convenience, both SF6 and 32PO4 data have been normalized to the injections slug’s SF6 concentration and 32P activity, respectively, and
then multiplied by 106 to put the numbers on a more convenient scale.
Fig. 7. Breakthrough curves for both SF6 and 32PO4 from well I-18 m. For convenience, both SF6 and 32PO4 data have been normalized to the
injections slug’s SF6 concentration and 32P activity, respectively, and then multiplied by 106 to put the numbers on a more convenient scale.
K. Dillon et al. / Journal of Hydrology 284 (2003) 193–210204

greater surface area of KLL with which the waste-
water comes into contact. The rapid appearance of
both tracers at the shallow wells at clusters H and I
does suggest that this feature is not very large, as there
seems to be flow around or through it via less
permeable limestone, conduits and/or diagenic
features.
After 1.9 days, maximum SF6 ratios of 180.6 and
31.3 were calculated for wells A-18 and C-18,
respectively (Table 4). SF6 ratios dropped exponen-
tially to a value of 0.4 at day 30 at well A-18 (Fig. 8b).
At well C-18, radiotracer activity was near or below
background levels for the entire experiment, indicat-
ing the radiolabelled phosphate was stripped to levels
below detection in the 1.9 days it took the SF6 to reach
this well. Well C-9 showed maximum concentrations
of both tracers at 3.1 d with initial 32PO4 ratios being
approximately 10% of the SF6 ratios, indicating 90%
initial adsorption (Table 4). Well J-6 was the next well
to show a peak in SF6 concentrations, reaching a
maximum SF6 ratio of 41 after 4.2 d (Table 4). The
very small 32P activity that was measured at this well
indicated a 32PO4 uptake of 99.5%. 32P activities at
this well then fell below detection and remained so for
the duration of the experiment. A small SF6 peak was
observed at well A-9 after 15 days although no 32P
was detected (Table 4). Low concentrations of SF6
were beginning to appear in wells D-9, E-18 and J-14
when the last samples were collected at 30 days. No
detectable 32P was observed in either of these wells
(Table 4). No other wells showed detectable levels of
either tracer during the experiment.
4. Discussion
Bimodal flow was observed in both experiments
conducted in this study as was reported by Dillon et al.
(2000) at a low volume disposal well. Typical
groundwater transport rates at KCB ranged from
0.27 to 19.23 m/d in wells located at least 15 m from
the IW. Rates as high as 123 m/d were measured at
well clusters H and I. Both of these clusters are within
4 m of the IW and are highly affected by the
continuous injection of wastewater. Remaining trans-
port rates in this study were similar to values reported
for a low discharge facility, which ranged from less
than 0.24 to 52.8 m/d. The size of the wastewater
plume at KCB however, is much greater than the
plume at the lower volume facility.
Using data from the June 1998 tracer experiment,
one can estimate a volume for the ATW plume
underneath KCB with a simple residence time
calculation:
Plume size ðlÞ ¼Residence time ðdaysÞ
£ inflow rate ðl=dayÞ:
Peak tracer concentrations were observed in the
canals after approximately 60 days so this value was
used for the residence time of tracer in the plume. The
average ATW injection rate over this period was
6.31 £ 105 l/d. Using these values, a plume volume
of 3.79 £ 107 l can be estimated. Accounting for
Fig. 8. SF6 and 32PO4 breakthrough curves from September dual-
tracer experiment for (a) well H-14 and (b) well A-18. For
convenience, both SF6 and 32PO4 data have been normalized to the
injections slug’s SF6 concentration and 32P activity, respectively,
and then multiplied by 106 to put the numbers on a more convenient
scale.
K. Dillon et al. / Journal of Hydrology 284 (2003) 193–210 205

a porosity of 50%, this plume would take up a volume
of approximately 1.26 £ 105 m3 in the aquifer
(limestone þ groundwater).
Transport rates were more rapid at KCB in
September 1999 than those in June 1998 most likely
due to the greater daily wastewater injection rate in
September 1999 (1.65 £ 106 l/d) than in June 1998
(0.63 £ 106 l/d). A greater difference between the
water levels of Florida Bay and the Atlantic Ocean
may have also contributed to the increased transport
rates but this cannot be quantified with the data
collected in this study. Increased rainfall may have
contributed to this difference as well. In the month
preceding the June 1998 experiment a monthly total
rainfall of 0.36 in. was measured at a nearby weather
station in Tavernier, FL (58 km northeastward). In the
month before the 1999 experiment the total rainfall at
the same station was 10.46 in. (NOAA, National
Climatic Data Center web page). Although the
impermeable mud layer acts to prevent recharge on
KCB, there is a storm water IW north of the sewage
treatment plant that receives stormwater from a
shallow holding pond during times of heavy rainfall.
No records are kept of the volume of stormwater
injected into the subsurface via this well but it may
have also contributed to the elevated gradient in
September 1999. The nutrient concentration of this
storm water has not been characterized and may
represent an additional source of nutrients to the
subsurface.
Conventional measurements of hydraulic conduc-
tivity, such as pump or slug tests, cannot be conducted
in KLL as the water level in wells respond to changes
in water level too rapidly to be measured. Transport
rates for the dual-tracer experiment can be used along
with the hydraulic gradient at this time to estimate the
KLL’s hydraulic conductivity using Darcy’s law
v ¼ ð2K=nÞdh=dl
where v is the groundwater velocity, K is the hydraulic
conductivity, n is the porosity, and dh=dl is the
hydraulic gradient. The hydraulic gradient measured
during the dual-tracer experiment was
1.53 £ 1023 ^ 1.74 £ 1024 (measured nine times
from September 28 to October 7, 1999). If one
assumes an eastern flow rate of 2.5 m/d (from well D-
9, Table 4) and a porosity value of 50%, then a value
for K of 817 m/d can be calculated. This is below
other estimates (1400–3.84 £ 104 m/d) from previous
groundwater studies in the Keys (Vacher et al., 1992;
Halley et al., 1995; Dillon et al., 1999).
SF6 tracer results from both experiments showed
that the wastewater plume rises quickly after injection
and is then advected eastward by the regional
groundwater flow at this depth. A comparison of
salinity data from both June 1998 and September 1999
shows that the ATW plume contracts and expands due
to highly variable injection rates. The deep wells close
to the point of injection, A-18, B-18, C-18, and E-18
all had lower salinities during September 1999
compared to June 1998 (Tables 1 and 3), indicating
that the plume penetrated deeper into the KLL during
September 1999 when the ATW injection rate was
much higher. This increased injection rate is due to an
increased population in KCB during the cooler
months. Elliott (1999) noted contraction of the
plume from March to June 1998 as the population
and ATW injection rate both decreased drastically.
A comparison of nutrient data collected from well
cluster D (Tables 1 and 3) shows that the wastewater
plume’s phosphate concentrations appear to be
increasing with time despite the fact that ATW PO4
concentrations has decreased significantly due to
changes in the treatment process within the package
plant. Although PO4 concentrations 15 m from the IW
(wells A-18 and B-18) decreased to reflect this
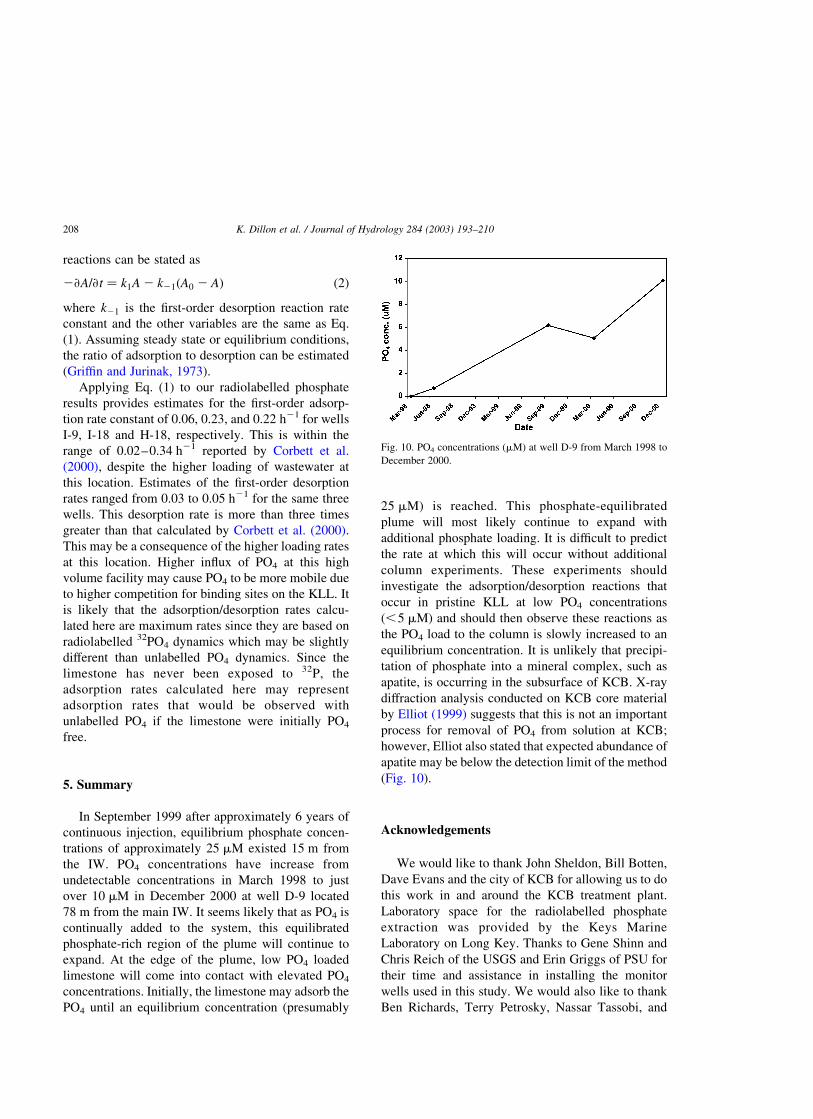
difference, the PO4 concentrations at well D-9 have
increased from below detection in March 1998
(Elliott, 1999) to 10.1 mM in December 2000 (Dillon,
unpublished data; Fig. 10).
Decreases in SF6 peak concentrations in the well
field ranged from 3 to 6 orders of magnitude during
both experiments compared with the initial injection
slug. The lower tracer concentration within the well
field represent dispersion of the injection slug
primarily within the wastewater plume although
some mixing with ambient saline groundwater is
likely due to tidal pumping of the water table. Low
salinity waters of the plume extend beneath the entire
study area. Salinities below 10 psu were measured as
far east from the IW as 175 m (wells K-6 and K-8) and
as far south as 67 m (well G-9). Estimates based on
salinity and stable oxygen isotopes (Elliott, 1999)
determined that wastewater comprised 85–100% of
the water collected at 9.1 m depth at clusters A, B, C,
D, E, F, and G. The low salinities observed 175 m
K. Dillon et al. / Journal of Hydrology 284 (2003) 193–210206

from the IW at cluster K (Table 3) indicate that water
from this well is 91–94% wastewater. The SF6
maxima detected in the canals in June 1998 were
approximately 7 orders of magnitude less than the
injected concentration due to dispersive mixing within
the well field and dilution with water in the canals.
By making some general assumptions about the
plume’s size and transport rate it is possible to
estimate the PO4 loading to the east canal. For this
calculation, we have assumed that the plume’s shape
is a half-ellipse in cross-section with the wider portion
contacting the mud layer. If one assumes that the
plume is 140 m wide (as shown in Fig. 6) and 7.5 m
tall (best estimate) by the time it reaches the east
canal, has a PO4 concentration of 4.5 mM (average
concentration from well K-5 and K-8, Table 3) and it
is advected 1.5 m/d (conservative estimate from Table
2) then one can estimate that 2.78 moles of PO4 (3.6%
of the daily injected PO4) is delivered to the east canal
every day. This is equivalent to dumping 1.5 lbs of
sodium phosphate salt into the canal each day.
Results from the dual-tracer experiment showed
rapid initial 32PO4 uptake followed by a slower rate of
uptake. Other studies have also observed rapid
phosphate removal followed by a much slower rate
of uptake which declined over time by KLL (Corbett
et al., 2000; Elliott, 1999), calcite and aragonite
(DeKanel and Morse, 1978); and carbonate sediments
(McGlathery et al., 1994; Carignan and Vaithiya-
nathan, 1999; Gomez et al., 1999). Corbett et al.
(1999) hypothesized that adsorption/desorption reac-
tions may explain this gradual decrease in the PO4
removal rate.
Elliott (1999) conducted column experiments with
cores collected in KLL and showed that after
additions of phosphate-enriched solutions (fresh
water and saline), PO4 was rapidly stripped from
solution. A leveling off of adsorption rates then
followed until equilibrium concentrations of approxi-
mately 25 mM (0.8 mg P/l) were reached (Fig. 9). In
one case, Elliott added seawater with low phosphate
levels (,0.1 mM) to the phosphate-loaded KLL
column and observed an increase in PO4 concen-
tration as the solution was recirculated over the
limestone until a concentration of approximately
25 mM was reached. Interestingly, the PO4 concen-
tration of ATW being injected into the subsurface in
September 1999 was 25.85 mM.
The data presented here in conjunction with
Elliott’s column experiments indicate that the KLL
underlying KCB seems to be acting as a phosphate
buffer. Phosphate in such a system may be subject to
adsorption, desorption, precipitation, and dissolution
reactions (Froelich, 1988) and can be influenced by
pH, dissolved phosphate concentrations, competing
anions, and the composition of solid phase phosphate
(Carignan and Vaithiyanathan, 1999). Similar buffer-
ing capacities have been documented in carbonate
sediments (McGlathery et al., 1994; Carignan and
Vaithiyanathan, 1999; Gomez et al., 1999). In the case
of KCB, it appears that PO4 molecules are quickly
adsorbed onto the KLL after injection into the
subsurface.
First-order rate constants for adsorption and
desorption can be calculated as described by Corbett
et al. (2000) using a well-known rate expression (Frost
and Pearson, 1961)
ln A ¼ ln A0 2 k1t ð1Þ
where A is the normalized activity of 32PO4 at time t;
A0 is the initial normalized activity at the start of the
experiment, and t is the elapsed time. A desorption
rate may also be estimated assuming adsorption no
longer dominates the system after the initial rapid
removal of phosphate. A variation of Moore’s (1972)
first-order rate expression for opposing surface
Fig. 9. Results from Elliott’s (1999) column experiment. Curves
show PO4 concentrations (ppm) over time as phosphate-rich or
phosphate-depleted seawater or distilled water is recirculated
through the core. Type of water used is shown at the top of the
figure. Vertical lines show when different treatments were started.
The column was drained between treatments. The horizontal lines
show approximate PO4 equilibrium concentration (0.8 ppm or
26 mM).
K. Dillon et al. / Journal of Hydrology 284 (2003) 193–210 207
reactions can be stated as
2›A=›t ¼ k1A 2 k21ðA0 2 AÞ ð2Þ
where k21 is the first-order desorption reaction rate
constant and the other variables are the same as Eq.
(1). Assuming steady state or equilibrium conditions,
the ratio of adsorption to desorption can be estimated
(Griffin and Jurinak, 1973).
Applying Eq. (1) to our radiolabelled phosphate
results provides estimates for the first-order adsorp-
tion rate constant of 0.06, 0.23, and 0.22 h21 for wells
I-9, I-18 and H-18, respectively. This is within the
range of 0.02–0.34 h21 reported by Corbett et al.
(2000), despite the higher loading of wastewater at
this location. Estimates of the first-order desorption
rates ranged from 0.03 to 0.05 h21 for the same three
wells. This desorption rate is more than three times
greater than that calculated by Corbett et al. (2000).
This may be a consequence of the higher loading rates
at this location. Higher influx of PO4 at this high
volume facility may cause PO4 to be more mobile due
to higher competition for binding sites on the KLL. It
is likely that the adsorption/desorption rates calcu-
lated here are maximum rates since they are based on
radiolabelled 32PO4 dynamics which may be slightly
different than unlabelled PO4 dynamics. Since the
limestone has never been exposed to 32P, the
adsorption rates calculated here may represent
adsorption rates that would be observed with
unlabelled PO4 if the limestone were initially PO4
free.
5. Summary
In September 1999 after approximately 6 years of
continuous injection, equilibrium phosphate concen-
trations of approximately 25 mM existed 15 m from
the IW. PO4 concentrations have increase from
undetectable concentrations in March 1998 to just
over 10 mM in December 2000 at well D-9 located
78 m from the main IW. It seems likely that as PO4 is
continually added to the system, this equilibrated
phosphate-rich region of the plume will continue to
expand. At the edge of the plume, low PO4 loaded
limestone will come into contact with elevated PO4
concentrations. Initially, the limestone may adsorb the
PO4 until an equilibrium concentration (presumably
25 mM) is reached. This phosphate-equilibrated
plume will most likely continue to expand with
additional phosphate loading. It is difficult to predict
the rate at which this will occur without additional
column experiments. These experiments should
investigate the adsorption/desorption reactions that
occur in pristine KLL at low PO4 concentrations
(,5 mM) and should then observe these reactions as
the PO4 load to the column is slowly increased to an
equilibrium concentration. It is unlikely that precipi-
tation of phosphate into a mineral complex, such as
apatite, is occurring in the subsurface of KCB. X-ray
diffraction analysis conducted on KCB core material
by Elliot (1999) suggests that this is not an important
process for removal of PO4 from solution at KCB;
however, Elliot also stated that expected abundance of
apatite may be below the detection limit of the method
(Fig. 10).
Acknowledgements
We would like to thank John Sheldon, Bill Botten,
Dave Evans and the city of KCB for allowing us to do
this work in and around the KCB treatment plant.
Laboratory space for the radiolabelled phosphate
extraction was provided by the Keys Marine
Laboratory on Long Key. Thanks to Gene Shinn and
Chris Reich of the USGS and Erin Griggs of PSU for
their time and assistance in installing the monitor
wells used in this study. We would also like to thank
Ben Richards, Terry Petrosky, Nassar Tassobi, and
Fig. 10. PO4 concentrations (mM) at well D-9 from March 1998 to
December 2000.
K. Dillon et al. / Journal of Hydrology 284 (2003) 193–210208

Eddie Toy for assisting with sample collection and lab
work. This manuscript was improved by comments
made by Phlip Froelich and one anonymous reviewer.
Funding for this project was provided by the US
Environmental Protection Agency under contract
X984328-97-0 to Florida State University and
contract X98429297-0-PA to Pennsylvania State
University.
References
Bower, C.F., Holm-Hansen, T., 1980. A salicylate-hypoclorite
method for determining ammonia in seawater. Canadian Journal
of Aquatic Science 37, 794–798.
Braman, R.S., Hendrix, S.A., 1989. Nanogram nitrite and nitrate
determination in environmental and biological materials by
vanadium (III) reduction with chemiluminescence detection.
Analytical Chemistry 61, 2715–2718.
Carignan, R., Vaithiyanathan, P., 1999. Phosphorus availability in
the Parana floodplain lakes (Argentina): influence of pH and
phosphate buffering by fluvial sediments. Limnology and
Oceanography 44, 1540–1548.
Cole, C.V., Olsen, S.R., Scott, C.O., 1953. The nature of phosphate
adsorption by calcium carbonate. Soil Science Society Amer-
ican Proceedings 17, 352–356.
Corbett, D.R., Kump, L.R., Dillon, K.S., Burnett, W.C.,
Chanton, J.P., 2000. Fate of wastewater-borne nutrients in
the subsurface of the Florida Keys, USA. Marine Chemistry
69, 99–115.
Custodio, E., 1987. Salt-fresh water interrelationships under natural
conditions. In: Custodio, E., Bruggeman, G.A. (Eds.), Ground-
water Problems in Coastal Areas, UNESCO Studies and Reports
in Hydrology 45, pp. 14–96.
De Kanel, J., Morse, J.W., 1978. The chemistry of orthophosphate
uptake from seawater on to calcite and aragonite. Geochemica
Cosmochemica Acta., 42, 1335–1340.
Dillon, K.S., Corbett, D.R., Chanton, J.P., Burnett, W.C., Furbish,
D.J., 1999. The use of sulfur hexafluoride (SF6) as a tracer of
septic tank effluent in the Florida Keys. Journal of Hydrology
220, 129–140.
Dillon, K.S., Corbett, D.R., Chanton, J.P., Burnett, W.C., Kump,
L.R., 2000. Bimodal transport of a wastewater plume injected
into saline groundwaters of the Florida Keys. Groundwater 38,
624–634.
Dodd, J.R., Siemers, C.T., 1971. Effect of Late Pleistocene karst
topography on Holocene sedimentation and biota, Lower
Florida Keys. Geological Society of America Bulletin 82,
211–218.
Elliott, K., 1999. The fate of wastewater phosphate in saline
carbonate groundwater, Key Colony Beach, Florida. MS Thesis,
The Pennsylvania State University.
Fourqurean, J.W., Robblee, M.B., 1999. Florida Bay: a history of
recent ecological changes. Estuaries 22, 345–357.
Fourqurean, J.W., Zieman, J.C., Powell, G.V.N., 1992a. Relation-
ships between porewater and seagrasses in a subtropical
carbonate environment. Marine Biology 114, 57–65.
Fourqurean, J.W., Zieman, J.C., Powell, G.V.N., 1992b. Phosphorus
limitation of primary production in Florida Bay-Evidence from
C–N–P ratios of the dominant seagrass Thalassia-testudium.
Limnology and Oceanography 37, 162–171.
Fourqurean, J.W., Jones, R.D., Zieman, J.C., 1993. Processes
influencing water column characteristics and phosphorus
limitation of phytoplankton biomass in Florida Bay, FL, USA:
inferences from spatial distributions. Estuarine, Coastal and
Shelf Science 36, 295–314.
Froelich, P.N., 1988. Kinetic controls of dissolved phosphate in
natural rivers and estuaries: a primer on the phosphate buffer
mechanism. Limnology and Oceanography 33, 649–668.
Frost, A.A., Pearson, R.G., 1961. Kinetics and Mechanism, second
ed., Wiley, New York, 403 pp.
Gomez, E., Durillon, C., Rofes, G., Picot, B., 1999. Phosphate
adsorption and release from sediments of brackish lagoons, pH,
O2, and loading influence. Water Resources 33, 2437–2447.
Griffin, R.A., Jurinak, J.J., 1973. The interaction of phosphate with
calcite. Soil Science Society American Proceedings 37,
846–850.
Halley, R.B., Vacher, H.L., Shinn, E.A., 1995. Geology and
hydrogeology of the Florida Keys. US Geological Survey and
Department of Geology, University of South Florida.
Harrison, R.S., Coniglio, M., 1985. Origin of Key Largo Limestone,
Florida Keys. Bulletin of Canadian Petroleum Geology 33,
350–358.
Kim, G., Burnett, W.C., Dillon, K.S., 2001. A pre-concentration
technique for determination of 32P in natural waters. Journal of
Radioanalytical and Nuclear Chemistry 249, 381–384.
Kuo, S., Lotse, E.G., 1972. Kinetics of phosphate adsorption by
calcium carbonate and Ca-kaolinite. Soil Science Society
American Proceedings 36, 725–729.
Lapointe, B.E., 1989. Macroalgal production and nutrient relations
in oligotrophic areas of Florida Bay. Bulletin of Marine Science
44, 312–323.
Lapointe, B.E., Clark, M.W., 1992. Nutrient inputs from the
watershed and coastal eutrophication in the Florida Keys.
Estuaries 15, 465–476.
Lapointe, B.E., O’Connell, J.D., Garrett, G.S., 1990. Nutrient
coupling between on-site sewage disposal systems, ground-
waters, and nearshore surface waters of the Florida Keys.
Biogeochemistry 10, 289–307.
McGlathery, K.J., Marino, R., Howarth, R.W., 1994. Variable rates
of phosphate uptake by shallow marine carbonate sediments:
mechanical and ecological significance. Biogeochemistry 25,
127–146.
Monaghan, L.B., 1996. The hydrogeochemical behavior of waste
water-derives nutrient elements in the ground waters of Long
Key, Florida. MS Thesis, The Pennsylvania State University.
Moore, W.J., 1972. Physical Chemistry, fourth ed., Prentice Hall,
Englewood Cliffs, NJ, 977 pp.
Paul, J.H., Rose, J.B., Jiang, S.C., Zhou, X., Cochran, P., Kellogg,
C., Kang, J.B., Griffin, D., Farrah, S., Lukasik, J., 1997.
Evidence for groundwater and surface water contamination by
K. Dillon et al. / Journal of Hydrology 284 (2003) 193–210 209

waste disposal wells in the Florida Keys. Water Research 31,
1448–1454.
Phlips, E.J., Badylak, S., 1996. Spatial variability in phyto-
plankton standing crop and composition in a shallow inner-
shelf lagoon, Florida Bay, USA. Bulletin of Marine Science
58, 203–216.
Phlips, E.J., Lynch, T.C., Badylak, S., 1995. Chlorophyll a, tripton,
color, and light availability in a shallow tropical inner-shelf
lagoon, Florida Bay, USA. Marine Ecology Progress Series 127,
233–234.
Phlips, E.J., Badylak, S., Lunch, T.C., 1999. Blooms of picoplank-
tonic cyanobacterium Synechococcus in Florida Bay, a
subtropical inner-shelf lagoon. Limnology and Oceanography
44, 1166–1175.
Powell, G.V.N., Kenworthy, J., Fourqurean, J.W., 1989. Exper-
imental evidence for nutrient limitation of seagrass growth in a
tropical estuary with restricted circulation. Bulletin of Marine
Science 44, 324–340.
Shinn, E.A., Reese, R.S., Reich, C.D., 1994. Fate and pathways of
injection-well effluent in the Florida Keys. US Geological
Survey Open-file Report 94-276, St Petersburg, FL.
Strickland, J.D.H., Parsons, T.R., 1972. A practical handbook
of seawater analysis. Fisheries Research Board of Canada,
167 pp.
Vacher, L.H., Wrightman, M.J., Stewart, M.T., 1992. Hydrology of
meteoric diagenesis, effect of Pleistocene stratigraphy on
freshwater lenses of Big Pine Key, Florida. In: Fletcher, C.W.
III, Wehmiller, J.F. (Eds.), Quaternary Coasts of the United
States, Marine and Lacustrine Systems, SEMP Special Publi-
cation No. 48, pp. 213–219.
Wanninkhof, R., Ledwell, J.R., Watson, A.J., 1991. Analysis of
sulfur hexafluoride in seawater. Journal of Geophysical
Research 104, 8733–8740.
Wilson, R.D., Mackey, D.M., 1993. The use of sulfur hexafluoride
as a conservative tracer in saturated sandy media. Groundwater
31, 719–724.
K. Dillon et al. / Journal of Hydrology 284 (2003) 193–210210