Ground-Water Quality in the - USGS · Ground-Water Quality in the Upper Santa Cruz Basin, Arizona,...
66
Transcript of Ground-Water Quality in the - USGS · Ground-Water Quality in the Upper Santa Cruz Basin, Arizona,...


U.S. DEPARTMENT OF THE INTERIORU.S. GEOLOGICAL SURVEY
Ground-Water Quality in the Upper Santa Cruz Basin, Arizona, 1998
NATIONAL WATER-QUALITY ASSESSMENT PROGRAM
By Alissa Coes, D.J. Gellenbeck, Douglas C. Towne, and Maureen C. Freark
Tucson, ArizonaFebruary 2002
Water-Resources Investigations Report 00—4117
For additional information write to:
District ChiefU.S. Geological SurveyWater Resources Division520 N. Park Aveune, Suite 221Tucson, AZ 85719–5035
Copies of this report can be purchased from:
U.S. Geological SurveyInformation ServicesBox 25286Federal CenterDenver, CO 80225–0046
The use of firm, trade, and brand names in this report is for identification purposes only and does not constitute endorsement by the U.S. Geological Survey.
Information regarding research and data-collection programs of the U.S. Geological Survey is available on the Internet via the World Wide Web. You may connect to the home page for the Arizona District Office using the URL http://az.water.usgs.gov.
U.S. DEPARTMENT OF THE INTERIORBRUCE BABBITT, Secretary
U.S. GEOLOGICAL SURVEYCharles G. Groat, Director

FOREWORD
The mission of the U.S. Geological Survey (USGS) is to assess the quantity and quality of the earth resources of the Nation and to provide information that will assist resource managers and policymakers at Federal, State, and local levels in making sound decisions. Assessment of water-quality conditions and trends is an important part of this overall mission.
One of the greatest challenges faced by water-resources scientists is acquiring reliable information that will guide the use and protection of the Nation’s water resources. That challenge is being addressed by Federal, State, interstate, and local water-resources agencies and by many academic institutions. These organizations are collecting water-quality data for a host of purposes that include: compliance with permits and water-supply standards; development of remediation plans for a specific contamination problem; operational decisions on industrial, wastewater, or water-supply facilities; and research on factors that affect water quality. An additional need for water-quality information is to provide a basis on which regional and national-level policy decisions can be based. Wise decisions must be based on sound information. As a society we need to know whether certain types of water-quality problems are isolated or ubiquitous, whether there are significant differences in conditions among regions, whether the conditions are changing over time, and why these conditions change from place to place and over time. The information can be used to help determine the efficacy of existing water-quality policies and to help analysts determine the need for and likely consequences of new policies.
To address these needs, the Congress appropriated funds in 1986 for the USGS to begin a pilot program in seven project areas to develop and refine the National Water-Quality Assessment (NAWQA) program. In 1991, the USGS began full implementation of the program. The NAWQA program builds upon an existing base of water-quality studies of the USGS, as well as those of other Federal, State, and local agencies. The objectives of the NAWQA program are to:
• Describe current water-quality conditions for a large part of the Nation’s freshwater streams, rivers, and aquifers.
• Describe how water quality is changing over time.
• Improve understanding of the primary natural and human factors that affect water-quality conditions.
This information will help support the development and evaluation of management, regulatory, and monitoring decisions by other Federal, State, and local agencies to protect, use, and enhance water resources.
The goals of the NAWQA program are being achieved through ongoing and proposed investigations of 60 of the Nation’s most important river basins and aquifer systems, which are referred to as study units. These study units are distributed throughout the Nation and cover a diversity of hydrogeologic settings. More than two-thirds of the people served by public water-supply systems live within their boundaries.
National synthesis of data analysis, based on aggregation of comparable information obtained from the study units, is a major component of the program. This effort focuses on selected water-quality topics using nationally consistent information. Comparative studies will explain differences and similarities in observed water-quality conditions among study areas and will identify changes and trends and their causes. The first topics addressed by the national synthesis are pesticides, nutrients, volatile organic compounds, and aquatic biology. Discussions on these and other water-quality topics will be published in periodic summaries of the quality of the Nation’s ground and surface water as the information becomes available.
This report is an element of the comprehensive body of information developed as part of the NAWQA program. The program depends heavily on the advice, cooperation, and information from many Federal, State, interstate, Tribal, and local agencies and the public. The assistance and suggestions of all are greatly appreciated.
Robert M. HirschAssociate Director for Water

Contents v
CONTENTSPage
Abstract .............................................................................................................................................................. 1Introduction .......................................................................................................................................................... 2
Purpose and scope ....................................................................................................................................... 2Acknowledgments....................................................................................................................................... 4Physical setting............................................................................................................................................ 4Land use and population ............................................................................................................................. 4Geohydrologic setting ................................................................................................................................. 6
Geology.............................................................................................................................................. 7Hydrology .......................................................................................................................................... 10
Methods of investigation ..................................................................................................................................... 11Statistical methods ...................................................................................................................................... 12Selection of sample locations...................................................................................................................... 13Field methods .............................................................................................................................................. 13
U.S. Geological Survey...................................................................................................................... 14Arizona Department of Environmental Quality................................................................................. 14
Laboratory methods .................................................................................................................................... 15Ground-water quality ........................................................................................................................................... 15
Natural controls on ground-water quality ................................................................................................... 15Depth.................................................................................................................................................. 19Geology.............................................................................................................................................. 19
Effects of human activities on ground-water quality .................................................................................. 22Land use ............................................................................................................................................. 24Historical conditions .......................................................................................................................... 27
Summary and conclusions.................................................................................................................................... 31References cited ................................................................................................................................................... 32Basic Data ............................................................................................................................................................ 35Quality-assurance plans and quality-control data ................................................................................................ 51
U.S. Geological Survey............................................................................................................................... 52Arizona Department of Environmental Quality.......................................................................................... 54Combined quality-control data.................................................................................................................... 54
Comparison of laboratory-analytical procedures............................................................................... 55Comparison of sample-collection procedures.................................................................................... 55

vi Contents
FIGURES
Page
1. Map showing location of study area and the Upper Santa Cruz Basin, Arizona ................................. 32. Map showing generalized land use (1990) and locations of sampled wells in the
Upper Santa Cruz Basin, Arizona ........................................................................................................ 53–7. Photographs showing:
3. Example of rangeland, Oro Valley, Upper Santa Cruz Basin, Arizona.......................................... 64. Open-pit copper mine near Green Valley, Upper Santa Cruz Basin, Arizona................................ 75. Effluent release to the Santa Cruz River from the Roger Road wastewater-treatment
plant, near Tucson, Arizona............................................................................................................ 76. Uncontrolled sewage flow in Nogales Wash near Nogales, Arizona ............................................. 77. View of downtown Tucson, Arizona, looking northeastward from the Tucson Mountains ........... 8
8. Map showing generalized surficial geology, major faults, and locations of sampled wells, Upper Santa Cruz Basin, Arizona .............................................................................................. 9
9. Photograph showing dedicated water-quality sampling vehicle used by the U.S. Geological Survey ........................................................................................................................ 14
10. Trilinear diagram showing relative composition of ground-water samples, Upper Santa Cruz Basin, Arizona, 1998 ......................................................................................................... 18
11. Graph showing temperature and pH as functions of well depth, Upper Santa Cruz Basin, Arizona, 1998 ....................................................................................................................................... 20
12. Boxplots showing concentrations of dissolved solids, alkalinity, calcium, potassium, chloride, and sulfate in wells relative to location of major faults, Upper Santa Cruz Basin, Arizona, 1998 ............................................................................................................................ 21
13–14. Graphs showing:13. Concentrations of sulfate and calcium in wells as a function of concentrations of
dissolved solids, Upper Santa Cruz Basin, Arizona, 1998 ............................................................. 2314. Tritium in precipitation, decayed to 1998, Upper Santa Cruz Basin, Arizona............................... 24
15. Boxplots showing concentrations of nitrite plus nitrate, calcium, potassium, alkalinity, and dissolved solids in wells relative to recharge type, Upper Santa Cruz Basin, Arizona, 1998 ....................................................................................................................................... 26
16. Maps showing locations of wells used for historical-data analysis, Upper Santa Cruz Basin, Arizona. A. Urban, 1974–83 .............................................................................................................................. 28B. Urban, 1990 .................................................................................................................................... 28
17. Graphs showing concentrations of nitrite plus nitrate and dissolved solids in wells as a function of time, Upper Santa Cruz Basin, Arizona 1985–98. A. Nitrite plus nitrate........................................................................................................................... 30B. Dissolved solids.............................................................................................................................. 30

TABLES
Page
1. Ground-water analyses by the U.S. Geological Survey and the Arizona Department of Environmental Quality, Upper Santa Cruz Basin, Arizona, 1998 ................................................... 11
2. Differences that indicate stability in field measurements of the U.S. Geological Survey ................... 143. Laboratory methods used by the U.S. Geological Survey National Water-Quality
Laboratory and the Arizona Department of Health Services Laboratory for analyses of ground water, Upper Santa Cruz Basin, Arizona .............................................................. 16
4. Summary statistics for ground-water quality data, Upper Santa Cruz Basin, Arizona, 1998 .............. 175. Wells in which ground water exceeds drinking-water regulations and (or) aquifer
water-quality standards for selected constituents, Upper Santa Cruz Basin, Arizona, 1998 ....................................................................................................................................... 19
6. Site information and well-construction data for wells used for historical analysis, Upper Santa Cruz Basin, Arizona ................................................................................................................... 29
7. Water-quality data for field-blank samples, Upper Santa Cruz Basin, Arizona, 1998 ........................ 368. Water-quality data for replicate samples and associated environmental samples, Upper
Santa Cruz Basin, Arizona, 1998 ......................................................................................................... 379. Water-quality data for split samples, Upper Santa Cruz Basin, Arizona, 1998 ................................... 39
10. Ground-water quality data, Upper Santa Cruz Basin, Arizona, 1998 .................................................. 4111. Site information and construction data for wells, Upper Santa Cruz Basin, Arizona, 1998 ................ 4912. Summary results of the analyses of replicate samples and associated environmental
samples collected by the U.S. Geological Survey and the Arizona Department of Environmental Quality, Upper Santa Cruz Basin, Arizona, 1998........................................................ 53
13. Summary results of the analyses of split samples collected by the U.S. Geological Survey and the Arizona Department of Environmental Quality for comparison of laboratory-analytical procedures, Upper Santa Cruz Basin and Sierra Vista subbasin, Arizona, 1996–97 and 1998 ................................................................................................................................ 56
14. Summary results of the analyses of split samples collected by the U.S. Geological Survey and the Arizona Department of Environmental Quality for comparison of sample-collection procedures, Upper Santa Cruz Basin, Arizona, 1998 .......................................................... 57
CONVERSION FACTORS
Multiply By To obtain
centimeter (cm) 0.3937 inchmeter (m) 3.281 foot
kilometer (km) 0.6214 milesquare kilometer (km2) 0.3861 square milesquare kilometer (km2) 247.1 acre
meter squared per day (m2/d) 10.76 foot squared per day
Contents vii

In this report, temperatures are given in degrees Celsius (°C), which can be converted to degrees Fahrenheit (°F) by using the following equation:
°F = 1.8(°C) + 32
ABBREVIATED WATER-QUALITY UNITS
Chemical concentration and water temperature are given only in metric units. Chemical concentration in water is given in milligrams per liter (mg/L) or micrograms per liter (µg/L). Milligrams per liter is a unit expressing the solute per unit volume (liter) of water. One thousand micrograms per liter is equivalent to 1 milligram per liter. For concentrations less than 7,000 milligrams per liter, the numerical value is about the same as for concentrations in parts per million. Specific conductance is given in microsiemens per centimeter (µS/cm) at 25°C. Microsiemens per centimeter at 25°C is a unit expressing the amount of electrical conductivity of a solution as measured between opposite faces of a centimeter cube of solution at a specified temperature of 25°C. Turbidity is given in nephelometric turbidity units (NTU). A nephelometric turbidity unit is a unit expressing the intensity of light scattered by suspended particles at 90° from the path of incident light source. Radioactivity is given in picocuries per liter (pCi/L). Picocuries per liter is a unit expressing the amount of radioactive decay producing 2.2 disintegrations per minute in a unit volume (liter) of water. One picocurie per liter is approximately equivalent to 0.3125 tritium units.
VERTICAL DATUM
Sea level: In this report, “sea level” refers to the National Geodetic Vertical Datum of 1929—A geodetic datum derived from a general adjustment of the first-order level nets of the United States and Canada, formerly “Sea Level Datum of 1929”.
ABBREVIATIONS
ADEQ Arizona Department of Environmental Quality NWIS National Water-Information System
ADHS Arizona Department of Health Services NWQL National Water-Quality Laboratory
BQS Branch of Quality Systems QAPP Quality Assurance Project Plan
CAP Central Arizona Project SMCL Secondary Maximum Contaminant Level
CAZB Central Arizona Basins USEPA U.S. Environmental Protection Agency
MCL Maximum Contaminant Level USGS U.S. Geological Survey
MRL Minimum-reporting level WWTP Wastewater-treatment plant
NAWQA National Water-Quality Assessment
viii Contents
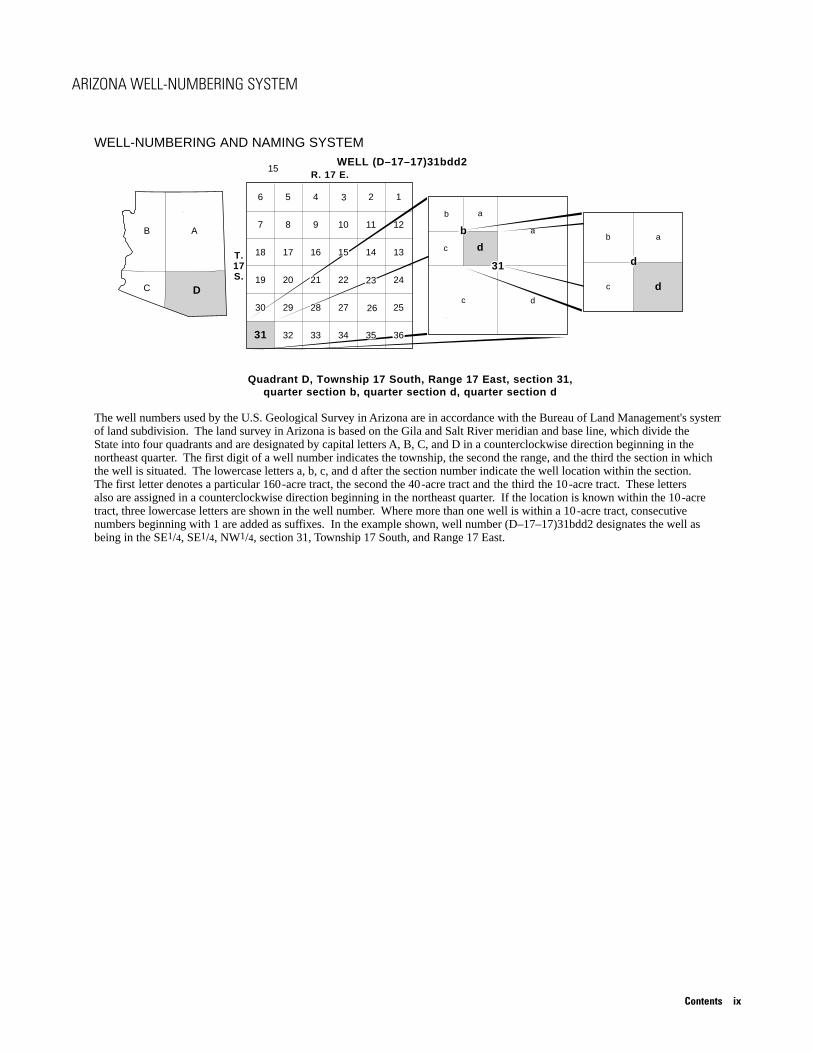
ARIZONA WELL-NUMBERING SYSTEM
Quadrant D, Township 17 South, Range 17 East, section 31,quarter section b, quarter section d, quarter section d
R. 17 E.
T.17S.
d
WELL (D–17–17)31bdd2
b a
6 5 3
7 8
18 16
15
19 20
32 33 3431
17
WELL-NUMBERING AND NAMING SYSTEM
1
14
2
d
d
a
b
A
DC
B b
c
d
c
a
4
10
13
2529
24
36
c
22
27 26
15
31
The well numbers used by the U.S. Geological Survey in Arizona are in accordance with the Bureau of Land Management's systemof land subdivision. The land survey in Arizona is based on the Gila and Salt River meridian and base line, which divide the State into four quadrants and are designated by capital letters A, B, C, and D in a counterclockwise direction beginning in the northeast quarter. The first digit of a well number indicates the township, the second the range, and the third the section in which the well is situated. The lowercase letters a, b, c, and d after the section number indicate the well location within the section. The first letter denotes a particular 160 -acre tract, the second the 40-acre tract and the third the 10-acre tract. These letters also are assigned in a counterclockwise direction beginning in the northeast quarter. If the location is known within the 10-acre tract, three lowercase letters are shown in the well number. Where more than one well is within a 10-acre tract, consecutive numbers beginning with 1 are added as suffixes. In the example shown, well number (D–17–17)31bdd2 designates the well as being in the SE1/4, SE1/4, NW1/4, section 31, Township 17 South, and Range 17 East.
9 11 12
30
21 23
28
35
Contents ix

Ground-Water Quality in the Upper Santa Cruz Basin, Arizona, 1998
By Alissa L. Coes, D.J. Gellenbeck, Douglas C. Towne1, and Maureen C. Freark1
Abstract
Fifty-eight ground-water samples were collected and analyzed in 1998 by the U.S. Geological Survey and the Arizona Department of Environmental Quality to assess ground-water quality and to identify factors affecting ground-water quality in the Upper Santa Cruz Basin. In addition, pre-existing ground-water quality data for six wells were analyzed to determine changes in the ground-water quality of the basin over time.
Twenty-nine percent of the ground-water samples collected had concentrations of at least one constituent that exceeded a Federal or State water-quality standard. The Maximum Contaminant Levels of the U.S. Environmental Protection Agency and the aquifer water-quality standards of the State of Arizona were exceeded for arsenic, fluoride, and nitrite plus nitrate. The Secondary Maximum Contaminant Levels of the U.S. Environmental Protection Agency were exceeded for fluoride, iron, manganese, pH, sulfate, and dissolved solids.
Ground-water quality in the basin is affected by natural factors and human activities. The natural factors that have the most effect on ground-water quality in the basin are depth in the aquifer and distance from major faults. Ground-water temperatures and pH significantly increased with well depth (p≤0.05). Concentrations of dissolved solids, alkalinity, calcium, potassium, chloride, and sulfate were significantly higher in samples collected from wells less than 2 kilometers from major faults than in samples from wells greater than 2 kilometers from major faults (p≤0.05). Previous studies have attributed this relation to the upward migration through faults of ground water from gypsiferous mudstones. Ground-water quality was not significantly different among the various basin-fill units; between parts of the basin fill that differ in thickness, lateral extent, and composition north and south of an inferred fault; or among areas that differ in distance from stream alluvium (p>0.05).
Human activities have a substantial effect on ground-water quality in the basin. Ground water that contained recent (post-1953) recharge from urban areas had significantly higher concentrations of nitrite plus nitrate than ground water that did not contain recent recharge from the land surface (p≤0.05). Ground water that contained recent recharge from present agricultural areas had significantly higher concen-trations of nitrite plus nitrate, calcium, and potassium than ground water that did not contain recent recharge from the land surface (p≤0.05). Ground water that contained recent recharge from present agricultural areas also had significantly higher concentrations of calcium, potassium, alkalinity, and dissolved solids than ground water that contained recent recharge from urban areas (p≤0.05).
1Arizona Department of Environmental Quality, Phoenix, Arizona.
Abstract 1
Pre-existing ground-water quality data for six wells indicated that from the 1980s to 1998, concentrations of nitrite plus nitrate and dissolved solids significantly increased at a well in an agricultural area, concentrations of nitrite plus nitrate significantly increased at a well where the land use had changed from rangeland to urban, and concentrations of nitrite plus nitrate and dissolved solids significantly decreased at a well in an urban area (p≤0.10). Constituents did not significantly increase or decrease from the 1980s to 1998 at an additional well in an agricultural area, at an additional well where the land use had changed from rangeland to urban, and at a well where the land use had changed from agricultural to urban (p≤0.10).
INTRODUCTION
Ground water is the primary source of water for public-supply, household, agricultural, and industrial needs in the Upper Santa Cruz Basin (fig. 1). Historically, the basin has been substantially affected by agricultural and urban development. A population increase of 44.5 percent from 1998 to 2020 for the cities in the basin, as projected by the Arizona Department of Economic Security (1997), would result in an increase in ground-water use. Increased development and use of ground water in the basin may affect ground-water quality.
Several U.S. Geological Survey (USGS) studies have identified the effects of agricultural and urban development on ground-water quality in the western United States (Bevans and others, 1998; Dubrovsky and others, 1998; Wentz and others, 1998). These studies have detected anthropogenic organic compounds and concentrations of nutrients above background levels in agricultural and urban areas. The USGS and the Arizona Department of Environmental Quality (ADEQ) designed a cooperative study to characterize the current (1998) ground-water quality in the Upper Santa Cruz Basin, identify the natural controls on the ground- water quality, identify the effects of human activities on the ground-water quality, and provide a baseline against which future water-quality data can be compared to determine the effects of increased basin development.
Collection of ground-water samples in the Upper Santa Cruz Basin by the USGS was part of the National Water-Quality Assessment (NAWQA) program in the
Central Arizona Basins (CAZB) study area (fig. 1). The CAZB study area is one of 60 study units selected for the NAWQA program. Long-term goals of the program include providing a nationally consistent description of current water-quality conditions for a large part of the Nation’s water resources, defining long-term trends in water quality, and understanding the natural and human factors that affect water quality (Gilliom and others, 1995). In 1994, the USGS began ground-water, surface-water, and biological studies in the CAZB study area. Ground-water studies within the CAZB study area generally are focused on basins in which water quality has been, or has the potential to be, substantially affected by human activities. The Upper Santa Cruz Basin was chosen for study because it has historically been affected by human activities (Water Resources Research Center, 1999) and because there is potential for a change in ground-water quality in the future.
Sampling by the ADEQ was completed as a part of the Ambient Groundwater Monitoring Program, which is based on the legislative mandate in the Arizona Revised Statutes §49-225 (Arizona Department of Environmental Quality, 1995) that authorizes the “ongoing monitoring of the waters of the state, including...aquifers.” Objectives of this mandate include determining the presence of pollutants and compliance with applicable water-quality standards, evaluating the effectiveness of best management practices and the effects of pollutants on public health and the environment, and identifying water-quality trends. Basinwide random sampling is used in the Ambient Groundwater Monitoring Program to determine regional ground- water quality. Targeted higher-density sampling is being done to determine effects of specific land uses on ground-water quality.
Purpose and Scope
This report presents results from a ground- water quality assessment of inorganic constituents in the Upper Santa Cruz Basin by the USGS and the ADEQ in 1998. Analyses of 5 general properties; 6 major ions, 3 nutrients, and 15 trace elements; and the isotope of hydrogen-3 (tritium) from 58 wells were used in the assessment. In addition, pre-existing ground-water quality data for six wells were analyzed to determine changes in the ground-water quality in the basin over time. This report includes discussions of (1) present (1998) ground-water quality conditions, (2) natural controls on ground-water quality, and (3) effects of human activities on ground-water quality.
2 Ground-Water Quality in the Upper Santa Cruz Basin, Arizona, 1998

EXPLANATION
Base from U.S. Geological Surveydigital data, 1:100,000, 1972Albers Equal-Area Conic projectionStandard parallels 29°30', 45°30',central meridian 111°30'
UNITED STATES
MEXICO
PIMA CO
SANTA CRUZ CO
PINAL CO
PIMA CO
UNITED STATESMEXICO
BLACKMOUNTAIN
110°37'30"
111°07'30"
32°
31°37'30"
32°22'30"
MaranaOro
Valley
TUCSON
Vail
Sahuarita
SouthTucson
Green Valley
Nogales
San
t aC
ruz
Big
Ri ll ito
Pant an
RCr
incon
Jo
Cr
sep h
ine
P
Cre
ek
o t re
or
NW
asho
al e sg
Was
h
Wash
Cr
CreekTanque Verde
0 10 20 KILOMETERS
0 10 MILES
Tubac
STREAM ALLUVIUM
CONSOLIDATED ROCKS
BASIN FILL
SANTACATALINA
MOUNTAINS
TOR
TOLI
TA
MO
UN
TAIN
S
TUCSO
N
MO
UNTAINS
PATA
GO
NIA
MO
UN
TAIN
S
TUMACACORI
MOUNTAINS
SIE
RR
ITA
MO
UN
TAIN
S
SA
NTA
RIT
A
MOUNTA
INS
SAN CAYETANO
MOUNTAINS
MO
UN
TAIN
S
RIN
CO
N
MO
UN
TAIN
S
ATA
SC
OS
A
MO
UN
TAIN
S
CENTRALARIZONA BASINS
STUDY AREA
A R I Z O N
UPPERSANTACRUZBASIN
SaC
ruz
ntaR
iver
CE
RR
OC
OLO
RA
DO
Ca
añ d
delO
ro
a
o
ive r
R
T.22S.
T.20S.
T.18S.
T.16S.
T.14S.
T.12S.
T.10S.
T.8S.
R. 12 E. R. 14 E. R. 16 E.MTS
PAJARITO
Figure 1. Location of study area and the Upper Santa Cruz Basin, Arizona.
Introduction 3

This study provided a unique opportunity to combine ground-water quality sampling efforts of the USGS and the ADEQ. The cooperative effort increased the quantity of data available for the study and tested the validity of combining ground-water quality data from the two agencies. Descriptions of field and laboratory methods used by the two agencies are included in this report, and data compatibility was tested and verified.
Acknowledgments
Many private well owners allowed access to their wells for measurements of water levels and collection of water samples. Henry Sanger, David Graham, Julie Rees, Karen Beaulieu, Joe Capesius, Ken Galyean, and Rodrigo Morales of the USGS assisted in the collection of field data.
Physical Setting
The Upper Santa Cruz Basin encompasses about 7,430 km2 in northern Sonora, Mexico, and in Pinal, Pima, and Santa Cruz Counties, Arizona (fig. 1). About 1,150 km2 of the basin lies south of the international boundary in Mexico and was not included in this study. The basin consists of a northward-sloping alluvial valley that ranges from 8 to 32 km wide. Altitudes of the valley floor vary from about 750 to 1,200 m above sea level.
The Upper Santa Cruz Basin is bounded on the west by the Pajarito, Atascosa, Tumacacori, Cerro Colorado, Sierrita, Tucson, and Tortolita Mountains; on the east by the Patagonia, San Cayetano, Santa Rita, Rincon, and Santa Catalina Mountains; and on the north by Black Mountain (fig. 1). The southern boundary of the study area is the international boundary between Arizona and Mexico.
The Santa Cruz River flows northward to northwestward through the Upper Santa Cruz Basin (fig. 1). The river is mostly ephemeral, flowing only in direct response to rainfall or snowmelt (Condes de la Torre, 1970); however, the river is perennial in two reaches downstream from effluent releases from the Nogales International Wastewater-Treatment Plant (WWTP) and the Roger Road and Ina Road WWTPs
(fig. 2). Major tributaries of the Santa Cruz River within the study area also are ephemeral, except Nogales Wash, which is perennial. Nogales Wash is fed by springs, rainfall, and uncontrolled sewage discharges from Mexico (International Boundary and Water Commission, 1998).
The Upper Santa Cruz Basin has an arid to semiarid climate. Temperatures above 32°C prevail from May through September (U.S. Department of Commerce, 1998b). In 1998, the average temperature at Tucson was 20.5°C, and the total precipitation was 35.0 cm; the average temperature at Nogales was 16.1°C, and the total precipitation was 45.7 cm (U.S. Department of Commerce, 1998a). Generally, more than 50 percent of the annual precipitation occurs during the summer monsoon season (usually July through September), and over 20 percent occurs in the winter months (December through March; U.S. Department of Commerce, 1998b).
Land Use and Population
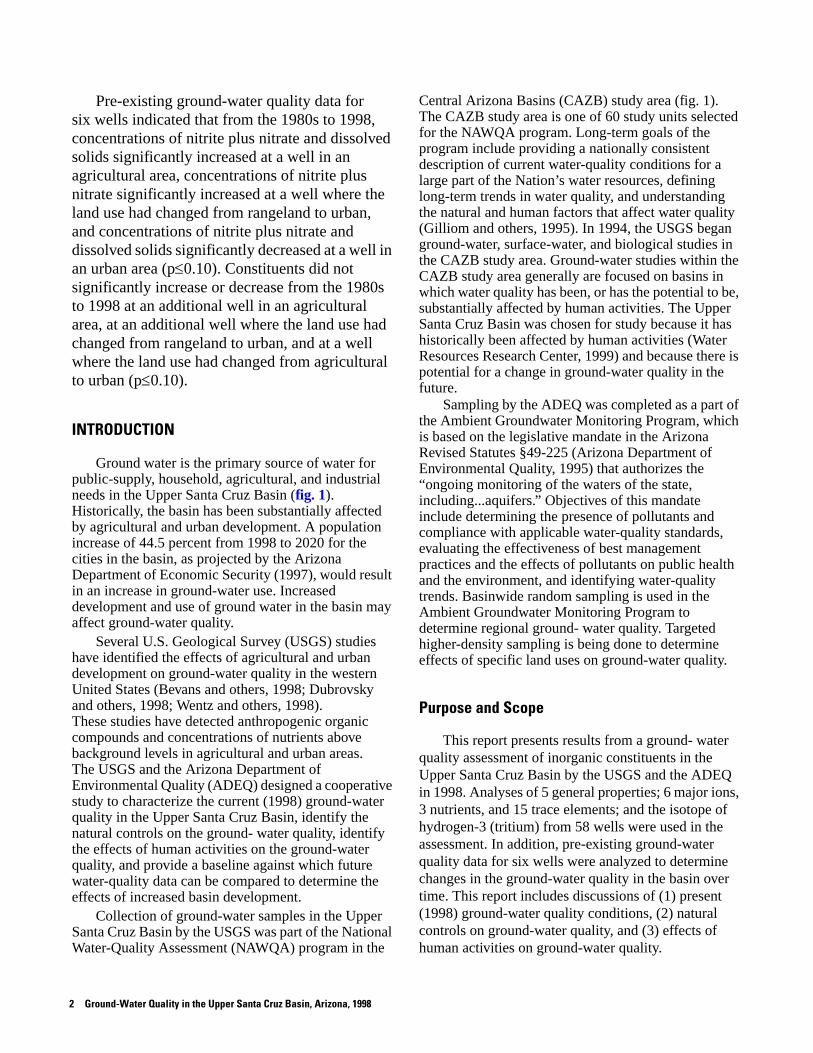
The major land use (about 60 percent) in the Upper Santa Cruz Basin is rangeland (figs. 2 and 3; Anderson and others, 1976). Other land uses are urban, 22.5 percent; forest, 14.3 percent; agricultural, 2.2 percent; and transitional (mines, quarries, bare rock, gravel pits, and sandy areas), 0.7 percent. A small percentage of land use is wetlands (Anderson and others, 1976).
Agricultural land in the Upper Santa Cruz Basin historically covered a greater area than it does today. Irrigated acreage in Pima County, which includes a large part of the Upper Santa Cruz Basin, reached a plateau in 1955 and remained fairly constant until 1975; the cropped acreage was about 202 to 243 km2 (Water Resources Research Center, 1999). The cropped acreage declined after 1975 as agricultural land was retired or developed for urban use, particularly in the Tucson and Marana areas and along the Santa Cruz River (Water Resources Research Center, 1999). In 1997, irrigated acreage in Pima County had declined to about 93 km2 (Water Resources Research Center, 1999).
4 Ground-Water Quality in the Upper Santa Cruz Basin, Arizona, 1998

110°37'30"
111°07'30"
32°
31°37'30"
32°22'30"
Marana
OroValley
TUCSON
Vail
SouthTucson
Green Valley
Sa
Tubac
ivR
Rangeland
LAND USE AND LAND COVER
WELL WITH NUMBERED SITE DESIGNATION (See table 11)
Forest
Urban
Agricultural
Well sampled by the U.S. Geological Survey
Well sampled by the Arizona Department of Environmental Quality
Areas where recharge to the basin-fill aquifer occurs and (or) inorganic ground-water quality is affected as a result of human activities
Transitional
Wetland
EXPLANATION
19
23
28
26
20
21
23
17
15
13
39 9
8
36
35
56
7
3331 2
344
3
1
30
32
12
42 41
16 4746 1848
4443
40
38
37
11
10
14
19
22
2524
55
54
53
52
51
50
45
49
56
27
Nogales InternationalWastewater
Treatment Plant
Nogales Wash
Green Valley Wastewater Treatment Plant
Open-pit copper,silver, and
molybdenum mines
2957
58
nt a
Cru
z
Sahuarita
Pima Mine RoadRecharge Project
Raytheon SystemsCompany and TucsonInternational Airport
Roger Roadand Ina RoadWastewater
Treatment Plantsand Sweetwater Effluent
Recharge Basins
e r
Base from U.S. Geological Surveydigital data, 1:100,000, 1972Albers Equal-Area Conic projectionStandard parallels 29°30', 45°30',central meridian 111°30'
UNITED STATES
MEXICONogales
T.22S.
T.20S.
T.18S.
T.16S.
T.14S.
T.12S.
T.10S.
T.8S.
R. 12 E. R. 14 E. R. 16 E.0 10 20 KILOMETERS
0 10 MILES
Figure 2. Generalized land use (1990) and locations of sampled wells in the Upper Santa Cruz Basin, Arizona. Digital data modified from Anderson and others (1976); urban digital data for 1990 land use is unpublished data from Pima County and the University of Arizona.
Introduction 5
Several historical and present land-use activities in the Upper Santa Cruz Basin (fig. 2) have locally affected the ground-water quality (in terms of inorganic constituents). Prior to 1994, chromium concentrations in ground water near the Raytheon Systems Company (previously the Hughes Aircraft Company) and the Tucson International Airport exceeded the Maximum Contaminant Level (MCL; 100 µg/L) of the U.S. Environmental Protection Agency (USEPA; Graham and Monical, 1997). Cleanup procedures for chromium were completed in this area in 1994 when measured chromium concentrations were below the USEPA MCL. Ground water near the open-pit copper, silver, and molybdenum mines south of Tucson (fig. 4) has concentrations of dissolved solids and sulfate that exceeded USEPA Secondary Maximum Contaminant Levels (SMCLs; 500 and 250 mg/L, respectively; Pima Association of Governments, 1983). Ground water
downgradient from treated-effluent releases to the Santa Cruz River from the Roger Road and Ina Road WWTPs (fig. 5) has concentrations of nitrate that exceeded the USEPA MCL (10 mg/L). The historical agricultural areas surrounding the Roger Road and Ina Road WWTPs were irrigated for decades with treated effluent from the WWTPs (Martin, 1980). Ground water downgradient from uncontrolled sewage discharges to Nogales Wash from Mexico (fig. 6) has concentrations of nitrate that exceeded the USEPA MCL (10 mg/L; International Boundary and Water Commission, 1998). This site was listed on Arizona’s Water-Quality Assurance Revolving Fund Priority List in 1987 for nitrate and volatile organic compounds (Arizona Department of Environmental Quality, 1996).
About 86 percent of the Upper Santa Cruz Basin contains less than 50 people per square kilometer (Hitt, 1994). Tucson (fig. 7), the largest city in the basin, had a population of 468,500 in 1998 (Arizona Department of Economic Security, 1998). By the year 2020, the population of Tucson is expected to be about 589,900 (Arizona Department of Economic Security, 1997). The population of other cities in the basin in 1998 were: 25,500 in Oro Valley, 21,200 in Nogales, 10,000 in Marana, 5,700 in South Tucson, and 2,900 in Sahuarita (Arizona Department of Economic Security, 1998). By the year 2020, populations of other cities in the basin are expected to rise: 59,400 in Oro Valley, 27,800 in Nogales, 76,600 in Marana, 7,200 in South Tucson, and 10,600 in Sahuarita (Arizona Department of Economic Security, 1997).
Geohydrologic Setting
The Upper Santa Cruz Basin is a northward- to northwestward-trending alluvial basin bounded by block-faulted mountains (fig. 8). The basin’s alluvial deposits, which are derived from the surrounding mountains, are referred to collectively as the basin fill. The basin fill of the Upper Santa Cruz Basin differs in thickness, lateral extent, and composition north and south of an inferred fault that is believed to connect the Sopori Wash and Elephant Head-Pantano Wash Faults (Halpenny and Halpenny, 1988). The basin fill north of the inferred fault may be as much as 6,000 m thick, and the basin fill south of the inferred fault is less than 1,000 m thick (Oppenheimer and Sumner, 1980).
Figure 3. Example of rangeland, Oro Valley, Upper Santa Cruz Basin, Arizona.
6 Ground-Water Quality in the Upper Santa Cruz Basin, Arizona, 1998

Figure 4. Open-pit copper mine near Green Valley, Upper Santa Cruz Basin, Arizona. The pit is about 2.8 kilometers across and 365.7 meters deep.
Figure 5. Effluent release to the Santa Cruz River from the Roger Road wastewater-treatment plant, near Tucson, Arizona.
Figure 6. Uncontrolled sewage flow in Nogales Wash near Nogales, Arizona.
The difference in the geology between the two areas probably is the result of downfaulting of the basin fill north of the inferred fault at some time after the basin-fill deposition. Subsequent additional downward movement of the northern basin fill resulted from continued compaction of basin-fill sediments (Halpenny and Halpenny, 1988). For purposes of this report, the geology of the basin fill north of the inferred fault will be discussed separately from the geology of the basin fill south of the inferred fault. The basin fill north and south of the inferred fault is hydrologically connected to form a single basin-fill aquifer (Davidson, 1973); therefore, the hydrology of the basin will be discussed as one unit.
Geology
The mountains surrounding the Santa Cruz Basin consist
of igneous, metamorphic, and sedimentary rocks of
Precambrian to Tertiary age (fig. 8). The mountains are largely composed of granite, andesite, rhyolite, basalt, mon-
zonite, granodiorite, gneiss, limestone, quartzite, conglomerate, sandstone, and shale (Davidson, 1973;
Anderson, 1988; Halpenny and Halpenny, 1988). The igneous, metamorphic, and sedimentary rocks generally are
impermeable; however, secondary fractures can store water locally.
Introduction 7

North of the Inferred Fault.—The Pantano Formation is a consolidated to semiconsolidated conglomerate of Tertiary age and overlies the basal bedrock in the basin north of the inferred fault (Davidson, 1973). The formation ranges from hundreds to thousands of meters in depth, consists of silty sandstone to gravel, and is strongly tilted and offset by faulting (Davidson, 1973). The Pantano Formation crops out along the southern slopes of the Santa Catalina Mountains, the western slopes of the Rincon Mountains, and the northeastern slopes of the Sierrita Mountains. The outcrops also contain interbedded volcanic flows and tuffs (Anderson, 1987).
The Tinaja beds overlie the Pantano Formation. The Tinaja beds are of Tertiary age, range from hundreds to thousands of meters in depth, are coarse grained along the margins of the basin, and grade into finer-grained sediments and evaporite deposits in the center of the basin (Anderson, 1988). Davidson (1973) interpreted the Tinaja beds as a sedimentary detrital filling of a subsiding basin. The Tinaja beds comprise three unconformable units—the lower, middle, and upper beds. The lower Tinaja bed consists of gravel and conglomerate to clayey silt and mudstone and ranges in thickness from tens to hundreds of meters thick. The middle Tinaja bed lies mainly in the center of the basin, consists of gravel and conglomerate to gypsiferous and anhydritic clayey silt and mudstone,
and ranges in thickness from tens to hundreds of meters thick. The upper Tinaja bed consists of gravel, sand, and clayey silt and is tens of meters thick (Anderson, 1988). The Tinaja beds crop out along the southern slopes of the Santa Catalina Mountains, the western slopes of the Rincon Mountains, and the eastern slopes of the Tucson and Sierrita Mountains (Anderson, 1987).
Loosely packed to weakly cemented sediments of Quaternary age, known collectively as the Fort Lowell Formation, unconformably overlie the Tinaja beds. The Fort Lowell Formation grades from silty gravel near the edges of the basin to silty sand and clayey silt in the center of the basin and ranges in thickness from 100 m in the center of the basin to a few meters near the edges of the basin (Davidson, 1973). The formation crops out extensively in the foothills of the Santa Catalina and Rincon Mountains (Davidson, 1973). For the purposes of this study, the Fort Lowell Formation is shown as basin fill over most of the valley floor north of the inferred fault on the surficial geology map (fig. 8); however, throughout most of this area, it is commonly overlain by a veneer of alluvium (Anderson, 1987).
Stream alluvium unconformably overlies the Fort Lowell Formation along the Santa Cruz River and its tributaries north of the inferred fault. The stream alluvium is of Quaternary age, consists mainly of gravel and gravelly sand, and ranges in depth from a few meters to tens of meters thick (Davidson, 1973).
South of the Inferred Fault.—The Nogales Formation is a consolidated conglomerate of Tertiary age and overlies the basal bedrock in the basin south of the inferred fault (Halpenny, 1963). The Nogales Formation consists of sandstone, claystone, and conglomerate derived from limestone, granite, and volcanic material and is at least 450 m thick (Halpenny, 1963). The lower Tinaja bed north of the inferred fault is thought to be correlative with the Nogales Formation (Anderson, 1987). The formation crops out between the Santa Cruz River and Nogales Wash and on the southern slopes of the San Cayetano Mountains (Simons, 1974).
Older alluvium consists of deposits of weakly cemented gravel, sand, and silt and overlies the Nogales Formation (Halpenny and Halpenny, 1988). The older alluvium is of Tertiary and Quaternary age and forms terraces that mark the old, inner valley of the Santa Cruz River south of the inferred fault. The terraces disappear along the edges of the inner valley north of the inferred fault (Halpenny and Halpenny, 1988). For the purposes of this study, the older alluvium is shown as basin fill over most of the valley floor south of the inferred fault on the surficial geology map (fig. 8).
Figure 7. View of downtown Tucson, Arizona, looking northeastward from the Tucson Mountains.
8 Ground-Water Quality in the Upper Santa Cruz Basin, Arizona, 1998

110°37'30"
111°07'30"
32°
31°37'30"
32°22'30"
4 2
3
19
11
10
7
24
26
27
29
18
28
23
6
9
14
20
25
1
21
3433
35
50
53
55
56
51
31
30
32
39
57
58
4847
4443
40
38
3736
DU
DU
U
U
U
D
D
D
D
D
U
??
?
?
Nogales
U
8 Stream alluvium
GEOLOGY
WELL WITH NUMBERED SITE DESIGNATION (See table 11)
Basin fill
Sedimentary rocks
Sedimentary and igneous rocks
Well sampled by the U.S. Geological Survey
Well sampled by the Arizona Department of Environmental Quality
FAULT—Dashed where inferred. D, downthrown side; U, upthrown side
Igneous rocks
Metamorphic rocks
EXPLANATION
NOTE: Major fault locations from CH2M Hill (1988) and Halpenny and Halpenny (1988)
5249
54
13
171615
12
45
42 41
46
?
5
SopoFault
FaInferredEl
hpa
ant
Hea
d-
PantW
ash
ult
Faul
t
ri Wash22
ano
Cru
zF
ault
Santa
36
Base from U.S. Geological Surveydigital data, 1:100,000, 1972Albers Equal-Area Conic projectionStandard parallels 29°30', 45°30',central meridian 111°30'
UNITED STATES
MEXICONogales 0 10 20 KILOMETERS
0 10 MILES
T.22S.
T.20S.
T.18S.
T.16S.
T.14S.
T.12S.
T.10S.
T.8S.
R. 12 E. R. 14 E. R. 16 E.
7
Figure 8. Generalized surficial geology, major faults, and locations of sampled wells, Upper Santa Cruz Basin, Arizona. Geology digital data modified from Reynolds (1988).
Introduction 9

South of the inferred fault, stream alluvium of Quaternary age has been deposited along the Santa Cruz River. The alluvium is composed of gravel, sand, and occasional lenses of silt and ranges in thickness from about 25 to 35 m (Halpenny and Halpenny, 1988).
Hydrology
North of the inferred fault, the stream alluvium is not part of the basin-fill aquifer because the water table is below the base of these deposits; however, the stream alluvium north of the inferred fault may become saturated for as long as several weeks after sustained streamflow (CH2M Hill, 1988). South of the inferred fault, the water table is above the base of the stream alluvium; in this area, the stream alluvium is the most productive part of the basin-fill aquifer (Halpenny, 1963).
The Fort Lowell Formation is the most productive part of the aquifer north of the inferred fault—hydraulic-conductivity values range from about 6 m/d to as much as 29 m/d (Davidson, 1973). In some areas, however, pumping has lowered the water table below the base of the formation (CH2M Hill, 1988). The Tinaja beds form the thickest part of the aquifer north of the inferred fault, and hydraulic-conductivity values range from about 0.4 to 16 m/d (Davidson, 1973). Hydraulic- conductivity values of the Pantano Formation range from about 0.2 to 4 m/d (Davidson, 1973). North of the inferred fault, computed transmissivity values for the basin-fill aquifer range from about 12 to almost 6,200 m2/d and generally are less than 620 m2/d (Anderson, 1972). South of the inferred fault, computed transmissivity values for the older alluvium range from 120 to 270 m2/d (Halpenny and Halpenny, 1988). The Nogales Formation does not yield a substantial quantity of ground water to wells (Halpenny, 1963).
The basin-fill aquifer of the Upper Santa Cruz Basin is unconfined or partly confined (Davidson, 1973; Halpenny and Halpenny, 1988). North of the inferred fault, water levels range from about 25 to 70 m below land surface along the Santa Cruz River and are as much as 160 m below land surface near Vail (Tucson Water, 1998). South of the inferred fault, water levels generally are less than 10 m below land surface along the Santa Cruz River and may exceed 100 m below land surface near the base of mountain ranges (Murphy
and Hedley, 1984). A zone of perched water near the southeast slope of the Tucson Mountains has been reported (Tucson Water, 1998).
Recharge to the basin-fill aquifer of the Upper Santa Cruz Basin primarily occurs from infiltration of winter precipitation and surface flow in the Santa Cruz River and its tributaries (Halpenny, 1963; CH2M Hill, 1988). Other sources of recharge to the basin-fill aquifer include infiltration of precipitation along the mountain fronts, infiltration of effluent in the Santa Cruz River from the Roger Road and Ina Road WWTPs and the Nogales International WWTP, infiltration of effluent in the Santa Cruz River and in percolation ponds from the Green Valley WWTP, infiltration of reclaimed effluent from the Sweetwater Effluent Recharge Basins, infiltration of Central Arizona Project (CAP) water from the Pima Mine Road Recharge Project, infiltration of sewage return flows in the Nogales Wash, infiltration of agricultural return flows from irrigated fields adjacent to the Santa Cruz River, and infiltration of mine return flows as seepage from tailing ponds (fig. 2; Pima Association of Governments, 1983, 1985; CH2M Hill, 1988; Hanson and Benedict, 1994). Discharge of effluent to the Santa Cruz River from the Roger Road and Ina Road WWTPs began in 1950, and discharge of effluent from the Nogales International WWTP began in 1972 (Schmidt and Associates, 1988; Hanson and Benedict, 1994). Discharge of effluent to the Santa Cruz River from the Green Valley WWTP began in 1964 and ended in 1981 when recharge of effluent began from a percolation pond (Pima Association of Governments, 1985). Recharge of effluent from the Sweetwater Effluent Recharge Basins began in 1987, and recharge of CAP water from the Pima Mine Road Recharge Project began in 1998 (Mitch Basefsky, Public Information Supervisor, City of Tucson, oral commun., 1999). Agricultural return flows have been decreasing since 1965, and mine return flows have been decreasing since the 1980s (Hanson and Benedict, 1994).
Ground-water movement generally is from the mountain-front areas toward the valley floors, and then northward in the southern part of the Upper Santa Cruz Basin and northwestward in the northern part of the basin (Murphy and Hedley, 1984). Ground-water discharge in the Upper Santa Cruz Basin occurs as underflow beneath the northwest boundary of the basin, as evapotranspiration, and as pumping from wells (CH2M Hill, 1988).
10 Ground-Water Quality in the Upper Santa Cruz Basin, Arizona, 1998

The hydrologic system in the Upper Santa Cruz Basin was considered to be in approximate equilibrium prior to 1940 (Anderson, 1972), which means that recharge from natural sources equaled discharge from the basin. Coates and Halpenny (1954) reported that in the early to mid-1800s, the ground-water table was shallow enough for the Santa Cruz River to be a perennial stream through much of its course and for phreatophytes to be more plentiful along the river banks than they were in 1954. From the 1930s until about 1975, ground-water pumping steadily increased in the central and northern parts of the basin, and ground-water levels began to decline substantially in these areas (CH2M Hill, 1988). Extensive pumping from the basin-fill aquifer has resulted in ground-water level declines of more than 40 m in the central part of the basin near Green Valley and more than 60 m in the northern part of the basin in the Tucson area (Tucson Water, 1998). Ground-water level declines in the basin have had several effects—shifting of natural ground-water flow paths toward pumping centers; increased vertical-hydraulic gradients; reduction in perennial streamflow in the Santa Cruz River and its tributaries as water levels are lowered below the river bottom; reduction in evapotranspiration as water levels are lowered below plant roots; development of perched zones in the aquifer as water levels are lowered below nonpermeable layers; and compaction of the aquifer, resulting in land subsidence near Tucson of as much as 0.15 m from 1951 to 1980 and as much as 0.06 m from 1980 to 1996 (Anderson, 1988; Hanson and Benedict, 1994; Evans and Pool, 2000). South of the inferred fault, the aquifer has not been affected by ground-water level declines because less ground water is pumped from the basin-fill aquifer in this area than in the northern part of the basin, and because the narrow,
shallow river valley in the southern part of the basin is conducive to rapid recharge to the basin-fill aquifer (Halpenny and Halpenny, 1988).
METHODS OF INVESTIGATION
Ground-water samples were collected in the Upper Santa Cruz Basin by the USGS and the ADEQ and analyzed for general properties; concentrations of major ions, nutrients, and trace elements; and tritium to characterize ground-water quality (table 1). In addition to the analyses listed in table 1, the USGS analyzed ground-water samples for dissolved oxygen (field), silica, bromide, ammonia plus organic nitrogen, nitrite, orthophosphorus, cobalt, molybdenum, nickel, strontium, uranium, dissolved organic carbon, and isotopes of hydrogen-2 and oxygen-18 (Tadayon and others, 1999). The ADEQ analyzed ground-water samples for phenol alkalinity, total Kjeldhal nitrogen, boron, mercury, and thallium. Both the USGS and the ADEQ additionally analyzed ground-water samples for turbidity, hardness, radon, pesticides, and volatile organic compounds; however, the data were not included in this study because field-collection and (or) analytical procedures of the two agencies were dissimilar.
The data of the USGS and the ADEQ for the analyses were combined to increase the quantity of data available to characterize the ground-water quality in the Upper Santa Cruz Basin. To ensure that data from the two agencies could be combined and that an acceptable quality of data would result, similar field-collection, analytical, and quality-assurance procedures were used by the USGS and the ADEQ and individual and joint quality-control samples were collected.
Table 1. Ground-water analyses by the U.S. Geological Survey and the Arizona Department of Environmental Quality, Upper Santa Cruz Basin, Arizona, 1998
General properties Major ions Nutrients Trace elements Isotopes
TemperaturepHSpecific conductanceAlkalinityDissolved solids
CalciumMagnesiumSodium PotassiumChloride Sulfate
Nitrite plus nitrate
AmmoniaPhosphorus
AluminumAntimonyArsenicBariumBeryllium
CadmiumChromiumCopperFluorideIron
LeadManganeseSeleniumSilverZinc
Tritium
Methods of Investigation 11

The quality-assurance procedures and quality-control samples for the USGS and the ADEQ are discussed in detail in the section entitled “Quality Assurance and Quality Control” at the end of the report. Analysis of field-blank samples collected by the USGS indicated systematic contamination by ammonia, aluminum, and zinc; therefore, these constituents were omitted from the data analysis. Analysis of replicate samples collected by the USGS indicated variability of phosphorus concentrations, and analysis of replicate samples collected by the ADEQ indicated variability of sodium concentrations. Analysis of standard-reference samples identified high bias for fluoride from both the USGS National Water-Quality Laboratory (NWQL) and the Arizona Department of Health Services (ADHS) laboratory and high bias for magnesium and zinc from the ADHS laboratory. Analysis of split samples collected by both agencies generally verified that combining the ground-water quality data was acceptable; however, differences were identified between the USGS and the ADEQ laboratory data for alkalinity, magnesium, and potassium. Consideration of specific constituent bias and variability was taken into account when analyzing the water-quality data collected for this study.
Statistical Methods
A variety of methods were used to complete statistical analyses of the ground-water quality data collected by the USGS and the ADEQ during 1998. To determine summary statistics for the data, specific methods were used to handle data sets that had values below the laboratory minimum-reporting level (MRL). Data sets that included concentrations below one or both of the laboratory’s MRLs and for which less than 80 percent of the concentrations were below the MRLs were tested for log-transformed normality using the Kolmogorov- Smirnov one-sample test (SSPS Inc., 1997). Values representing the 10th, 25th, 50th, 75th, and 90th percentile concentration were calculated for each constituent using either the maximum-likelihood estimation method (Cohen, 1959) for normal log-transformed data, or the probability-regression method (Cohen, 1959) for nonnormal log-transformed data. If more than 80 percent of the concentrations for a constituent were below the MRLs, no calculations were completed.
Kendall’s tau-b test statistic (Helsel and Hirsch, 1992)—a nonparametric measure of the association between two variables—was calculated for (1) correlations between concentrations of different constituents, (2) correlations between concentrations of constituents and well depth, and (3) correlations between concentrations of constituents and time. The null hypothesis of no association between variables was rejected if the probability of obtaining the correlation by chance was less than or equal to 0.05 (less than or equal to 0.10 for correlations between concentrations of constituents and time). Concentrations of a constituent less than or equal to either of the agencies’ MRL for that constituent were raised to the highest MRL.
Kendall’s tau-b test statistic is not valid for data sets that have more than 20 percent of concentrations below the MRL (Helsel and Hirsch, 1992). Because of this, the Kendall’s tau-b test statistic was not calculated for phosphorus, antimony, beryllium, cadmium, copper, iron, lead, manganese, selenium, and silver. For arsenic, barium, chromium, and zinc, more than 20 percent of the data collected by both the USGS and the ADEQ were below the highest MRLs, but less than 20 percent of the USGS data were below the USGS MRLs. Consequently, Kendall’s tau-b test statistic was calculated for these constituents using data collected only by the USGS.
The Wilcoxon rank-sum test statistic—a non-parametric measure of the association between two independent sets of data—was used to test the null hypotheses that (1) concentrations of constituents in water from wells less than 2 km from major faults was the same as concentrations in water from wells more than 2 km from major faults, (2) that concentrations of constituents in water from wells less than 2 km from the stream alluvium was the same as concentrations of constituents in water from wells more than 2 km from the stream alluvium, and (3) that concentrations of constituents in water from wells north of the inferred fault was the same as concentrations of constituents in water from wells south of the inferred fault. The null hypothesis of identical median values for both data sets was rejected if the probability of obtaining identical medians by chance was less than or equal to 0.05. Concentrations of constituent data less than or equal to either of the agencies’ MRL for that constituent were raised to the highest MRL.
12 Ground-Water Quality in the Upper Santa Cruz Basin, Arizona, 1998

The Kruskal-Wallis test statistic (Helsel and Hirsch, 1992)—a nonparametric measure of the association between several independent sets of data—was used to test the null hypothesis that concentrations of constituents in water from wells that represent different basin-fill units and recharge from different land uses were the same. The null hypothesis of identical median values for all data sets was rejected if the probability of obtaining identical medians by chance was less than or equal to 0.05. If the null hypothesis was rejected for any of the tests conducted, the Tukey method of multiple comparisons was applied on the ranks of the data set (Helsel and Hirsch, 1992). This test identified significant differences between constituent concentrations when compared to each possibility within each test. The null hypothesis of identical median values for two possibilities in each test was rejected if the probability of obtaining identical medians by chance was less than or equal to 0.05. Concentrations of constituent data less than or equal to either of the agencies’ MRL for that constituent were raised to the highest MRL.
The Tukey method uses the harmonic mean of the group sample size to identify significant differences. If one group sample size is much smaller than the other group sample sizes, the mean sample size is lowered and the smallest difference necessary to declare significance increases. In the “Land Use” section of the report, wells in areas that have received recent recharge from rangeland were not included in the analysis because of the small sample size of the group.
The Wilcoxon rank-sum test statistic, the Kruskal-Wallis test statistic, and the Tukey method are not valid for data sets that have more than 50 percent of concentrations below the MRL (Helsel and Hirsch, 1992). Because of this, these test statistics and this method were not used to analyze phosphorus, antimony, beryllium, cadmium, copper, lead, selenium, and silver data. For arsenic, barium, chromium, iron, manganese, and zinc, more than 50 percent of the concentration data collected by the USGS and the ADEQ were below the highest MRLs; however, less than 50 percent of the USGS concentration data were below the USGS MRLs. Consequently, the Wilcoxon rank-sum test statistic, the Kruskal-Wallis test statistic, and the Tukey method were used to analyze only the constituent data for samples collected by the USGS.
Selection of Sample Locations
The USGS and the ADEQ each planned to sample 30 wells in the Upper Santa Cruz Basin to characterize the ground-water quality. Wells were chosen using a statistically based stratified-random approach. Computer software (Scott, 1990) was used to divide the basin into 30 equal-area polygons that are referred to as cells. Within each cell, primary, secondary, and tertiary points were randomly assigned by the computer software. Different sets of random points within each cell were used by the USGS and the ADEQ for well selection.
Wells within about a 1.6-kilometer radius of each primary point were identified from a data base of wells registered with the Arizona Department of Water Resources. These wells were then randomly ordered. The wells were visited sequentially to determine if they were suitable for sampling. If none of the wells within a 1.6-kilometer radius of the primary point were adequate, wells around the secondary point were identified, randomly ordered, and visited. If none of the wells within a 1.6-kilometer radius of the secondary point were adequate, wells around the tertiary point were identified, randomly ordered, and visited. A well was suitable for sampling if it had a submersible pump, a sampling point between the pump and any treatment system and (or) storage tanks, and a measuring point to determine depth to water; if construction information (depth, perforated interval, casing diameter, and driller’s log) was available; and if the well owner gave permission to sample. Water from the wells selected was being used for domestic, public, irrigation, and commercial supply. Wells open to the basin-fill aquifer were targeted for this study. In some areas, it was difficult to locate wells open to the basin-fill aquifer; therefore, some wells open to bedrock water-bearing units were sampled.
The USGS and the ADEQ each sampled one well in 29 of the 30 cells; no suitable well was found in the thirtieth cell on the western boundary of the basin between the Sierrita and Tucson Mountains.
Field Methods
The USGS followed NAWQA ground-water sampling protocols and procedures (Koterba and others, 1995). The ADEQ followed the “Quality Assurance Project Plan” (QAPP; Arizona Department
Methods of Investigation 13
of Environmental Quality, 1991) and the “Field Manual For Water-Quality Sampling” (Water Resources Research Center, 1995).
U.S. Geological Survey
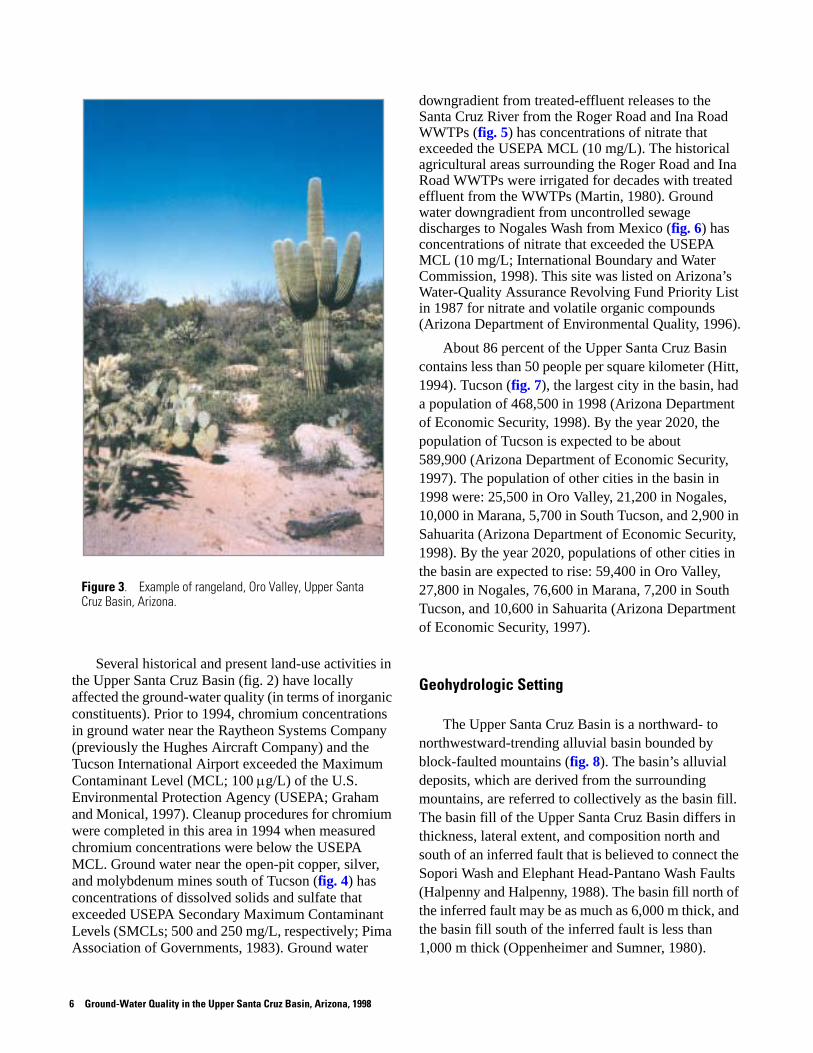
The USGS used equipment and procedures that were designed to minimize potential bias and variability. Before samples were collected, the depth to water was measured within the well casing, and wells were pumped to purge at least three casing volumes of water. During the purging of water, temperature, pH, specific conductance, turbidity, and dissolved-oxygen concentrations were measured using individual meters (table 10 in the section entitled “Basic Data” at the back of the report). A flow-through chamber was used for measurements of temperature, pH, and dissolved-oxygen concentrations to isolate the samples from contact with the atmosphere. During the last 25 minutes of purging, measurements were made every 5 minutes. After stabilization of field measurements (table 2), samples were collected inside the field vehicle using teflon tubing attached at a location near the wellhead before water entered treatment equipment or storage tanks (fig. 9). During collection of ground water, the samples were in contact with materials within the well and pump system, teflon tubing, and stainless-steel connectors. Samples were not analyzed for trace elements if the measured turbidity was greater than 10 nephelometric turbidity units (NTU).
Chambers were used to isolate samples from potential atmospheric contamination during sample collection and preservation. Samples for the determination of some general properties and all major ions, nutrients, and trace elements were collected after they had passed through a 0.45-micrometer in-line cartridge filter. One milliliter of nitric acid (70 percent) was used to preserve 250-milliliter samples for trace-element analysis and some major-ion analysis. Samples for nutrient analysis were kept chilled until they were analyzed at the laboratory.
Arizona Department of Environmental Quality
The ADEQ used equipment and procedures that were designed to minimize potential bias and variability. Wells were pumped before sample collection to purge at least one to three casing volumes of water. During well purging, temperature, specific conductance, and pH were measured using a Hydrolab (table 10 in the section entitled “Basic Data” at the back of the report). About 5 to 10 measurements were made before the samples were collected; at most wells, this equated to one measure- ment every 5 minutes. Temperature, specific conductance, and pH were considered stable when values from repeated measurements were within 10 percent of one another. After field measurements stabilized, samples were collected close to the wellhead before water entered treatment equipment or storage tanks.
Table 2. Differences that indicate stability in field measurements of the U.S. Geological Survey [Koterba and others (1995). ±, plus or minus; °C, degrees Celsius; ≤, less than or equal to; >, greater than; µS/cm, microsiemens per centimeter at 25°C; mg/L, milligrams per liter; <, less than; NTU, nephelometric turbidity units]
Property Allowable difference or value
Temperature ± 0.2 °C
pH ± 0.05 standard units
Specific conductance (SC) ± 5 percent for SC ≤ 100 µS/cm± 3 percent for SC > 100 µS/cm
Dissolved oxygen ± 0.3 mg/L
Turbidity ± 10 percent for turbidity<100 NTU
Figure 9. Dedicated water-quality sampling vehicle used by the U.S. Geological Survey.
14 Ground-Water Quality in the Upper Santa Cruz Basin, Arizona, 1998

A 0.45−micrometer in-line cartridge filter was used to filter samples for trace-element analysis by attaching the filter directly to an adaptor attached to the sampling point or by attaching the cartridge filter to a positive-pressure filtering apparatus attached to a bottle filled with unfiltered sample water. The 1-liter samples collected for trace-element constituent analysis were preserved with 5 mL of concentrated nitric acid (70 percent). The 1-liter samples for nutrient analysis were preserved with 2 mL of concentrated sulfuric acid (95.5 percent). Samples for major-ion, nutrient, and trace-element analysis were kept chilled until they were analyzed at the laboratory. The chain-of-custody procedures for ADEQ were followed during handling of the samples.
Laboratory Methods
With the exception of samples collected for the determination of tritium, samples collected by the USGS were analyzed by the NWQL, and samples collected by the ADEQ were analyzed by the ADHS laboratory (table 3). Samples collected by the USGS and the ADEQ for the determination of tritium were analyzed by a USGS laboratory in Menlo Park, California. Laboratory alkalinity and specific-conductance values are reported because both agencies did not measure these properties in the field. For the USGS data, the difference between laboratory and field measurements of alkalinity and specific conductance were less than 15 and 5 percent, respectively. For some properties and constituents, the analytical methods and (or) MRLs (table 3) used by the laboratories were different. Differing MRLs made interpretation of the data difficult because some measurable concentrations were below one MRL and above the other MRL.
GROUND-WATER QUALITY
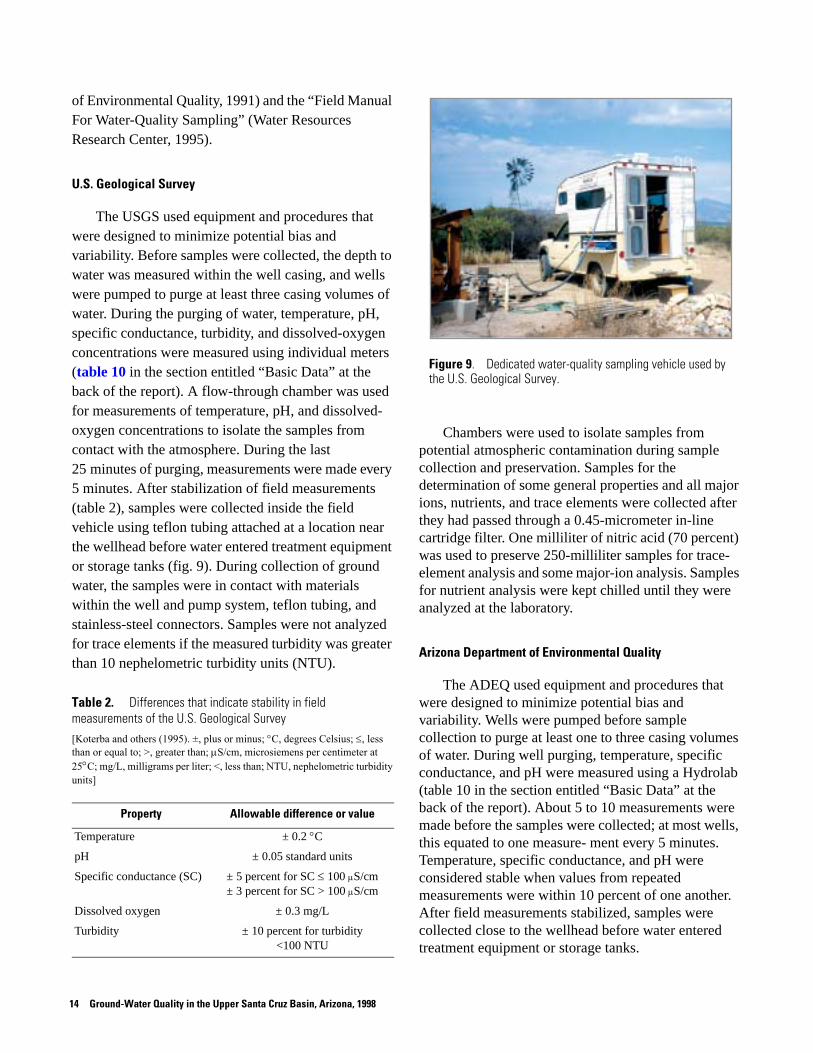
General properties and concentrations of major ions, nutrients, trace elements, and isotopic compositions vary in ground-water samples collected in the Upper Santa Cruz Basin (table 4). On the basis of the cations and anions that contribute more than 50 percent of the ions in solution, ground water in the basin is a calcium bicarbonate type (fig. 10).
Comparisons of the ground-water quality data (table 10 in the section entitled “Basic Data” at the back of the report) with drinking-water regulations and aquifer water-quality standards (table 5) indicate that ground water in the Upper Santa Cruz Basin generally
is suitable for municipal, agricultural, and irrigation uses. The USEPA MCLs for drinking water are health-based standards that define the maximum concentration of a constituent that is allowed in a public-water system (U.S. Environmental Protection Agency, 1996). The State of Arizona aquifer water-quality standards apply to aquifers classified for drinking-water use (State of Arizona, 1996). The USEPA SMCLs are unenforceable guidelines that defines the maximum concentration of a characteristic or constituent that can be present without unpleasant taste, color, odor, or other aesthetic effects on drinking water (U.S. Environmental Protection Agency, 1996). Of the 58 samples collected in the Upper Santa Cruz Basin in 1998, 17 samples had concentrations of at least one constituent that exceeded a Federal or State water-quality standard. The USEPA MCLs and State of Arizona aquifer water-quality standards were exceeded for arsenic, fluoride, and nitrite plus nitrate; USEPA SMCLs were exceeded for fluoride, iron, manganese, pH, sulfate, and dissolved solids (table 5).
In June 2000, the USEPA proposed to lower the arsenic MCL to 5 µg/L (U.S. Environmental Protection Agency, 2000). At least 10 samples had arsenic concentrations that exceed the proposed MCL. The ADEQ MRL for arsenic, however, was 10 µg/L; additional samples may have concentrations that exceed the proposed MCL.
The sample that exceeded the USEPA SMCL for iron (site 55) had an aluminum concentration higher than any other sample (2,700 µg/L) and a pH below the USEPA SMCL range (6.5 to 8.5 standard units). The high iron and aluminum concentrations were most likely derived from the well casing, which is black steel and iron pipe.
Natural Controls on Ground-Water Quality
Natural controls on ground-water quality in the Upper Santa Cruz Basin must be understood before the effects of human activities on ground-water quality in the basin can be determined. Natural controls on ground-water quality were examined by identifying variations in ground-water quality related to well depth and geology (basin-fill units, distance from faults, distance from stream alluvium, and location north or south of the inferred fault; fig. 8; table 11 in the section entitled “Basic Data” at the back of the report). Well depth was determined using well-drillers’ logs. Locations of fault zones, basin-fill units, and stream alluvium were determined using geologic maps and well-drillers’ logs.
Ground-Water Quality 15

Table 3. Laboratory methods used by the U.S. Geological Survey National Water-Quality Laboratory and the Arizona Department of Health Services Laboratory for analyses of ground water, Upper Santa Cruz Basin, Arizona
[Constituents are dissolved and are reported in milligrams per liter unless otherwise noted. ICP, inductively coupled plasma; AES, atomic emission spectroscopy; AA, atomic absorption; MS, mass spectroscopy; LS, liquid scintillation counting method; µS/cm, microsiemens per centimeter at 25 degrees Celsius; µg/L, micrograms per liter; pCi/L, picocuries per liter; N/A, not available]
Propertyor constituent
U.S. Geological SurveyNational Water-Quality Laboratory
Arizona Department of Health Services Laboratory
MethodMinimum-
reporting level MethodMinimum-
reporting level
General properties
Specific conductance (µS/cm) Wheatstone bridge 1.0 Wheatstone bridge 1.0
Alkalinity Electrometric titration 1.0 Electrometric titration 2.0
Dissolved solids Gravimetric 1 Gravimetric 10
Major ions
Calcium ICP .02 ICP-AES 1.0
Magnesium ICP .01 ICP-AES 1.0
Sodium ICP .2 ICP-AES 5.0
Potassium Flame AA .1 Flame AA .5
Chloride Ion chromatography .1 Potentiometric titration 1.0
Sulfate Ion chromatography .1 Colorimetric 10
Nutrients
Nitrite plus nitrate Colorimetric .05 Colorimetric .02
Ammonia Colorimetric .010 Colorimetric .020
Phosphorus Colorimetric .010 Colorimetric .020
Trace elements
Aluminum (µg/L) ICP-MS 1.0 ICP-AES 500
Antimony (µg/L) ICP-MS 1.0 Graphite furnace AA 5.0
Arsenic (µg/L) Hydride generation 1 Graphite furnace AA 10
Barium (µg/L) ICP-MS 1.0 ICP-AES 100
Beryllium (µg/L) ICP-MS 1.0 Graphite furnace AA .5
Cadmium (µg/L) ICP-MS 1.0 Graphite furnace AA 1.0
Chromium (µg/L) ICP-MS 1.0 Graphite furnace AA 10
Copper (µg/L) ICP-MS 1.0 Graphite furnace AA 10
Fluoride Ion selective electrode .10 Ion selective electrode .20
Iron (µg/L) ICP 10 ICP-AES 100
Lead (µg/L) ICP-MS 1.0 Graphite furnace AA 5.0
Manganese (µg/L) ICP-MS 1.0 ICP-AES 50
Selenium (µg/L) Hydride generation 1 Graphite furnace AA 5
Silver (µg/L) ICP-MS 1.0 Graphite furnace AA 1.0
Zinc (µg/L) ICP-MS 1.0 ICP-AES 50
Isotopes
Tritium, total (pCi/L) LS 2.5 N/A N/A
16 Ground-Water Quality in the Upper Santa Cruz Basin, Arizona, 1998
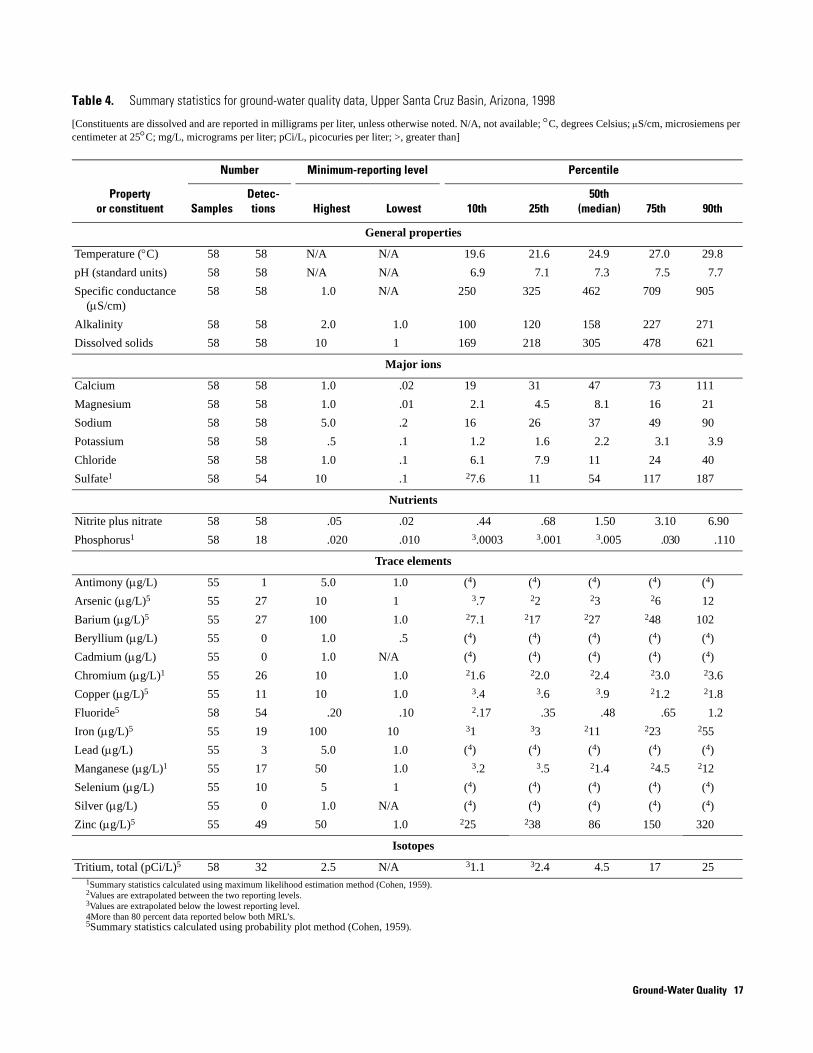
Table 4. Summary statistics for ground-water quality data, Upper Santa Cruz Basin, Arizona, 1998
[Constituents are dissolved and are reported in milligrams per liter, unless otherwise noted. N/A, not available; °C, degrees Celsius; µS/cm, microsiemens per centimeter at 25°C; mg/L, micrograms per liter; pCi/L, picocuries per liter; >, greater than]
Propertyor constituent
Number Minimum-reporting level Percentile
SamplesDetec-tions Highest Lowest 10th 25th
50th(median) 75th 90th
General properties
Temperature (°C) 58 58 N/A N/A 19.6 21.6 24.9 27.0 29.8
pH (standard units) 58 58 N/A N/A 6.9 7.1 7.3 7.5 7.7
Specific conductance (µS/cm)
58 58 1.0 N/A 250 325 462 709 905
Alkalinity 58 58 2.0 1.0 100 120 158 227 271
Dissolved solids 58 58 10 1 169 218 305 478 621
Major ions
Calcium 58 58 1.0 .02 19 31 47 73 111
Magnesium 58 58 1.0 .01 2.1 4.5 8.1 16 21
Sodium 58 58 5.0 .2 16 26 37 49 90
Potassium 58 58 .5 .1 1.2 1.6 2.2 3.1 3.9
Chloride 58 58 1.0 .1 6.1 7.9 11 24 40
Sulfate1 58 54 10 .1 27.6 11 54 117 187
Nutrients
Nitrite plus nitrate 58 58 .05 .02 .44 .68 1.50 3.10 6.90
Phosphorus1 58 18 .020 .010 3.0003 3.001 3.005 .030 .110
Trace elements
Antimony (µg/L) 55 1 5.0 1.0 (4) (4) (4) (4) (4)
Arsenic (µg/L)5 55 27 10 1 3.7 22 23 26 12
Barium (µg/L)5 55 27 100 1.0 27.1 217 227 248 102
Beryllium (µg/L) 55 0 1.0 .5 (4) (4) (4) (4) (4)
Cadmium (µg/L) 55 0 1.0 N/A (4) (4) (4) (4) (4)
Chromium (µg/L)1 55 26 10 1.0 21.6 22.0 22.4 23.0 23.6
Copper (µg/L)5 55 11 10 1.0 3.4 3.6 3.9 21.2 21.8
Fluoride5 58 54 .20 .10 2.17 .35 .48 .65 1.2
Iron (µg/L)5 55 19 100 10 31 33 211 223 255
Lead (µg/L) 55 3 5.0 1.0 (4) (4) (4) (4) (4)
Manganese (µg/L)1 55 17 50 1.0 3.2 3.5 21.4 24.5 212
Selenium (µg/L) 55 10 5 1 (4) (4) (4) (4) (4)
Silver (µg/L) 55 0 1.0 N/A (4) (4) (4) (4) (4)
Zinc (µg/L)5 55 49 50 1.0 225 238 86 150 320
Isotopes
Tritium, total (pCi/L)5 58 32 2.5 N/A 31.1 32.4 4.5 17 251Summary statistics calculated using maximum likelihood estimation method (Cohen, 1959).2Values are extrapolated between the two reporting levels.3Values are extrapolated below the lowest reporting level.4More than 80 percent data reported below both MRL’s.5Summary statistics calculated using probability plot method (Cohen, 1959).
Ground-Water Quality 17

ENVIRONMENTAL SAMPLE—U.S. Geological Survey and Arizona Department of Environmental Quality
SPLIT SAMPLE—U.S. Geological Survey and Arizona Department of Environmental Quality
EXPLANATION
PERCENT OF TOTAL MILLIEQUIVALENTS PER LITER
CALCIUM
SO
DIU
M + P
OTA
SS
IUM
CA
RB
ON
ATE
+ B
ICA
RB
ON
ATE
CA
LCIU
M + M
AGN
ES
IUMSU
LFAT
E +
CH
LOR
IDE
CHLORIDE
80
100
100
60
40
20
0
20
0
80
100
20
100
80 60 40 20 0
100806040200
0
80
100
0
80
60
40
20
100
80
60
40
20
0
MAG
NE
SIU
M SU
LFATE
100
80
60
40
20
0
Figure 10. Relative composition of ground-water samples, Upper Santa Cruz Basin, Arizona, 1998.
18 Ground-Water Quality in the Upper Santa Cruz Basin, Arizona, 1998
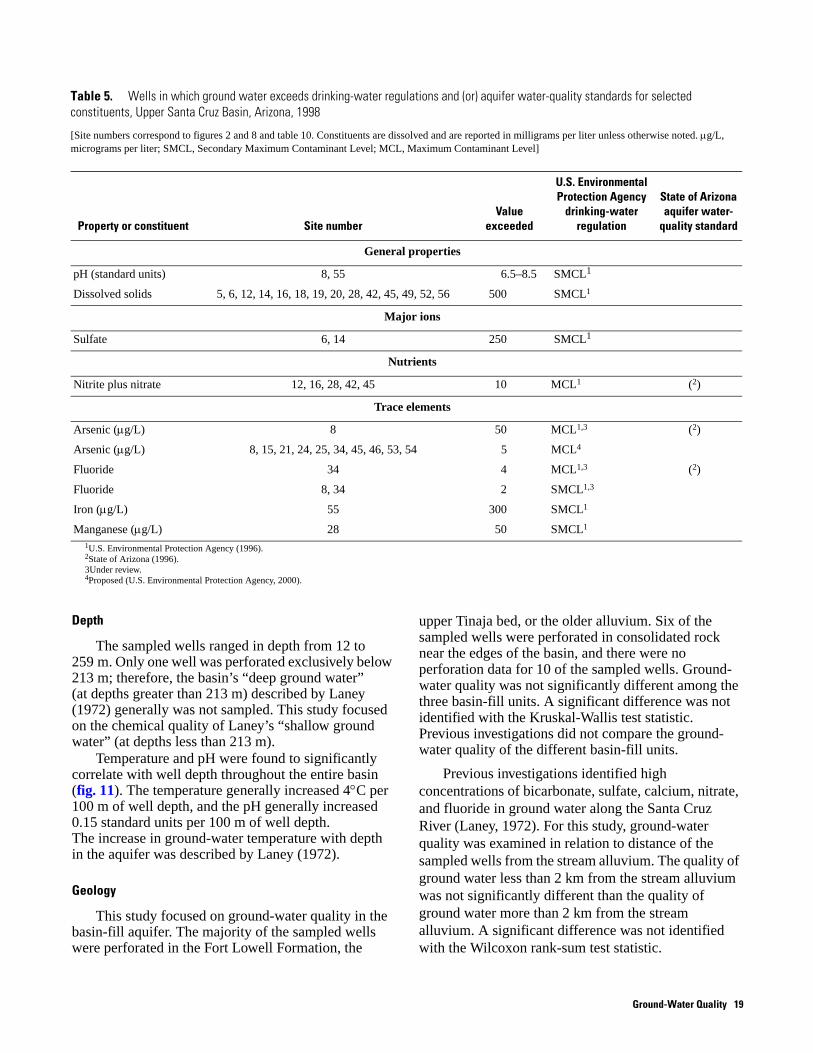
Table 5. Wells in which ground water exceeds drinking-water regulations and (or) aquifer water-quality standards for selected constituents, Upper Santa Cruz Basin, Arizona, 1998
[Site numbers correspond to figures 2 and 8 and table 10. Constituents are dissolved and are reported in milligrams per liter unless otherwise noted. µg/L, micrograms per liter; SMCL, Secondary Maximum Contaminant Level; MCL, Maximum Contaminant Level]
Property or constituent Site numberValue
exceeded
U.S. Environmental Protection Agency
drinking-water regulation
State of Arizona aquifer water-
quality standard
General properties
pH (standard units) 8, 55 6.5–8.5 SMCL1
Dissolved solids 5, 6, 12, 14, 16, 18, 19, 20, 28, 42, 45, 49, 52, 56 500 SMCL1
Major ions
Sulfate 6, 14 250 SMCL1
Nutrients
Nitrite plus nitrate 12, 16, 28, 42, 45 10 MCL1 (2)
Trace elements
Arsenic (µg/L) 8 50 MCL1,3 (2)
Arsenic (µg/L) 8, 15, 21, 24, 25, 34, 45, 46, 53, 54 5 MCL4
Fluoride 34 4 MCL1,3 (2)
Fluoride 8, 34 2 SMCL1,3
Iron (µg/L) 55 300 SMCL1
Manganese (µg/L) 28 50 SMCL1
1U.S. Environmental Protection Agency (1996).2State of Arizona (1996).3Under review.4Proposed (U.S. Environmental Protection Agency, 2000).
Depth
The sampled wells ranged in depth from 12 to 259 m. Only one well was perforated exclusively below 213 m; therefore, the basin’s “deep ground water” (at depths greater than 213 m) described by Laney (1972) generally was not sampled. This study focused on the chemical quality of Laney’s “shallow ground water” (at depths less than 213 m).
Temperature and pH were found to significantly correlate with well depth throughout the entire basin (fig. 11). The temperature generally increased 4°C per 100 m of well depth, and the pH generally increased 0.15 standard units per 100 m of well depth. The increase in ground-water temperature with depth in the aquifer was described by Laney (1972).
Geology
This study focused on ground-water quality in the basin-fill aquifer. The majority of the sampled wells were perforated in the Fort Lowell Formation, the
upper Tinaja bed, or the older alluvium. Six of the sampled wells were perforated in consolidated rock near the edges of the basin, and there were no perforation data for 10 of the sampled wells. Ground-water quality was not significantly different among the three basin-fill units. A significant difference was not identified with the Kruskal-Wallis test statistic. Previous investigations did not compare the ground-water quality of the different basin-fill units.
Previous investigations identified high concentrations of bicarbonate, sulfate, calcium, nitrate, and fluoride in ground water along the Santa Cruz River (Laney, 1972). For this study, ground-water quality was examined in relation to distance of the sampled wells from the stream alluvium. The quality of ground water less than 2 km from the stream alluvium was not significantly different than the quality of ground water more than 2 km from the stream alluvium. A significant difference was not identified with the Wilcoxon rank-sum test statistic.
Ground-Water Quality 19

35
2006
WELL DEPTH, IN METERS BELOW LAND SURFACE
250100 150500 300
p-value = 0.040
p-value is less than 0.001
pH
, IN
ST
AN
DA
RD
UN
ITS
9
8
7
TE
MP
ER
AT
UR
E,
IN D
EG
RE
ES
CE
LS
IUS
0
15
10
5
30
25
20
LOCALLY WEIGHTED SCATTERPLOT SMOOTHING (LOWESS)
EXPLANATION
Figure 11. Temperature and pH as functions of well depth, Upper Santa Cruz Basin, Arizona, 1998.
Ground-water quality north of the inferred fault was compared to ground-water quality south of the inferred fault to identify water-quality variations related to the structural and compositional differences of the basin fill north and south of the fault. The ground-water quality north of the inferred fault was not significantly different than the ground- water quality south of the inferred fault. A significant difference was not identified with the Wilcoxon rank-sum test statistic. Previous investi- gations did not compare ground-water quality north and south of the inferred fault.
Dissolved solids, alkalinity, calcium, potassium, chloride, and sulfate concentrations were higher in samples collected from wells less than 2 km from major faults in the basin fill than in samples collected from wells more than 2 km from major faults. A significant difference was identified using the Wilcoxon rank-sum test statistic (fig. 12). High concentrations of dissolved solids, alkalinity, calcium, chloride, and sulfate in ground water near the Santa Cruz Fault was identified by Laney (1972). Laney attributed these concentrations to upward migration of ground water through faults from gypsiferous mudstones of the Tinaja beds.
20 Ground-Water Quality in the Upper Santa Cruz Basin, Arizona, 1998

DIS
SO
LVE
D-S
OLI
DS
CO
NC
EN
TR
AT
ION
,IN
MIL
LIG
RA
MS
PE
R L
ITE
R
1,000 400
>2 km
LOCATION OF WELLS RELATIVE TO MAJOR FAULTS
800
600
400
200
0<2 km >2 km <2 km >2 km <2 km
(38)
EXPLANATION
90TH PERCENTILE
75TH PERCENTILE
25TH PERCENTILE
10TH PERCENTILE
MEDIAN
NUMBER OF OBSERVATIONS
PERCENTILE—Percentage of analyses equal to or less than the indicated values
OUTSIDE VALUE—Data values outside the 10TH
and 90TH percentiles
MORE THAN 2 KILOMETERS FROM MAJOR FAULTS
LESS THAN 2 KILOMETERS FROM MAJOR FAULTS
100
0
200
300
200
50
0
100
150
PO
TA
SS
IUM
CO
NC
EN
TR
AT
ION
,IN
MIL
LIG
RA
MS
PE
R L
ITE
R
ALK
ALI
NIT
Y C
ON
CE
NT
RA
TIO
N,
IN M
ILLI
GR
AM
S P
ER
LIT
ER
CH
LOR
IDE
CO
NC
EN
TR
AT
ION
,IN
MIL
LIG
RA
MS
PE
R L
ITE
R
CA
LCIU
M C
ON
CE
NT
RA
TIO
N,
IN M
ILLI
GR
AM
S P
ER
LIT
ER
SU
LFA
TE
CO
NC
EN
TR
AT
ION
,IN
MIL
LIG
RA
MS
PE
R L
ITE
R
5 100
>2 km
>2 km
<2 km
LOCATION OF WELLS RELATIVE TO MAJOR FAULTS
4
p-value = 0.003 p-value = 0.050 p-value = 0.002
p-value = 0.003 p-value = 0.050 p-value = 0.003
3
2
1
0<2 km >2 km <2 km >2 km <2 km
0
80
60
40
20
0
400
100
0
200
300
(20)
(38) (20)
(38) (20)
(20)
(38) (20)
(38) (20)
(38) (20)
NOTE: Only di f ferences signi-f i c a n t a t t h e α = 0.0 5 test level are graphed.
Figure 12. Concentrations of dissolved solids, alkalinity, calcium, potassium, chloride, and sulfate in wells relative to location of major faults, Upper Santa Cruz Basin, Arizona, 1998.
Ground-Water Quality 21

The dissolved-solids concentrations in ground-water samples significantly correlate with calcium and sulfate concentrations (fig. 13). This correlation suggests a gypsiferous source of the ground water. Dissolved-solids concentrations above the USEPA SMCL (500 mg/L) at sites 5, 6, 12, 14, 16, 18, 19, 20, 28, 42, 45, 49, 52, and 56, and the sulfate concentrations above the USEPA SMCL (250 mg/L) at sites 6 and 14 can be partially attributed to the upward migration of ground water. Ground- water samples from many of these wells also had high (greater than 100 mg/L) calcium concentrations.
In addition to upward migration of ground water along faults, the high concentrations of dissolved solids and sulfate at site 14 also may be attributed to a zone in the basin fill first described by Laney (1972). Laney described a zone containing high concentrations of dissolved solids, calcium, and sulfate that extended from near Vail northwestward toward central Tucson. The high concentrations in this area were attributed to movement of ground water through gypsiferous rocks of the Pantano Formation and (or) older rocks in the headwaters of Pantano Wash.
The high dissolved-solids concentrations at some sites can be attributed to geology; however, at some sites, it also may be attributed to human activities near the wells. The Upper Santa Cruz Basin is east of an area of massive evaporite deposits in the basin fill and high specific-conductance values in the ground water that is called the “Gila Low” (Pierce, 1974). Specific-conductance values (which are related to dissolved-solids concentrations) measured in 1998 in the Upper Santa Cruz Basin are higher than would be expected for a basin outside the “Gila Low” (Gellenbeck and Coes, 1999). In addition, dissolved-solids concentrations in the Upper Santa Cruz Basin generally are higher than those of the eastward neighboring basin of Sierra Vista, which has less urban and agricultural development (Coes and others, 1999).
One ground-water sample had a fluoride concentration greater than the USEPA MCL (4 mg/L; site 34; figs. 2 and 8), and one ground-water sample had a fluoride concentration greater than the USEPA SMCL (2 mg/L; site 8; figs. 2 and 8). Laney (1972) attributed fluoride concentrations in ground water in the Upper Santa Cruz Basin to chemical reactions
between the aquifer material and the ground water. Site 8 is at the base of the Tucson Mountains, which are primarily volcanic in origin (Davidson, 1973). Fluoride-bearing minerals are common in these volcanic rocks, and clays in the basin-fill deposits downgradient from the Tucson Mountains probably have fluoride weakly attached to cation-exchange sites. The ground-water sample collected at site 8 had a pH above the USEPA SMCL range (6.5 to 8.5 standard units). The high pH may contribute to conditions that allow fluoride ions to be replaced by hydroxyl ions in clays, consequently, fluoride ions are released into solution. The ground-water sample from site 34 did not have a high pH, and samples from two wells near site 34 (sites 4 and 33) had fluoride concentrations of less than 1 mg/L; thus, the source of the high fluoride concentration at site 34 is not clear. Analyses from the NWQL and the ADHS laboratory were biased toward high concentrations of fluoride; therefore, the high concentrations in these two samples may be a factor of laboratory bias.
The ground-water sample from site 8 had an arsenic concentration almost double the current USEPA MCL (50 µg/L; U.S. Environmental Protection Agency, 1996). The high concentration at site 8 may be attributed to arsenic compounds in the basin fill; however, it also may be attributed to human activities near the well. Robertson (1991) attributed high arsenic concentrations in ground water in southern Arizona to oxidized arsenic compounds in the basin-fill sediments, which are originally derived from sulfide and arsenide deposits in the surrounding mountains. The volcanic rocks in the Tucson Mountains may be a source of arsenic to the basin-fill sediments near site 8.
Effects of Human Activities on Ground-Water Quality
Effects of human activities on ground-water quality in the Upper Santa Cruz Basin were examined by identifying variations in present ground-water quality among areas of different land use and by changes in ground-water quality over time.
22 Ground-Water Quality in the Upper Santa Cruz Basin, Arizona, 1998
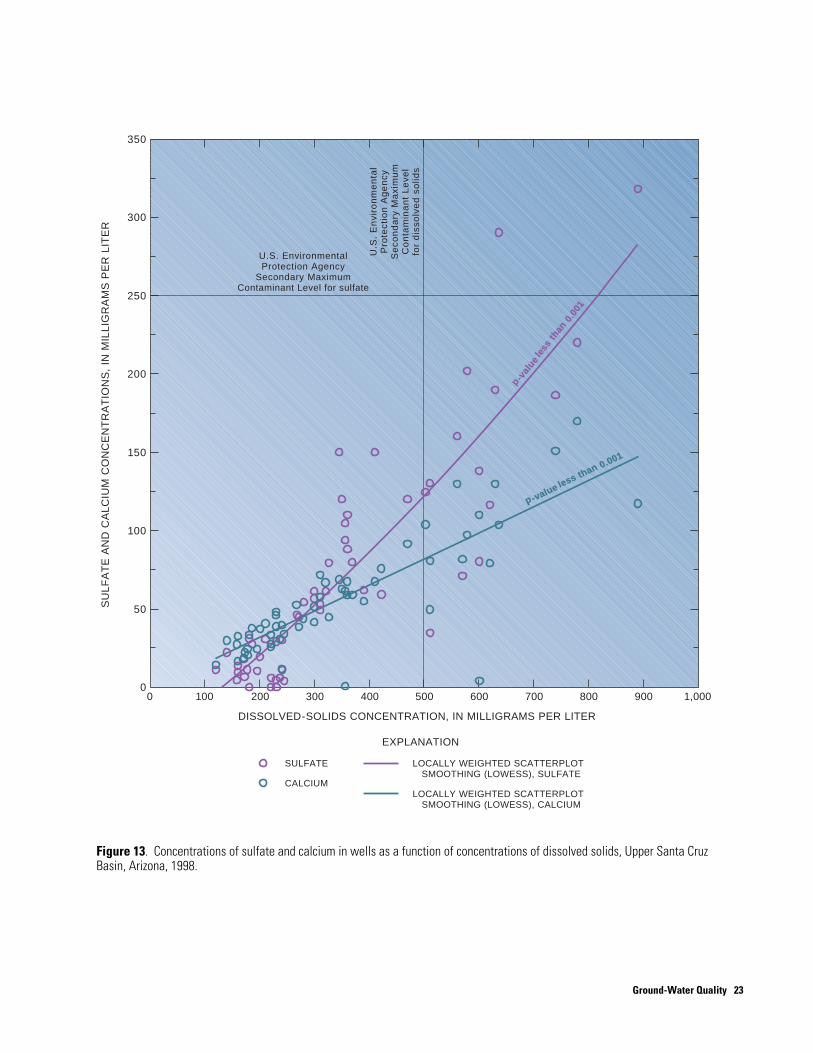
LOCALLY WEIGHTED SCATTERPLOT SMOOTHING (LOWESS), SULFATE
LOCALLY WEIGHTED SCATTERPLOT SMOOTHING (LOWESS), CALCIUM
SULFATE
CALCIUM
EXPLANATION
DISSOLVED-SOLIDS CONCENTRATION, IN MILLIGRAMS PER LITER
SU
LF
AT
E A
ND
CA
LC
IUM
CO
NC
EN
TR
AT
ION
S,
IN M
ILL
IGR
AM
S P
ER
LIT
ER
0 1,000
350
300
250
U.S
. E
nvi
ron
me
nta
lP
rote
ctio
n A
ge
ncy
Se
con
da
ry M
axi
mu
mC
on
tam
ina
nt
Le
vel
for
dis
solv
ed
so
lids
U.S. EnvironmentalProtection Agency
Secondary MaximumContaminant Level for sulfate
p-value-value less than
less than 0.0010.001
200
150
100
50
0200 300 400 500 600 700 800 900100
p -val
uele
ssth
an0.
001
Figure 13. Concentrations of sulfate and calcium in wells as a function of concentrations of dissolved solids, Upper Santa Cruz Basin, Arizona, 1998.
Ground-Water Quality 23

Land Use
For ground-water quality to be affected by land use, the ground water must have received recharge from the land surface after that land use was established. To determine if wells received recharge from specific areas of existing or previous land uses, well depths, water levels, well locations, and tritium concentrations were analyzed (tables 10 and 11 in the section entitled “Basic Data” at the back of the report).
Tritium, a radioactive isotope, can be used to estimate time of recharge and distinguish younger ground water from older ground water. Large quantities of tritium were released to the atmosphere during thermonuclear-weapons testing from 1952 until the late 1960s. Atmospheric tritium is incorporated into water molecules that form precipitation and recharge ground water. The amount of tritium in ground water at a given time is controlled by the amount of tritium in the atmosphere when recharge occurs and by the radioactive-decay rate of tritium. Ground water that does not contain detectable tritium can be assumed to have been recharged before 1953, and ground water that does contain detectable tritium can be assumed to have some component of ground water that was recharged after 1953 (fig. 14).
For this study, a well in which ground water had less than 2.5 pCi/L (the MRL) of tritium was considered to yield water that had been recharged before 1953 (old recharge), and a well at which ground water had more than 2.5 pCi/L of tritium was considered to yield some component of ground water that was recharged after 1953 (recent recharge). The land-use type for the area surrounding the wells that contained recent recharge was then identified from figure 2; the wells that contained recent recharge were surrounded by areas in which the land use was urban, agricultural, or rangeland. Data from wells that contained old recharge were compared to data from wells that contained recent recharge from urban areas and to wells that contained recent recharge from agricultural areas. Agriculture, however, was practiced in the basin before 1953, and some of the wells defined as containing “old recharge” may contain some component of recharge from areas of historical agricultural activities. As previously described, wells that contained recent recharge from rangeland areas were not included in the analysis because of the small sample size.
The sample from well 25 had less than 2.5 pCi/L of tritium; however, this well is considered to be in an area that had received recent recharge because this well is only 24.4 m deep, has a water level of 9.6 m, and is adjacent to the Santa Cruz River, which is a major recharge source.
TR
ITIU
M C
ON
CE
NT
RA
TIO
N,
IN P
ICO
CU
RR
IES
PE
R L
ITE
R
1,500
0
1,000
500
1950 20001960 1970 1980 1990
Figure 14. Tritium in precipitation, decayed to 1998, Upper Santa Cruz Basin, Arizona. Data from Robert L. Michel (research chemist, U.S. Geological Survey, written commun., 2000).
24 Ground-Water Quality in the Upper Santa Cruz Basin, Arizona, 1998

Urban Activities.—Concentrations of nitrite plus nitrate (as nitrogen) were higher in ground water that contained recent recharge from urban areas than in ground water that contained old recharge (fig. 15). A significant difference was identified with the Kruskal-Wallis and the Tukey test statistics. Major nitrogen sources in the urban areas include fertilizers applied to lawns and effluent discharges from WWTPs. Additionally, many present-day urban areas were historically agricultural areas, some of which were irrigated with wastewater. Of the five ground-water samples that exceeded the USEPA MCL and State of Arizona aquifer water-quality standards for nitrite plus nitrate, two samples were from wells in urban areas (sites 45 and 28; fig. 2).
The ground-water sample from site 45, west of Green Valley at the base of the Sierrita Mountains, exceeded the USEPA SMCL for dissolved solids (500 mg/L) and the USEPA MCL and State of Arizona aquifer water-quality protection standard for nitrite plus nitrate (10 mg/L). Because this well did not have a detectable level of tritium, however, the ground water near the well probably had not received recent recharge from the land surface. High dissolved-solids and nitrate concentrations in this area have been previously identified by the Pima Associations of Governments (1983). This well is perforated in consolidated rock, and flow through fractures may be contributing some recharge. In addition, this well is near open-pit mines; therefore, the source of the high dissolved- solids concentration may be leachate from nearby mining activity (Pima Association of Governments, 1983). The amount of information available is insufficient to determine a source for the high nitrite plus nitrate concentration.
The ground-water sample from site 28, which is north of Nogales next to Nogales Wash, exceeded the USEPA MCL and State of Arizona aquifer water-quality standards for nitrite plus nitrate (10 mg/L) and the USEPA SMCLs for manganese (50 µg/L) and dissolved solids (500 mg/L). The ground-water sample from site 56, which also is next to Nogales Wash, exceeded the USEPA SMCL for dissolved solids (500 mg/L) and had a nitrite plus nitrate concentration higher than the 75th percentile value for the nitrite plus nitrate data (5 mg/L; table 4). High nitrogen
concentrations in the Nogales Wash area have been identified by the ADEQ (Arizona Department of Environmental Quality, 1996). High manganese and dissolved-solids concentrations, however, have not been previously identified in this area. The sources of the high concentrations of nitrite plus nitrate, dissolved-solids, and manganese probably are uncontrolled releases of untreated wastewater to the Nogales Wash south of the international boundary.
Agricultural Activities.—Nitrite plus nitrate, calcium, and potassium concentrations were higher in ground water that contained recent recharge from present agricultural areas than in ground water that contained old recharge (fig. 15). Calcium and potassium concentrations also were higher in ground water that contained recent recharge from present agricultural areas than in ground water that contained recent recharge from urban areas. Significant differences were identified with the Kruskal-Wallis and the Tukey test statistics. The major sources of nitrogen and potassium in agricultural areas are fertilizers applied to irrigated fields. The major source of calcium in agricultural areas is the dissolution of calcite concentrated by evaporation during irrigation of agricultural areas. This irrigation water then recharges the ground water. Of the five ground-water samples that exceeded the USEPA MCL and State of Arizona aquifer water-quality standards for nitrite plus nitrate, three samples were from wells in present agricultural areas (sites 12, 16, and 42; fig. 2). Laney (1972) suggested that high nitrate concentrations along the Santa Cruz River also may result from the decomposition of organic matter in former marshes.
Alkalinity and dissolved-solids concentrations were higher in ground water that contained recent recharge from present agricultural areas than in ground water that contained recent recharge from urban areas (fig. 15). Significant differences in concentrations were identified with the Kruskal-Wallis and the Tukey test statistics. The major sources of alkalinity and dissolved solids in agricultural areas are the dissolution of salts and calcite concentrated by evaporation during irrigation of agricultural areas. This irrigation water then recharges the ground water.
Ground-Water Quality 25

NIT
RIT
E +
NIT
RA
TE
CO
NC
EN
TR
AT
ION
,IN
MIL
LIG
RA
MS
PE
R L
ITE
R22 180
Old
RECHARGE TYPE
20
18
16
14
12
10
8
6
4
2
0Agriculture
0
160
140
120
100
80
60
40
20
0
CA
LCIU
M C
ON
CE
NT
RA
TIO
N,
IN M
ILLI
GR
AM
S P
ER
LIT
ER
p-value = 0.016
Urban
PO
TA
SS
IUM
CO
NC
EN
TR
AT
ION
,IN
MIL
LIG
RA
MS
PE
R L
ITE
R
5
4
3
2
1
0
(25) (14) (13)
Old AgricultureUrban
(25) (14) (13)
Old AgricultureUrban
(25) (14) (13)
Old AgricultureUrban
(25) (14) (13)
Old AgricultureUrban
(25) (14) (13)
p-value = 0.009
p-value = 0.016 p-value = 0.018
p-value = 0.037 p-value = 0.005
RECHARGE TYPE
p-value = 0.001
p-value = 0.007
400
100
0
200
300
ALK
ALI
NIT
Y C
ON
CE
NT
RA
TIO
N,
IN M
ILLI
GR
AM
S P
ER
LIT
ER
DIS
SO
LVE
D-S
OLI
DS
CO
NC
EN
TR
AT
ION
,IN
MIL
LIG
RA
MS
PE
R L
ITE
R
1,000
800
600
400
200
NOTE: Only di f ferences signi-f i c a n t a t t h e α = 0.0 5 test level are graphed.
EXPLANATION
90TH PERCENTILE
75TH PERCENTILE
25TH PERCENTILE
10TH PERCENTILE
MEDIAN
NUMBER OF OBSERVATIONS
PERCENTILE—Percentage of analyses equal to or less than the indicated values
OUTSIDE VALUE—Data values outside the 10TH
and 90TH percentiles
(25)
Figure 15. Concentrations of nitrite plus nitrate, calcium, potassium, alkalinity, and dissolved solids in wells relative to recharge type, Upper Santa Cruz Basin, Arizona, 1998.
26 Ground-Water Quality in the Upper Santa Cruz Basin, Arizona, 1998
The arsenic concentration at site 8 that exceeded the current USEPA MCL (50 µg/L; fig. 2) could be related to human activities rather than natural factors. The tritium value for site 8 indicates that the well contained some component of ground water that was recharged from 1954 to 78 (table 10 in the section entitled “Basic Data” at the back of the report; fig. 14). The ground-water sample also contained several anthropogenic compounds including pesticides (Tadayon and others, 1999). Presently (1998), site 8 is in an area of urban land use, but historically, agriculture was predominant in this area (Water Resources Research Center, 1999), and contamination of the local aquifer from historical agricultural drainage is possible. Various arsenic compounds were used as pesticides in this area (Pima Association of Governments, 1989); however, analysis of arsenical pesticides was outside the scope of this study. Although the use of most arsenical pesticides has been discontinued in the United States (Reigart and Roberts, 1999), the arsenic compounds may still be present in the ground water near areas in which arsenical pesticides were used. Arsenic concentrations in wells less than 1 km from site 8 are about an order of magnitude lower than the arsenic concentration at site 8 (U.S. Geological Survey National Water-Information System; Bryn Enright, hydrologist, City of Tucson, oral commun., 1999; Nancy Peterson, Environmental Project Coordinator, City of Tucson, oral commun., 1999). The high arsenic concentration in the sample from site 8 probably is indicative of a localized condition.
Historical Conditions
Historical ground-water quality data available in the USGS water-quality data base—the National Water-Information System (NWIS)—for the Upper Santa Cruz Basin were used to determine changes in the ground-water quality of the basin over time. Six wells in the basin that were not sampled as part of this study were sampled annually by the USGS from 1985 or 1988 to 1998. Data for general properties and major-ion and nutrient constituents were compiled from the historical analyses in the NWIS for these six wells. Trace-element data were available for fluoride, iron,
manganese, and zinc. All constituent concentrations in samples collected from the six wells were below the USEPA MCLs and SMCLs.
The six wells used for the historical analysis are distributed over the entire basin (fig. 16). Data were not available to directly determine if these wells have received recent recharge from the land surface, but all six wells are near the Santa Cruz River and its tributaries—major recharge sources— and (or) are near one or more of the 58 wells sampled for this study that are perforated at similar depths and contained recent recharge (table 6). During the period of historical record for the six wells, the area of urban land use in the basin has increased (fig. 16). Data for the urban area shown in figure 16 in the Nogales area was not updated from 1974–83 to 1990, but the city of Nogales did increase in size during this time. Analysis of the ground-water quality of the six wells during the period of historical record may indicate the long-term effects of agricultural and urban land uses and the effects of changes in land use. Rates of recharge to ground water near these wells, however, are unknown, and the ground-water quality may not yet be affected by the changes in land use shown in figure 16.
For the period of historical record, land use around sites D and E has been agricultural, and land use around site C has been urban (fig. 16). Concentrations of nitrite plus nitrate and dissolved solids at site D significantly increased from 1985 to 1998; however, concentrations did not significantly increase or decrease at site E from 1988 to 1998 (fig. 17). At site D in Sahuarita, agriculture has been the dominant land use since the 1930s (Pima Association of Governments, 1985). Concentrations of nitrite plus nitrate and dissolved solids were higher at site D than at the other five sites for the period of historical record, and agricultural areas probably are affecting the ground-water quality. Although the well depth and the water level are much more shallow at site E than at site D (table 6), agriculture has not been practiced for as long at site E as at site D, and the ground-water quality at site E does not seem to have been affected by the land use during the period of historical record.
Ground-Water Quality 27

Base from U.S. Geological Surveydigital data, 1:100,000, 1972Albers Equal-Area Conic projectionStandard parallels 29°30', 45°30',central meridian 111°30'
0 10 10 KILOMETERS
0 10 MILES
Rangeland
LAND USE AND LAND COVER
WELL WITH SITE IDENTIFIER—Well used for the historical-data analysis (see table 6)
Forest
Urban
Agricultural
Transitional
Wetland
EXPLANATION
UNITED STATES
MEXICO
110°37'30"
111°07'30"
32°
31°37'30"
32°22'30"
Marana
TUCSON
Vail
Nogales
Tubac
Green Valley
San
t aC
ruz
ive r
R
SouthTucson
Sahuarita
OroValley
B. Urban 1990
UNITED STATES
MEXICO
110°37'30"
111°07'30"
32°
31°37'30"
32°22'30"
Marana
TUCSON
Vail
Nogales
Tubac
Green Valley
San
t aC
ruz
ive r
R
SouthTucson
Sahuarita
OroValley
A. Urban 1974–83
D
E E
E
F
C
AB
D
F
C
AB
Figure 16. Locations of wells used for historical-data analysis, Upper Santa Cruz Basin, Arizona. A, Urban, 1974–83. B, Urban, 1990. Nogales urban land-use data not updated between 1974–83 and 1990; digital data modified from Anderson and others (1976); urban digital data for 1974–83 land use is from Geographic Information Retrieval and Analysis System (GIRAS); urban digital data for 1990 land use is unpublished data from Pima county and the University of Arizona.
28 Ground-Water Quality in the Upper Santa Cruz Basin, Arizona, 1998

Table 6. Site information and well-construction data for wells used for historical analysis, Upper Santa Cruz Basin, Arizona
[mbls, meters below land surface; km, kilometer; --, no data]
Siteidentifier
(see figure 16)
Well-identification number
Well depth (mbls)
Open interval (mbls)
Date of most recent water-level
measurement
Most recent water- level depth (mbls)
Closest site (see
table 11)
Approximate distance to closest site
(km)
Recent recharge at
closest site1From To
A (D-11-14)32ccc 159.1 48.8 159.1 12–03–87 37.3 31 5 Yes
B (D-12-12)16ddd 71.3 20.7 68.6 12–13–89 34.5 34 3 No
C (D-14-14)02bbb 76.5 45.7 76.5 12–07–87 69.2 7 2 Yes
D (D-17-14)07ddd 457.2 45.7 457.2 09–06–90 99.1 16 3 Yes
E(D-23-13)34add
unsurv61.0 9.1 61.0
12–28–813.6 56 5
Yes
F (D-24-14)05adb2 167.6 -- -- 02–22–82 7.5 28 4 Yes
1Data from table 11.
Site E is downgradient from effluent releases to the Santa Cruz River from the Nogales International WWTP; however, not enough data are available to determine the long- term effects of effluent recharge on the ground- water quality in this area. Concentrations of nitrite plus nitrate and dissolved solids significantly decreased at the well surrounded by urban land use in Tucson (site C) from 1985 to 1998 (fig. 17). The decrease could be indicative of a decrease in recharge from agricultural areas as historical (pre-1974) agricultural land in this area was retired for urban development.
During the period of historical analysis, land use around sites A and F changed from rangeland to urban, and land use around site B changed from agricultural to urban (fig. 16). At site A, concentrations of nitrite plus nitrate significantly increased, and concentrations of dissolved solids did not significantly increase or decrease from 1988 to 1998; however, at site F,
concentrations did not significantly increase or decrease from 1985 to 1998 (fig. 17). A possible source of nitrogen to ground water at site A is fertilizers applied to lawns. Although the depth to water at site F is much less than it is at site A (table 6), urban development at site F in Nogales has not been as rapid as it has at site A in Oro Valley, and on the basis of inorganic chemical analyses, the ground-water quality at site F was not affected by the land use during the period of historical record. Concentrations of nitrite plus nitrate and dissolved solids did not increase or decrease from 1985 to 1998 at the well in Marana where the land use changed from agricultural to urban (site B; fig. 17). Site B is downgradient from effluent releases to the Santa Cruz River from the Roger Road and Ina Road WWTPs; however, not enough data are available to determine the effects of effluent recharge on the ground-water quality in this area.
Ground-Water Quality 29

Site D
0
Site E Site F
100
200
300
400
500
600
Site A
0
2
4
6
8
10
12
1985
1987
1989
1991
1993
1995
1997
1985
1987
1989
1991
1993
1995
1997
1985
1987
1989
1991
1993
1995
1997
1985
1987
1989
1991
1993
1995
1997
1985
1987
1989
1991
1993
1995
1997
1985
1987
1989
1991
1993
1995
1997
NIT
RIT
E P
LUS
NIT
RAT
E C
ON
CE
NT
RAT
ION
,IN
MIL
LIG
RA
MS
PE
R L
ITE
R
EXPLANATION
CONCENTRATION SIGNIFICANTLY INCREASES
CONCENTRATION SIGNIFICANTLY DECREASES
NO ARROW INDICATES DATA NEITHER SIGNIFI- CANTLY INCREASES NOR DECREASES
MOVING AVERAGE
Site B Site C
Site D
0
2
4
6
8
10
12Site E Site F
DIS
SO
LVE
D-S
OLI
DS
CO
NC
EN
TR
ATIO
N,
IN M
ILLI
GR
AM
S P
ER
LIT
ER
Site A
0
Site B Site C
100
200
300
400
500
600
1985
1987
1989
1991
1993
1995
1997
1985
1987
1989
1991
1993
1995
1997
1985
1987
1989
1991
1993
1995
1997
1985
1987
1989
1991
1993
1995
1997
1985
1987
1989
1991
1993
1995
1997
1985
1987
1989
1991
1993
1995
1997
1998
1998
1998
1998
1998
1998
1998
1998
1998
1998
1998
1998
A. Nitrite plus nitrate
B. Dissolved solids
NOTE: On ly cor re la t ions s ign i f i can t a t the α = 0.10 tes t leve l are noted.
p-value = 0.070
p-value = 0.030
p-value = 0.040 p -value = 0.050
p-value = 0.050
Figure 17. Concentrations of nitrite plus nitrate and dissolved solids in wells as a function of time, Upper Santa Cruz Basin, Arizona 1985–98. A, Nitrite plus nitrate. B, Dissolved solids.
30 Ground-Water Quality in the Upper Santa Cruz Basin, Arizona, 1998

SUMMARY AND CONCLUSIONS
Ground-water quality of the Upper Santa Cruz Basin was assessed in 1998 by the USGS and the ADEQ. The study included analyzing ground-water quality data collected by the two agencies from 58 wells and analyzing pre-existing ground-water quality data for 6 wells to: (1) characterize present (1998) conditions; (2) analyze natural controls on ground-water quality; and (3) analyze the effects of human activities on ground-water quality. Individual and combined quality-control data collected by the USGS and the ADEQ confirmed the validity of combining the ground-water quality data collected by the two agencies.
Twenty-nine percent of the ground-water samples collected had concentrations of at least one constituent that exceeded a Federal or State water-quality standard. The USEPA MCLs and State of Arizona aquifer water-quality standards were exceeded in 1 sample for arsenic, 1 sample for fluoride, and 5 samples for nitrite plus nitrate; the USEPA SMCLs were exceeded in 1 sample for fluoride, 1 sample for iron, 1 sample for manganese, 2 samples for pH, 2 samples for sulfate, and 14 samples for dissolved solids. In addition, at least 10 samples had arsenic concentrations that exceed a proposed lower arsenic MCL; additional samples may also have concentrations that exceed the proposed MCL—the ADEQ MRL for arsenic was higher than the proposed MCL.
Ground-water quality in the Upper Santa Cruz Basin is affected by natural factors and human activities. The natural factors that have the most effect on ground-water quality in the basin are depth in the aquifer and distance from major faults. Ground-water quality was not significantly different among the various basin-fill units; between parts of the basin fill that differ in thickness, lateral extent, and composition north and south of an inferred fault; or among areas that differ in distance from stream alluvium. Ground-water temperatures and pH significantly increased in relation to the depth of the well from which the sample was collected. Concentrations of dissolved solids, alkalinity, calcium, potassium, chloride, and sulfate were significantly higher in samples collected from wells less than 2 km from major faults than in samples
collected from wells more than 2 km from major faults. Laney (1972) attributed this difference to upward migration through faults of ground water from gypsiferous mudstones. Fluoride concentrations above the USEPA MCL are attributed to fluoride-bearing volcanic rocks in the Tucson Mountains, which probably are the source of local basin-fill deposits; pH-dependent ion exchange on clay minerals contributes to the high concentrations of fluoride in this area.
Human activities were found to have an effect on ground-water quality in the Upper Santa Cruz Basin. Ground water that contained recent recharge from urban areas had significantly higher concentrations of nitrite plus nitrate than ground water that did not contain recent recharge from the land surface. Major sources of nitrogen in urban areas are fertilizers and discharges from WWTPs. A sample from one well in an area that contained recent recharge from an urban area had concentrations of nitrite plus nitrate above the USEPA MCL. Water quality at the well probably is affected by uncontrolled wastewater releases to the Nogales Wash south of the international boundary. Ground water that contained recent recharge from present agricultural areas had significantly higher concentrations of nitrite plus nitrate, calcium, and potassium than ground water that did not contain recent recharge from the land surface. The major source of nitrogen and potassium in agricultural areas is fertilizers, and the major source of calcium in agricultural areas is the dissolution of calcite concentrated by evaporation during irrigation of agricultural areas. This irrigation water then recharges the ground water. Samples from three wells in areas that contained recent recharge from agricultural areas had concentrations of nitrite plus nitrate above the USEPA MCL. Ground water that contained recent recharge from agricultural areas also had higher concentrations of calcium, potassium, alkalinity, and dissolved solids than ground water that contained recent recharge from urban areas. The major source of these constituents in agricultural areas is the dissolution of salts and calcite concentrated by evaporation during irrigation of agricultural areas. This irrigation water then recharges the ground water. One well had an arsenic concentration above the current USEPA MCL, and water quality at this well probably is affected by pesticides that were in historical agricultural return flows.
Summary and Conclusions 31
Human activities also had an effect on ground-water quality from the 1980s to 1998 in the Upper Santa Cruz Basin. Concentrations of nitrite plus nitrate and dissolved solids significantly increased at a well in an area of agricultural land use; historical and present agricultural areas probably have contributed to the ground-water quality at this site. Concentrations of nitrite plus nitrate significantly increased at a well where the land use has changed from rangeland to urban; an increase in the use of fertilizers on lawns may be affecting the ground-water quality at this site. Concentrations of nitrite plus nitrate and dissolved solids significantly decreased at a well in an urban area. The decrease in concentrations may be indicative of a decrease in recharge from agricultural areas as historical agricultural land was retired for urban development. Constituents did not significantly increase or decrease at another well in an agricultural area, at another well where the land use has changed from rangeland to urban, and at a well where the land use has changed from agricultural to urban. All of the constituent concentrations in samples used for the historical analyses were below USEPA MCLs and SMCLs.
REFERENCES CITED
Anderson, J.R., Hardy, E.E., Road, J.T., and Witmer, R.E., 1976, A land use and land cover classification system for use with remote sensor data: U.S. Geological Survey Professional Paper 964, 28 p.
Anderson, S.R., 1987, Cenozoic stratigraphy and geologic history of the Tucson Basin, Pima County, Arizona: U.S. Geological Survey Water-Resources Investigations Report 87–4190, 20 p.
———1988, Potential for aquifer compaction, land subsidence, and earth fissures in the Tucson Basin, Pima County, Arizona: U.S. Geological Survey Hydrologic-Investigations Atlas HA–713, 3 sheets.
Anderson, T.W., 1972, Electrical-analog analysis of the hydrologic system, Tucson Basin, southeastern Arizona: U.S. Geological Survey Water-Supply Paper 1939–C, 34 p.
Arizona Department of Economic Security, 1997, July 1, 1997, to July 1, 2050, Arizona subcounty population projections for counties, places, and reservations, August 1, 1997: Phoenix, Arizona Department of Economic Security, Population Statistics Unit, 14 p.
———1998, July 1, 1998, Population estimates for Arizona’s counties and incorporated places, December 14, 1998: Phoenix, Arizona Department of Economic Security, Population Statistics Unit,1 p.
Arizona Department of Environmental Quality, 1991, Quality assurance project plan: Phoenix, Arizona Department of Environmental Quality, Water Quality Standards Unit, 209 p.
———1995, Arizona laws relating to environmental quality: Charlottesville, Virginia, Michie Company, 200 p.
———1996, Phase III groundwater investigation— Nogales Wash study area: Tucson, Arizona Depart- ment of Environmental Quality, Remedial Projects Section, 29 p.
Bevans, H.E., Lico, M.S., and Lawrence, S.J., 1998, Water quality in the Las Vegas Valley area and the Carson and Truckee River Basins, Nevada and California, 1992–96: U.S. Geological Survey Circular 1170, 47 p.
CH2M Hill, 1988, Tucson recharge feasibility assessment, Task 5, Hydrogeological evaluations for recharge sites: CH2M Hill, prepared in associa- tion with Errol L. Montgomery & Associates, Inc., and L.G. Wilson, v. 1, 102 p.
Coates, D.R., and Halpenny, L.C., 1954, Ground-water field trip, Tucson to Nogales, Arizona—Prepared as part of the 6th Ground Water Short Course, University of Arizona, April 12–24, 1954: U.S. Geological Survey unnumbered open-file report, 20 p.
Coes, A.L., Gellenbeck, D.J., and Towne, D.C., 1999, Ground-water quality in the Sierra Vista subbasin, 1996–97: U.S. Geological Survey Water-Resources Investigations Report 98–4056, 50 p.
Cohen, A.C., 1959, Simplified estimators for the normal distribution when samples are singly censored or truncated: Technometrics, v. 1, no. 3, p. 217–237.
Condes de la Torre, A., 1970, Streamflow in the upper Santa Cruz River Basin, Santa Cruz and Pima Counties, Arizona: U.S. Geological Survey Water-Supply Paper 1939–A, 26 p.
Davidson, E.S., 1973, Geohydrology and water resour- ces of the Tucson Basin, Arizona: U.S. Geological Survey Water-Supply Paper 1939–E, 81 p.
Dubrovsky, N.M., Kratzer, C.R., Brown, L.R., Gronberg, J.M., and Burow, K.R., 1998, Water quality in the San Joaquin-Tulare Basins, California, 1992–95: U.S. Geological Survey Circular 1159, 38 p.
Evans, D.W., and Pool, D.R., 2000, Aquifer compaction and ground-water levels in south-central Arizona: U.S. Geological Survey Water-Resources Investigations Report 99–4249, 54 p.
32 Ground-Water Quality in the Upper Santa Cruz Basin, Arizona, 1998

Farrar, J.W., and Long, H.K., 1997, Report of the U.S. Geological Survey’s evaluation program for standard reference samples distributed in September 1996—T-143 (trace constituents), T-145 (trace constituents), M-140 (major constituents), N-51 (nutrients), N-52 (nutrients), P-27 (low ionic strength), and Hg-23 (mercury): U.S. Geological Survey Open-File Report 97–20, 145 p.
Gellenbeck, D.J., and Coes, A.L., 1999, Ground-water quality in alluvial basins that have minimal urban development, south-central Arizona: U.S. Geological Survey Water-Resources Investigations Report 99–4005, 27 p.
Gilliom, R.J., Alley, W.M., and Gurtz, M.E., 1995, Design of the National Water-Quality Assessment program—Occurrence and distribution of water- quality conditions: U.S. Geological Survey Circular 1112, 33 p.
Graham, D.D., and Monical, J.E., 1997, Contamination of ground water at the Tucson International Airport Area Superfund Site, Tucson, Arizona—Overview of hydrogeologic considerations, conditions as of 1995, and cleanup efforts: U.S. Geological Survey Water-Resources Investigations Report 97–4200, 51 p.
Halpenny, L.C., 1963, Geophysical and geohydrological investigations of Santa Cruz River Valley, Arizona, international boundary to mouth of Sonoita Creek: Tucson, Arizona, Water Development Corporation, 57 p.
Halpenny, L.C., and Halpenny, P.C., 1988, Review of the hydrogeology of the Santa Cruz Basin in the vicinity of the Santa Cruz-Pima County line: Tucson, Arizona, Water Development Corporation, 59 p.
Hanson, R.T., and Benedict, J.F., 1994, Simulation of ground-water flow and potential land subsidence, Upper Santa Cruz Basin, Arizona: U.S. Geological Survey Water-Resources Investigations Report 93–4196, 47 p.
Helsel, D.R., and Hirsch, R.M., 1992, Statistical methods in water resources: New York, Elsevier, 529 p.
Hitt, K.J., 1994, Refining 1970’s land-use data with 1990 population data to indicate new residential development: U.S. Geological Survey Water-Resources Investigations Report 94–4250, 15 p.
International Boundary and Water Commission, 1998, Binational Nogales Wash United States/Mexico groundwater monitoring program—Interim Report, May 1998: El Paso, Texas, International Boundary and Water Commission, 68 p.
Koterba, M.T., Wilde, F.D., and Lapham, W.W., 1995, Ground-water data-collection protocols and procedures for the National Water-Quality Assessment program—Collection and documentation of water-quality samples and related data: U.S. Geological Survey Open-File Report 95–399, 113 p.
Laney, R.L., 1972, Chemical quality of the water in the Tucson Basin, Arizona: U.S. Geological Survey Water-Supply Paper 1939–D, 46 p.
Martin, Peter, 1980, Evaluation of ground-water quality in the Cortaro area, Arizona: Tucson, University of Arizona, masters thesis, 99 p.
Murphy, B.A., and Hedley, J.D., 1984, Maps showing groundwater conditions in the Upper Santa Cruz Basin area, Pima, Santa Cruz, Pinal, and Cochise Counties, Arizona, 1982: Phoenix, Arizona Department of Water Resources Hydrologic Map Series Report Number 11, 3 sheets.
Oppenheimer, J.M., and Sumner, J.S., 1980, Depth-to- bedrock map of southern Arizona: Tucson, Univer- sity of Arizona, Department of Geosciences, Laboratory of Geophysics, 1 sheet.
Pierce, H.W., 1974, Thick evaporite deposits in the Basin and Range Province—Arizona, in Fourth Symposium on Salt: Cleveland, Northern Ohio Geological Society, p. 47–55.
Pima Association of Governments, 1983, Region wide groundwater quality in the Upper Santa Cruz Basin Mines Task Force Area—Report and detailed recommendations: Tucson, Arizona, Pima Association of Governments, v.p.
———1985, Green Valley-Cortaro area groundwater quality management plans—Final report: Tucson, Arizona, Pima Association of Governments, v.p.
———1989, Metropolitan Tucson Basin water quality and pollution source assessment: Tucson, Arizona, Pima Association of Governments, v.p.
Pritt, J.W., and Raese, J.W., 1995, Quality assurance/quality control manual: U.S. Geological Survey Open File Report 95–443, 35 p.
Reigart, J.R., and Roberts, J.R., 1999, Arsenical pesticides, chap. 14, in Recognition and management of pesticide poisonings (5th ed.): U.S. Environmental Protection Agency, Report No. EPA–735–R–98– 003, p. 126–136.
Reynolds, S.J., 1988, Geologic map of Arizona: Arizona Geological Survey Map 26, scale 1:1,000,000.
Robertson, F.N., 1991, Geochemistry of ground water in alluvial basins of Arizona and adjacent parts of Nevada, New Mexico, and California: U.S. Geological Survey Professional Paper 1406–C, 90 p.
References Cited 33

Scott, J.C., 1990, Computerized stratified random site-
selection approaches for design of a ground-water
quality sampling network: U.S. Geological Survey
Water-Resources Investigations Report 90–4101, 109 p.
Schmidt, Kenneth D., and Associates, 1988, Hydrogeologic
conditions in the vicinity and downstream of the
Nogales International Wastewater Treatment Plant:
Tucson, Arizona, Kenneth D. Schmidt and Associates,
76 p.
Simons, F., 1974, Geologic map and sections of the Nogales
and Lochiel quadrangles, Santa Cruz County, Arizona:
U.S. Geological Survey Miscellaneous-Investigations
Series Map I–762, 1 sheet.
SSPS Inc., 1997, SYSTAT 7.0—Statistics: Chicago, Illinois,
SSPS Inc., 751 p.
State of Arizona, 1996, Water-quality standards: Phoenix,
State of Arizona, Administrative Code, Title 18,
Chapter 11, p. 1–60.
Tadayon, S., Duet, N.R., Fisk, G.G., McCormack, H.F.,
Partin, C.K., Pope, G.L., and Rigas, P.D., 1999, Water
resources data, Arizona, water year 1998: U.S.
Geological Survey Water-Data Report AZ–98–1, 454 p.
Tucson Water, 1998, Annual static water level basic data
report—Tucson Basin and Avra Valley, Pima County,
Arizona, 1996: Tucson, Arizona, City of Tucson,
Tucson Water, Planning and Engineering Division,
151 p.
U.S. Department of Commerce, 1998a, Climatological data, annual summary, Arizona, 1998: Ashville, North Carolina, U.S. Department of Commerce, National Oceanic and Atmospheric Administration, v. 102, no. 13, 28 p.
———1998b, Local climatological data, annual summary with comparative data, Tucson, Arizona, 1998: Ashville, North Carolina, U.S. Department of Commerce, National Oceanic and Atmospheric Administration, 7 p.
U.S. Environmental Protection Agency, 1996, Drinking water regulations and health advisories: U.S. Environmental Protection Agency Report No. EPA–822–B–96–002, October 1996, 10 p.
———2000, Proposed revision to arsenic drinking water standard: U.S. Environmental Protection Agency Report No. EPA 815–F–00–012, accessed June 27, 2000, at URL: http://www.epa.gov/ safewater/ars/ proposalfs.html.
Water Resources Research Center, 1995, Field manual for water-quality sampling: Tucson, University of Arizona, College of Agriculture, Water-Resources Research Center, 51 p.
———1999, Water in the Tucson area—Seeking sustain- ability: Tucson, University of Arizona, College of Agriculture, Water Resources Research Center, 155 p.
Wentz, D.A., Bonn, B.A., Carpenter, K.D., Hinkle, S.R., Janet, M.L., Rinella, F.A., Uhrich, M.A., Waite, I.R., Laenen, A., and Bencala, K.E., 1998, Water quality in the Willamette Basin, Oregon, 1991–95: U.S. Geological Survey Circular 1161, 34 p.
34 Ground-Water Quality in the Upper Santa Cruz Basin, Arizona, 1998

BASIC DATATables 7–11

Table 7. Water-quality data for field-blank samples, Upper Santa Cruz Basin, Arizona, 1998
[Site numbers correspond with sites shown in figures 2 and 8 and table 11. Constituents are dissolved and are reported in milligrams per liter unless otherwise noted. °C, degrees Celsius; µS/cm, microsiemens per centimeter at 25°C; µg/L, micrograms per liter; <, less than]
Propertyor constituent
U.S. Geological Survey Arizona Department of Environmental Quality
Site numbers Site numbers
11 21 28 12 35 41 43 45 57
General properties
Specific conductance (µS/cm)
2.0 2.0 2.0 1.5 0.9 2.3 1.1 1.2 2.2
Alkalinity 1.7 1.3 2.1 <2.0 <2.0 <2.0 <2.0 <2.0 <2.0
Dissolved solids <10 <10 <10 <10 <10 <10 <10 <10 20
Major ions
Calcium <.02 <.02 .1 <5.0 <5.0 <5.0 <5.0 <5.0 <5.0
Magnesium <.01 <.01 .005 <1.0 <1.0 <1.0 <1.0 <1.0 <1.0
Sodium <.2 <.2 <.2 <5.0 <5.0 <5.0 <5.0 <5.0 <5.0
Potassium <.1 <.1 <.1 <.5 <.5 <.5 <.5 <.5 <.5
Chloride <.1 <.1 <.1 1.7 <1.0 <1.0 <1.0 <1.0 3.3
Sulfate <.1 <.1 <.1 <10 <10 <10 <10 <10 <10
Nutrients
Nitrite plus nitrate <.05 <.05 <.05 <.02 <.02 <.02 <.02 <.02 <.02
Ammonia .048 .034 .037 <.020 <.020 <.020 <.020 <.020 <.020
Phosphorus <.010 <.010 .010 <.020 <.020 <.020 <.020 <.020 <.020
Trace elements
Aluminum (µg/L) 4.8 4.1 4.1 <500 <500 <500 <500 <500 <500
Antimony (µg/L) <1.0 <1.0 <1.0 <5.0 <5.0 <5.0 <5.0 <5.0 <5.0
Arsenic (µg/L) <1 <1 <1 <10 <10 <10 <10 <10 <10
Barium (µg/L) <1.0 <1.0 <1.0 <100 <100 <100 <100 <100 <100
Beryllium (µg/L) <1.0 <1.0 <1.0 <.5 <.5 <.5 <.5 <.5 <.5
Cadmium (µg/L) <1.0 <1.0 <1.0 <1.0 <1.0 <1.0 <1.0 <1.0 <1.0
Chromium (µg/L) <1.0 .3 <1.0 <10 <10 <10 <10 <10 <10
Copper (µg/L) <1.0 .2 <1.0 <10 <10 <10 <10 <10 <10
Fluoride <.10 <.10 <.10 <.20 <.20 <.20 <.20 <.20 <.20
Iron (µg/L) <10 <10 <10 <100 <100 <100 <100 <100 <100
Lead (µg/L) <1.0 <1.0 <1.0 <5.0 <5.0 <5.0 <5.0 <5.0 <5.0
Manganese (µg/L) <1.0 <1.0 <1.0 <50 <50 <50 <50 <50 <50
Selenium (µg/L) <1 <1 <1 <5 <5 <5 <5 <5 <5
Silver (µg/L) <1.0 <1.0 <1.0 <1.0 <1.0 <1.0 <1.0 <1.0 <1.0
Zinc (µg/L) 6.8 1.1 1.7 <50 230 <50 <50 <50 <50
36 Ground-Water Quality in the Upper Santa Cruz Basin, Arizona, 1998
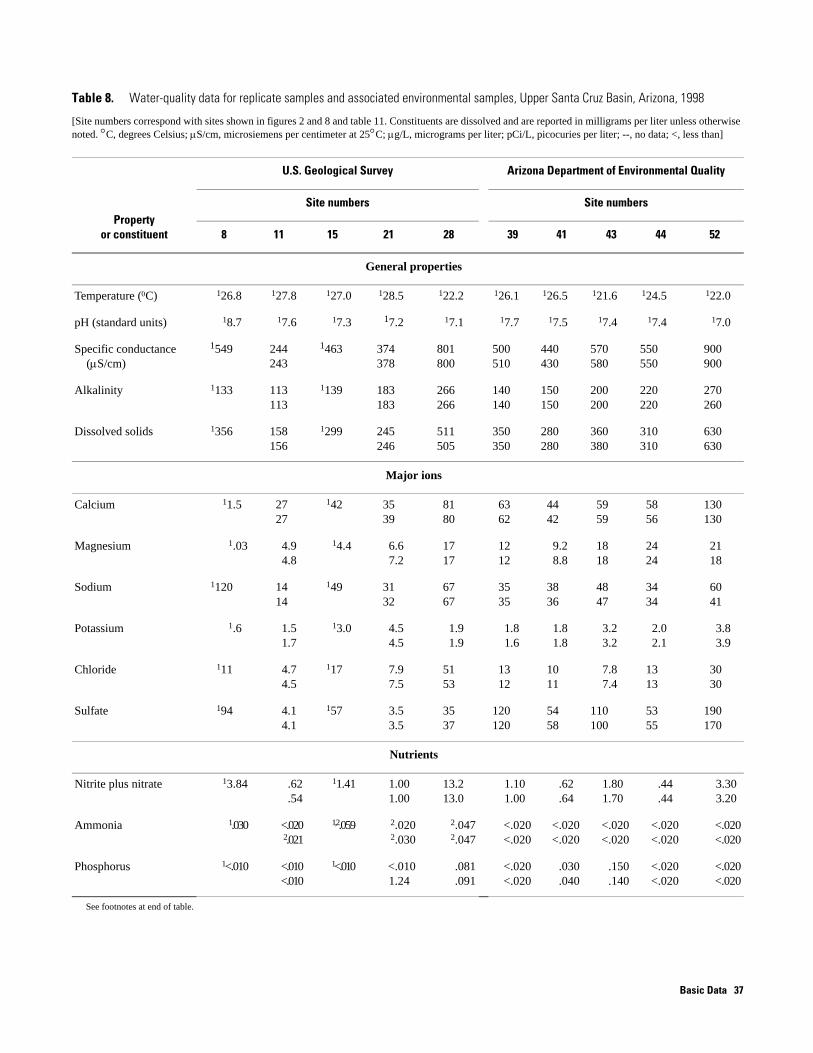
Table 8. Water-quality data for replicate samples and associated environmental samples, Upper Santa Cruz Basin, Arizona, 1998
[Site numbers correspond with sites shown in figures 2 and 8 and table 11. Constituents are dissolved and are reported in milligrams per liter unless otherwise noted. °C, degrees Celsius; µS/cm, microsiemens per centimeter at 25°C; µg/L, micrograms per liter; pCi/L, picocuries per liter; --, no data; <, less than]
Propertyor constituent
U.S. Geological Survey Arizona Department of Environmental Quality
Site numbers Site numbers
8 11 15 21 28 39 41 43 44 52
General properties
Temperature (0C) 126.8 127.8 127.0 128.5 122.2 126.1 126.5 121.6 124.5 122.0
pH (standard units) 18.7 17.6 17.3 17.2 17.1 17.7 17.5 17.4 17.4 17.0
Specific conductance(µS/cm)
1549 244243
1463 374378
801800
500510
440430
570580
550550
900900
Alkalinity 1133 113113
1139 183183
266266
140140
150150
200200
220220
270260
Dissolved solids 1356 158156
1299 245246
511505
350350
280280
360380
310310
630630
Major ions
Calcium 11.5 2727
142 3539
8180
6362
4442
5959
5856
130130
Magnesium 1.03 4.94.8
14.4 6.67.2
1717
1212
9.28.8
1818
2424
2118
Sodium 1120 1414
149 3132
6767
3535
3836
4847
3434
6041
Potassium 1.6 1.51.7
13.0 4.54.5
1.91.9
1.81.6
1.81.8
3.23.2
2.02.1
3.83.9
Chloride 111 4.74.5
117 7.97.5
5153
1312
1011
7.87.4
1313
3030
Sulfate 194 4.14.1
157 3.53.5
3537
120120
5458
110100
5355
190170
Nutrients
Nitrite plus nitrate 13.84 .62.54
11.41 1.001.00
13.213.0
1.101.00
.62
.641.801.70
.44
.443.303.20
Ammonia 1.030 <.0202.021
1,2.059 2.0202.030
2.0472.047
<.020<.020
<.020<.020
<.020<.020
<.020<.020
<.020<.020
Phosphorus 1<.010 <.010<.010
1<.010 <.0101.24
.081
.091<.020<.020
.030
.040.150.140
<.020<.020
<.020<.020
See footnotes at end of table.
Basic Data 37

Table 8. Water-quality data for replicate samples and associated environmental samples, Upper Santa Cruz Basin, Arizona, 1998—Continued
Propertyor constituent
U.S. Geological Survey Arizona Department of Environmental Quality
Site numbers Site numbers
8 11 15 21 28 39 41 43 44 52
Trace elements
Aluminum (µg/L) 18.1 24.624.7
23.823.9
26.226.5
24.124.1
<500<500
<500<500
<500<500
<500<500
<500<500
Antimony (µg/L) 1<1.0 <1.0<1.0
<1.0<1.0
<1.0<1.0
<1.0<1.0
<5.0<5.0
<5.0<5.0
<5.0<5.0
<5.0<5.0
<5.0<5.0
Arsenic (µg/L) 94100
44
77
66
22
<10<10
<10<10
<10<10
<10<10
<10<10
Barium (µg/L) 1<1.0 3738
2424
1414
102103
<100<100
<100<100
<100<100
<100<100
<100<100
Beryllium (µg/L) 1<1.0 <1.0<1.0
<1.0<1.0
<1.0<1.0
<1.0<1.0
<.5<.5
<.5<.5
<.5<.5
<.5<.5
<.5<.5
Cadmium (µg/L) 1<1.0 <1.0<1.0
<1.0<1.0
<1.0<1.0
<1.0<1.0
<1.0<1.0
<1.0<1.0
<1.0<1.0
<1.0<1.0
<1.0<1.0
Chromium (µg/L) 11.8 1.3<1.0
2.42.4
3.73.2
3.33.8
<10<10
<10<10
<10<10
<10<10
<10<10
Copper (µg/L) 1<1.0 <1.0<1.0
<1.0<1.0
<1.0<1.0
1.21.2
<10<10
<10<10
<10<10
<10<10
<10<10
Fluoride 12.50 .43.46
1.71 .41.46
.67
.66.22.22
.45
.47.65.78
1.801.80
.41
.40
Iron (µg/L) 1<10 <10<10
1<10 <10<10
1414
<100<100
<100<100
<100<100
<100<100
<100<100
Lead (µg/L) 1<1.0 <1.0<1.0
<1.0<1.0
<1.0<1.0
<1.0<1.0
<5.0<5.0
<5.05.3
<5.0<5.0
<5.0<5.0
<5.0<5.0
Manganese (µg/L) 11.7 <1.0<1.0
9.09.2
<1.0<1.0
400400
<50<50
<50<50
<50<50
<50<50
<50<50
Selenium (µg/L) 1<1 <1<1
<1<1
<1<1
11
<5<5
<5<5
<5<5
99
5<5
Silver (µg/L) 1<1.0 <1.0<1.0
<1.0<1.0
<1.0<1.0
<1.0<1.0
<1.0<1.0
<1.0<1.0
<1.0<1.0
<1.0<1.0
<1.0<1.0
Zinc (µg/L) 16.9 3740
110110
110110
3844
<50<50
440410
420420
<50<50
320310
Isotopes
Tritium, total (pCi/L) 159 <2.5<2.5
1<2.5 <2.5<2.5
1716
----
----
----
----
----
1Only one value is available.2Sample may have been contaminated during collection; actual value is less than or equal to value shown.
38 Ground-Water Quality in the Upper Santa Cruz Basin, Arizona, 1998

Table 9. Water-quality data for split samples, Upper Santa Cruz Basin, Arizona, 1998
[Field methods: Field method used by the collection agency. Collection agency: Agency that collected the split sample. ADEQ, Arizona Department of Environmental Quality; USGS, U.S. Geological Survey. Site numbers correspond with sites shown in figures 2 and 8 and listed in table 11. Constituents are dissolved and are reported in milligrams per liter unless otherwise noted. °C, degrees Celsius; µS/cm, microsiemens per centimeter at 25°C; µg/L, micrograms per liter; <, less than; --, no data]
Property or constituent
Site where split samples were collected
1 5 12
Field method ADEQ USGS ADEQ USGS USGS ADEQ USGS ADEQ USGS
Collection agency ADEQ USGS ADEQ USGS ADEQ USGS
General properties
Temperature (°C) 25.7 -- 25.9 -- 21.3 22.5 24.2 -- 24.0 --
pH (standard units) 7.3 -- 7.2 -- 7.8 7.3 6.9 -- 7.1 --
Specific conductance(µS/cm)
340 340 357 358 970 992 970 990 1,030 1,040
Alkalinity 160 160 162 162 240 236 270 260 271 275
Dissolved solids 210 220 229 229 600 620 690 680 718 740
Major ions
Calcium 45 46 44 46 81 79 140 150 150 150
Magnesium 5.2 5.1 4.9 5.1 15 15 21 22 21 21
Sodium 24 24 22 22 110 110 50 51 50 50
Potassium 2.4 2.5 2.4 2.3 3.4 3.1 4.1 4.0 3.9 3.9
Chloride 7.4 11 9.3 9.5 90 91 40 40 39 40
Sulfate <10 <10 4.8 4.8 120 120 180 200 180 190
Nutrients
Nitrite plus nitrate 2.20 2.10 2.05 2.06 4.30 4.88 12.0 13.0 12.0 12.2
Ammonia <.020 <.020 1.049 1.021 <.020 .033 <.020 <.020 1.024 1.027
Phosphorus <.020 <.020 <.010 <.010 <.020 .032 <.020 <.020 <.001 <.010
Property or constituent
Site where split samples were collected
14 20 25
Field method USGS ADEQ USGS ADEQ USGS ADEQ USGS ADEQ USGS
Collection agency ADEQ USGS ADEQ USGS ADEQ USGS
General properties
Temperature (°C) 25.8 24.6 23.5 -- 22.6 -- 27.0 -- 25.0 --
pH (standard units) 7.4 7.4 7.2 -- 6.9 -- 7.8 -- 7.4 --
Specific conductance(µS/cm)
950 895 740 740 764 765 240 240 257 257
Alkalinity 140 131 230 230 232 232 100 100 105 105
Dissolved solids 620 636 540 540 522 503 180 180 155 177
Major ions
Calcium 110 100 110 110 100 100 29 30 26 25
Magnesium 20 19 16 16 16 16 2.8 2.8 2.6 2.6
Sodium 60 57 38 39 39 38 22 23 23 22
Potassium 2.5 2.2 4.4 4.4 4.3 4.3 2.4 2.4 2.4 2.3
Chloride 25 23 23 22 20 20 7.9 7.6 6.1 6.2
Sulfate 300 290 120 130 120 120 11 11 11 11
Nutrients
Nitrite plus nitrate 2.00 2.15 5.30 5.20 5.24 5.51 .55 .53 .54 .56
Ammonia <.020 1.027 <.020 <.020 1.041 1.072 <.020 <.020 1.042 1.050
Phosphorus <.020 <.010 .030 .020 .041 <.010 <.020 <.020 <.010 <.010
See footnote at end of table.
Basic Data 39

Table 9. Water-quality data for split samples, Upper Santa Cruz Basin, Arizona, 1998—Continued
Propertyor
constituent
Site where split samples were collected
1 5 12
Field method ADEQ USGS ADEQ USGS USGS ADEQ USGS ADEQ USGS
Collection agency ADEQ USGS ADEQ USGS ADEQ USGS
Trace elements
Aluminum(µg/L) <500 <500 14.7 14.3 <500 14.6 <500 <500 13.9 14.3
Antimony (µg/L <5.0 <5.0 <1.0 <1.0 <5.0 <1.0 <5.0 <5.0 <1.0 <1.0
Arsenic (µg/L) <10 <10 3 3 <10 4 <10 <10 3 3
Barium (µg/L) <100 <100 23 22 <100 38 <100 <100 69 70
Beryllium (µg/L <.5 <.5 <1.0 <1.0 <.5 <1.0 <.5 <.5 <1.0 <1.0
Cadmium (µg/L <1.0 <1.0 <1.0 <1.0 <1.0 <1.0 <1.0 <1.0 <1.0 <1.0
Chromium (µg/L) <10 <10 2.8 2.6 <10 3.5 <10 <10 3.3 3.4
Copper (µg/L <10 <10 <1.0 <1.0 <10 <1.0 <10 <10 2.0 1.2
Fluoride <.20 <.20 .16 .18 1.19 1.29 .33 .33 .36 .36
Iron (µg/L) <100 <100 <10 <10 <100 <10 <100 <100 12 12
Lead (µg/L) <5.0 <5.0 <1.0 1.6 <5.0 <1.0 <5.0 <5.0 1.9 <1.0
Manganese (µg/L) <50 <50 <1.0 <1.0 <50 14 <50 <50 <1.0 1.0
Selenium (µg/L) <5 <5 <1 <1 <5 <1 <5 <5 2 2
Silver (µg/L) <1.0 <1.0 <1.0 <1.0 <1.0 <1.0 <1.0 <1.0 <1.0 <1.0
Zinc (µg/L) 60 100 60 81 140 110 <50 <50 32 34
Propertyor
constituent
Site where split samples were collected
14 20 25
Field method USGS ADEQ USGS ADEQ USGS ADEQ USGS ADEQ USGS
Collection agency ADEQ USGS ADEQ USGS ADEQ USGS
Trace elements
Aluminum (µg/L) <500 14.9 <500 <500 13.8 13.5 <500 <500 14.4 13.7
Antimony (µg/L) <5.0 <1.0 <5.0 <5.0 <1.0 <1.0 <5.0 <5.0 <1.0 <1.0
Arsenic (µg/L) <10 1 <10 <10 4 3 14 14 11 12
Barium (µg/L) <100 36 120 120 114 110 <100 <100 3.0 2.7
Beryllium (µg/L) <.5 <1.0 <.5 <.5 <1.0 <1.0 <.5 <.5 <1.0 <1.0
Cadmium (µg/L) <1.0 <1.0 <1.0 <1.0 <1.0 <1.0 <1.0 <1.0 <1.0 <1.0
Chromium (µg/L) <10 2.0 <10 <10 2.3 2.5 <10 <10 2.3 2.4
Copper (µg/L <10 <1.0 <10 10 1.0 <1.0 <10 <10 <1.0 <1.0
Fluoride .50 .54 .42 .36 .43 .42 .43 .43 .47 .45
Iron (µg/L) <100 27 <100 <100 14 <10 <100 110 79 110
Lead (µg/L <5.0 <1.0 <5.0 <5.0 <1.0 <1.0 <5.0 <5.0 <1.0 <1.0
Manganese (µg/L) <50 3.8 <50 <50 <1.0 <1.0 <50 <50 2.7 3.1
Selenium (µg/L) <5 <1 5 6 1 1 <5 <5 <1 <1
Silver (µg/L) <1.0 <1.0 <1.0 <1.0 <1.0 <1.0 <1.0 <1.0 <1.0 <1.0
Zinc (µg/L) <50 8.1 <50 <50 20 20 <50 <50 23.6 25.0
1Sample may have been contaminated during collection; actual value is less than or equal to value shown
40 Ground-Water Quality in the Upper Santa Cruz Basin, Arizona, 1998

Table 10. Ground-water quality data, Upper Santa Cruz Basin, Arizona, 1998
[Site numbers correspond with sites shown in figures 2 and 8 and in table 11. Constituents are dissolved and are reported in milligrams per liter unless otherwise noted. °C, degrees Celsius; µS/cm, microsiemens per centimeter at 25°C; NTU, nephelometric turbidity units; µg/L, micrograms per liter; pCi/L, picocuries per liter; --, no data; <, less than]
Site identifier
Well-identification number Sample date
Temperature, field (°C)
pH, field (standard
units)
Specific conductance, field (µS/cm)
Specific conductance, lab (µS/cm)
Alkalinity(as CaCO3)
Oxygen, field
Turbidity, field (NTU)
Solids, residue at
180°C
1 (D-10-14)06dca 05–12–98 25.9 7.2 353 358 162 4.7 0.0 229
2 (D-11-13)34add 05–28–98 27.6 7.2 389 378 170 4.9 1.0 236
3 (D-11-14)10dab2 04–29–98 17.0 7.6 279 285 105 6.6 4.0 186
4 (D-12-12)01cda 05–28–98 28.7 7.4 357 356 156 3.8 3.0 221
5 (D-13-13)18acb 04–02–98 22.5 7.3 973 992 236 .6 1.0 620
6 (D-13-13)18cbd 06–04–98 24.6 6.8 1,300 1,250 300 2.7 .0 890
7 (D-13-14)35aad3 04–30–98 19.9 7.0 308 308 96 3.9 4.0 210
8 (D-14-13)23aca 06–01–98 26.8 8.7 560 549 133 4.3 6.0 356
9 (D-15-14)02ddc 06–15–98 26.3 7.3 541 537 149 6.5 .0 356
10 (D-15-16)06aac 05–14–98 25.6 6.9 265 269 109 4.5 1.0 195
11 (D-15-16)34cba 05–13–98 27.8 7.6 240 244 113 4.2 .0 158
12 (D-16-14)06cdc2 05–11–98 24.0 7.1 1,080 1,040 275 4.4 1.0 740
13 (D-16-14)11bca 05–26–98 28.3 7.2 432 432 167 3.1 1.0 271
14 (D-16-16)04dab1 04–01–98 24.6 7.4 877 895 131 3.7 7.0 636
15 (D-17-13)11dcd2 06–16–98 27.0 7.3 462 463 139 4.9 2.0 299
16 (D-17-14)21bbb 05–27–98 23.5 6.9 902 859 225 4.7 .0 601
17 (D-17-15)09bbb 04–27–98 30.7 7.5 496 488 148 3.1 21 326
18 (D-17-15)23add 05–14–98 29.2 7.0 820 808 164 4.3 22 579
19 (D-18-16)01bcc 06–20–98 24.8 8.0 1,010 945 375 .4 22 601
20 (D-19-12)36cbb 06–17–98 22.6 6.9 780 765 232 -- 2.0 503
21 (D-19-13)07abc2 06–03–98 28.5 7.2 381 374 183 3.1 .0 245
22 (D-19-13)22cac 06–02–98 25.6 7.3 413 408 146 4.9 3.0 267
23 (D-19-13)22ddd 06–02–98 33.3 7.1 644 633 167 2.9 2.0 345
24 (D-21-13)19cdb 06–18–98 26.5 7.6 244 247 108 -- 2.0 172
25 (D-21-13)30cda 06–18–98 25.0 7.4 250 257 105 -- 4.0 177
26 (D-22-13)09c unsurv 07–08–98 20.4 6.9 662 642 233 1.3 1.0 422
27 (D-23-14)26cbd 07–06–98 18.0 7.0 452 451 144 8.1 1.0 299
28 (D-23-14)30baa 07–09–98 22.2 7.1 830 801 266 1.7 .0 511
29 (D-23-15)31cbb 07–07–98 21.6 6.9 568 553 178 6.0 1.0 369
See footnotes at end of table.
Basic Data 41

Table 10. Ground-water quality data, Upper Santa Cruz Basin, Arizona, 1998—Continued
Site identifier
Well-identification number Sample date
Temperature, field (°C)
pH, field (standard
units)
Specific conductance, field (µS/cm)
Specific conductance, lab (µS/cm)
Alkalinity(as CaCO3)
Oxygen, field
Turbidity, field (NTU)
Solids, residue at
180°C
30 (D-09-14)20adb 08–12–98 31.8 7.5 -- 390 160 -- -- 240
31 (D-11-13)35cbb 08–12–98 26.7 7.6 -- 350 150 -- -- 220
32 (D-11-14)02aab2 08–27–98 21.0 7.1 -- 290 100 -- -- 180
33 (D-12-12)12aca 08–11–98 29.9 7.6 -- 330 150 -- -- 220
34 (D-12-12)14aad 08–11–98 30.2 7.6 -- 380 120 -- -- 240
35 (D-13-13)10cdd 06–19–98 22.2 7.3 -- 250 90 -- -- 200
36 (D-13-14)29bda2 12–02–98 21.6 7.8 -- 250 110 -- -- 160
37 (D-13-15)33aaa 05–28–98 19.6 6.9 -- 150 55 -- -- 120
38 (D-14-15)27dac 04–29–98 25.2 7.3 -- 460 170 -- -- 310
39 (D-15-14)02caa 04–30–98 26.1 7.7 -- 500 140 -- -- 350
40 (D-15-16)17bca 04–30–98 19.6 6.8 -- 200 64 -- -- 140
41 (D-16-14)11bdb 08–18–98 26.5 7.5 -- 440 150 -- -- 280
42 (D-16-14)18dbd 04–30–98 23.4 7.2 -- 1,100 320 -- -- 780
43 (D-16-16)16abd 10–20–98 21.6 7.4 -- 570 200 -- -- 360
44 (D-16-17)20add2 09–10–98 24.5 7.4 -- 550 220 -- -- 310
45 (D-17-13)18cdb 08–28–98 25.4 7.7 -- 780 240 -- -- 510
46 (D-17-14)22acd 08–28–98 27.6 8.4 -- 250 100 -- -- 170
47 (D-17-15)26bca2 09–09–98 29.8 7.5 -- 600 140 -- -- 410
48 (D-17-17)31bdd2 09–09–98 23.1 7.4 -- 640 230 -- -- 390
49 (D-19-12)26cdd 05–27–98 22.1 7.0 -- 820 250 -- -- 560
50 (D-19-13)05ccc 04–29–98 27.0 7.4 -- 370 190 -- -- 230
51 (D-19-13)22dba 06–18–98 26.7 7.4 -- 490 160 -- -- 360
52 (D-20-12)01ada 05–27–98 22.0 7.0 -- 900 270 -- -- 630
53 (D-20-13)31aac2 03–10–98 20.2 7.2 -- 690 230 -- -- 470
54 (D-21-12)13aaa 05–13–98 25.9 7.8 -- 260 120 -- -- 180
55 (D-23-13)31bbc 03–10–98 16.6 6.3 -- 140 44 -- -- 160
56 (D-23-14)19bba 03–11–98 21.6 7.1 -- 890 320 -- -- 570
57 (D-23-14)27aad2 03–11–98 17.3 7.2 -- 480 180 -- -- 320
58 (D-23-15)31dda2 03–09–98 19.6 7.3 -- 340 140 -- -- 230
See footnotes at end of table.
42 Ground-Water Quality in the Upper Santa Cruz Basin, Arizona, 1998

Table 10. Water-quality data for ground water, Upper Santa Cruz Basin, Arizona, 1998—Continued
Site identifier
Well-identificationnumber Sample date
Calcium (as Ca)
Magnesium (as Mg)
Sodium (as Na)
Potas-sium(as K)
Chloride (as Cl)
Sulfate(as SO4)
Nitrogen, NO2+NO3
(as N)
Nitrogen, ammonia
(as N)Phosphorus
(as P)
1 (D-10-14)06dca 05–12–98 46 5.1 22 2.3 9.5 4.8 2.06 20.021 <0.010
2 (D-11-13)34add 05–28–98 31 7.5 40 1.5 11 5.5 3.00 2.034 <.010
3 (D-11-14)10dab2 04–29–98 38 6.0 12 1.5 5.7 27 .85 2.024 .025
4 (D-12-12)01cda 05–28–98 28 5.2 41 1.6 10 6.1 2.42 2.045 .010
5 (D-13-13)18acb 04–02–98 79 15 110 3.1 91 120 4.88 2.033 .032
6 (D-13-13)18cbd 06–04–98 120 20 150 3.8 46 320 1.65 2.046 <.010
7 (D-13-14)35aad3 04–30–98 41 2.1 20 1.2 11 30 2.23 2.022 <.010
8 (D-14-13)23aca 06–01–98 1.5 .03 120 .6 11 94 3.84 2.030 <.010
9 (D-15-14)02ddc 06–15–98 62 11 36 1.9 10 100 1.10 2.051 <.010
10 (D-15-16)06aac 05–14–98 25 4.6 26 .9 9.3 10 .87 <.020 .033
11 (D-15-16)34cba 05–13–98 27 4.9 14 1.5 4.7 4.1 .62 <.020 <.010
12 (D-16-14)06cdc2 05–11–98 150 21 50 3.9 40 190 12.2 2.027 <.010
13 (D-16-14)11bca 05–26–98 39 8.4 38 1.7 7.3 44 .45 2.028 <.010
14 (D-16-16)04dab1 04–01–98 100 19 57 2.2 23 290 2.15 2.027 <.010
15 (D-17-13)11dcd2 06–16–98 42 4.4 49 3.0 17 57 1.41 2.059 <.010
16 (D-17-14)21bbb 05–27–98 110 17 46 3.7 32 140 15.1 2.053 .043
17 (D-17-15)09bbb 04–27–98 45 6.2 50 3.2 13 79 .77 2.062 <.010
18 (D-17-15)23add 05–14–98 98 19 50 2.0 36 200 .56 2.056 <.010
19 (D-18-16)01bcc 06–20–98 4.6 1.5 220 2.0 37 80 .06 2.075 <.010
20 (D-19-12)36cbb 06–17–98 100 16 38 4.3 20 120 5.51 2.072 <.010
21 (D-19-13)07abc2 06–03–98 35 6.6 31 4.5 7.9 3.5 1.00 2.020 <.010
22 (D-19-13)22cac 06–02–98 53 8.1 20 1.4 11 46 .70 2.029 <.010
23 (D-19-13)22ddd 06–02–98 69 15 36 3.1 11 150 .14 2.026 <.010
24 (D-21-13)19cdb 06–18–98 22 1.4 26 2.3 5.4 6.4 .50 2.048 <.010
25 (D-21-13)30cda 06–18–98 25 2.6 22 2.3 6.2 11 .56 2.050 <.010
26 (D-22-13)09c unsurv 07–08–98 76 13 42 4.1 29 59 1.01 2.031 .164
27 (D-23-14)26cbd 07–06–98 52 6.6 30 2.9 11 61 1.84 2.037 .200
28 (D-23-14)30baa 07–09–98 81 17 67 1.9 51 35 13.2 2.047 .081
29 (D-23-15)31cbb 07–07–98 59 10 45 2.2 14 80 1.55 2.034 .077
30 (D-09-14)20adb 08–12–98 40 8.1 37 1.9 13 11 3.40 <.020 <.020
31 (D-11-13)35cbb 08–12–98 34 7.6 33 2.6 10 <10 2.30 <.020 <.020
See footnotes at end of table.
Basic Data 43
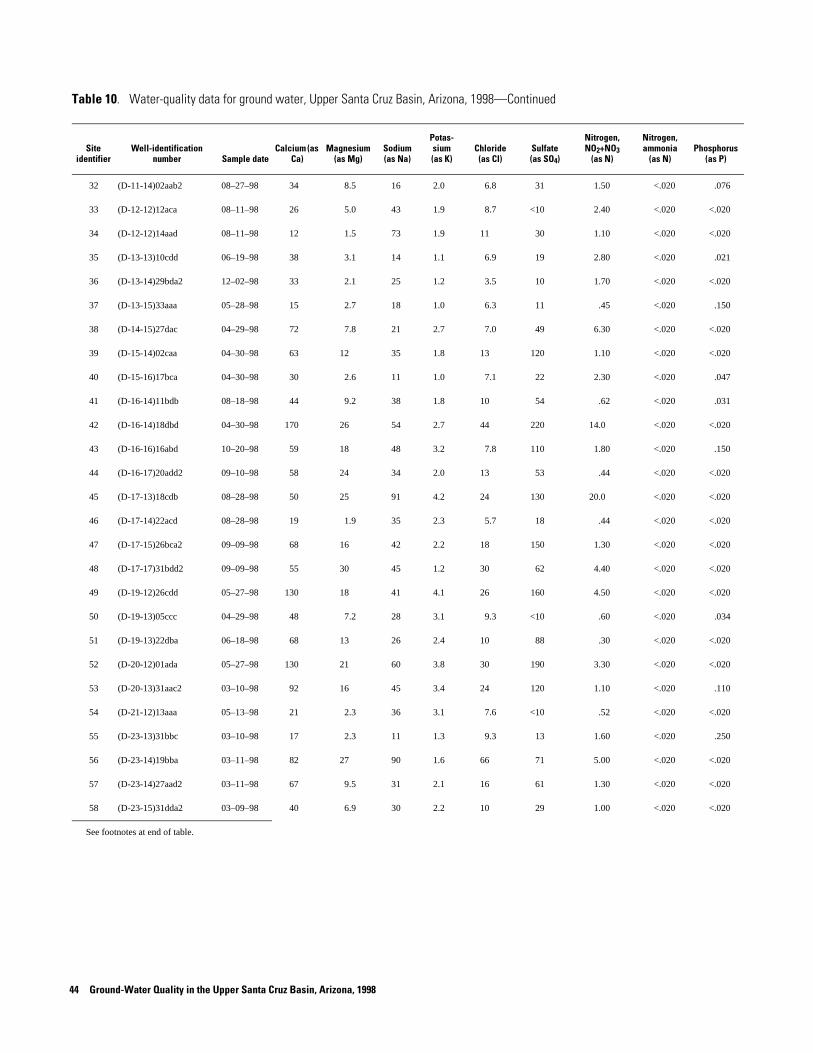
32 (D-11-14)02aab2 08–27–98 34 8.5 16 2.0 6.8 31 1.50 <.020 .076
33 (D-12-12)12aca 08–11–98 26 5.0 43 1.9 8.7 <10 2.40 <.020 <.020
34 (D-12-12)14aad 08–11–98 12 1.5 73 1.9 11 30 1.10 <.020 <.020
35 (D-13-13)10cdd 06–19–98 38 3.1 14 1.1 6.9 19 2.80 <.020 .021
36 (D-13-14)29bda2 12–02–98 33 2.1 25 1.2 3.5 10 1.70 <.020 <.020
37 (D-13-15)33aaa 05–28–98 15 2.7 18 1.0 6.3 11 .45 <.020 .150
38 (D-14-15)27dac 04–29–98 72 7.8 21 2.7 7.0 49 6.30 <.020 <.020
39 (D-15-14)02caa 04–30–98 63 12 35 1.8 13 120 1.10 <.020 <.020
40 (D-15-16)17bca 04–30–98 30 2.6 11 1.0 7.1 22 2.30 <.020 .047
41 (D-16-14)11bdb 08–18–98 44 9.2 38 1.8 10 54 .62 <.020 .031
42 (D-16-14)18dbd 04–30–98 170 26 54 2.7 44 220 14.0 <.020 <.020
43 (D-16-16)16abd 10–20–98 59 18 48 3.2 7.8 110 1.80 <.020 .150
44 (D-16-17)20add2 09–10–98 58 24 34 2.0 13 53 .44 <.020 <.020
45 (D-17-13)18cdb 08–28–98 50 25 91 4.2 24 130 20.0 <.020 <.020
46 (D-17-14)22acd 08–28–98 19 1.9 35 2.3 5.7 18 .44 <.020 <.020
47 (D-17-15)26bca2 09–09–98 68 16 42 2.2 18 150 1.30 <.020 <.020
48 (D-17-17)31bdd2 09–09–98 55 30 45 1.2 30 62 4.40 <.020 <.020
49 (D-19-12)26cdd 05–27–98 130 18 41 4.1 26 160 4.50 <.020 <.020
50 (D-19-13)05ccc 04–29–98 48 7.2 28 3.1 9.3 <10 .60 <.020 .034
51 (D-19-13)22dba 06–18–98 68 13 26 2.4 10 88 .30 <.020 <.020
52 (D-20-12)01ada 05–27–98 130 21 60 3.8 30 190 3.30 <.020 <.020
53 (D-20-13)31aac2 03–10–98 92 16 45 3.4 24 120 1.10 <.020 .110
54 (D-21-12)13aaa 05–13–98 21 2.3 36 3.1 7.6 <10 .52 <.020 <.020
55 (D-23-13)31bbc 03–10–98 17 2.3 11 1.3 9.3 13 1.60 <.020 .250
56 (D-23-14)19bba 03–11–98 82 27 90 1.6 66 71 5.00 <.020 <.020
57 (D-23-14)27aad2 03–11–98 67 9.5 31 2.1 16 61 1.30 <.020 <.020
58 (D-23-15)31dda2 03–09–98 40 6.9 30 2.2 10 29 1.00 <.020 <.020
See footnotes at end of table.
Table 10. Water-quality data for ground water, Upper Santa Cruz Basin, Arizona, 1998—Continued
Site identifier
Well-identificationnumber Sample date
Calcium (as Ca)
Magnesium (as Mg)
Sodium (as Na)
Potas-sium(as K)
Chloride (as Cl)
Sulfate(as SO4)
Nitrogen, NO2+NO3
(as N)
Nitrogen, ammonia
(as N)Phosphorus
(as P)
44 Ground-Water Quality in the Upper Santa Cruz Basin, Arizona, 1998

Table 10. Water-quality data for ground water, Upper Santa Cruz Basin, Arizona, 1998—Continued
Site identifier
Well-identificationnumber Sample date
Aluminum (µg/L as Al)
Antimony (µg/L as Sb)
Arsenic (µg/L as As)
Barium(µg/L as Ba)
Beryllium (µg/L as Be)
Cadmium(µg/L as Cd)
Chromium (µg/L as Cr)
Copper (µg/L as Cu)
1 (D-10-14)06dca 05–12–98 24.3 <1.0 3 22 <1.0 <1.0 2.6 <1.0
2 (D-11-13)34add 05–28–98 24.8 <1.0 2 24 <1.0 <1.0 2.7 <1.0
3 (D-11-14)10dab2 04–29–98 24.5 <1.0 <1 45 <1.0 <1.0 1.7 <1.0
4 (D-12-12)01cda 05–28–98 24.3 <1.0 2 20 <1.0 <1.0 2.4 1.3
5 (D-13-13)18acb 04–02–98 24.6 <1.0 4 38 <1.0 <1.0 3.5 <1.0
6 (D-13-13)18cbd 06–04–98 23.3 <1.0 4 23 <1.0 <1.0 4.1 1.8
7 (D-13-14)35aad3 04–30–98 22.3 <1.0 <1 24 <1.0 <1.0 1.7 <1.0
8 (D-14-13)23aca 06–01–98 28.1 <1.0 94 <1.0 <1.0 <1.0 1.8 <1.0
9 (D-15-14)02ddc 06–15–98 23.8 <1.0 2 60 <1.0 <1.0 1.6 1.0
10 (D-15-16)06aac 05–14–98 24.1 <1.0 <1 22 <1.0 <1.0 1.5 <1.0
11 (D-15-16)34cba 05–13–98 24.6 <1.0 4 37 <1.0 <1.0 1.3 <1.0
12 (D-16-14)06cdc2 05–11–98 24.3 <1.0 3 70 <1.0 <1.0 3.4 1.2
13 (D-16-14)11bca 05–26–98 25.7 <1.0 3 59 <1.0 <1.0 3.4 1.3
14 (D-16-16)04dab1 04–01–98 24.9 <1.0 1 36 <1.0 <1.0 2.0 <1.0
15 (D-17-13)11dcd2 06–16–98 23.8 <1.0 7 24 <1.0 <1.0 2.4 <1.0
16 (D-17-14)21bbb 05–27–98 23.3 <1.0 2 130 <1.0 <1.0 2.9 2.0
17 (D-17-15)09bbb 04–27–98 -- -- -- -- -- -- -- --
18 (D-17-15)23add 05–14–98 -- -- -- -- -- -- -- --
19 (D-18-16)01bcc 06–20–98 -- -- -- -- -- -- -- --
20 (D-19-12)36cbb 06–17–98 23.5 <1.0 3 110 <1.0 <1.0 2.5 <1.0
21 (D-19-13)07abc2 06–03–98 26.2 <1.0 6 14 <1.0 <1.0 3.7 <1.0
22 (D-19-13)22cac 06–02–98 23.6 <1.0 <1 27 <1.0 <1.0 2.1 <1.0
23 (D-19-13)22ddd 06–02–98 24.5 <1.0 2 32 <1.0 <1.0 2.1 1.3
24 (D-21-13)19cdb 06–18–98 24.1 <1.0 17 2.3 <1.0 <1.0 3.6 <1.0
25 (D-21-13)30cda 06–18–98 23.7 <1.0 12 2.7 <1.0 <1.0 2.4 <1.0
26 (D-22-13)09c unsurv 07–08–98 23.8 <1.0 5 100 <1.0 <1.0 3.2 1.1
27 (D-23-14)26cbd 07–06–98 24.1 <1.0 4 39 <1.0 <1.0 2.0 1.2
28 (D-23-14)30baa 07–09–98 24.1 <1.0 2 100 <1.0 <1.0 3.3 1.2
29 (D-23-15)31cbb 07–07–98 24.5 <1.0 3 35 <1.0 <1.0 2.1 2.5
30 (D-09-14)20adb 08–12–98 <500 <5.0 <10 <100 <.5 <1.0 <10 <10
See footnotes at end of table.
Basic Data 45

31 (D-11-13)35cbb 08–12–98 <500 <5.0 <10 <100 <.5 <1.0 <10 <10
32 (D-11-14)02aab2 08–27–98 <500 <5.0 <10 <100 <.5 <1.0 <10 <10
33 (D-12-12)12aca 08–11–98 <500 <5.0 <10 <100 <.5 <1.0 <10 <10
34 (D-12-12)14aad 08–11–98 <500 <5.0 15 <100 <.5 <1.0 <10 <10
35 (D-13-13)10cdd 06–19–98 <500 <5.0 <10 <100 <.5 <1.0 <10 <10
36 (D-13-14)29bda2 12–02–98 <500 <5.0 <10 <100 <.5 <1.0 <10 <10
37 (D-13-15)33aaa 05–28–98 <500 <5.0 <10 <100 <.5 <1.0 <10 <10
38 (D-14-15)27dac 04–29–98 <500 <5.0 <10 150 <.5 <1.0 <10 <10
39 (D-15-14)02caa 04–30–98 <500 <5.0 <10 <100 <.5 <1.0 <10 <10
40 (D-15-16)17bca 04–30–98 <500 <5.0 <10 <100 <.5 <1.0 <10 <10
41 (D-16-14)11bdb 08–18–98 <500 <5.0 <10 <100 <.5 <1.0 <10 <10
42 (D-16-14)18dbd 04–30–98 <500 5.4 <10 <100 <.5 <1.0 <10 <10
43 (D-16-16)16abd 10–20–98 <500 <5.0 <10 <100 <.5 <1.0 <10 <10
44 (D-16-17)20add2 09–10–98 <500 <5.0 <10 <100 <.5 <1.0 <10 <10
45 (D-17-13)18cdb 08–28–98 <500 <5.0 46 <100 <.5 <1.0 <10 <10
46 (D-17-14)22acd 08–28–98 <500 <5.0 10 <100 <.5 <1.0 <10 <10
47 (D-17-15)26bca2 09–09–98 <500 <5.0 <10 <100 <.5 <1.0 <10 <10
48 (D-17-17)31bdd2 09–09–98 <500 <5.0 <10 130 <.5 <1.0 <10 <10
49 (D-19-12)26cdd 05–27–98 <500 <5.0 <10 <100 <.5 <1.0 <10 <10
50 (D-19-13)05ccc 04–29–98 <500 <5.0 <10 <100 <.5 <1.0 <10 <10
51 (D-19-13)22dba 06–18–98 <500 <5.0 <10 <100 <.5 <1.0 <10 <10
52 (D-20-12)01ada 05–27–98 <500 <5.0 <10 <100 <.5 <1.0 <10 <10
53 (D-20-13)31aac2 03–10–98 <500 <5.0 12 <100 <.5 <1.0 <10 <10
54 (D-21-12)13aaa 05–13–98 <500 <5.0 11 <100 <.5 <1.0 <10 <10
55 (D-23-13)31bbc 03–10–98 2,700 <5.0 <10 <100 <.5 <1.0 <10 <10
56 (D-23-14)19bba 03–11–98 <500 <5.0 <10 <100 <.5 <1.0 <10 <10
57 (D-23-14)27aad2 03–11–98 <500 <5.0 <10 <100 <.5 <1.0 <10 <10
58 (D-23-15)31dda2 03–09–98 <500 <5.0 <10 <100 <.5 <1.0 <10 <10
See footnotes at end of table.
Table 10. Water-quality data for ground water, Upper Santa Cruz Basin, Arizona, 1998—Continued
Site identifier
Well-identificationnumber Sample date
Aluminum (µg/L as Al)
Antimony (µg/L as Sb)
Arsenic (µg/L as As)
Barium(µg/L as Ba)
Beryllium (µg/L as Be)
Cadmium(µg/L as Cd)
Chromium (µg/L as Cr)
Copper (µg/L as Cu)
46 Ground-Water Quality in the Upper Santa Cruz Basin, Arizona, 1998

Table 10. Water-quality data for ground water, Upper Santa Cruz Basin, Arizona, 1998—Continued
Site identifier
Well-identificationnumber Sample date
Fluoride(as F)
Iron (µg/L as Fe)
Lead(µg/L as Pb)
Manganese (µg/L as
Mn)Selenium
(µg/L as Se)
Silver (µg/L as
Ag)Zinc
(µg/L as Zn)Tritium, total
(pCi/L)
1 (D-10-14)06dca 05–12–98 0.17 <10 1.6 <1.0 <1 <1.0 81 2.6
2 (D-11-13)34add 05–28–98 .49 22 <1.0 2.0 <1 <1.0 127 <2.5
3 (D-11-14)10dab2 04–29–98 .32 13 <1.0 6.3 <1 <1.0 130 31
4 (D-12-12)01cda 05–28–98 .50 12 <1.0 <1.0 <1 <1.0 83 <2.5
5 (D-13-13)18acb 04–02–98 1.2 <10 <1.0 14 <1 <1.0 113 20
6 (D-13-13)18cbd 06–04–98 1.4 14 <1.0 1.7 2 <1.0 113 <2.5
7 (D-13-14)35aad3 04–30–98 .12 200 <1.0 9.5 <1 <1.0 215 18
8 (D-14-13)23aca 06–01–98 2.5 <10 <1.0 1.7 <1 <1.0 26.9 59
9 (D-15-14)02ddc 06–15–98 .26 <10 <1.0 <1.0 <1 <1.0 130 <2.5
10 (D-15-16)06aac 05–14–98 .46 23 <1.0 1.3 <1 <1.0 73 <2.5
11 (D-15-16)34cba 05–13–98 .43 <10 <1.0 <1.0 <1 <1.0 37 <2.5
12 (D-16-14)06cdc2 05–11–98 .36 12 <1.0 1.0 2 <1.0 34 11
13 (D-16-14)11bca 05–26–98 .41 29 <1.0 2.0 <1 <1.0 86 <2.5
14 (D-16-16)04dab1 04–01–98 .54 27 <1.0 3.8 <1 <1.0 28.1 <2.5
15 (D-17-13)11dcd2 06–16–98 .71 <10 <1.0 9.0 <1 <1.0 106 <2.5
16 (D-17-14)21bbb 05–27–98 .47 13 <1.0 <1.0 2 <1.0 92 8.3
17 (D-17-15)09bbb 04–27–98 .56 <10 -- -- -- -- -- <2.5
18 (D-17-15)23add 05–14–98 .42 39 -- -- -- -- -- <2.5
19 (D-18-16)01bcc 06–20–98 1.7 <10 -- -- -- -- -- <2.5
20 (D-19-12)36cbb 06–17–98 .42 <10 <1.0 <1.0 1 <1.0 20 12
21 (D-19-13)07abc2 06–03–98 .41 <10 <1.0 <1.0 <1 <1.0 114 <2.5
22 (D-19-13)22cac 06–02–98 .23 13 <1.0 1.1 <1 <1.0 37 <2.5
23 (D-19-13)22ddd 06–02–98 .35 49 <1.0 6.4 1 <1.0 70 <2.5
24 (D-21-13)19cdb 06–18–98 .79 <10 <1.0 <1.0 <1 <1.0 26 <2.5
25 (D-21-13)30cda 06–18–98 .45 100 <1.0 3.1 <1 <1.0 25 <2.5
26 (D-22-13)09c unsurv 07–08–98 .55 13 <1.0 1.0 <1 <1.0 50 15
27 (D-23-14)26cbd 07–06–98 .48 <10 <1.0 <1.0 <1 <1.0 29 14
28 (D-23-14)30baa 07–09–98 .67 14 <1.0 400 1 <1.0 38 16
29 (D-23-15)31cbb 07–07–98 .68 11 <1.0 1.4 <1 <1.0 25 9.0
30 (D-09-14)20adb 08–12–98 .72 <100 5.5 <50 <5 <1.0 150 <2.5
31 (D-11-13)35cbb 08–12–98 .54 <100 <5.0 <50 <5 <1.0 150 3.5
See footnotes at end of table
Basic Data 47

32 (D-11-14)02aab2 08–27–98 .34 <100 <5.0 <50 <5 <1.0 230 46
33 (D-12-12)12aca 08–11–98 .50 <100 <5.0 <50 <5 <1.0 58 <2.5
34 (D-12-12)14aad 08–11–98 7.5 <100 <5.0 <50 <5 <1.0 54 <2.5
35 (D-13-13)10cdd 06–19–98 <.20 <100 <5.0 <50 <5 <1.0 230 27
36 (D-13-14)29bda2 12–02–98 .15 <100 <5.0 <50 <5 <1.0 <50 16
37 (D-13-15)33aaa 05–28–98 .47 <100 <5.0 <50 <5 <1.0 140 22
38 (D-14-15)27dac 04–29–98 <.20 <100 <5.0 <50 <5 <1.0 56 6.1
39 (D-15-14)02caa 04–30–98 .22 <100 <5.0 <50 <5 <1.0 <50 <2.5
40 (D-15-16)17bca 04–30–98 <.20 <100 <5.0 <50 <5 <1.0 <50 23
41 (D-16-14)11bdb 08–18–98 .45 <100 <5.0 <50 <5 <1.0 440 <2.5
42 (D-16-14)18dbd 04–30–98 .37 <100 <5.0 <50 6 <1.0 58 10
43 (D-16-16)16abd 10–20–98 .65 <100 <5.0 <50 <5 <1.0 420 66
44 (D-16-17)20add2 09–10–98 1.8 <100 <5.0 <50 9 <1.0 <50 4.5
45 (D-17-13)18cdb 08–28–98 .48 <100 <5.0 <50 5 <1.0 370 <2.5
46 (D-17-14)22acd 08–28–98 1.2 <100 <5.0 <50 <5 <1.0 67 4.2
47 (D-17-15)26bca2 09–09–98 .48 <100 <5.0 <50 <5 <1.0 260 7.4
48 (D-17-17)31bdd2 09–09–98 .61 <100 <5.0 <50 <5 <1.0 610 <2.5
49 (D-19-12)26cdd 05–27–98 .46 <100 <5.0 <50 <5 <1.0 <50 24
50 (D-19-13)05ccc 04–29–98 .24 <100 7.7 <50 <5 <1.0 170 <2.5
51 (D-19-13)22dba 06–18–98 .21 240 <5.0 <50 <5 <1.0 130 <2.5
52 (D-20-12)01ada 05–27–98 .41 <100 <5.0 <50 5 <1.0 320 21
53 (D-20-13)31aac2 03–10–98 .58 <100 <5.0 <50 <5 <1.0 <50 20
54 (D-21-12)13aaa 05–13–98 .94 <100 <5.0 <50 <5 <1.0 <50 4.5
55 (D-23-13)31bbc 03–10–98 <.20 740 <5.0 <50 <5 <1.0 320 16
56 (D-23-14)19bba 03–11–98 .75 <100 <5.0 <50 <5 <1.0 <50 20
57 (D-23-14)27aad2 03–11–98 .48 <100 <5.0 <50 <5 <1.0 <50 18
58 (D-23-15)31dda2 03–09–98 .57 <100 <5.0 <50 <5 <1.0 <50 15
1Well-identification number previously published as (D-16-16)04adc.2Sample may have been contaminated during collection; actual value is less than or equal to value shown.
Table 10. Water-quality data for ground water, Upper Santa Cruz Basin, Arizona, 1998—Continued
Site identifier
Well-identificationnumber Sample date
Fluoride(as F)
Iron (µg/L as Fe)
Lead(µg/L as Pb)
Manganese (µg/L as
Mn)Selenium
(µg/L as Se)
Silver (µg/L as
Ag)Zinc
(µg/L as Zn)Tritium, total
(pCi/L)
48 Ground-Water Quality in the Upper Santa Cruz Basin, Arizona, 1998

Table 11. Site information and construction data for wells, Upper Santa Cruz Basin, Arizona, 1998
[Site numbers correspond with sites shown on figures 2 and 8. Collection agency: USGS, U.S. Geological Survey; ADEQ, Arizona Department of Environmental Quality. mbls, meters below land surface. Geologic Unit: UT, upper Tinaja bed; FL, Fort Lowell Formation; C, consolidated rocks; OA, older alluvium. Alluvium: T, well located more than 2 kilometers from stream alluvium; R, well located less than 2 kilometers from stream alluvium. Inferred fault: N, well located north of the inferred fault; S, well located south of the inferred fault. Faults: A, well located more than 2 kilometers from a major fault; F, well located less than 2 kilometers from a major fault. Land use: Rg, well contained recent recharge from rangeland; Nr, well did not contain recent recharge from the land surface; Ur, well contained recent recharge from urban areas; Ag, well contained recent recharge from agricultural areas. --, no data.]
Site identifier
Well- identificationnumber
Collection agency
Depth (mbls)
Open interval (mbls)
Date of water level
Water-level depth (mbls)
Geologicunit
Allu-vium
Inferred fault Faults Land useFrom To
1 (D-10-14)06dca USGS 143.2 -- -- 05–12–98 131.0 -- T N A Rg
2 (D-11-13)34add USGS 189.0 167.6 185.9 05–28–98 153.2 UT T N A Nr
3 (D-11-14)10dab2 USGS 67.1 48.8 61.0 04–29–98 24.2 FL T N A Ur
4 (D-12-12)01cda USGS 161.5 138.7 158.5 05–28–98 128.4 UT T N A Nr
5 (D-13-13)18acb USGS 106.7 76.285.394.5
82.391.4
100.6
04–02–98 33.1 UT R N F Ur
6 (D-13-13)18cbd USGS 91.4 63.4 88.4 06–04–98 51.2 UT R N F Nr
7 (D-13-14)35aad3 USGS 75.6 43.6 72.5
69.575.6
04–30–98 44.8 UT R N A Ur
8 (D-14-13)23aca USGS 62.2 32.961.0
57.362.2
06–01–98 36.8 UT R N F Ur
9 (D-15-14)02ddc USGS 100.6 79.2 94.5 06–15–98 69.9 FL T N F Nr
10 (D-15-16)06aac USGS 103.6 91.4 103.6 05–14–98 68.4 C R N A Nr
11 (D-15-16)34cba USGS 167.6 153.9 167.6 05–13–98 134.5 UT R N F Nr
12 (D-16-14)06cdc2 USGS 83.8 45.7 79.2 05–11–98 36.3 FL R N F Ag
13 (D-16-14)11bca USGS 119.5 100.3 119.5 05–26–98 60.6 FL T N A Nr
14 (D-16-16)04dab1 USGS 182.9 152.4 182.9 04–01–98 137.4 UT R N F Nr
15 (D-17-13)11dcd2 USGS 152.4 131.1 149.3 06–16–98 99.7 UT R N A Nr
16 (D-17-14)21bbb USGS 91.4 64.0 90.2 05–27–98 65.8 FL T N F Ag
17 (D-17-15)09bbb USGS 181.3 161.5 181.4 04–27–98 124.6 UT T N F Nr
18 (D-17-15)23add USGS 243.8 207.3 243.8 05–06–95 173.7 UT T N A Nr
19 (D-18-16)01bcc USGS 152.4 117.0151.5
147.5152.4
06–20–98 119.6 C T N A Nr
20 (D-19-12)36cbb USGS 70.1 54.9 70.1 06–17–98 51.5 OA R S F Ag
21 (D-19-13)07abc2 USGS 118.9 97.5 118.9 06–03–98 86.9 UT T N F Nr
22 (D-19-13)22cac USGS 91.4 61.0 91.4 06–02–98 53.7 OA R N F Nr
23 (D-19-13)22ddd USGS 108.8 85.3 108.8 06–02–98 75.0 OA R N F Nr
24 (D-21-13)19cdb USGS 45.7 30.5 42.7 06–18–98 30.4 OA R S A Nr
25 (D-21-13)30cda USGS 24.4 10.7 22.9 06–18–98 9.6 OA R S A Ag
26 (D-22-13)09c unsurv USGS 30.5 7.0 28.4 07–08–98 6.6 OA R S A Ag
27 (D-23-14)26cbd USGS 12.2 6.1 12.2 07–06–98 5.9 OA R S A Ag
28 (D-23-14)30baa USGS 45.7 10.7 45.7 07–09–98 15.8 OA R S A Ur
29 (D-23-15)31cbb USGS 35.1 7.6 35.1 07–07–98 5.7 OA R S A Ag
See footnote at end of table.
Basic Data 49

Table 11. Site information and construction data for wells, Upper Santa Cruz Basin, Arizona, 1998—Continued
Site identifier
Well-identificationnumber
Collection agency
Depth (mbls)
Open interval (mbls)Date of
water levelWater-level depth (mbls)
Geologic unit
Allu-vium
Inferred fault Faults Land useFrom To
30 (D-09-14)20adb ADEQ 201.2 -- -- -- -- -- T N A Nr
31 (D-11-13)35cbb ADEQ 213.3 169.5 206.0 09–13–93 147.8 UT T N A Ur
32 (D-11-14)02aab2 ADEQ 61.0 30.5 58.8 -- -- FL T N A Ur
33 (D-12-12)12aca ADEQ 158.5 140.2 158.5 -- -- UT T N A Nr
34 (D-12-12)14aad ADEQ 137.2 100.6 131.1 10–06–95 88.4 UT T N A Nr
35 (D-13-13)10cdd ADEQ 92.0 54.9 85.3 06–22–94 48.8 FL R N A Ur
36 (D-13-14)29bda2 ADEQ 61.0 -- -- -- -- -- R N A Ur
37 (D-13-15)33aaa ADEQ 62.5 30.5 61.0 07–21–94 29.0 UT R N A Ur
38 (D-14-15)27dac ADEQ 121.9 100.6 118.9 05–02–95 76.8 UT R N A Ur
39 (D-15-14)02caa ADEQ 109.7 68.0 107.6 04–30–98 62.2 FL T N F Nr
40 (D-15-16)17bca ADEQ 73.1 54.0 73.2 09–22–93 44.2 FL R N A Ur
41 (D-16-14)11bdb ADEQ 119.5 100.3 119.5 05–06–97 79.2 FL T N A Nr
42 (D-16-14)18dbd ADEQ 91.4 -- -- 06–29–93 41.1 -- R N F Ag
43 (D-16-16)16abd ADEQ 217.9 205.7 217.9 06–24–92 195.1 UT R N A Ur
44 (D-16-17)20add2 ADEQ 182.9 91.4 182.9 -- -- C T N A Rg
45 (D-17-13)18cdb ADEQ 121.9 109.7 121.9 -- -- C T N A Nr
46 (D-17-14)22acd ADEQ 97.5 -- -- -- -- -- T N A Rg
47 (D-17-15)26bca2 ADEQ 259.1 228.6 259.1 -- -- C T N A Rg
48 (D-17-17)31bdd2 ADEQ 129.5 30.5 137.2 -- -- C T N A Nr
49 (D-19-12)26cdd ADEQ 61.0 45.7 61.0 -- -- OA R S F Ag
50 (D-19-13)05ccc ADEQ 112.8 88.4 112.8 -- -- FL T N F Nr
51 (D-19-13)22dba ADEQ 91.4 73.2 91.4 09–18–96 62.5 OA R N F Nr
52 (D-20-12)01ada ADEQ 36.6 18.3 36.6 05–27–98 15.2 OA R S F Ag
53 (D-20-13)31aac2 ADEQ 30.5 -- -- -- -- -- R S A Ag
54 (D-21-12)13aaa ADEQ 67.1 -- -- -- -- -- R S F Rg
55 (D-23-13)31bbc ADEQ 91.7 -- -- -- -- -- T S A Rg
56 (D-23-14)19bba ADEQ 54.9 38.1 54.9 03–11–98 18.3 OA R S A Ur
57 (D-23-14)27aad2 ADEQ 61.0 -- -- -- -- -- R S A Ag
58 (D-23-15)31dda2 ADEQ 36.6 -- -- -- -- -- R S A Ag
1Well-identification number previously published as (D-16-16)04adc.
50 Ground-Water Quality in the Upper Santa Cruz Basin, Arizona, 1998

QUALITY-ASSURANCE PLANS AND QUALITY-CONTROL DATA

U.S. Geological Survey
The USGS followed quality-assurance procedures to minimize the potential for bias and variability of the environmental data during sample collection and analysis. Design of the USGS quality-assurance plan and quality-control sample collection was based on requirements described by Koterba and others (1995). The USGS collected three field-blank samples and three replicate samples for some general properties and major ions, nutrients, and trace elements at 3 of the 29 wells sampled (sites 11, 21, and 28; figs. 2 and 8; tables 7 and 8). An additional replicate sample for trace-element analysis was collected at site 15 and an additional replicate sample for arsenic was collected at site 8. Three replicate samples for isotope analyses were collected at 3 of the 29 wells sampled (sites 11, 21, and 28). For quality control of water-level data, measurements were repeated until successive measurements were within 0.03 m of one another.
Field-blank samples were collected subsequent to collection of the environmental samples and cleaning of the sampling equipment by passing water free of the constituents of interest through the sampling equipment. These samples were analyzed to determine if bias existed in the data from contamination during sample collection and (or) analysis. Systematic contamination was positively identified if more than 50 percent of the field-blank samples for a particular sample population contained measurable quantities of the constituent of interest. For this study, the sample population for trace elements, nutrients, and major ions consisted of the three field-blank samples collected in the Upper Santa Cruz Basin in 1998. All ammonia and aluminum analyses were determined to be affected by systematic contamination (D.J. Gellenbeck, hydrologist, USGS, written commun., 1998) and were not used to characterize the water quality. In addition, concentrations of zinc less than 16.7 µg/L were determined to be affected by systematic contamination (D.J. Gellenbeck, hydrologist, USGS, written commun., 1998).
Replicate samples were obtained by sequentially collecting an additional sample from the same site and for the same constituents as the environmental sample.
Data from these samples provide a measure of the variability that resulted from the combined effects of field and laboratory procedures (table 12). Variability in constituent concentrations between the replicate sample and the environmental sample is shown in table 12 in units of absolute concentration and as percent difference, which is the absolute difference between concentrations in the replicate sample and the environmental sample divided by the sum of the concentrations in the replicate samples multiplied by 100. A sample pair (consisting of one replicate sample and one environmental sample) was used in this analysis if the concentration in at least one sample was greater than the MRL. The results indicate that the maximum percent difference between the paired samples for most of the constituents and compounds was less than 5 percent. The maximum percent differences for ammonia, phosphorus, and chromium were more than 5 percent. The maximum differences in absolute concentration units for ammonia (0.01 mg/L) and chromium (0.50 µg/L) were within one standard deviation of the mean for these constituents in the 29 environmental samples collected by the USGS. This result indicates that variation in the environmental data was not greatly affected by analytical procedures. The maximum difference in concentration units for phosphorus (1.23 mg/L) was greater than one standard deviation of the mean of the environmental data, which indicates that some variation in the environmental phosphorus data may be caused by analytical procedures.
The USGS NWQL maintains an internal program that includes the use of data from blank, replicate, and spike samples to ensure that the laboratory is accurately analyzing water-quality samples (Pritt and Raese, 1995). The Quality Assurance Unit of the NWQL routinely submits blind reference and blank samples to the NWQL. The USGS Branch of Quality Systems (BQS), which operates independently of the NWQL, also submits blind samples to the NWQL.
52 Ground-Water Quality in the Upper Santa Cruz Basin, Arizona, 1998

Table 12. Summary results of the analyses of replicate samples and associated environmental samples collected by the U.S. Geological Survey and the Arizona Department of Environmental Quality, Upper Santa Cruz Basin, Arizona, 1998
[N, number of replicate-environmental sample pairs with at least one value greater than the minimum-reporting level. Constituents are dissolved and are reported in milligrams per liter unless otherwise noted. Values in bold type are greater than 5-percent different. µS/cm, microsiemens per centimeter at 25 degrees Celsius; µg/L, micrograms per liter; pCi/L, picocuries per liter; --, no data]
Property or constituent
U.S. Geological Survey Arizona Department of Environmental Quality
Replicate samples Replicate samples
N
Difference, in percentDifference,
in concentration units
N
Difference, in percentDifference,
in concentration units
Minimum Maximum Median Minimum Maximum Median Minimum Maximum Median MinimumMaximu
m Median
General properties
Specific conduc-tance (µS/cm)
3 0.03 0.27 0.10 1.0 4.0 1.0 5 0.00 0.57 0.43 0.00 10 10
Alkalinity 3 .00 .00 .00 .00 .00 .00 5 .00 .94 .94 .00 10 10
Dissolved solid 3 .10 .32 .30 1.0 6.0 2.0 5 .00 1.4 1.4 .00 20 .00
Major ions
Calcium 3 .00 2.7 .31 .00 4.0 1.0 5 .00 1.2 .40 .00 2.0 1.0
Magnesium 3 .00 2.2 .52 .00 .60 .10 5 .00 3.8 .00 .00 3.0 .00
Sodium 3 .00 .79 .00 .00 1.0 .00 5 .00 9.4 .53 .00 19 1.0
Potassium 3 .00 3.1 .00 .00 .20 .00 5 .00 2.9 .65 .00 .02 .10
Chloride 3 .96 1.3 1.1 .20 2.0 .40 5 .00 2.4 1.3 .00 1.0 .40
Sulfate 3 .00 1.4 .00 .00 2.0 .00 5 .00 2.8 1.8 .00 20 4.0
Nutrients
Nitrite plus nitrate
3 .00 3.5 .38 .00 .20 .08 5 .00 2.4 .79 .00 .10 .10
Ammonia 3 .00 10 1.2 .00 .01 .001 0 -- -- -- -- -- --
Phosphorus 2 2.9 49 26 .01 1.2 .62 2 1.7 7.1 4.4 .01 .01 .01
Trace elements
Aluminum (µg/L)
4 .00 1.2 .60 .00 .30 .10 0 -- -- -- -- -- --
Antimony (µg/L) 0 -- -- -- -- -- -- 0 -- -- -- -- -- --
Arsenic(µg/L) 5 .00 1.5 .00 .00 6.0 .00 0 -- -- -- -- -- --
Barium (µg/L) 4 .00 .67 .12 .00 1.0 .50 0 -- -- -- -- -- --
Beryllium (µg/L 0 -- -- -- -- -- -- 0 -- -- -- -- -- --
Cadmium (µg/L) 0 -- -- -- -- -- -- 0 -- -- -- -- -- --
Chromium (µg/L)
4 .00 6.5 3.6 .00 .50 .40 0 -- -- -- -- -- --
Copper (µg/L) 1 .00 .00 .00 .00 .00 .00 0 -- -- -- -- -- --
Fluoride 3 .38 2.9 1.7 .01 .05 .03 5 .00 4.5 .62 .00 .13 .01
Iron (µg/L) 1 .00 .00 .00 .00 .00 .00 0 -- -- -- -- -- --
Lead (µg/L) 0 -- -- -- -- -- -- 1 1.5 1.5 1.5 .30 .30 .30
Manganese (µg/L)
2 .00 .55 .28 .00 .20 .10 0 -- -- -- -- -- --
Selenium (µg/L) 1 .00 .00 .00 .00 .00 .00 2 .00 .00 .00 .00 .00 .00
Silver (µg/L) 0 -- -- -- -- -- -- 0 -- -- -- -- -- --
Zinc (µg/L 4 .00 3.7 .95 .00 6.0 1.5 3 .00 1.8 .79 .00 30 10
Isotopes
Tritium, total (pCi/L)
1 .94 .94 .94 .60 .60 .60 0 -- -- -- -- -- --
Quality-Assurance Plans and Quality-Control Data 53

Arizona Department of Environmental Quality
The ADEQ followed quality-assurance procedures to minimize the potential for bias and variability of the environmental data during sample collection and analysis. Design of the ADEQ quality-assurance plan and quality-control sample collection was based on recommendations included in the QAPP (Arizona Department of Environmental Quality, 1991). The ADEQ collected six field-blank samples at sites 12, 35, 41, 43, 45, and 57 (figs. 2 and 8; table 7). The samples to be analyzed for some general properties, major ions, and nutrients were collected by directly pouring water free of the constituent of interest into the sample bottles. Field-blank samples for trace-element analyses were collected by placing water free of the constituent of interest into the same bottle used to transfer the unfiltered environmental sample, and then filtering the water using a positive-pressure filtering apparatus fitted with a 0.45-micrometer in-line cartridge filter. The bottle used to transfer water to the filtering apparatus was cleaned according to the QAPP recommendations (Arizona Department of Environmental Quality, 1991). Of the six field-blank samples, one sample had measurable concentrations of chloride, and one sample had measurable concentrations of zinc. Because less than 50 percent of the field-blank samples were affected, contamination during sampling and analysis was not likely.
Replicate samples were collected at sites 39, 41, 43, 44, and 52 (figs. 2 and 8; table 8) by sequentially collecting an additional sample for some general properties, major ions, nutrients, and trace elements after the environmental sample was collected. The results indicate that the maximum percent difference between paired samples for most of the constituents was less than 5 percent (table 12). The maximum percent differences for sodium and phosphorus were more than 5 percent. The maximum difference in absolute concentration for phosphorus (0.01 mg/L) was within one standard deviation of the mean of the environmental data. This result indicates that variation in the environmental data was not greatly affected by analytical procedures. The maximum absolute difference in concentration for sodium (19 mg/L) was greater than one standard deviation of the mean of the environmental data. This result indicates that some variation in the environmental data for sodium may be caused by analytical procedures.
Replicate results for 12 constituents were below the MRL for the ADHS laboratory; therefore, no analysis of variability was completed for these constituents.
During sampling by the ADEQ in 1996–97 in the Sierra Vista subbasin, standard-reference samples for general properties, major ions, nutrients, and trace elements were received from the USGS BQS and analyzed by the ADHS laboratory (Coes and others, 1999). Data from these samples provide a measure of the bias of the ADHS laboratory compared with other laboratories, including the NWQL, that participate in the interlaboratory evaluation program that the USGS BQS designs and operates (Farrar and Long, 1997). Results from this earlier study identified high bias for fluoride analyses from the NWQL and ADHS laboratory and high bias for magnesium and zinc analyses from the ADHS laboratory.
Combined Quality-Control Data
Joint quality-control samples were collected by the USGS and the ADEQ to ensure that environmental data could be combined and analyzed as one data set. Combined quality-control data were necessary to determine the variability in the data caused by differing laboratory-analytical procedures and field procedures used by each agency. To measure the variability, the USGS and the ADEQ simultaneously collected environmental samples (one sample collected by each agency) as split-sample pairs for analysis of some general properties, major ions, nutrients, and trace elements at six sites (sites 1, 5, 12, 14, 20, and 25; figs. 2 and 8; table 9). Split-sample pairs were not collected for isotope analyses because all the samples collected by both agencies were analyzed by a USGS laboratory. Wells selected for collection of split samples were spatially distributed and were in areas that had different ground-water chemistry (fig. 10). At all six sites, one set of split-sample pairs was collected (one sample collected by each agency) using NAWQA ground-water sampling protocols and procedures to determine differences between the laboratory analytical procedures. At four of the six sites, another set of split-sample pairs (one sample collected by each agency) was collected using the ADEQ ground-water sampling protocols to determine differences between field-collection procedures (sites 1, 12, 20, and 25; figs. 2 and 8; table 9).
54 Ground-Water Quality in the Upper Santa Cruz Basin, Arizona, 1998
Statistical analyses of data from joint quality-control samples were completed to determine if there were differences in constituent concentrations related to differences in laboratory and (or) field procedures used by each agency. The exact form of the sign test (Helsel and Hirsch, 1992) was used to identify significant differences in constituent concentrations at a significance level of 0.05.
Comparison of Laboratory-Analytical Procedures
To increase the sample population for the determination of variability owing to laboratory-analytical procedures, split-sample data for the USGS and the ADEQ produced from sampling completed in the Sierra Vista subbasin, Arizona, during 1996–97 (Coes and others, 1999) were combined with split-sample data collected in the Upper Santa Cruz Basin during 1998. The combination of these split-sample data increased the maximum number of split-sample pairs from 10 to 17.
Few significant differences were identified between ground-water quality data determined by the USGS NWQL and the ADHS laboratory (table 13). Among the general properties, significant differences were found in alkalinity concentrations. The alkalinity concentrations determined by the ADHS laboratory were lower than those determined by the USGS NWQL. Within the major-ion constituents, significant differences were identified for magnesium and potassium data from the ADHS laboratory and the USGS NWQL. Concentrations of magnesium and potassium determined by the ADHS laboratory were higher than those determined by the USGS NWQL.
This high bias corresponds with results for magnesium
and potassium in a standard-reference sample analyzed
by the ADHS laboratory (Coes and others, 1999).
Because some nutrient and trace-element
concentrations determined by at least one agency were
below the MRL for that agency’s laboratory, a limited
number of statistical analyses were possible to
determine the variation between laboratory analytical
procedures. No significant differences were identified
between results from the USGS NWQL and the ADHS
laboratory for nitrite plus nitrate, arsenic, barium,
fluoride, and zinc concentrations.
Comparison of Sample-Collection Procedures
To determine if significant variability existed in
environmental data because of differences in sample-
collection procedures, eight split-sample pairs were
collected at four wells using sample-collection
techniques of both agencies. Only 11 of the 27 general
properties and constituents could be analyzed because
of the small sample population and lack of
concentrations above MRL’s for one or both agencies.
Split-sample pairs for temperature and pH were not
measured during this sample collection. No significant
differences were identified for those characteristics or
constituents that were analyzed (table 14). On the basis
of these results, variability between data collected by
the USGS and the ADEQ was not affected by sample-
collection procedures.
Quality-Assurance Plans and Quality-Control Data 55

Table 13. Summary results of the analyses of split samples collected by the U.S. Geological Survey and the Arizona Department of Environmental Quality for comparison of laboratory-analytical procedures, Upper Santa Cruz Basin and Sierra Vista subbasin, Arizona, 1996–97 and 1998
[N, number of split-sample pairs with at least one value greater than the minimum-reporting level. Constituents are dissolved and are reported in milligrams per liter unless otherwise noted. °C, degrees Celsius; µS/cm, microsiemens per centimeter at 25°C; --, no data; µg/L, micrograms per liter; ADEQ, Arizona Department of Environmental Quality; USGS, U.S. Geological Survey. ADEQ < USGS, ADEQ values are significantly lower than USGS values; ADEQ > USGS, ADEQ values are significantly higher than USGS values. Properties or constituents in bold indicate a significant difference between data of the ADEQ and the USGS]
Property or constituent N
Absolute difference, in percentAbsolute difference,
in concentration unitsSignificant difference in
laboratory- analytical procedures between ADEQ
and USGS (α=0.05)Minimum Maximum Median Minimum Maximum Median
General properties
Temperature (°C) 17 0.10 11 3.9 0.10 2.1 0.9 No
pH (standard units) 17 .00 6.6 2.6 .00 .50 .20 No
Specific conductance (µS/cm) 17 2.2 8.7 5.2 9.0 58 24 No
Alkalinity 17 .40 6.6 2.8 1.0 15 4.0 Yes(ADEQ<USGS)
Dissolved solids 17 1.2 15 4.0 3.0 60 16 No
Major ions
Calcium 17 .00 18 5.6 .00 10 2.8 No
Magnesium 17 .00 70 5.1 .00 1.0 .20 Yes(ADEQ>USGS)
Sodium 16 .00 14 3.1 .00 12 1.0 No
Potassium 16 .00 35 9.2 .00 .40 .20 Yes(ADEQ>USGS)
Chloride 17 .00 26 9.0 .00 3.0 1.1 No
Sulfate 13 .00 13 1.5 .00 10 1.0 No
Nutrients
Nitrite plus nitrate 17 .00 20 6.2 .00 1.0 .06 No
Ammonia 0 -- -- -- -- -- -- --
Phosphorus 1 19 19 19 .01 .01 .01 --
Trace elements
Aluminum (µg/L) 0 -- -- -- -- -- -- --
Antimony (µg/L) 0 -- -- -- -- -- -- --
Arsenic (µg/L) 4 8.0 24 12 1.0 3.0 3.0 No
Barium (µg/L) 5 .80 7.1 5.1 2.0 33 7.0 No
Beryllium (µg/L) 0 -- -- -- -- -- -- --
Cadmium (µg/L) 0 -- -- -- -- -- -- --
Chromium (µg/L) 0 -- -- -- -- -- -- --
Copper (µg/L) 0 -- -- -- -- -- -- --
Fluoride 15 2.4 19 8.2 .01 .19 .03 No
Iron (µg/L) 1 4.6 4.6 4.6 5.0 5 5 --
Lead (µg/L) 0 -- -- -- -- -- -- --
Manganese (µg/L) 0 -- -- -- -- -- -- --
Selenium (µg/L) 2 140 140 140 4.0 4.0 4.0 --
Silver (µg/L) 0 -- -- -- -- -- -- --
Zinc (µg/L) 5 .00 22 21 .00 27 14 No
56 Ground-Water Quality in the Upper Santa Cruz Basin, Arizona, 1998
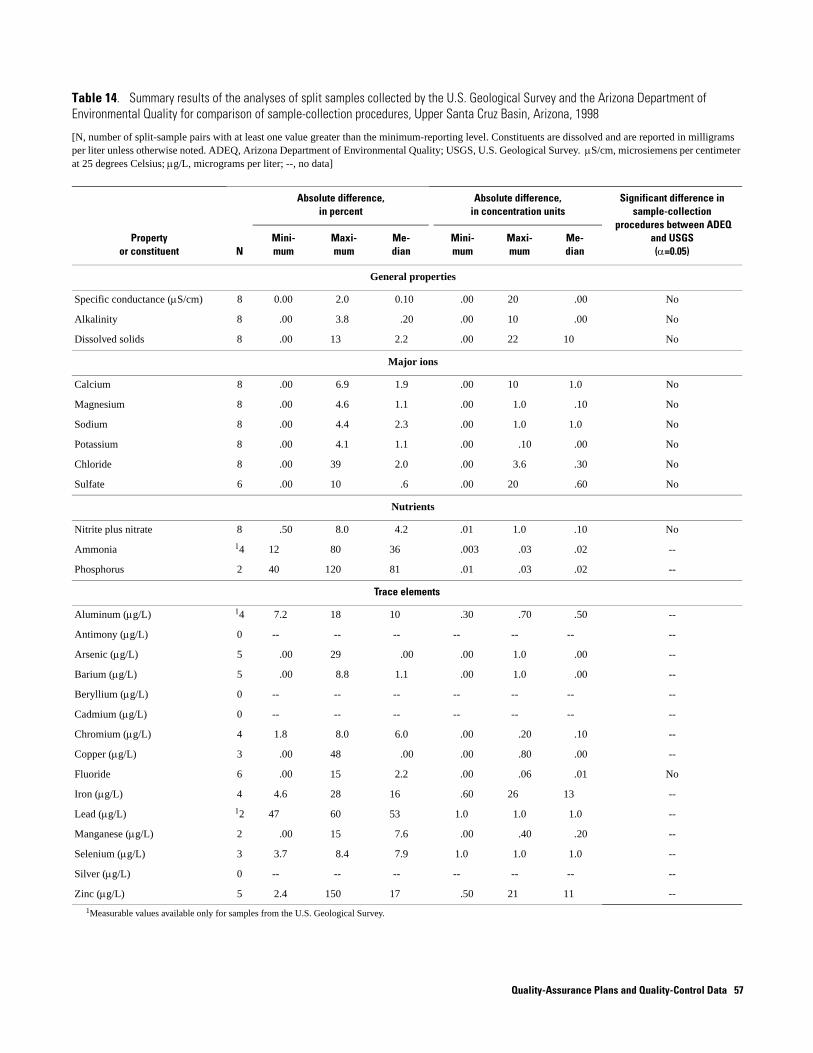
Table 14. Summary results of the analyses of split samples collected by the U.S. Geological Survey and the Arizona Department of Environmental Quality for comparison of sample-collection procedures, Upper Santa Cruz Basin, Arizona, 1998
[N, number of split-sample pairs with at least one value greater than the minimum-reporting level. Constituents are dissolved and are reported in milligrams per liter unless otherwise noted. ADEQ, Arizona Department of Environmental Quality; USGS, U.S. Geological Survey. µS/cm, microsiemens per centimeter at 25 degrees Celsius; µg/L, micrograms per liter; --, no data]
Propertyor constituent N
Absolute difference, in percent
Absolute difference, in concentration units
Significant difference in sample-collection
procedures between ADEQ and USGS (α=0.05)
Mini-mum
Maxi-mum
Me-dian
Mini-mum
Maxi-mum
Me-dian
General properties
Specific conductance (µS/cm) 8 0.00 2.0 0.10 .00 20 .00 No
Alkalinity 8 .00 3.8 .20 .00 10 .00 No
Dissolved solids 8 .00 13 2.2 .00 22 10 No
Major ions
Calcium 8 .00 6.9 1.9 .00 10 1.0 No
Magnesium 8 .00 4.6 1.1 .00 1.0 .10 No
Sodium 8 .00 4.4 2.3 .00 1.0 1.0 No
Potassium 8 .00 4.1 1.1 .00 .10 .00 No
Chloride 8 .00 39 2.0 .00 3.6 .30 No
Sulfate 6 .00 10 .6 .00 20 .60 No
Nutrients
Nitrite plus nitrate 8 .50 8.0 4.2 .01 1.0 .10 No
Ammonia 14 12 80 36 .003 .03 .02 --
Phosphorus 2 40 120 81 .01 .03 .02 --
Trace elements
Aluminum (µg/L) 14 7.2 18 10 .30 .70 .50 --
Antimony (µg/L) 0 -- -- -- -- -- -- --
Arsenic (µg/L) 5 .00 29 .00 .00 1.0 .00 --
Barium (µg/L) 5 .00 8.8 1.1 .00 1.0 .00 --
Beryllium (µg/L) 0 -- -- -- -- -- -- --
Cadmium (µg/L) 0 -- -- -- -- -- -- --
Chromium (µg/L) 4 1.8 8.0 6.0 .00 .20 .10 --
Copper (µg/L) 3 .00 48 .00 .00 .80 .00 --
Fluoride 6 .00 15 2.2 .00 .06 .01 No
Iron (µg/L) 4 4.6 28 16 .60 26 13 --
Lead (µg/L) 12 47 60 53 1.0 1.0 1.0 --
Manganese (µg/L) 2 .00 15 7.6 .00 .40 .20 --
Selenium (µg/L) 3 3.7 8.4 7.9 1.0 1.0 1.0 --
Silver (µg/L) 0 -- -- -- -- -- -- --
Zinc (µg/L) 5 2.4 150 17 .50 21 11 --
1Measurable values available only for samples from the U.S. Geological Survey.
Quality-Assurance Plans and Quality-Control Data 57