Northern European Possibilities for Ground Validation of Snowfall

GROUND-WATER QUALITY DATA FROM THE NORTHERN
MISSISSIPPI EMBAYMENT--ARKANSAS, MISSOURI, KENTUCKY,
TENNESSEE, A ND MISSISSIPPI
U.S. GEOLOGICAL SURVEY
Open-File Report 85-683

GROUND-WATER QUALITY DATA FROM THE NORTHERN MISSISSIPPI EMBAYMENT--ARKANSAS, MISSOURI, KENTUCKY, TENNESSEE, AND MISSISSIPPI
J. V. Brahana, T. 0. Mesko, J. F. Busby, and T. F. Kraemer
U.S. GEOLOGICAL SURVEY
Open-File Report 85683
Nashville, Tennessee 1985

UNTTED STATES DEPARTMENT OF THE INTERIOR
DONALD PAUL HODEL, Secretary
GEOLOGICAL SURVEY
Dallas L. Peck, Director
For additional information Copies of this report can be write to: purchased from:
District Chief U.S. Geological Survey A-413 Federal Building U.S. Courthouse Nashville, Tennessee 37203
Open-File Services Section Western Distribution Branch U.S. Geological Survey Box 25425, Federal Center Lakewood, Colorado 80225 (Telephone: (303) 236-7476)

CONTENTS
Abstract ................................................ Introduction ............................................ Data collection ......................................... Selected references .....................................
Figure 1.
2.
Table 1.
2.
3.
4.
5.
6.
ILLUSTRATIONS Map showing location of wells where ground-
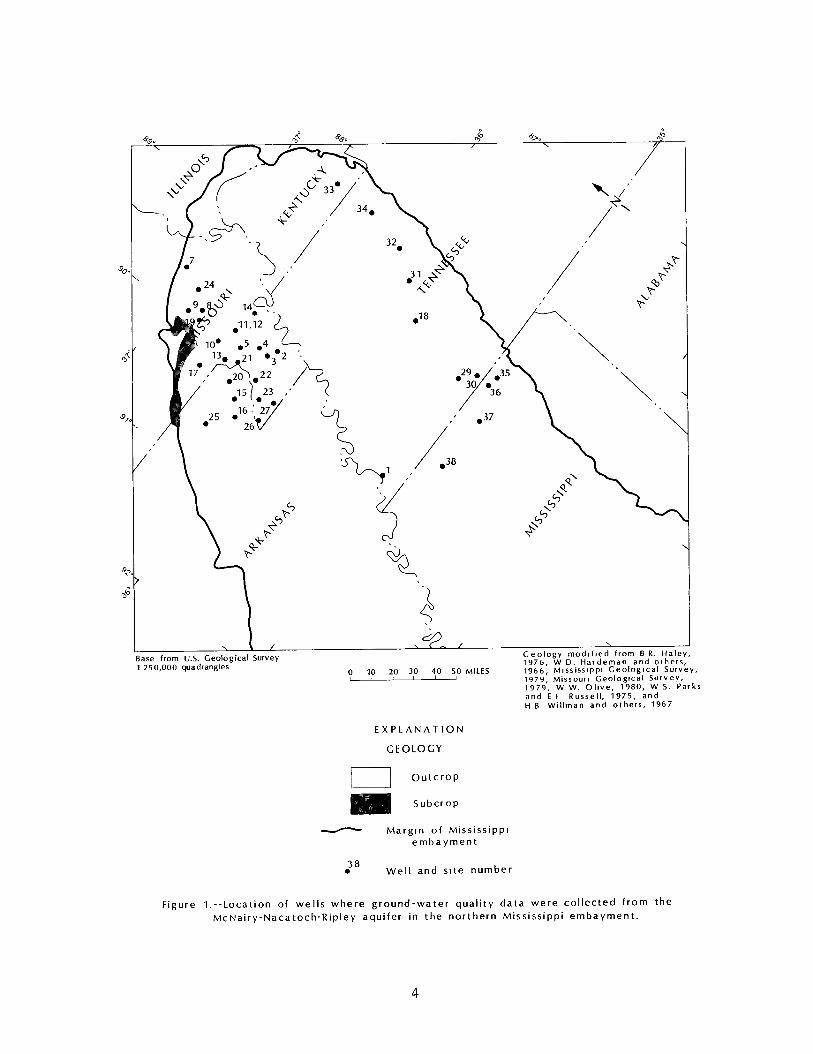
water quality data were collected from the McNairy-Nacatoch-Ripley aquifer in the northern Mississippi embayment..................................
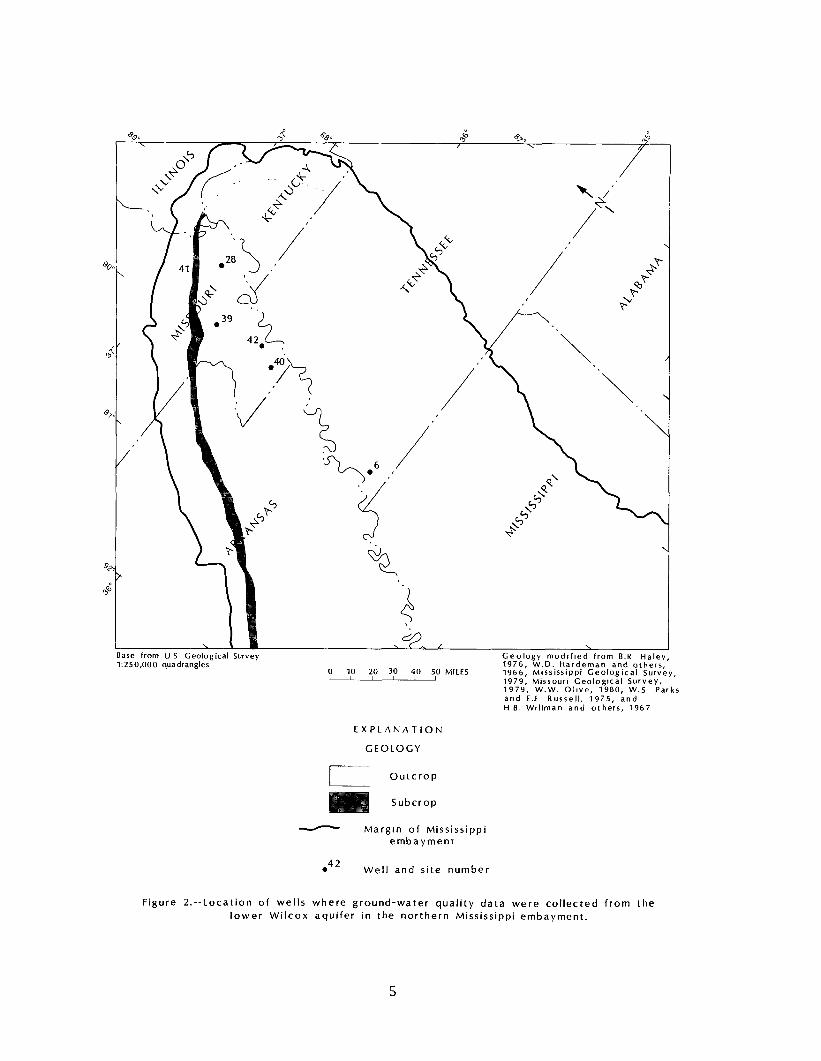
Map showing location of wells where ground- water quality data were collected from the lower Wilcox aquifer in the northern Mississippi embayment......................
TABLES Description of wells where ground-water
quality data were collected................ Concentrations of major constituents and
properties in water from selected wells.... Concentrations of trace constituents
in water from selected wells............... Data describing stable and unstable isotopes
of low mass (H, C, 0, S) in water from selected wells........................
Data describing unstable isotopes of high mass (Rn, Ra, U) in water from selected wells......................................
Concentrations of dissolved gases in water from selected wells........................
Page 1 1 2
14
4
5
10
12
13
CONVERSION FACTORS To convert inch-pound units in this report to equivalent
metric units, multiply by the following factors:
Multiply To obtain -- BY ---
foot (ft> 0.3048 meter cm> gallons per day (gal/d) 3.785 picocuries (pCi>
liters per day (l/d) 27.0 disintegrations per second
Temperature in degrees Celsius (“C) can be converted to degrees Fahrenheit (OF) as follows:
OF = 1.8OC + 32.
iii

GROUND-WATER QUALITY DATA FROM THE NORTHERN MISSISSIPPI EMBAY MENT--ARKANSAS, MISSOURI,
KENTUCKY, TENNESSEE, AND MISSISSIPPI
J. V. Brahana, T. 0. Mesko, J. F. Busby, and T. F. Kraemer
ABSTRACT
Forty-five analyses of ground-water quality from 42 selected wells in the McNairy-Nacatoch-Ripley and lower Wilcox aquifers of the northern Mississippi embayment have been compiled as part of the Gulf Coast Regional Aquifer System Analysis (RASA) project of the U.S. Geological Survey. Thirty-seven wells were sampled during the period October 1983 to September 1984 specifically for this RASA study; three of these wells were sampled twice. Five wells were sampled during the period January 1981 to March 1985 for other projects. All 45 analyses are included herein as a single data base that will be used for geochemical modeling of mineral saturation and mass transfer in the McNairy-Nacatoch- Ripley aquifer.
The report contains two figures, six tables of data, and a brief documentation of the methods used for sample collection and analysis. The figures are maps showing locations of sampling sites for each of the two aquifers. The tables of data include (1) well descriptions and (2) concentrations of major constit- uents, trace constituents, dissolved gases, stable and unstable isotopes of low mass (C, H, 0, and S>, and unstable isotopes of high mass (Rn, Ra, and U).
INTRODUCTION
The objective of this report is to summarize ground-water quality data collected from the McNairy-Nacatoch-Ripley and the lower Wilcox aquifers of the northern Mississippi embayment. These aquifers are part of the Gulf Coast Regional Aquifer Sys- tems Analysis study and comprise the lowermost aquifers of the Mississippi embayment aquifer systems (Grubb, 1984). Samples from 37 wells were collected from October 1983 to September 1984; three wells were sampled twice. In addition to the 37 wells, water-quality data for four additonal wells from northern Mississippi in the Ripley Formation (McNairy-Nacatoch-Ripley aquifer) (Lee, 1984) and for one well from Memphis, Tennessee,

in the Fort Pillow Sand (lower Wilcox aquifer) (Graham and Parks, 1985) collected during other studies are included in this report.
Descriptive data for the wells have been compiled in table 1, and water-quality data are included in tables 2 through 6. The location of the 36 wells in the McNairy-Nacatoch-Ripley aquifer are shown in figure 1 and six wells in the lower Wilcox aquifer are shown in figure 2. Boundaries of each aquifer are shown in the appropriate figure. Most of the wells sampled are high capacity municipal, public supply, or industrial wells, wit1 average pumpage exceeding 10,000 gal/d. These wells were selected based on hydrologic, geologic, and geochemical information. The primary criteria for site selection were:
‘1
(1) Alignment of wells along predefined flow lines determined from potentiometric maps;
(2) Location of a well within or adjacent to a geochemical or thermal anomaly identified by previous water-quality sampling;
(3) Location of a well in a part of the aquifer where little or no previous geochemical data were available, particularly in the suspected discharge area; and
(4) Location of a well near known geologic or hydrologic discontinuities.
/ DATA COLLECTION
The ground-water samples were analyzed by laboratories of the Geological Survey in’Arvada, Colorado; Doraville, Georgia;
Reston, Virginia; and the National Space and Technology Labo- Sulfur isotope data were analyzed by Global
California. Samples were collected, usi:g established procedures (Skougstad and
1979; Claassen, 1982). Temperature, pH, and alkalinity field (table 2) (Wood, 1976). The pH
values were measured to +0.02 units but are reported to one decimal place in accordance with standard U.S. Geological Survey reporting procedures. Temperature was measured to the nearest O.lOC, but is‘ reported to the nearest O.SOC, also in accordance with Geological Survey reporting standards.
Ion chromatography was used to determine the major anions (Erdmann and others, 1982). Trace-constituent concentrations (table 3) were determined by usin
7 inductively coupled plasma
atomic emission spectroscopy (ICP . The stable and radioactive low mass isotope samples, which included hydrogen, carbon, oxygen, and sulfur, were collected according to previously estab- lished methods within the Geological Survey (table 4) (Busby and others, 1983). The high mass radionuclides, which included radon, radium, and uranium, were collected using the methods of
2

Site No.
Table l.--Description of wells where ground-water quality data were collected
[Screened interval and well depth are measured as feet below land surface]
Geologic Screened Well Site name Local well No. Site ID Date unit interval depth
Arkansas
15 Rector T19NRO7E23DBCl 16 Lafe T18NK06t14CCDl 20 Piggott T2ONR08tlSBAAl 25 Knobel T19NR04E13BDBl
2
3 Pascola L FWSD#21 T19NRllE23DBDl 4 Wardell TZUNKllE24CDDl 5 Gideon TZlNRllEl9BBBl 7 Oran T28NR13E18DBBl 8 Essex TZSNRllEl5BBCl 9 Bloomfield T26NRlOE23AACl
10 Malden (ff4) T23NRlOE28ADDl
11 Risco (#l T22NRllEl3BABl 12 Risco (#Z) T22NRllE13BAAI 13 Clarkton (ff 3) T2lNRlOE2MCBl 14 Marston T22NR13E25CBBl
17 19 21 22 23 24 26
:8' 39 40
it
Qulin Dexter (#13) Holcomb Kennett (#3) Senath (#Z) Bell City (Scherer) Cardwell (#3) Hornersville (fl2) Charleston (#41 Parma (ffl) Steele Sikeston (ff4) Hayti (#7)
T23NR28E31CBBl T25NKlOE23CDBl T20NRlOE06BDDl T18NR09E02AADl T17NR08E02DCAl T26NR12E03DAAl T16NR07E03CAA2 T16NRO9EO8ACDl T26NR16EO8AAA2 T23NRllE25ABB2 T17NRllE26ACCl T26NR14E19CDlI2 T19NR12E34CCAZ
33 Murray (#5) 363624088180401
1 Memph i s SH:O-169 6 Memphis (Buckeye) SH:P-23
18 Jackson MD:G-01 29 Grand Valley Estates HR:K-01 30 Middleton (#2) HR:G-11 31 Cedar Grove (#l) CR:B-11 32 Huntingdon (f/l) CR:N-31 34 Paris (iY1) HY:J-17
35 Mathis 36 Walnut
Hayti (#3) T19NR12E34CCAl 361415089450201 10/12/83 McNairv Sand 10/14/84 ’
361600089495001 10/12/83 McNairy Sand 362103089485201 10/13/83 McNairy Sand 362705089544801 10/13/83 McNairy Sand 37LJ500089390102 10/25/83 McNairy Sand 364850089514001 10/26/83 McNairy Sand 365316089555701 10/26/83 McNairv Sand 363605089585501 10/27/83 M&airy Sand
11/01/83 363309089492001 10/27/83 M&airy Sand 363308089490801 08/02/84 McNairy Sand 362917090042701 11/01/83 McNairy Sand 363107089363401 11/02/83 M&airy Sand
08/02/84 363542090144501 11/03/83 McNairy Sand 364729089564701 07/25/84 McNairy Sand 362418090013101 07/26/84 fikNairy Sand 361405U90031501 07/30/84 McNairy Sand 360811090094901 07/30/84 McNairy Sand 365529089443801 07/31/84 McNairy Sand 360245090181501 08/01/84 McNairy Sand 360225090064001 08/03/84 M&airy Sand 365533089205701 09/27/84 Wilcox Group 363645089490501 09/26/84 Wilcox Grouo 360509089495001 09/25/84 Eocene series 365939089352802 09/26/84 Wilcox Group 361418089450201 09/25/84 Wilcox Group
Kentucky
E-3 (ALOXN) B-7 (TIPPAH)
345600088482601 01/08/81 Kipley Formation 345657088534901 01/08/,81 Ripley Formation
361552090172801 11/02/83 Nacatoch Sand 361118090242201 11/03/83 Nacatoch Sand 362225090120801 07126184 Nacatoch Sand 361909090355902 08/01/84 Nacatoch Sand
Missouri
363624088180401 08/16/84 McNairy Sand
Tennessee
350908090014601 10/11/83 Ripley Formation 350930089574501 03/07/85 Fort Pillow Sand 353654088495701 07/24/84 McNairy Sand 350819089001801 08/15/84 McNairy Sand 350258088532901 08/15/84 McNairy Sand 354904088355001 08/16/84 McNairv Sand 360010088252901 08/16/84 McNairy Sand 361804088194501 08/17/84 McNairy Sand
Mississippi
-- 1114 -- 1022
981-1062 1062 -- 372
2130-2153 2153 --
1900-1940 1940 1637-1720 1720 1214-1308 1308
3u-90 90 -- 475
252-272 272 -- 860
949-1160 1160 -- 1100
1146-1227 1227 1596-1650 1650
284-324 324 303-373 373
1175-1245 1245 1447-1600 1600 1655-1715 1715
-- 300 -- 1642
1809-1846 1846 -- 425
415-475 475 -- 6UO
315-375 375 1255-1305 1305
164-214 214
2626-2656 2656 1334-1414 1414
-- 529 -- -- -_ 255 -- 350
214-274 214 350-400 400
-- 125 117-147 147
37 Ashland H-10 [BEN'IUNJ 345100089104803 01/07/81 Ripley Formation 740-920 920 38 Byhalia D- 5 u4AKSHALL) 345220089462301 01/07/81 Kipley Formation 1550-1640 1640
3
I \ /
Base from U.S. Geological Survey
1 250,000 quadrangles
/ \ Geology modlfled from 6 R. Haley,
1976, W D. Hardeman and others,
0 10 20 30 40 50 MILES 1966, Mlssisslppl Surve Ceolog~cal I fi 1 1 1 1 1979, Missour Ceologrcal Survey,
1979, w w. Olive, 1980, W 5. Parks and E E Russell, 1975, and H B Willman and others, 1967
EXPLANATION
GEOLOGY
outcrop
Subcrop
Margln of Mississippl embayment
38 . Well and site number
Figure I.--Location of wells where ground-water quality data were collected from the McNairy-Nacatoch-Ripley aquifer in the northern Mississippi embayment.
4
0 10 20 30 40 50 MILES / I , I I
EXPLANATION
GEOLOGY
Outcrop
Subcrop
Margin of Mississippi embayment
42 . Well and site number
Geology modtfled from B.R Haley, 1976, W.D. Hardernan and others, 1966, MlSsiSsippi Geological Survey, 1979, Missowl Ceolog~cal Survey, 1979, W.W. Olive, 1980, W.S Parks and E.E Russell, 1975, and H B. Wtllman and others, 1967
Figure 2.--Location of wells where ground-water quality data were collected from the lower Wilcox aquifer in the northern Mississippi embayment.
5
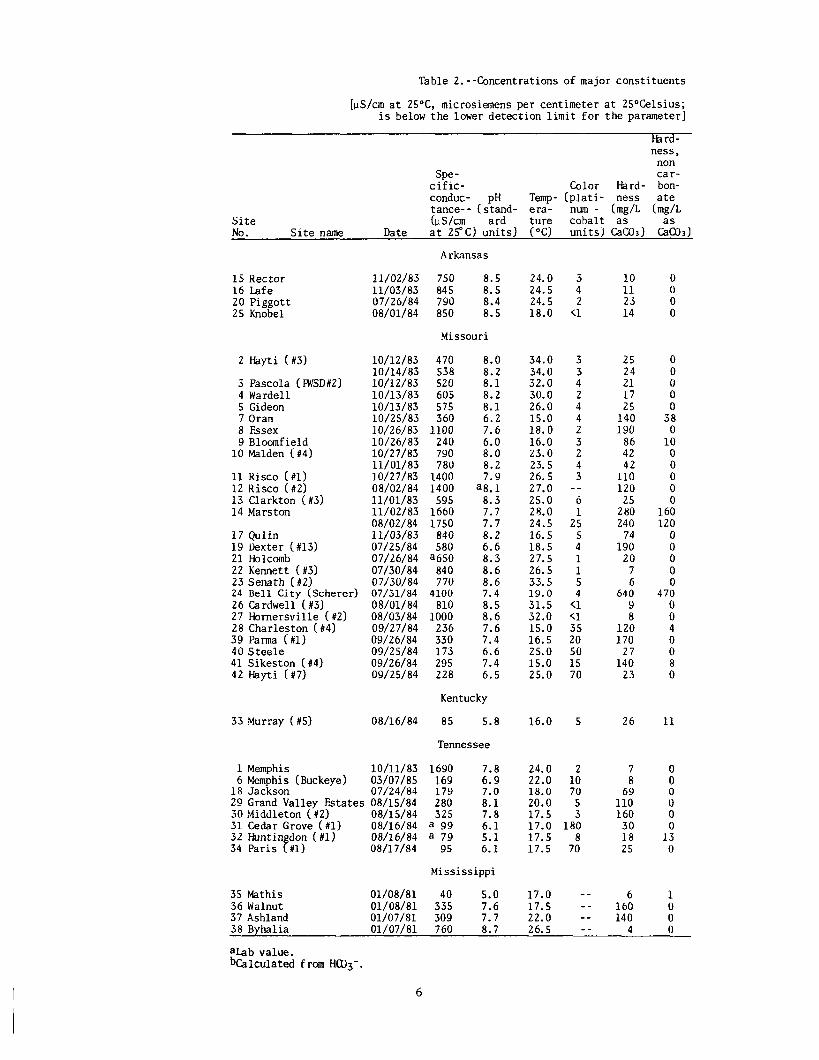
Table 2. --Concentrations of major constituents
[US/cm at 2S°C, microsiemens per centimeter at ZS%elsius; is below the lower detection limit for the parameter]
Site No. Site name Date
Hard- ness,
non Spe - car-
cific- Color Hard- bon- conduc- pH Temp- (plati- ness ate tance-- (stand- era- num - (mg/L (mg/L (us/cm ard ture cobalt as at 25°C) units) (“0 units) CaCO3) &&I
15 Rector 16 Lafe 20 Piggott 25 Knobel
23
2
Senath ( #2)
Hayti (#3)
3 Pascola (FWSD#Z)
24
4
Bell City (Scherer)
Wardell 5 Gideon
26
7 Oran
Cardwell (#3)
8 Fssex
27
9
Homersville (#2)
Bloomfield 10 Malden (#4)
11
28
Risco (#l)
Charleston (#4)
12 Risco (#2)
39
13
Parma (#l)
Clarkton (#3) 14 Marston
17
40 Steele
Qulin 19 Dexter (#13)
41
21
Sikeston (#4)
Holcomb 22 Kennett -( #$I
42 Hayti (#7)
Arkansas
11/02/83 750 8.5 11/03/83 845 8.5 07/26/84 790 8.4 08/01/84 850 8.5
?lissouri
10/12/83 470
07,‘30/84
10/14/83
770
538 10/12/83 520
07/31/84
10/13/83 605 10/13/83
4100
575 10/25/83 360
08/01/84
10/26/83 1100 10/26/83 240
810
10/27/83 790
08/03/84
11/01/83
1000
780 10/27/83 1400 08/02/84 1400 11/01/83
09/27/84
595
236
11/02/83 1660 08/02/84 1750
09/26/84
1 l/03/83 840 07/25/84
330
580 07/26/84 a650
09/25/84
07/30/84
173
840
09/26/84 295 09/25/84 228
33 Murray (#5) 08/16/84
1 Memphis 10/11/83 6 Memphis (Buckeye) 03/07/85
18 Jackson 07/24/84 29 Grand Valley Estates 08/15/84 30 Middleton ( #2) 08/15/84 31 Cedar Grove (#l) 08/16/84 32 Huntin don (#lI 08/16/84 34 Paris P #l) 08/17/84
35 Mathis 01/08/81 40 5.0 36 Walnut 01/08/81 335 7.6 37 Ashland 01/07/,81 309 7.7
8.0 8.2 8.1 8.2 8.1 6.2 7.6 6.0 8.0 8.2 7.9
a8.1 8.3 7.7 7.7
68:: 8.3 8.6 8.6
;-“5 816 7.6 7.4 6.6 7.4 6.5
Kentucky
85 5.8
Tennessee
1690 169 z4 179 7:o 280 8.1 325 7.8
a 99 6.1 a 79 5.1
95 6.1
Mississippi
24.0 3 10 24.5 4 11 24.5 2 23 18.0 (1 14
34.0 3 34.0 32.0 43 30.0 2 26.0 4 15.0 4 18.0 2 16.0 3 23.0 2 23.5 4 26.5 3 27.0 -- 25.0 . 28.0 Y 24.5 25 16.5 18.5 45 27.5 1 26.5 1 33.5 5 19.0 31.5 (“1 32.0 (1 15.0 35 16.5 20 25.0 50 15.0 15 25.0 70
25 24 21 17 25
140 190
86 42 42
110 120
25 280 240
74 190
20 7 6
640 9 8
120 170
27 140
23
16.0 5 26
24.0 22.0 1: 18.0 70 20.0 5 17.5 17.0 18; 17.5 8 17.5 70
i 69
110 160
30 18 25
17.0 -- 6 17.5 -- 160 22.0 -- 140 26.5 -- 4 38 Byhalia 01/07/81 760 8.7
aLab value. bCalculated from HaD3-.
0 0
8
8
ii 0
38 0
10 0
i
8 160 120
0
8 0 0
470
8 4
i
:
11
8
0” 0 0
13 0
1 0 0 0
6

and properties in water from selected wells
mg/L, milligrams per liter; < signifies the concentration
Po- Sul- Sil- Cal- Magne- Sodi- tas- Alka- fate, Chlo- Fluo- ica, cium, sium,
d?? sium, linity, dis- ride, ride, dis- Solids,
dis- dis- dis- field solved dis- dis- solved residue solved solved solved solved bag/L (mg/L solved solved (mg/L at (mg/L (mg/L (mg/L (mg/L as Ca) as Mg) as Na) as K) C%,,
(mg/L (mg/L %+) as Cl) as F)
2.5 0.76 190 2.9 .73 210 6.5 1.7 180 3.8 1.0 210
7.8 1.3 7.4 1.2 6.5 1.1 5.2 .81 7.4 1.4
36 13 51 14 22 12 5:: 12 2.8 33 6.6 37 7.5
7.1 1.7 76 20 60 22 20 5.5 50 16
6.0 1.3 2.3 .40 1.9 .30
170 52 2.8 .50 2.4 .40
35 7.0 48 11
7.3 2.2 42 8.5
5.8 2.1
6.0 2.7 4.2 0.7
1.9 .57 380 2.1 1.8 .80 38 1.2
19 5.2 5.2 6.2 28 8.8 16 3.8 55 6.1 3.9 1.8
4.8 4.3 1.3 4.3 3.8 2.1 3.7 0.9 5.8 2.5 2.8 2.4
1.3 .6 58 4.9
2.0 2.4
0.5 1.5 1.9
bs o p176 5.81
1.92 1.1 1.43
<.l
5.0 <.l
.l <.1
.l
.l <.l c.1
0 0
.2
15
12 12 35 17 19 19
88::
t: 19
34 202 184 47 4.8 8.4 n157 8.6
1.3 .29 190 1.4 b394 4.97 1.41 .45 13 470
120 120 110 140 120 16
150 13
150 150 220 230 120 220 230 160 48
140 210 190 510 190 260
5.3 10 29
7.8 38
2.2 2.1
::i
2.5 2.4 2.4 2.3 2.7 2.6
0”:: 3.9 4.0 5.8
;:i 12 11
45:: 2.8 2.2 1.8
18 1.9 2.0 1.0 1.8 4.5 1.5 4.7
Arkansas
369 6.8 31 0.5 12 478 429 7.4 29 .6 12 539 306 7.7 74 .4 11 456 402 5.3 42 .7 10 513
Missouri
242 7.5 21 250 6.9 15 196 9.2 37 277 6.5 23 216 9.7 44 106 48 10 220 21 210
76 27 5.0 212 14 110 214 14 110 144 51 310
al38 52 310 229 9.6 46 115 38 470 118 36 450 223 18 140 270 14 53 276 7.3 46 474 0.8 6.7 356 9.9 42
1; .5 .3 .3 .2
1.1 .2 .4 .4 .2 .2 .3
1.0 1.0
146 .3 .4 .4
1.1 .4 .6 .2 .30 .lO .3 .1
15 321 15 336 14 309 14 370 12 342 30 228
9.3 601 22 153 10 433 10 438 12 722 12 742 12 347 13 992
6.4 918 9.9 490
10 309 12 375 13 517 15 461
9.8 2220 13 474 14 625 21 129 16 175 11 104 16 159 11 128
167 42 1200 332 12 554 4.6 112 6.9 176 3.6
85 10 131 10 100’ 16
Kentucky
15 19
Tennessee
755 5.1 88 4.6
120 24 378 10 166 15 39 26 325 10 22
Mississippi
62 7.8 3.5 1.6 2.4 5.2 1.5
1.4
8.0 .8
1.7 1.0 1.7 1.5 1.4 1.8
44
1010 114 12ll 156 189
58 37 42

Table 3. --Gncentrations of trace con
[ug/L, micrograms per liter; < signifies the concentration
Aluminum, Arsenic, Barium, Beryllium, Boron, Cadmium, Chromiu% CoPPer, dis- dis- dis- dis- dis- dis- dis- dis-
solved solved solved solved solved solved solved solved Site (L&L (NdL (N/L (!Jg/L (M/L WL (l&L (N/L No. Site name Bate as Al) as As) as Ba) as Be) as B) as Cd) as Cr) as Cu)
15 Rector 11/02/83 16 Lafe 11/03/83 20 Piggott 07/26/84 25 Knobel 08/01/84
2 Hayti (83)
3 Pascola (FWSDU2) 4 Wardell 5 Gideon 7 Oran 8 Essex 9 Bloomfield
10 Malden (#4)
11 Risco (#l) 13 Clarkton (#3) 14 Marston
17 Qulin 19 Dexter (t13) 21 Holcomb 22 Kennett (df3) 23 Senath (#2) 24 Bell City (Scherer) 26 Cardwell (#3) 27 Homersville (#2) 39 Parma (#l) 40 Steele - 42 I-tayti (#7)
33 Murray (t5) 08/16/84
1 Memphis 6 Memohis (Buckeye)
18 Jackson ’ 29 Grand Vallev Estates 30 Middleton (i2) 31 Cedar Grove (#l) 32 Hunti don (Ifl) 34 Paris ? #l)
30 (10 <lO (10
:oo <lo <lo
10 <lo
10 (10 <lo
10 <lo 10 10
<lo 10
(10 10 10
<lo <lo <lo (10 (10 <lo <lo
20
10 --
<lo <IO
20 10 40 10
10 0 0
CO.5 < .5 <l
1
:i .5
<.5 c.5 <.5 <.5 <.5 <.5
.5 C.5
.5 <.5 -- .7
(1 <l (1 <l 10 <l <l
-- --
<2
<l
c.5 _- <l (1 <l (1 <l <l
a <l (1
10
2000 -- 20 30 10
(10 <lO 10
8 0
(10 <lo (10 <lo
(10 (10 <lO <lo (10 <lO (10 <lo (10 GO
10 10 10
(10 10
Cl0 Cl0 (10 <lo (10 <lO (10 a0 (10 (10
(10
a0 i10 (10 (10 <lO (10 (10 (10
(10 (10 (10
35 Mathis 01/08/81 -- 10 <1 36 Walnut 01/08!8l mm 40 3 37 Ashland 01/07/81 -- 50 2 38 Byhalia 01/07/81 0 mm a (1 440 3 (10
10/12/83 lO/l4/83 10/12/83 10/13/83 10/13/83 lO/25/83 10/26/83 10/26/83 10/27/83 ll/O1/83 1 O/27/83 ll/O1/83 ll/O2/83 08/02/84 H/03/83 07/25/84 07/26/84 07/30/84 07/30/84 07/31/84 08/01/84 08/03/04 09/26/84 09/25/84 09/25/84
10/11/83 03/07/85 07/24/84 08/15/84 08/15/84 08/16/84 08/16/84 08/17/84
: 120 160
<l 33 <l 47
840 2 870 (1 310 (1 560 1
Missouri
1 25 150 (1 1 22 150 (1
: :08 280 <1 190 (1
1 29 140 <l 1 400 100 <l 1 300 400 <1 2 89 20 (1 1 100 220 <l : 140 130 230 (1
170 <l 1 ,160 600 2 1 250 380 1
<l 220 270 (1 2 110 300 (1
(1 81 90 1 <l 25 190 (1 <l 42 450 <l <l 350 1 2 350 1
(1 58 340 (1 6 36 650 <l
380 140 3”:
<l 2
<l 120 30 <2
Kentucky
<l 24 <l
Tennessee
1 21 (1 (1 39 -- (1 70 <l 1 62 <I
<l 68 <l <l 65 2 <l 44 (1 <1 86 <I
Mississippi
Arkansas
(1 1 1 2
2 <l <l 1 1 2 1
<l (1 (1 (1 30 <l (1 <l 1 1
(1 1 1 1 1
a (1
1
<l
2 (10
1 \l Cl <l
6 <l
-- -- -- --

stituents in water from selected wells
is below the lower detection limit for the parameter]
Molyb- Iron, Lead, Lithium Manganese Mercury denum Nickel Selenium Silver Strontium Vanadium Zinc dis- dis- dis- dis- dis- dis- dis- dis- dis- dis- dis- dis-
solved solved solved solved solved solved solved solved solved solved solved solved (lJg/L (!Jg/L (M/L WL (kg/L (pg/L (l&L (a/L (L&L as Fe) as Pb) as LiI asMn) as Hg) asMo) as Ni) as Se1 as Ag) ?&) %'k) !!!:k]
15 27 19 35
<l 2
(1 1
2 1 2 2
54 48 76 58 35
250 440 800 110 59
480 74
990 250 83
860 37 44
84240 37 38
1300 3500 3100
2 3 1
<1 1 2
Cl
22 5 1
17 2
Cl 43 2
<l 1
<l
: 1 1
<l 1
33 32 32 35 36 6
150 4
54 60 84 43
210 200 76 47 35 22
3;: 23 25
350 29
12 10 10 7
2360 44
220 6 4
27 6
48 52 4
97 2 2 6
90 2 2
470 84 63
1800 3 6 60
845"o 3600 150 360 18
2600 5800
3 61 <l -- Xl 18 <1 16 <l 11 <l 39 <l 11 <l 9
<1 37
130 51
26; 42 51
6:: 280 14
16 26
;26
4 11 5
37
2 22 4
CO.1 Cl <.l <.l
<.l <.l Cl <.l <.l <.l <.l <.l C.1 <.l <.l Cl Cl <.l <.l <.l <.l <.l <.l <.l <.l <.l <.l C.1 <.l
Cl
<.l <.l <.l <.l <.l <.l <.l <.l
<.l <.l <.l C.1
Arkansas
3 (1 3 <l
<l (1 <l (1
Missouri
<l 1 <l <l 1 <l 2 (1
<l 1 <l 5 1 1
t1 1 2 <l 1 <l 1 Cl
t <l 1
2 Cl 2 <l
(1 (1 Cl (1 <l <l <l 1 <l 1 Cl <l <l 2 2 <l
<l Cl (1 Cl
Kentucky
<l <l
Tennessee
3 <l -- _- (1 <1 Cl <l (1 (1 <l <l Cl <l <l 3
Mississippi
10 -- 10 -- 10 --
<1 <l <l <l
Cl <l (1 (1 <I <l (1 <l <l (1 <l <l <l <l <l (1 (1 <1 (1 Cl (1 (1 <l Cl Cl
(1
(1 -- <l <l <l <l <l <l
0 0 0
10 __ 0
<l <l <l Cl
<l <l <l Cl <l <l <1 <l <l (1 <l Cl Cl <l <l Cl Cl <l (1 (1 (1 <l (1 Cl Cl
Cl
<l _- Cl (1 Cl 1
<l (1
-- -_ -- -_
110 120 350 190
Cl.0 Cl.0 (1.0 1.0
210 a.0 190 Cl.0 250 Cl.0 160 <l.O 290 Cl.0 270 1.0
1700 2.0 94 <l.O
490 1.0 480 1.0
1200 3.0 310 Cl.0
2500 10 2500 12 810 1.0 820 Cl.0 280 Cl.0 120 Cl.0 67 Cl.0
6100 31 91 a.0
110 1.3 190 1.0 240 Cl.0 240 Cl.4
16 3
C3 5
45 10 10 3
(3 <3 23 15 18 (3 28 63 30 76 40 77 20 15 32 16
30 Cl.0 4
130 <l.O 76 --
540 6.6 880 <l.O 460 Cl.0 200 x1.0 37 1.7
110 a.0
4' 14 23 (3 12 10 4
4 <6 <4 220 (6 (4 460 (6 (4 52 <6 (4
9

Table 4. --Data describing stable and unstable isotopes of low mass (H, C, 0, S) in water from selected wells
[per mil, parts per thousand; pCi/L, picocuries per liter; ( signifies the concentration is below the lower detection limit for the parameter]
Site No. Site name Date
13~112~ D/H 143/160 stable stable stable 34S/32s isotope 14c isotope isotope Tritium isotope ratio percent ratio ratio total ratio
(per mil) modem (per mil) (per mil) (pCi/L) (per mil)
15
:06 25
Rector 08/01/84 Lafe 08/01/84 Piggott 07/26/84 Knobel 08/01/84
-12.0 al.2 -11.9 bl.9 -12.4 .7 -11.6 <.7
-36.0 -6.1 -34.5 -6.0
_- -- -36.5 -6.1
_- 44.1 -- 50.3 -- 40.2 -- 56.4
Missouri
2 Hayti (13)
3 Pascola (HVSDIZ) 5 Gideon 7 Oran
_- -35.5
-- __
8 Essex
9 Blocanfield
10 Malden (84) 11 Risco (#I)
13 Clarkton ( #3) 14 Marston
17 19 22 21 23 24
2”; 28
:90 41 42
Qulin Dexter (113) Kennett ( 13) Holcomb Senath (112) Bell City (Scherer) Cardwell (#3) Homersville (8.2) Charleston ( W4) Panna (#l) Steele Sikeston (#4) Hayti (#7)
10/12/83 -13.1 08/02/84 -13.2 10/12/83 -16.6 10/13/83 -13.2 10/25/83 -16.1 07/24/84 -17.2 10/26/83 -13.3 07/25/84 -12.4 10/26/83 -17.3 07124184 -19.2 11/01/83 -13.4 10/27/83 -14.1 08/02/84 -14.4 11/01/83 -13.7 11/02/83 -- 08/02/84 -11.5 11/03/83 -12.7 07/25/84 -12.5 07/30/84 -11.9 07/26/84 -13.9 07/30/84 -11.6 07/31/84 -13.3 08/01/84 -12.5 08/03/84 -11.6 09/27/84 -11.4 09/26/84 -14.3 09/25/84 -14.6 09/26/84 -13.5 09/25/84 -16.3
1.2 .7
c2.1 3.2
85.9 --
2.1 --
48.3 -_
1.6 4.4 --
1.2
3.2’ di2
5.8 <.7
.7
.7 3.3
.7
.7 --
47.9 5.5
46.2 8.1
-- -36.5
-- -37.5
-- -32.0 -35.5
-- -35.0 -36.5
-- -34.5 -37.0 -35.5 -36.0 -36.0 -36.0 --
-35.0 -34.5 -38.0 -33.5 -38.0 -39.0 -51.0
_- -- -6.0 --
-- -- __ _- -- --
-6.0 -- -- --
-6.3 -- -- --
-5.4 -- -6.1 --
-- -_ -6.1 -- -6.1 --
-- -- -5.9 __ -6.1 _- -6.0 -- - 6.3 3.0 -6.1 -- -6.0 -- -- -- -5.9 -- -6.1 -- -6.1 Cl.0 -5.5 Cl.0 - 6.4 1.0 -6.2 6.0 -6.8 2.0
Tennessee
it
ti 30 31 34
Memphis 10/U/83 Memphis (Buckeye) 03/07/85 Jackson 07/24/84 Grand Valley Estates 08/15/84 Middleton ( #2) 08/l S/84 Cedar Grove (#l) 08/16/84 Paris (#l) 08/17/84
e-g.1 .7
-15.1 -17.0 47:: -- _-
-11.5 3.4 -- --
-19.3 24.6
Mississippi
me _- -- --
-38.0 -6.2 -- --
-27.5 -5.0 -- --
-37.5 -6.1
35 36 37
Mathis Walnut Ashland
01~08~81 01/08/81 01/07/81
-19.3 86.1 -30.0 -12.4 25.8 -29.0
-5.0 -5.2 -5.2 - _
_- -_
a.0 --
2.0 -- --
43.0 3.0 3.0 -13.2 16.7 -30.0
38 Byhalia 01/07/81 -12.1 2.4 -32.0 -5.6 1.0
Arkansas
38.3 -_ _- -- -- mm -_
33.5 -_ -- -- --
37.6 -- -- -- _-
12.1 26.1
-- 42.8 34.9 29.7 71.9
_- -- -- -- -_
_- -_ --
-13.5 -15.6
-- 9.3
-- -- -- --
a C-14 sampled November 2, 1983. b C-14 sampled November 3, 1983. c C-14 1983. d
sampled October 14, C-14 sampled November 3, 1983.
e 613c Sampled August 11, 1977.
10

Kraemer (1981), Michel and others (19821, and Kraemer and Reid (1984) (table 5). Dissolved gas samples (table 6) were collected in an evacuated glass tube (Hobbs and others, 1977) preliminary to analysis by gas chromatography.
Most of the analytical values are in standard reporting units such as milligrams per liter or micrograms per liter. The stable isotopes carbon-13, deuterium (hydrogen-21, oxygen-18, and sulfur-34, and the low mass unstable isotopes tritium (hydrogen-3) and carbon-14 (table 4) are reported in values referred to inter- nationally recognized standards, the accepted method of reporting isotope analyses. For carbon-13, deuterium, oxygen-18, and sulfur-34 the reported value (6x) is calculated from the equation
(Fritz and Fontes, 1980)
where RX = isoto ic ratio of a sample (13C/12C, 2H/lH,
180J60, or 34~/32~) Rstd = corresponding ratio of the appropriate standard,
specifically: R,td for carbon-13 is the Pee Dee Belemnite (PDB) R,td for deuterium and oxy en-18 is the Vienna Standard Mean Ocean Water P V-SMOW> R,td for sulfur-34 is the Canyon Diablo Troilite (CD)
The 6-value is expressed in parts per thousand (per mil, or o/00>. Carbon-14 is reported as percentage of modern atmospheric carbon-14 (Fritz and Fontes, 1980). Tritium, radium, and radon are reported in picocuries per liter (pCi/L).
These data are stored in the U.S. Geological Survey’s WATSTORE data base in Reston, Virginia, and may be accessed using Geolog- ical Survey retrieval programs.
The geologic units that are the source of water to each well are listed in table 1.
11

Table 5. --Data describing unstable isotopes of high mass (Rn, Ra, U) in water from selected wells
[ng/L, microgram per liter; pCi/L, picocuries per liter; ( signifies the concentration is below the lower detection limit for the parameter]
Uranium-234/ Radium-228/ Site Uranium-238 Radium- Radon- Radium-226
No. Site name Date Uranium (activity 226 222 (lJg/L) ratio) (pCi/L) (pCi/L)
15
t S”
3 4
; 8 9
10
11 13 14 17
;32 24
f f
1 Memphis 10/11/83
Rector 11/02/83 Lafe 11/03/83 Knobel 08/01/84
Hayti (#3) Pascola (FWSDIZ) Wardell Gideon Oran Essex Bloomfield Malden (#4)
Risco (#l) Clarkton ( #3) Marston Qulin Kennett (U3) Senath (#2) Bell City (Scherer)
Cardwell (X3) Hornersville (#2)
10/12/83 10/12/83 10/13/83 10/13/83 10/25/83 10/26/83 10/26/83 10/27/83 11/01/83 10/27/83 11/01/83 11/02/83 11/03/83 07/30/84 07/30/84 07/31/84
a07/31/84 08/01/84 08/03/84
Arkansas
0.006 4.93 0.05 -- 1.7 .OlO 8.98 .09 -- 2.4 -- -- .23 -- -- Missouri
.OOl 15.5 -- -- .003 3.02 .005 4.10 -- -- .021 7.23
<.004 1 -- -- -- -- -- -- -- -- .Oll 4.29 -006 12.0 -- -- -- -- -- -- me -- -- -- -- --
.09
.18
.05
.14 1.5 3.6 1.0
.27
.45 1.2
.14 3.6
.45
.18
.27
f:f .18 .14
145 48 57 51 -- -- -- -- -- -- --
139 -- -- -- -- -- -- mm
5:: 3.9
1”:: .91 .72
3.8 -- -- --
1.9 1.4
-- --
1.0 -- -- --
Tennessee
29 Grand Valley Estates 08/15/84 30 Middleton (#2) 08/15/84 34 Paris (#l) 08/17/84 .45
aDuplicate sample
.003 3.10 -- -- -- -- -- --
.05
.27
.32
203 1.2 -- -- -- -- -- --
12

Table 6 .--Concentrations of dissolved gases in water from selected wells
[mg/L, milligram per liter; < signifies the concentration is below the lower detection limit for the parameter]
Site No.
Site name Date
Ga rbon Nitrogen, Oxygen, Argon, Methane, dioxide, Helium, dissolved dissolved dissolved dissolved dissolved dissolved (mg/LW 7s (mgt)as
2 2
(mg/L as (mgk,as Ar)
(rng& 7s 2
(mg/k;s
Arkansas
15 16
Rector Iafe
11/02/83 11/03/83
24 0.5 0.83 0.02 2.1 0.002 25 .4 .86 .02 2.4 .003
Missouri
2 53
9 14 17 23 26
Hayti (#3) 10/12/83 Pascola( L+VSD#2) 10/12/83 Gideon 10/13/83 Bloomfield 10/26/83 Marston 11/02/83 Qulin 1 l/03/83 Senath (12) 07/30/84 Cardwell( #3) 08/01/84
24 25 25 24 26
2236 20
.O?
:: 2.3
.2
:: .6
.91
.90 .91
.79
.89
.89 .a5
.71
C.01 4.0 .OOl
C.01 <.Ol 2.4 2.3 .OOl .002 -- 125 -- .2 1.9 .005
C.01 .003
.Ol 1”:: -- -- 1.0 --
Tennessee
1 Memphis 10/U/83 25 .3 .a7 3.5 5.8 .003
Mississippi
35 Mathis 01/08/81 20 10. .74 0 40.0 __ 36 Walnut 01/08/81 22 .37 .88 TR 1.0 -- 37 Ashland 01/07/81 25 .l .95 0 -- 38 Byhal ia 01/07/81 26 .37 1.0 .03 I:! --
13

SELECTED REFERENCES
Busby, J. F., Lee, R. W., and Hanshaw, B. B., 1983, Major geo- chemical processes related to the hydrology of the Madison Aquifer System and associated rocks in parts of Montana, South Dakota, and Wyoming: U.S. Geological Survey Open-File Report 83-4093, 180 p.
Claassen, H. C., 1982, Guidelines and techniques for obtaining water samples that accurately represent the chemistry of an aquifer: U.S. Geological Survey Open-File Report 82-1024, 49 p.
Erdmann, D. E., Anthony, E. R., and Perryman, G. R., 1982, 1983 Water Quality Laboratory Services Catalog: U.S. Geological Survey Open-File Report 82-766, 100 p.
Fishman, M. J., and Pyen, Grace, 1979, Determination of selected anions in water by ion chromatography: U. S. Geological Survey Water-Resources Investigations 79-101, 30 p.
Fritz, Peter, and Fontes, J. C., 1980, The Terrestrial environ- ment, part A, v. 1 of Handbook of Environmental Isotope Geochemistry: Amsterdam, The Netherlands, Elsevier Scientific Publishing Company, 545 p.
Graham, D. D., and Parks, W. S., 1985, Potential for leakage among principal aquifers in the Memphis area, Tennessee: U.S. Geological Survey Water Resources Investigations Report 85-4295, 82 p.
Grubb, H. F., 1984, Planning report for the Gulf Coast Regional Aquifer System Analysis in the Gulf of Mexico Coastal Plain, Unites States: U.S. Geological Survey Water-Resources Investigations Report 84-4219, 30 p.
Haley, B. R., 1976, Geologic map of Arkansas: Arkansas Geologi- cal Commission, scale 1:500,000.
Hardernan, W. D., Miller, R. A., and Swingle, G. D., [compilers], 1966, Geologic map of Tennessee, west and west central sheets: Tennessee Division of Geology, scale 1:250,000.
Hobba, W. A., Chemerys, J. C., Fisher, D. W., and Pearson, F. J., Jr., 1977, Geochemical and hydrologic data for wells and springs in the thermal spring areas of the Appalachians: U. S. Geological Survey Water-Resources Investigations 77-25, 41 p.
Kraemer, T. F., 1981, 234U and 238U concentration in brine from geopressured aquifers of the northern Gulf of Mexico Basin: Earth and Planetary Science Letters, v. 56, P* 210-216.
14

Kraemer, T. F., and Reid, D. F., 1984, The occurrence and behavior of radium in sal.ine formation water of the U.S. Gulf Coast region: Isotope Geoscience, v. 2, p. 153-174.
Lee, R. W., 1984, Ground-water quality data from the southeastern coastal plain, Mississippi, Alabama, Georgia, South Carolina, and North Carolina: U.S. Geological Survey Open-File Report 84-237, 20 p.
Michel J. ani ZZ8Ra ZZ6Ra 222 King, P. L and Moore, W. S., 198zheasureient Rn in South Carolina Ground Water:
Techniques and Isotopes Relationships: Clemson, South Carolina, Clemson University, Water Resources Research Institute Report No. 95, 57 p.
Mississippi Geological Survey, 1979, Geologic map of Mississippi: scale 1:500,000.
Missouri Geological Survey, 1979, Geologic map of Missouri: scale 1:500,000.
Olive, W. W., 1980, Geologic maps of the Jackson Purchase Region, Kentucky: U.S. Geological Survey Miscellaneous Investiga- tions Series I-1217, scale 1:250,000.
Parks, W. S., and Russell, E. E., 1975, Geologic map showing Upper Cretaceous, Paleocene, and lower and middle Eocene units and distribution of younger fluvial deposits in western Tennessee: U.S. Geological Survey Miscellaneous Investigations Series I-916, scale 1:250,000.
Skougstad, M. W., Fishman, M. J., Friedman, L. C., Erdmann, D. E., and Duncan, S. S., 1979, Methods for determination of inorganic substances in water and fluvial sediment: Techniques of Water-Resources Investigations of the U.S. Geological Survey, book 5, chap. A, 626 p.
Willman, H. B., and others, [compilers] 1967, Geologic map of Illinois: scale 1: 500,000.
Wood, W. W., 1976, Guidelines for collection and field analysis of ground-water samples for selected unstable constituents: U.S. Geological Survey Techniques of Water-Resources Investigations, book 1, chap. D2, 24 p.
15

.
C
r