
Grossmont College Chemistry 141 Laboratory Manual
166
Grossmont College Chemistry 141 Laboratory Manual 6th Edition
Transcript of Grossmont College Chemistry 141 Laboratory Manual

Grossmont College Chemistry 141
Laboratory Manual
6th Edition

5 16 17 18
A 6A 7A 8A
2
He4.003
7 8 9 10
N O F Ne.007 15.999 18.998 20.180
15 16 17 18
P S Cl Ar.974 32.066 35.453 39.948
33 34 35 36
s Se Br Kr.922 78.960 79.904 83.800
51 52 53 54
b Te I Xe.760 127.60 126.905 131.29
83 84 85 86
i Po At Rn.980 (209) (210) (222)
15 116 117 118
up Lv Uus Uuo88) (293) (294) (294)
69 70 71
m Yb Lu.934 173.04 174.967
01 102 103
d No Lr58) (259) (262)
Grossmont College
Periodic Table of the Elements
1 2 3 4 5 6 7 8 9 10 11 12 13 14 1
1A 2A 3A 4A 5
1
1 H1.008
3 4 5 6
2 Li Be B C6.941 9.012 10.811 12.011 14
11 12 13 14
3 Na Mg 3B 4B 5B 6B 7B 8B 8B 8B 1B 2B Al Si22.990 24.305 26.982 28.086 30
19 20 21 22 23 24 25 26 27 28 29 30 31 32
4 K Ca Sc Ti V Cr Mn Fe Co Ni Cu Zn Ga Ge A39.098 40.078 44.956 47.880 50.942 51.996 54.938 55.845 58.933 58.693 63.546 65.410 69.723 72.640 74
37 38 39 40 41 42 43 44 45 46 47 48 49 50
5 Rb Sr Y Zr Nb Mo Tc Ru Rh Pd Ag Cd In Sn S85.468 87.62 88.906 91.224 92.906 95.95 (98) 101.07 102.906 106.42 107.868 112.411 114.818 118.710 121
55 56 57 72 73 74 75 76 77 78 79 80 81 82
6 Cs Ba La Hf Ta W Re Os Ir Pt Au Hg Tl Pb B132.905 137.327 138.906 178.49 180.948 183.84 186.207 190.23 192.22 195.08 196.967 200.59 204.38 207.2 208
87 88 89 104 105 106 107 108 109 110 111 112 113 114 1
7 Fr Ra Ac Rf Db Sg Bh Hs Mt Ds Rg Cn Uut Fl U(223) (226) (227) (261) (262) (266) (264) (269) (268) (281) (272) (285) (284) (289) (2
58 59 60 61 62 63 64 65 66 67 68
6 Ce Pr Nd Pm Sm Eu Gd Tb Dy Ho Er T140.115 140.908 144.24 (145) 150.36 151.965 157.25 158.925 162.50 164.930 167.26 168
90 91 92 93 94 95 96 97 98 99 100 1
7 Th Pa U Np Pu Am Cm Bk Cf Es Fm M232.038 231.036 238.029 (237) (244) (243) (247) (247) (251) (252) (257) (2
rev. June 2012

Chemistry 141 Laboratory Manual
Compiled by J. Lehman, T. Olmstead, and D. Vance1
Grossmont College
8800 Grossmont College Dr.El Cajon, CA 92020
Prepared for printing on December 12, 2012
1. Original material by, B. Bornhorst, B. Givens, J. Lehman, J. Maley, J. Oakes, T. Olmstead, C. Park, C. Willard,
D. Vance and J. George
12-0071-168


Chemistry 14
Contents
EXPERIMENT 1 Measuring Density with Different Types of Glassware 1Objective 1Introduction 1Procedure Part A: Glassware 8Calculations and Results 9Part B: Measuring the Density of Coke and Diet Coke 10References 10Post Lab Questions 11
EXPERIMENT 2 Density: A Study in Precision and Accuracy (Part A) 13Introduction 13Theory 14Experimental Procedure 16Post Lab Questions 19
EXPERIMENT 3 Density: A Study in Precision and Accuracy (Part B) 21Validity 21The “Experiment” 25Least Squares Analysis Of Data 25
1 Grossmont College i–1

Contents
EXPERIMENT 4 Conductivity and Net Ionic Equations 27Objective 27Introduction 27Procedure 31Procedure Questions 33Post Lab Questions 37
EXPERIMENT 5 Writing Redox Reactions 41Objective 41Introduction 41Post Lab Questions 47
EXPERIMENT 6 Redox Reactions – The Activity Series 51Objective 51Introduction 51Procedure 53Results and Calculations 55
EXPERIMENT 7 Copper Reactions 57Objective 57Introduction 57Procedure 58Calculations and Results 61Post Lab Questions 63
EXPERIMENT 8 Analysis of a Two-Component Alloy 65Objective 65Introduction 65Procedure 67Results and Calculations 68Post Lab Questions 69
EXPERIMENT 9 Calorimetry–Measuring Heat of Formation 71Part A: Introduction to Calorimetry 71Procedure: Part A 72Part B: Introduction to Measuring the Heat of Formation of Magnesium Oxide 73Procedure: Part B 74
i–2 Chemistry 141 Grossmont College

Calculations and Data Treatment 76
EXPERIMENT 10 Atomic Spectra 77Objective 77Introduction 77Procedure 81Results and Calculations 81Post Lab Questions 83
EXPERIMENT 11 Periodicity of Chemical Properties 87Objective 87Introduction 87Procedure 88Discussion 88Sample Report 89Post Lab Questions 91
EXPERIMENT 12 Molecular Structure 95Objective 95Procedure 95Prelaboratory Sheet 101Report Sheet 102Post Lab Questions 115
EXPERIMENT 13 Propagation of Error: An Error Analysis Activity 117Objective 117Introduction 117Procedure 121Results and Calculations 121
EXPERIMENT 14 Identification of an Unknown Acid 123Objective 123Introduction 123Procedure 127Determining the Identity of Your Unknown Acid 129Sample Data Sheet 131Sample Calculation Sheet 132Post Lab Questions 133
Chemistry 141 Grossmont College i–3

Contents
EXPERIMENT 15 Determining the Effectiveness of an Antacid 135Objective 135Introduction 135Procedure 138Results and Calculations 139Report 140Post Lab Questions 143
EXPERIMENT 16 Determination of Molar Mass by Freezing Point Depression 145Objective 145Introduction 145Procedure 147Data Treatment 148Post Lab Questions 149
EXPERIMENT 17 Chemical Equilibrium and Le Châtelier's Principle 151Objective 151Introduction 151Sample Write-Up 152Equilibrium Experiment Demonstration 154Procedure 155
i–4 Chemistry 141 Grossmont College

EXPERIMENT 1 Measuring Density with Different Types of Glassware
ObjectiveIn Part A of this experiment, you will measure the volume that is delivered from three pieces of lab-oratory glassware: a beaker, a graduated cylinder, and a volumetric pipet. In Part B, you will use theappropriate glassware to measure the density of Coke and Diet Coke. The goal is to determine theaccuracy and precision for each type of glassware. The accuracy and precision for a device is deter-mined by a method of calibration. Calibration means that the user understands the limitations inher-ent in a particular piece of equipment and gives a good estimate of the actual values that can berelied upon when using that equipment for measuring.
IntroductionChemistry is an experimental science and therefore chemistry will always involve the taking ofmeasurements. These measurements may be multiple measurements of the same object, measure-ments of a single object by multiple observers, or one observer’s measurements of many differentobjects. What is the interpretation of each set of measurements? Are the measurements giving thecorrect answer (i.e are they accurate)? Are they consistent (i.e. precise)? One thing scientist mustkeep in mind is that no matter how much care is taken when measuring; uncertainty in measure-ment is always present.
The rules that apply to significant figures are basically an elementary form of error analysis. For themost part, following the rules that govern significant figures are sufficient when there is a singlemeasurement, or at most a duplicate trial. However, there may be times when we have the opportu-nity to carry out more exacting experiments where uncertainties in measurements can be estimatedquite accurately.
Errors in Observational Data
There exists a degree of uncertainty with nearly every type of measurement. A balance that mea-sures to the nearest gram will obviously introduce some uncertainty in the mass of objects that
Chemistry 141 Grossmont College 1–1

Measuring Density with Different Types of Glassware
weigh approximately 1.5 grams. If you try to measure the length of a board and the end of the boardfalls between two of the marks on your measuring tape; you would have to estimate the last frac-tional length. The only measurement that can be determined with certainty is counting a small setof objects, for example, the number of students in your class. However, counting large sets ofobjects is not an exact measurement. To determine the population of the US for example, actuallycounting every person is impractical and difficult to the point that estimates must be made to com-plete the task.
When we say that a measurement is uncertain, we mean that the measurement includes error. Anerror is the difference between a measured value and the true value. Errors are typically expressedas the uncertainty in the measurement using statistical quantities. There are two types of errors, sys-tematic errors and random errors.
Random errors are the uncertainties associated with a measuring device; for example, an objectmeasured for length may fall between the smallest divisions on a ruler and its value would have tobe estimated. The reality is, no matter how carefully measurements are taken there is always a cer-tain amount of “scatter” in the data. This scatter is due to the inability of an instrument or anobserver of that instrument to discriminate between readings differing by less than some smallamount. Random errors do not follow any regular pattern. Since random errors occur in an unpre-dictable manner, it is impossible to eliminate them. Fortunately, random errors can be dealt withstatistically. Sometimes mistakes are made during a procedure (e.g. spilling part of a solution, drop-ping a piece of equipment, overfilling or underfilling a graduated cylinder, or when performing atitration you titrate each sample to a slightly different endpoint, etc.). These will all be good datapoints, but they will differ slightly due to random or indeterminate errors. If you average the datapoints, this random error is represented by the deviation of each individual measurements from themean. These are not errors; they are mistakes and cannot be dealt with in any fashion, except per-haps as a learning exercise. Random errors are impossible to eliminate, but because they randomlyfluctuate around the measurement the average value should reflect a good value for the measure-ment in the absence of systematic error.
Systematic errors (sometimes referred to as determinate error) are errors of a definite size andsign that can often be traced to specific sources introduced during the lab. Generally, such errorscan be avoided or corrected. For example, this type of error may be caused by improper calibrationof an instrument, uncompensated instrumental drift, leakage of material (e.g. gas in a pressure sys-tem), incomplete fulfillment of assumed conditions for a measurement (e.g. incomplete reaction ina calorimeter or incomplete drying of a weighed precipitate), personal errors in reading an instru-ment or a measuring device (e.g. parallax error) or, biased methods implemented during the proce-dure (e.g. uncompensated human reaction times). Systematic errors often announce their presencein some sort of pattern. Systematic errors must be eliminated (corrected) since there is no statisticalmethod to handle these errors, while random errors can produce a result which is either too high ortoo low. When systematic errors are made, accuracy rarely matches precision. Therefore, it isimportant to calibrate, read instruments, etc. correctly.
Gross errors are results in a value which is far different than either the true or the mean. Theymay be caused by sample inconsistencies or experimental error (i.e. reading measuring instrumentswrong on one trial).
Accuracy and Precision
When experimental values are discussed it is important to know the information about the qualityof the data. What exactly is meant by quality? How can the size of the random and systematic
1–2 Chemistry 141 Grossmont College

Introduction
errors be determined? To answer these questions, the terms accuracy and precision need to bedefined.
Accuracy is a measure of the difference between the true value and measured value. The real, truevalue is not always known. Absolute error is the approximate error of a single measurement:
absolute error = =|true value - observed value| (EQ 1.1)
Accuracy is frequently described as a percent difference or percent error between the measuredvalue and the actual value:
(EQ 1.2)
The difficulty with determining the error for a measured (or calculated) value is that it is often dif-ficult or impossible to determine the true value. For measurements taken in the undergraduate labo-ratory, we frequency compare our results with generally accepted results published in the literatureas our known or true value. In such cases the percent error is calculated.
Precision is a measure of the reproducibility of a measurement. It is a measure of the amount ofrandom error. If we were to take many measurements, how close would they be to each other?
deviation = d = |average value - observed value| (EQ 1.3)
Precision is frequently described by the percent deviation:
(EQ 1.4)
Unfortunately, precision cannot give much information regarding the accuracy of a measurement.A common illustration for these terms is a “bull's-eye” target. Good accuracy means several arrowsclose to or in the middle of the target. Good precision means all the arrows are clustered in the sameregion of the target. Good precision does not guarantee good accuracy; all of the arrows can begrouped close together yet far from the center of the target. However, good precision often lendsconfidence to the experimentalist since it would appear that all measurements are consistently goodin the absence of any obvious systematic errors.
FIGURE 1.1
% error observed value true value–true value
------------------------------------------------------------------- 100 %=
% deviation observed value average value–average value
---------------------------------------------------------------------------- 100 %=
Chemistry 141 Grossmont College 1–3

Measuring Density with Different Types of Glassware
Although, both sets of arrows represent a set of precisely thrown arrows, only picture A would beconsidered accurate and precise, while picture B would be considered precise, but not accurate.
How can the best possible results be obtained during an experiment?
• Perform experiments as precisely as possible to minimize random error.• Analyze each of the measurements to identify possible sources of systematic error and mini-
mize them.• Determine the result using several entirely independent methods of measurements and compare.
If these independent methods give the same final results it is a good indication of accuracy.
Treatment of Errors
Since a series of measurements will produce random errors, some positive and some negative val-ues, the true value is best estimated by finding the mean value ( ). The mean is often called theaverage value and is found by summing all the values and dividing by the number of measure-ments:
(EQ 1.5)
where M is the individual value and n is the total number of measurements
Closely related is the median value which is the value that has an equal number of measurementsabove and below the mean. Consider this set of percent chlorine data in a sodium chloride sample.The balance is good to four significant figures and five observations were taken:
Some questions may come to mind: Why wasn’t the same value obtained for each trial? What valueshould have been obtained for the percent chlorine? One way to analyze the distribution of values isto report the spread or range which is defined as the difference between the highest and lowest val-ues.
range = 60.54 – 60.41 = 0.13 (EQ 1.6)
The range is not particularly useful since it does not indicate anything about the distribution of datapoints about the mean value. The mean or average value is:
(EQ 1.7)
TABLE 1.1
Trial # Observed Value for Percent Chlorine
1 60.502 60.413 60.534 60.545 60.52
Mean 60.50Median 60.52
x
xM n
n----------------=
x 60.50 60.41 60.53 60.54 60.52+ + + +5
--------------------------------------------------------------------------------------------- 302.505
----------------= 60.500= =
1–4 Chemistry 141 Grossmont College

Introduction
The median is found to be 60.52%. The true value for the percent chlorine in sodium chloride canbe calculated:
(EQ 1.8)
Therefore, the true or calculated value is 60.66%. Then the absolute error for each measurementcan be determined for each trial as shown for trial 1:
Absolute error = |60.66% - 60.500%| = 0.16% for trial 1 (EQ 1.9)
The deviation for each measurement from the average can also be determined:
Deviation = |60.500% - 60.50%| = 0.00% for trial 1 (EQ 1.10)
Tabulating these results:
Using the same data set, the deviation and absolute deviation can be tabulated for each value asshown in Table 1.1 on page 4. Notice that except for rounding errors, the mean deviation is nearlyzero as one would expect if the errors in measurement were randomly distributed above and belowthe mean. The only significant information in this example is the average of the absolute deviationor simply the average deviation, .
as seen in Table 1.2 . (EQ 1.11)
Notice that in this data the average deviation, a measure of the precision, is less than the averageerror. This indicates that there is some systematic error in the experiment resulting in inaccuratedata. This example demonstrates how a student might be misled into believing their data was accu-rate based on good precision. Unfortunately, systematic error can not be described using any cleanmathematical theories; So it is often ignored although, it is frequently found to be orders of magni-tude larger than the random errors. In fact, many published papers have later been show to be incor-rect by amounts far greater than the claimed limits of error.
Given the fact that it is very difficult to identify and quantify all sources of systematic error statisti-cal methods of analyzing random error are used as an indication of the error found in experimentaldata.
Although random errors cannot be corrected for, they can be treated statistically in an attempt to establish the reliability of the measurement. The analysis is based on the “normal” error curve.
TABLE 1.2
Trial # Observed Value for Percent Chlorine Absolute Error Deviation
1 60.50 0.16 0.002 60.41 0.25 0.093 60.53 0.13 0.034 60.54 0.12 0.045 60.52 0.14 0.02
Average 60.50 0.16 0.04
%Cl35.45 g
mol---------
35.45 gmol--------- 22.99 g
mol---------+
------------------------------------------------------ 100 % 60.66%Cl==
d
dM n x–n
------------------------- 0.00 0.09 0.03 0.04 0.02+ + + +5
------------------------------------------------------------------------------ 0.04===
Chemistry 141 Grossmont College 1–5

Measuring Density with Different Types of Glassware
FIGURE 1.2
The curve shows the relative frequency of deviation that can be expected to be found if a largenumber of measurements are made. The curve allows determinations about the magnitude of inde-terminate errors to be made. Some of the main points of these curves are:
• The curves are symmetric about the midpoint, which is the arithmetic mean. Therefore, positive and negative deviations are equally likely.
• The curves rise to a maximum at the midpoint, indicating that small deviations occur more often than large deviations. In fact, if a large deviation is observed a systematic error is most likely involved.
• The shape of the curve is dependent on the inherent precision of the measurements. Sloppy or crude instrumentation give a high frequency of large deviations, as in curve (b). Refined mea-surements with improved precision show large deviations to be improbable, as in curve (a).
For reasons that will not be discussed here, the standard deviation is preferred over average devia-tion because it can be interpreted statistically. Standard deviation is the measure of the size ofthe random error in a set of data. The standard deviation gives information about the shape of theerror curve that is associated with a set of experimental measurements. In order to measure theexact, theoretical value of the standard deviation of a measurement, the measurement must be takenmany times. Therefore, the equation of standard deviation is technically only an approximation ofthe true standard deviation of a particular measurement. This estimation of the standard deviation,, is given as:
(EQ 1.12)
Returning to our example the standard deviation of the percent chlorine data can be determined. First the deviation squared is calculated as shown in Table 1.3 on page 6.
TABLE 1.3
Trial # Observed Value for Percent Chlorine Deviation, d d2
1 60.50 0.00 0.002 60.41 0.09 0.00813 60.53 0.03 0.00094 60.54 0.04 0.00165 60.52 0.02 0.0004
Sum 0.011
d 2
n 1–--------------
xi x– 2n 1–
----------------------------= =
1–6 Chemistry 141 Grossmont College

Introduction
The standard deviation is calculated to be:
(EQ 1.13)
The standard deviation tells a lot about the error curve. A small value for sigma corresponds to asharp, steeply rising curve, where deviations are close to zero. On the flip side, a broad, squat curveindicates that large deviations are highly probable.
FIGURE 1.3
The shaded area bound by - and is proportional to the probability of an observation with a devi-ation within one unit of of the arithmetic mean (located at the midpoint of the curve). This shadedarea represents about two-thirds of the total area, or more exactly 68.4% of the total area under thecurve. This mean that if a large number of measurements are made about two-thirds should fallwithin x - to x + or x ± (i.e. the average plus or minus the standard deviation). So, about one-third of the trials should fall outside of these boundaries and hence, would show a larger deviationor be classified as “good”. Actually, ± 2 covers most of the area under the curve or about 95%.This means that 95% of the trials fall within ± 2 from the arithmetic mean, x - 2 to x + 2 or x ±2Therefore, these values would be classified as “fair.” This leave about 5% of the measurementsout of this range. In other words, about one-twentieth of the measurements will have a deviation ofgreater than ± 2. Those falling within 3 are classified as “poor.” Keep in mind the probability ofwhere a measurement falls is valid when dealing with a large number of observations.
Looking at the percent chlorine data, the mean value is within a range of 60.500 ± 0.052%. So, fourout of five (80%) measurements are within one standard deviation 60.448% to 60.552% and all ofthe measurements are within two standard deviations 60.396% to 60.604%. Therefore, the mea-surements in this experiment have good accuracy since more than 68.4% fall within one standarddeviation. Similarly, four of five measurements fall within one standard deviation of the medianvalue. So, the measurements also have good precision.
In other words, the standard deviation indicates the distribution of values about the mean. To saythis another way, the standard deviation is an indication of the precision involved with a certain setof measurements.
0.0115 1–------------- 0.052= =
Chemistry 141 Grossmont College 1–7

Measuring Density with Different Types of Glassware
Procedure Part A: GlasswareFor each piece of glassware, the volume will be determined by weighing the amount of DI water ineach sample and then using the density to calculate the volume. For example, a beaker filled withwater to the 50 mL mark contains approximately 50 mL of liquid. By weighing the beaker and itswater, then subtracting the empty beaker weight, the actual mass of the water sample is known. Thedensity of water is then used to calculate the true volume of that sample. Which piece of glasswaredo you expect to be the most accurate? The most precise?
Part I: Beaker CalibrationUse a 100 or 150 mL beaker that has a calibration line at the 50 mL point. Use the beaker in yourdrawer, not your partner’s beaker. The aim is to determine the accuracy of your beaker so you knowthe reproducible volume of liquid that is delivered with your beaker. Check out a clean beaker fromthe stockroom if you do not have one that is suitable for this experiment. Wash your beaker andrinse with DI water. Do not dry the inside of your beaker. Dry the outside then follow the instruc-tions below. Record your data in your laboratory notebook.
1. Fill the beaker to the 50 mL mark as carefully as possible. Adjust the level using an eye dropperif needed. What is the uncertainty of the beaker measurement?
2. Weigh the beaker and its contents. Do not use an analytical balance. Zero the balance first andcontinue to use the same balance for each measurement throughout this part of the experiment.What is the uncertainty of the balance?
3. Pour the water out of the beaker until it stops draining, then weigh the empty beaker (rememberto use a glass stir rod, “glass-to-glass-to-glass” to ensure that as much of the liquid is transferredas possible). This is your tare weight. Do not dry out any remaining drops of water before it isweighed. This procedure will measure the volume of water delivered by the beaker, not theactual volume that it holds.
4. Repeat steps 1 – 3 for two more trials.5. Determine the mass of water delivered by your beaker for each trial. This is simply done by sub-
tracting the tare weight from the weight of the beaker plus the water.
Part II: Graduated Cylinder CalibrationUse a 10 mL graduated cylinder from your equipment drawer. Wash your glassware and rinse withDI water. As before, do not dry the inside of the cylinder; dry the outside. You will also need a plas-tic bottle with cap that can hold approximately 125 mL of liquid. Follow the steps below and recordthe data in your notebook.
1. Fill a clean 250 mL beaker with approximately 200 mL DI water. Record the temperature of thewater. Use this water for the six trials that you will do in this part of the experiment.
2. Weigh the plastic bottle and its cap on an appropriate balance. The bottle should be empty butdoes not have to be completely dry. This is your tare weight for the plastic bottle.
3. Fill the graduated cylinder to the 10.0 mL mark. Make sure the meniscus is just even with the10.0 mL mark. Use an eye dropper to adjust final volume if needed. What is the uncertainty ofthe graduated cylinder?
4. Pour the contents of the graduated cylinder into the plastic bottle (“glass-to-glass-to-glass”).Some drops of water will adhere to the inside of the cylinder which is fine. Remember, youwant to determine the deliverable volume, not the actual volume. Place the cap on the plasticbottle and record the weight. What is the uncertainty of the balance?
5. Transfer another 10.0 mL of water from the graduated cylinder to the plastic bottle like you didin steps 3 and 4. Do not empty the water in the plastic bottle from the first transfer. You will add
1–8 Chemistry 141 Grossmont College

Calculations and Results
each sample to the bottle in consecutive trials. By the end of this exercise, the bottle will bequite full.
6. Repeat steps 3, 4 and 5 until you have a total of seven measurements.7. Add another column to the right of your data table and fill it with the mass of the water deliv-
ered in each transfer. You will need this value later when interpreting your results.
Part III: Pipet CalibrationBefore the pipet can be used, it must be clean so that it drains freely (i.e wash three times withsoapy water, rinse three time with tap water, rinse three times with D.I. water, and if necessary rinsethree times with your solution.). After cleaning, practice with the pipet before you start the proce-dure. Use DI water to practice until you have mastered the skill needed to deliver an aliquot fromthe pipet. This exercise is similar to the procedure for the graduated cylinder except you will usethe 10 mL pipet to deliver your samples into a small plastic bottle that has a 50 mL capacity. Followthe steps below and record your data in your notebook.
1. Obtain the tare weight of your plastic bottle on an appropriate balance. As before, the bottledoes not have to be completely dry on the inside.
2. Fill the pipet to the 10 mL mark and deliver the contents to the plastic bottle. What is the uncer-tainty of the pipet?
3. Weigh the bottle plus its contents. What is the uncertainty of the balance? 4. Repeat steps 2 and 3 until you have data for four trials. Remember- don’t empty the bottle
between trials.
Calculations and Results
Part I: Beaker Calibration1. Calculate the mean and standard deviation for the mass of water contained in the beaker.
a. What does the standard deviation tell you about the precision of the beaker? Classify the precision as good, fair, or poor. Refer to Figure 1.3 on page 7 and the subsequent text. Remember that you will use your data to support your choice in your discussion.
2. Assuming that the density of water is 1.0 g/mL, what is the most likely volume contained inyour beaker when filled to the 50 mL mark (i.e the “true value” for the volume)?
a. What is the percent error with respect to the volume? What does the percent error tell you about the accuracy of your measurements? Classify the accuracy as good, fair, or poor. Remember that you will use your data to support your choices in your discussion.
Part II: Graduated Cylinder1. Calculate the mean and standard deviation for the mass of water contained in the cylinder.2. Find the density of water at the temperature you recorded in the Handbook of Chemistry and
Physics. Use this density to convert the mean value of the mass of water and its standard devia-tion to the corresponding volume.
Remember to convert your masses to volumes since the beaker, gradu-ated cylinder, and pipet are used to measure volumes and not masses.
Chemistry 141 Grossmont College 1–9

Measuring Density with Different Types of Glassware
SAMPLE
a. What does the standard deviation tell you about the precision of the beaker? Classify the precision as before. You will use your data to support your choices in your discussion.
3. What is the percent error? What does the percent error tell you about the accuracy of your mea-surements? Classify the accuracy as good, fair, or poor as you did before.
Part III: Volumetric Pipet1. Do the same calculations as listed above for the graduated cylinder.2. Classify the accuracy and precision of the volumetric pipet as good, fair or poor. Remember that
you will use your data to support your choices in your discussion. .
Part B: Measuring the Density of Coke and Diet Coke
ObjectiveDetermine the density of each soft drink using 10 mL samples. From your results in Part A, youneed to decide which piece of glassware is the best choice for measuring the density of each. .
ProcedureThe student should develop and follow a procedure similar to that used in Part A. You should do aminimum of three trials on each soda.
ResultsReport the mean density and standard deviation for each soft drink. Show your calculations.
ReferencesMasterton and Slowinski: Elementary mathematical preparation for General Chemistry.Saunders Publishing, 1974.
Shoemaker, Garland, and Steinfeld: Experiments in Physical Chemistry. McGraw-Hill, 1974.
Kratchvil, H.: Chemical Analysis. Barnes and Noble, 1969.
NOTE: Your results and calculations section should include a table likethe one below to summarize your major data.
TABLE 1.4 Analysis of Volume Instruments
Instrument Uncertainty Average Volume
Standard Deviation
Precision (good, fair,
poor)
True Value %error
Accuracy (good, fair,
poor)
beakergraduated cylinder
pipet
Remember that the instrument was calibrated previously. Use that vol-ume in your calculations.
1–10 Chemistry 141 Grossmont College

Post Lab Questions
Post Lab Questions1. What factors did you consider in choosing the particular piece of glassware for Part B of the
experiment? Include comments on the accuracy and precision of your glassware choice.
2. Is the density of the two soft drinks the same, greater or less than that of water? Suggest reasonsfor your answer (hint- examine the contents label on the aluminum cans).
3. Compare the density of Coke with the density of Diet Coke. Are they the same or different?Explain your answer.
Chemistry 141 Grossmont College 1–11

Measuring Density with Different Types of Glassware
1–12 Chemistry 141 Grossmont College

EXPERIMENT 2 Density: A Study in Precision and Accuracy (Part A)
IntroductionIn this lab, you will be investigating the concepts of precision and accuracy. You will be doing anexperiment in which you will be measuring the density of some glass beads. Although you will belearning a little bit about density measurements, the primary goal of the lab is for you to come togrips with the separate concepts of accuracy and precision.
In any scientific investigation, when the results are reported, it is standard practice that the investi-gating scientist carefully consider both the issues of accuracy and precision. Since these two con-cepts are often confused, we will begin with a careful definition of each.
Precision: A measure of the amount of random variation in the measurement of data.
Accuracy: A measure of how far an experimental result is from the true or correct value.
Whenever a scientist makes measurements, there will always be some random variation in the val-ues recorded. If one were to use a stop water to measure the time, t, it took an object to fall a certaindistance, one might record data such as the following:
1.49 s, 1.48 s, 1.53 s, 1.48 s, 1.50 s, 1.47 s, 1.52 s, 1.52 s, 1.46 s
The random variation does not necessarily reflect an error on the part of the person doing the mea-surements, but rather it may reflect the limit of the precision of the time measuring device (and theability of the person controlling the stopwatch to hit the button at the right time). The precision ofthe experiment is a measure of the size of the random variation in the experiment. In this experi-ment, you will learn to calculate the standard deviation of the measurement: the most commonaccepted statistical measure of precision.
Another way of thinking about precision is as a measure of the amount of random error in an exper-iment. Any experimental error is considered to be random if its result could make the calculated ormeasured value either too high or too low. Any potential error in an experiment which could have apredicted effect on the result, making it either definitely too high or too low, would be considered asystematic error (see below).
Chemistry 141 Grossmont College 2–13

Density: A Study in Precision and Accuracy (Part A)
For the same experiment as described above, if the exact height from which the mass was droppedwas known, the equations of motion from the basic physics course (assuming the acceleration dueto gravity to be 9.80 m/sec2) could be used to calculate the theoretical time it should take the massto fall. In this case, the correct theoretical value could be compared to the results. For example, ifthe “true” or “theoretical” value for the time it should take the mass to drop were 1.45 seconds, theaccuracy of the experiment could be calculated. In this experiment, you will measure the accuracyas the %-error of the measurement.
In general, scientists are always able to measure the random error of an experiment. There are situ-ations in which there is no known “true” or “accepted” value for a measurement. In this case, thescientist may not be able to calculate the accuracy as a %-error. Normally, in such a situation, thescientist will do a very similar experiment to the one to be reported, only doing the very similarexperiment on slightly different case in which the “true” value is known. The scientist will then cal-culate the %-error in this case as a check on the validity of the measurement they are reporting.
Another way of thinking of accuracy is to think of accuracy as a measure of the systematic error inan experiment. For example, in the mass-dropping experiment described above, if one were toanticipate the mass hitting the floor, and press the button just a little before the mass hit, that woulddefinitely make the time measured too small. This would be an example of a systematic error. If theperson doing the experiment were to consistently make such an error, it would effect the accuracy(and therefore the %-error), but not the precision (and therefore not the standard deviation).
TheoryFor a set of measurements of a variable x, the standard deviation is calculated using the followingequation:
(EQ 2.1)
Where is the symbol for standard deviation (sometimes the letter s is used to represent the stan-dard deviation). The symbol x represents the individual measurements, while the symbol repre-sents the average of the measurements in question. In this equation, n is the number ofmeasurements. For example, one could calculate the standard deviation of the measurements oftime listed above. The calculation is shown below:
TABLE 2.1
t (s) (s) (s2)
1.49 –0.004 0.0000161.48 –0.014 0.0001961.53 +0.036 0.0012961.48 –0.014 0.0001961.50 +0.006 0.0000361.47 –0.024 0.0005761.52 +0.026 0.0006761.52 +0.026 0.0006761.46 –0.034 0.001156
x x– 2
n 1–----------------------=
x
t t– t t– 2
2–14 Chemistry 141 Grossmont College

Theory
s2 (EQ 2.2)
Therefore, the standard deviation is:
(EQ 2.3)
The average and the standard deviation are combined to yield the result that the time it took themass to fall is in the form t = t ± t:
(EQ 2.4)
Note that both the average value and the standard deviation should end with the same number ofdigits past the decimal. Also note that the units label follows the standard deviation, not the averagevalue.
The accuracy of the time measurement may be calculated as well. The equation for %-error is asfollows:
(EQ 2.5)
If the measured value is below the accepted or theoretical value, then there will be a negative %-error. Be sure to show the positive or negative sign (e.g. +5.67% or -5.67%) when reporting youranswer. What does the sign tell you about the %-error?
For the time experiment described above, then, the %-error is calculated (assuming the true value tobe 1.45 s) as:
(EQ 2.6)
In general, a %-error is only reported to one or at most two significant figures.
In this experiment, you will be measuring both the mass and the volume of some glass beads. Thedensity will be measured using the well-known equation:
(EQ 2.7)
After calculating both the mass and the volume of some glass beads a number of times, you willcalculate the average values and the standard deviations of both values. You will then calculate thedensity, the standard deviation of the density, and the %-error from the true value for the density ofthe glass beads.
What about the precision of your density measurement? In other words, you will be measuring thestandard deviation of the mass measurement as well as of the volume measurement. The precisionof the mass and volume measurements are determined when the standard deviation is measured.The question is how to use these results to estimate the size of the random error (precision) in thedensity when it is calculated by dividing the mass by the volume.
t 13.459
------------- 1.494 s= = ti t– 2 0.004824=
0.0048249 1–
---------------------- 0.0245 s= =
t 1.494 0.025 s=
% error measured value theoretical value–theoretical value
----------------------------------------------------------------------------------- 100 %=
% error 1.494 1.45–1.45
------------------------------ 100 % 3.0 %= =
d mv----=
Chemistry 141 Grossmont College 2–15

Density: A Study in Precision and Accuracy (Part A)
One way to do this would be to simply calculate the random error of the two measurements used tocalculate the density and add the two errors. There are two problems with this approach. First, onecannot add apples to oranges. In other words one cannot add the error in the mass (with unitsgrams) to the error in the volume (with units of milliliters). A partial solution to this problem wouldbe to calculate the percentage of the two errors and adding them. In other words, if the standarddeviation of the mass measurement was 5.2% of size of the average mass, and the standard devia-tion of the volume measurement was 8.4% of the size of the average volume, one could concludethat the random error in the density measurement was 5.2 + 8.4 = 13.6%.
The problem with this solution is that it overestimates the error. There is a significant probabilitythat the error in the volume will have the opposite effect on the density as the error in the mass mea-surement. In other words, the errors can cancel. The correct statistical measurement of the com-bined error due to two measurements (x and y) being used to calculate a secondary value (z) isgiven by the following equation:
(EQ 2.8)
The estimated error, z, can be calculated as follows,
(EQ 2.9)
Where z is the calculated value and z is the estimated error in the calculated value. In this formula,and are the standard deviation in the measured values x and y. Therefore, the final result for
the calculated value is z = z ± z.
Experimental Procedure
Part I: Measuring the mass of the glass beads1. Using a balance, measure the mass of forty glass beads eight different times. It is most conve-
nient to measure the beads in a weighing boat. Be sure to measure different beads each time toensure that you are getting a random selection of the beads in the jar.
2. Record the eight values of the mass in a table in your lab book, being sure to get as much preci-sion out of the balance as possible.
3. After recording the values, determine the average mass of the beads. 4. Go on to calculate the standard deviation of the mass measurements. 5. In addition, report the average ± the standard deviation. 6. Be sure to report the units and the number of significant figures properly. Show all your calcula-
tions.
Part II: Measuring the volume of the glass beads1. Fill a buret about one-third to one-half full with deionized water. 2. Carefully record the volume of water in the buret. If you are not sure how to record the volume
measurement from a buret accurately to two places past the decimal, ask your instructor forhelp.
z xy---= or z xy=
z zxx
-----
2 yy
------
2+=
x y
2–16 Chemistry 141 Grossmont College

Experimental Procedure
3. Now, add forty glass beads to the buret and record the volume again. 4. Repeat this process for a total of eight additions of forty beads, recording the final volume each
time. Record the results in a table in your lab book. 5. When you are done, drain the water from the buret and dump the wet beads into the container
provided marked “wet glass beads”. 6. Calculate the volume of forty beads for each of the eight cases, and continue on to calculate the
standard deviation of the volume measurements. 7. Report the average of the volume of forty beads ± the standard deviation in the correct format.
Part III: Calculating the density and the error in the density1. First, use the average mass and average volume from above to calculate the density of the glass
beads.2. Next, calculate the %-error of your measurement, assuming that the correct value for the density
of the glass beads is d = 2.35 g/mL.3. In addition, calculate the random error in the density using Equation 2.9 for calculating the
accumulated uncertainty for a calculation involving two measurements.4. Finally, record the density of the glass beads from your measurements as d = d ± d.
Chemistry 141 Grossmont College 2–17

Density: A Study in Precision and Accuracy (Part A)
2–18 Chemistry 141 Grossmont College

Post Lab Questions
Post Lab Questions1. Is the size of your random error big enough to explain the difference between your measured
value of density and the expected value of 2.35 g/mL? Explain.
2. Based on your answer to question #1, would you need to invoke some sort of systematic error toexplain the difference between your calculated density and the expected value of 2.35 g/mL, orcan all the error be assumed to be due to random error? Explain.
3. Give two examples of random error in this experiment.
4. Give two examples of systematic error in this experiment. In each case, would the proposed sys-tematic error make the calculated density too high or too low when compared to the correctvalue?
Chemistry 141 Grossmont College 2–19

Density: A Study in Precision and Accuracy (Part A)
2–20 Chemistry 141 Grossmont College

EXPERIMENT 3 Density: A Study in Precision and Accuracy (Part B)
Validity
In this part of the statistics lab, we will consider two additional aspects of statistical treatment ofdata which are very important to scientists. The first is validity. Validity is a measure of how wellcause and effect are correlated. Testing claims of the validity of a cause and effect relationshipbetween two variables is perhaps the most basic part of what scientists do. If the effect of a newdrug in treating a particular disease is being tested, the drug must be tested on a set of patients aswell as a control group which receives a “placebo.” The obvious question is whether or not there isa significant difference in symptoms of disease between those who took the drug and those whowere given a placebo.
Validity is a measure of whether two different results are truly different statistically. For example, ascientist could study the colon cancer rates of those who eat Wheaties and those who do not. Let usimagine that the colon cancer rate of those who eat Wheaties is 24.5 per thousand, while those whodo not eat Wheaties have a cancer rate of 24.0 per thousand. Is the scientist justified in reportingthat eating Wheaties can increase your likelihood of getting cancer? The answer is almost certainlyno!!! The two different results almost certainly do not differ enough to statistically justify conclud-ing there is a relationship between eating Wheaties and getting colon cancer.
The problem of determining validity of a result is especially difficult in the biological sciences, andeven more so in the medical sciences. For example, consider the following hypothetical study. Agroup of subjects was surveyed and it was discovered that people in the army have a 30% higherlung cancer rate than those not in the army. This 30% difference is certainly statistically valid. Con-clusion: being in the army causes lung cancer. Wrong!!! What this study fails to do is to adjust theresults for smokers. In fact, those in the army have a 40% higher rate of smoking. It was not beingin the army which caused cancer, it was smoking.
The conclusion is that anyone doing a scientific study must very carefully consider all the relevantvariables which could conceivably effect a given result. Once all the variable have been controlledfor, the results must still be checked for statistical validity. In other words, is there a valid correla-tion between a change in a given variable and the result measured.
Chemistry 141 Grossmont College 3–21

Density: A Study in Precision and Accuracy (Part B)
The t Test
The most common statistical test for whether a scientific measurement of an effect is valid is the ttest. For a given set of data, one being the test, the other being the control, the question is whetherthe average value measured is statistically different. Is there a valid effect? To provide an example,consider the following data:
Conclusion: “Mighty Grow” makes the plants grow faster. Not so fast! We must apply the t test.Look at Equation 3.1
(EQ 3.1)
Where is the average of the first set of data, is the average of the second set of data, N1 andN2 are the number of measurements for each set of data, and sp is the pooled standard deviation ofthe two sets of data. The pooled standard deviation is given by Equation 3.2.
(EQ 3.2)
The value of t is calculated and compared to a t table. If it is greater than the relevant t value in thetable, then the difference between the two measurements is valid. A table of t values is included.
For example, from the data in Table 3.1 on page 22, one can calculate the t value to be:
TABLE 3.1
measurement # height of plant using just water height of plant using “Mighty Grow”
1 58 cm 64 cm2 62 cm 55 cm3 53 cm 58 cm4 61 cm 66 cm5 54 cm 56 cm6 57 cm 62 cm
average 57.5 cm 60.2 cm
TABLE 3.2
Set #1 Set #2
0.25 14.4420.25 27.0420.25 4.8412.25 33.6412.25 17.640.25 2.24
tx1 x2–
s p----------------
N 1N 2
N 1 N 2+--------------------=
x1 x2
s pxi1 x1– 2 xi2 x2– 2+
N 1 N 2 2–+-------------------------------------------------------------------------=
xi x1– 2 xi x2– 2
xi x1– 2 65.50= xi x2– 2 99.84=
3–22 Chemistry 141 Grossmont College
Validity
.8% 99.9%8.3 636.6.33 31.60.21 12.92
173 8.610893 6.869208 5.959785 5.408501 5.041297 4.781144 4.587025 4.437930 4.318
(EQ 3.3)
(EQ 3.4)
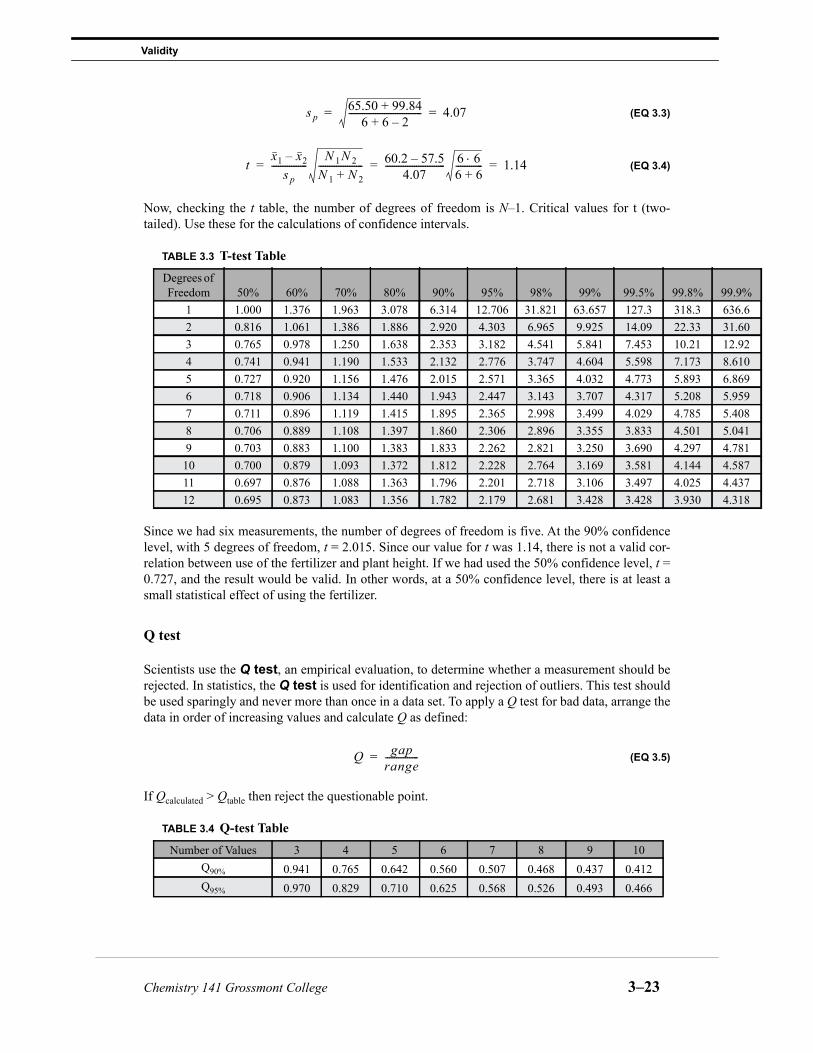
Now, checking the t table, the number of degrees of freedom is N–1. Critical values for t (two-tailed). Use these for the calculations of confidence intervals.
Since we had six measurements, the number of degrees of freedom is five. At the 90% confidencelevel, with 5 degrees of freedom, t = 2.015. Since our value for t was 1.14, there is not a valid cor-relation between use of the fertilizer and plant height. If we had used the 50% confidence level, t =0.727, and the result would be valid. In other words, at a 50% confidence level, there is at least asmall statistical effect of using the fertilizer.
Q test
Scientists use the Q test, an empirical evaluation, to determine whether a measurement should berejected. In statistics, the Q test is used for identification and rejection of outliers. This test shouldbe used sparingly and never more than once in a data set. To apply a Q test for bad data, arrange thedata in order of increasing values and calculate Q as defined:
(EQ 3.5)
If Qcalculated > Qtable then reject the questionable point.
TABLE 3.3 T-test TableDegrees of Freedom 50% 60% 70% 80% 90% 95% 98% 99% 99.5% 99
1 1.000 1.376 1.963 3.078 6.314 12.706 31.821 63.657 127.3 312 0.816 1.061 1.386 1.886 2.920 4.303 6.965 9.925 14.09 223 0.765 0.978 1.250 1.638 2.353 3.182 4.541 5.841 7.453 104 0.741 0.941 1.190 1.533 2.132 2.776 3.747 4.604 5.598 7.5 0.727 0.920 1.156 1.476 2.015 2.571 3.365 4.032 4.773 5.6 0.718 0.906 1.134 1.440 1.943 2.447 3.143 3.707 4.317 5.7 0.711 0.896 1.119 1.415 1.895 2.365 2.998 3.499 4.029 4.8 0.706 0.889 1.108 1.397 1.860 2.306 2.896 3.355 3.833 4.9 0.703 0.883 1.100 1.383 1.833 2.262 2.821 3.250 3.690 4.
10 0.700 0.879 1.093 1.372 1.812 2.228 2.764 3.169 3.581 4.11 0.697 0.876 1.088 1.363 1.796 2.201 2.718 3.106 3.497 4.12 0.695 0.873 1.083 1.356 1.782 2.179 2.681 3.428 3.428 3.
TABLE 3.4 Q-test TableNumber of Values 3 4 5 6 7 8 9 10
Q90% 0.941 0.765 0.642 0.560 0.507 0.468 0.437 0.412Q95% 0.970 0.829 0.710 0.625 0.568 0.526 0.493 0.466
s p65.50 99.84+
6 6 2–+--------------------------------- 4.07= =
tx1 x2–
s p----------------
N 1N 2
N 1 N 2+-------------------- 60.2 57.5–
4.07--------------------------- 6 6
6 6+------------ 1.14= = =
Q gaprange---------------=
Chemistry 141 Grossmont College 3–23

Density: A Study in Precision and Accuracy (Part B)
EXAMPLE 3.5 Evaluate the following data using the Q test:.
The student applies the proceeding steps:
1. First, arrange the values in increasing order:148.0 g/mol, 152.9 g/mol, 153.9 g/mol, 154.2 g/mol, 154.5 g/mol
2. Find the difference between the suspicious value and the value closest to it:152.9 g/mol - 148.0 g/mol = 4.9 g/mol
3. Calculate the difference between the highest and lowest value:154.5 g/mol - 148.0 g/mol = 6.5 g/mol
4. Obtain the quotient, Q, by dividing step 2’s answer by step 3’s answer:
(EQ 3.6)
5. Finally, compare the value of Q90% found in Table 3.4 . Q90% tells use the maximum values we can have for a 90% confidence. If the calculated result instep 4 is greater than the value for Q90%, we can reject the suspicious value. For this example,Q90% for the five trials is 0.642 and 0.75 is greater than 0.642. Hence, the value for trial 2, 148.0g/mol, can be rejected.
EXAMPLE 3.7 Evaluate the following data using the Q test: 0.189, 0.169, 0.187, 0.183, 0.186, 0.182, 0.181, 0.184, 0.181, 0.177
Arrange in increasing order:
0.169, 0.177, 0.181, 0.181, 0.182, 0.183, 0.184, 0.186, 0.187, 0.189
Outlier is 0.169. Calculate Q:
(EQ 3.7)
With 10 observations at 90% confidence, Qcalculated < Qtable. Therefore keep 0.169 at 90% confi-dence.
TABLE 3.6 A student does five trials on a substance to find its molar mass.
Trial # Molar Mass (g/mol)
1 152.92 148.03 153.54 154.25 154.5
Q gaprange---------------
4.9 gmol---------
6.5 gmol---------
----------------- 0.75= = =
Q gaprange--------------- 0.177 0.169–
0.189 0.169– ------------------------------------- 0.008
0.020------------- 0.400= = = =
3–24 Chemistry 141 Grossmont College

The “Experiment”
The “Experiment”
Perform a t test to see if there is a statistically valid relationship between number of bean seedssprouted per 100 and exposure to UV light.
1. Calculate the average for each set of data and fill in the blank in the table above. Then do thecalculations to find t for the two sets of data. Show your calculations in your lab book.
2. What is the number of “degrees of freedom” for the data above?3. Find the value of t from Table 3.3 on page 23 using your number of degrees of freedom at the
90% confidence level. Compare to your t calculated above. According to your result, is there asignificant difference in the seed-sprouting rate for seeds irradiated with UV light? If not, is thedifference significant at the 50% confidence level? If yes to the 90% confidence level, what isthe highest confidence level at which the result is valid according to the table?
Least Squares Analysis Of Data
Least squares analysis of data is a statistical method for determining the best fit straight line to a setof data. There is hardly any more common thing for a chemist to do than to fit a set of data to astraight line, be it in kinetic studies, absorbance/concentration studies and so forth. Chemists almostinvariably use a canned program from excel or other software to determine the slope and interceptof the best straight line fit to a set of data. In this experiment, you will actually do a least squaresanalysis of a set of data by hand. The theory and equations of least squares analysis is provided inan attachment to this lab write-up. You will be doing a simple experiment to determine the densityof a solution using least squares analysis of data.
Experiment
Using a 50.0 mL graduated cylinder, measure the mass of the cylinder empty as well as five sets ofvolume and mass data for the same cylinder and a solution provided. The volumes should be about10, 20, 30, 40, and 50 mL. Measure both mass and volume with as much precision as the dataallows. Record the data in your lab book. That is it!
Calculations1. Perform a least squares fit to the five pairs of data, assuming that the volume is the independent
(x-axis) data and the mass is the dependent (y-axis) data. Your analysis of the data shouldinclude finding both the slope and the intercept (see Equation 3.8 and Equation 3.9), as well as
TABLE 3.8
Experiment # # sprouted without UV irradiation # sprouted with UV irradiation
1 87 712 72 643 88 804 81 695 69 706 78 707 80 72
Average
Chemistry 141 Grossmont College 3–25

Density: A Study in Precision and Accuracy (Part B)
the uncertainty in both numbers (see Equation 3.10, Equation 3.11, and Equation 3.12). Recordthe slope as m = slope ± error in slope and the intercept as b = intercept ± error in intercept.
2. What is the physical interpretation of the slope of your graph? Does it agree with the correctanswer (look it up) within the uncertainty? What is the %-error? Is a systematic error required toexplain your %-error? (explain)
3. What is the physical interpretation of the intercept of your graph? Does this value agree with thecorrect value within the uncertainty you determined? Calculate your %-error. Is a systematicerror required to explain your %-error?
4. Now, make a graph of your data and do a least squares fit to the same data using a canned pro-gram such as Vernier or Excel, available on the computers and compare to the values you got byhand.
(EQ 3.8)
(EQ 3.9)
(EQ 3.10)
(EQ 3.11)
(EQ 3.12)
mxi x– yi y–
xi x– 2---------------------------------------------
xi yixi yin
-------------------------–
xi2
xi 2
n-------------------–
-------------------------------------------------------= =
b y mx–=
sy
y12
yi 2
N--------------------– m2 xi
2xi
2
N-------------------––
N 2–--------------------------------------------------------------------------------------------------------=
smsy
2
xi2 xi 2
N-------------------–
---------------------------------------=
sb sy1
Nxi
2
xi2
-------------------–
------------------------------=
3–26 Chemistry 141 Grossmont College

EXPERIMENT 4 Conductivity and Net Ionic Equations
Objective
To use electrical conductivity as a way of determining the number of free ions present in a sub-stance and to use this information to draw conclusions regarding the type of bonding present in thesubstance.
Introduction
Types of BondingThere are three basic types of bonds. They are ionic, covalent, and polar covalent, which is a hybridof an ionic and a covalent bond. Ionic bonds are formed between elements with very different elec-tronegativities. Electronegativity is the ability of an atom to draw electrons towards itself in achemical bond. Generally, ionic compounds form between metals and non-metals and are identifiedby the transfer of an electron from the metal to the non-metal to form charged ions which are heldtogether by electrostatic interactions known as ionic bonds. Covalent bonds form between elementswith similar electronegativities. Generally, covalent bonds form between non-metals are character-ized by the sharing of electron pairs between the atoms. Polar bonds are formed between two ele-ments with different electronegativities, but which still share the electrons albeit unevenly.
Electrolytes versus Non-electrolytes
Substances may be classified by their electrical conductivity. Electronic conduction is a type ofelectrical conductivity that occurs in metals where charge is carried by electrons. In ionic con-duction the charge is carried by ions. Substances which can conduct electricity are called elec-trolytes. When ionic compounds are melted or dissolved in water, they form mobile ions that areable to conduct electricity. Polar covalent compounds such as acids and bases will sometimes disso-ciate or break apart in aqueous solution to form ions as well. There are two types strong electrolyteand weak electrolytes.
Chemistry 141 Grossmont College 4–27

Conductivity and Net Ionic Equations
Substances which do not conduct electricity are called non-electrolytes. Examples of non-elec-trolytes are covalent molecules such as sucrose or table sugar (C12H22O11) and acetone (CH3CO-CH3). These substances are non-electrolytes because they are not composed of ions and cannotconduct an electric current. Ionic compounds in their crystalline form are also considered to be non-electrolytes because even though they are composed of ions, the ions are not able to move freelythrough the crystal and therefore are not able to conduct electricity.
Strong electrolytes dissociate ~100% in aqueous solution. In chemical equations where ions areincluded (total and net ionic equations) write the ionized components, since they are the major spe-cies present in the solution. Examples of these are shown below:
HBr (aq) + H2O (l) H3O+ (aq) + Br- (aq) (EQ 4.1)
HNO3 (aq) + H2O (l) H3O+ (aq) + NO3- (aq) (EQ 4.2)
H2SO4 (aq) + H2O (l) H3O+ (aq) + HSO4- (aq) (EQ 4.3)
Weak electrolytes are substances that are able to conduct electricity, but conduct poorly. Exam-ples of weak electrolytes are molecular substances that dissociate to a small extent such as weakacids and bases, and ionic compounds that have limited water solubility. They are slightly ioniz-able substances. In chemical equations where ions are included (total and net ionic equations)write the complete weak acid formula, not the ions. The ions are only a minor component in thetotal solution. Examples are shown below:
CH3CO2H (aq) + H2O (l) H3O+ (aq) + CH3CO2- (aq) (EQ 4.4)
HF (aq) + H2O (l) H3O+ (aq) + F- (aq) (EQ 4.5)
HSO4- (aq) + H2O (l) H3O+ (aq) + SO4
2- (aq) (EQ 4.6)
NH3 (aq) + H2O (l) NH4+
(aq) + OH- (aq) (EQ 4.7)
As you complete the experiment, notice the difference in conductivity between strong and weakacids and bases. What does this tell you about the relative degree of dissociation? What are theprincipal species present in the solution? How do we write these substances in ionic equations?
Writing Chemical Reactions
Reaction can be classified into two basic types: oxidation-reduction and double displacement.
1. Oxidation-Reduction (Redox) Reactions: Electrons are transferred from one reactant to another.Most simply oxidation is the loss of electrons and reduction is the gain of electrons.
a. Combination reactions where reactants combine to form a new substance:
A + EAE (EQ 4.8)
b. Decomposition reactions where reactants brake apart into new substances:
AE A + E (EQ 4.9)
c. Single Replacement Reactions involve the reactivity of an element is related to its ten-dency to lose or gain electrons; that is, to be oxidized or reduced. Generally speaking:
4–28 Chemistry 141 Grossmont College

Introduction
A (s) + BC (aq) B (s) + AC (aq) (EQ 4.10)
where A is the more active element and replaces B in the compound.
2. Double Displacement Reactions (aka Ion Exchange Reactions) two aqueous solutions are mixedtogether to produce a precipitate, slightly ionizable substance, or a gas.
AB (aq) + CD (aq) AD (?) + BC (?) (EQ 4.11)
a. Precipitate — formation of an insoluble compound. Solubility rules are given below:
FIGURE 4.1 Solubility Rules
b. Gas — bubbles or effervescence. Common gases include hydrogen gas, H2 (g), oxygengas, O2 (g), hydrogen sulfide, H2S (g), ammonia, NH3 (g), carbon dioxide, CO2 (g), and sul-fur dioxide, SO2 (g).
When these compounds are “formed” they are unstable and decompose into gases and water:
H2CO3 (aq) H2O (l) + CO2 (g) (EQ 4.12)
H2SO3 (aq) H2O (l) + SO2 (g) (EQ 4.13)
“NH4OH” (aq) H2O (l) + NH3 (g) (EQ 4.14)
c. Slightly ionized substance — heat usually accompanies the formation of water, H2O,acetic acid, HC2H3O2, or any other slightly ionized compound (weak acids, weak bases).
Writing Ionic EquationsWhen you write ionic equations, you need to show the principal species present in the solutions. Bytesting the conductivity of a variety of solutions you can determine whether the principal speciesare ions or undissociated or undissolved particles. For each of the substances test for electrical con-ductivity and determine the principal and minor species present in the solution.
• Alkali metals and NH4+ compounds are soluble (i.e. aqueous, (aq)), this means they com-
pletely dissociate in water.
• Nitrates (NO3-), acetates (CH3CO2-) (except for acetates of Al3+, and Ag+), chlorates (ClO3
-),perchlorates (ClO4
-), and sulfates (SO42-) are generally soluble (except for Sr2+, Ca2+, Ba2+,
Pb2+, and Hg22+ sulfates).
• Chlorides (Cl-), bromides (Br-), and iodides (I-) are soluble (except for silver (Ag+), mercury(I)(Hg2
2+), and lead(II) (Pb2+) halides).
• Compounds containing the fluoride ion, F-, are soluble except for group IIA cations and Pb2+.These cations will precipitate out as a fluoride salt.
• Most compounds not included above are not soluble (i.e. precipitates/solids, (s)): i.e. sulfides(S2-), carbonates (CO3
2-), phosphates (PO43-), chromates (CrO4
2-), oxides (O2-), and hydrox-ides (OH-) (Ca(OH)2, CaO, Sr(OH)2, SrO, Ba(OH)2, and BaO are slightly soluble meaningthat they dissociate some, but not completely in water.).
Chemistry 141 Grossmont College 4–29

Conductivity and Net Ionic Equations
ies in
3O2- (aq)
EXAMPLE 4.1Write the balanced conventional equation for the reaction of nitric acid andmagnesium acetate. Remember that the conventional equation shows all species as neutral compounds.
2 HNO3 (aq) + Mg(C2H3O2)2 (aq) Mg(NO3)2 (aq) + 2 HC2H3O2 (aq) (EQ 4.15)
EXAMPLE 4.2Write the total ionic equation for the reaction.Remember that the total ionic equation shows all species as they appear in solution.
2 H+ (aq) + 2 NO3- (aq) + Mg2+ (aq) + 2 C2H3O2
- (aq) Mg2+ (aq) + 2 NO3
- (aq) + 2 HC2H3O2 (aq)(EQ 4.16)
EXAMPLE 4.3Write the net ionic equation for the reaction. The net ionic equation shows only the species that undergo reaction. No spectator ions.
Net Ionic Equation: 2 H+ (aq) + 2 C2H3O2- (aq) HC2H3O2 (aq) (EQ 4.17)
Remember to simplify the coefficients when necessary.
H+ (aq) + C2H3O2- (aq) HC2H3O2 (aq) (EQ 4.18)
EXAMPLE 4.4Complete the following table:
Note that water is omitted as a major species since it a solvent.
Notice that the conductivity is good before and after the reaction due to the presence of ions inthe solutions before and after the reaction.
Information to Include in the Introduction1. Name the three principal bond types.2. Define the following terms and tell what kind of bonding is expected in solutes that are:
a. Non-electrolyteb. Strong electrolytec. Weak electrolyte
3. What is the meaning of the term “hydration” when used to describe what happens to an electro-lyte which is dissolved in water?
4. What is meant by the term dissociation and what is an example of a substance that dissociates?5. What are the essential characteristics of a solution that is (include information regarding its
behavior as well as the types of substances which indicate these types of solutions):a. A nonconductorb. A good conductorc. A poor conductor
TABLE 4.5
Conductivity Ions (None, Few, Many) Major species present in solution Minor spec
solution
Before Rxn:
HNO3 (aq) Good Many H+ (aq), NO3- (aq) n/a
Before Rxn: Mg(C2H3O2)2 (aq) Good Many Mg2+ (aq), C2H3O2
- (aq) n/a
After Reaction Good Many Mg2+ (aq), NO3- (aq), HC2H3O2 (aq) H+ (aq), C2H
4–30 Chemistry 141 Grossmont College

Procedure
ions
ulbs
s lit
SAMPLE
Procedure
Part 1 - Conductivity ClassificationTest and record the conductivity of each substance and solution listed below using the method demonstrated by yourinstructor. Unless otherwise noted waste will go in the inorganic waste container. Then, after noting the range of conduc-tivities measured, classify each as having essentially no ions, a few ions, or many ions. For each substance record also themajor and minor species present in the sample. Your data table may be similar to the one shown below:
TABLE 4.6
SubstanceBond Type(Polar covalent, Ionic)
Conductivity Ions (None, Few, Many)
Major species present in solution
Minor species in solution Observat
HBr (aq)
polar covalent, fully ionized Good Many H3O+ (aq), Br- (aq) n/a
All three blit.
HF (aq)
polar covalent, partially ionized Poor Few HF (aq) H3O+ (aq), F- (aq)
Two bulbweakly.
Deionized waterTap waterMethanol, CH3OH (l)
(organic waste)CH3OH (aq)
(organic waste)Glacial acetic acid
CH3CO2H (l)
CH3CO2H (aq)
(Add water slowly toglacial acetic acidand record how theconductivitychanges.)Sucrose
C12H22O11 (s)
C12H22O11 (aq)
NaCl (s)
NaCl (aq)
KClO3 (s) (Test in a crucible.)KClO3 (l) molten
(Heat crucible using a Bunsen burner.)0.1 M HgCl20.1 M HCl0.1 M NaOH0.1 M CH3CO2H0.1 M NH3
0.1 M NaCl
Chemistry 141 Grossmont College 4–31

Conductivity and Net Ionic Equations
SAMPLE
Part 2 - Effect of SolventTest the conductivity of the following solvents and mixtures. Put all waste in the organic waste container. Your datatable may be similar to the one shown below:
Part 3 - Correlating Chemical and Conductivity BehaviorBe sure to use similar amounts of each solid and acid. You will compare the conductivity of the acids with their reac-tion rates. Compare the rates of reaction (fast, medium, slow, or no reaction) of:
1. calcium carbonate, CaCO3 (s), with 6 M acetic acid and 6 M hydrochloric acid;2. zinc with 6 M acetic acid and 6 M hydrochloric acid.
Part 4 - Observing Changes in Conductivity for Ionic Reactions Measure the conductivities of the acid and base alone, and then titrate the acid with base using a pasteur pipet andobserve the changes in conductivity. Add several drops of phenolphthalein to the acid before you begin the titration.Continue adding several more drops of base after the phenolphthalein turns pink. Note how the conductivity changesas you add base to the acid. Note the changes in conductivity as well as any other changes that may occur as you per-form the titration.
1. Perform the experiment with 0.1 M HCl with 0.1 M NaOH;2. Perform the experiment with 0.1 M CH3COOH with 0.1 M NH3;3. Perform the experiment with 0.1 M H2SO4 with 0.1 M Ba(OH)2.
TABLE 4.7
Substance Conductivity Ions (None, Few, Many)
Major species present in solution
Minor species in solution Observations
Xylene, C8H10 (l) (premade)HCl in xylene (premade)Aqueous layer (after mixing water with HCl in xylene)
TABLE 4.8
Acid ConductivityBefore rxn
Ions (None, Few, Many) Before rxn Rxn Rate CaCO3 (s) Rxn Rate Zn (s) Observations
HCl (aq)
HC2H3O2 (aq)
TABLE 4.9
Conductivity Ions (None, Few, Many) Observations
Before Rxn:
reactant 1Before Rxn:
reactant 2
4–32 Chemistry 141 Grossmont College

Procedure Questions
Procedure Questions
Part 11. Write the equation for the reaction that forms the few (but important) ions in pure water.
2. Why is tap water more conductive than distilled water?
3. Answer the following questions about acetic acid.a. Write an equation to describe the formation of ions in aqueous acetic acid.
b. Why does acetic acid form ions when it is dissolved in water, but not when it is in thepure (glacial) form?
4. The models of solid NaCl describe it as consisting of Na+ cations and Cl- anions.a. If this is the case, why is NaCl (s) not an electrolyte?
b. Explain the distinctly different behavior in the conductivity of NaCl (s) and NaCl (aq).
Chemistry 141 Grossmont College 4–33

Conductivity and Net Ionic Equations
5. Explain the difference in behavior in the conductivity of KClO3 (s) and KClO3 (l).
Part 21. Why is the conductivity of HCl different in the two solvents?
2. What causes this difference?
Part 31. Write the equation for the reactions of:
a. calcium carbonate and acetic acid
b. calcium carbonate and hydrochloric acid;
c. zinc and acetic acid;
4–34 Chemistry 141 Grossmont College

Procedure Questions
d. zinc and hydrochloric acid.
2. Discuss any correlation between the rates of the chemical reactions of 6 M acetic and 6 Mhydrochloric acid and the conductivities observed for acetic acid and hydrochloric acid in part1.
Part 41. Describe what happened as you reacted 0.1 M HCl with 0.1 M NaOH.
a. Write the conventional, total ionic, and net ionic equations for the reaction.
b. Explain any changes in conductivity you detected for this reaction.
Chemistry 141 Grossmont College 4–35

Conductivity and Net Ionic Equations
2. Describe what happened as you reacted 0.1 M CH3COOH and 0.1 M NH3.a. Write the conventional, total ionic, and net ionic equations for the reaction.
b. Explain any changes in conductivity you detected for this reaction.
3. Describe what happened as you reacted 0.1 M H2SO4 with 0.1 M Ba(OH)2.a. Write the conventional, total ionic, and net ionic equations for the reaction.
b. Explain any changes in conductivity you detected for this reaction.
4–36 Chemistry 141 Grossmont College

Post Lab Questions
Post Lab Questions1. Listed below are several substances and their conductivities when dissolved in water. Based on
this information, write the formulas for all of the individual species present. Omit water fromyour list.
2. Recognition of ionic or molecular species present. For each substance, write the formula(s) ofthe principal species (molecular or ionic) present in major amounts in the aqueous solution ifthe substance is soluble; if it is only slightly soluble, use the molecular formula followed by (s).Also include the minor species where appropriate. The first three are done as examples.
TABLE 4.10
Substance Conductivity Major Species Present Minor Species Present
HF (aq) Poor HF (aq) H+ (aq), F- (aq)
K2SO4 (aq) Good
CH2O (l) Non-conductive
HCHO2 (aq) Poor
TABLE 4.11
Substance Major Species Present Minor Species Present
BaSO4 (s) BaSO4 (s) ------------------------------------------------------
CH3COOH (aq) CH3COOH (aq) CH3COO- (aq), H+ (aq)
NaCl (aq) Na+ (aq), Cl- (aq) ------------------------------------------------------
Al(OH)3 (s)
Fe2(SO4)3 (aq)
HBr (aq)
H3PO4 (aq)
Mg(OH)2 (s)
NH4C2H3O2 (aq)
C2H5OH (aq)
HgCl2 (aq)
CuS (s)
Chemistry 141 Grossmont College 4–37

Conductivity and Net Ionic Equations
3. Separate solutions of 0.01 M barium acetate, Ba(C2H3O2)2, and 0.01 M sulfuric acid, H2SO4,are tested for electrical conductivity. Equal volumes of these solutions are then mixed and theconductivity tested again. Predict the result and justify your answer with an appropriate equa-tion.
4. The electrodes of the conductivity apparatus of this experiment are immersed in 10 mL of 0.01M barium hydroxide, Ba(OH)2, and the conductivity is noted. A student blows his breaththrough a glass tube dipped into the solution. Can the student “blow out the light”? Write equa-tions for any reactions, and justify your conclusions. (HINT: CO2 (g) + H2O (l) H2CO3 (aq))
5. Interpretation of Reactions by Ionic Type Equations. Aqueous solutions of the following sub-stances or their mixtures with water if they are only slightly soluble, are mixed. Write first theconventional equation, second the total ionic equation, and lastly the net ionic equation. If youpredict no appreciable reaction, indicate this, and state why.
a. Magnesium chloride and sodium carbonate
b. Aqueous ammonia and acetic acid
4–38 Chemistry 141 Grossmont College

Post Lab Questions
c. Nitric acid and magnesium acetate
d. Ammonium chloride and sodium hydroxide
e. Barium chloride and calcium nitrate
f. Potassium hydrogen carbonate and sulfuric acid
g. Aluminum hydroxide and nitric acid
Chemistry 141 Grossmont College 4–39

Conductivity and Net Ionic Equations
h. Aqueous ammonia and sulfuric acid
i. Magnesium nitrate and zinc chloride
4–40 Chemistry 141 Grossmont College

EXPERIMENT 5 Writing Redox Reactions
ObjectiveTo gain a better understanding of the processes of oxidation and reduction by balancing oxidation-reduction, redox, reactions.
IntroductionThe oxidation state is the imaginary charge an atom would have if shared electrons were dividedequally between identical atoms bound to one another, or, for different atoms, if electrons were allassigned to the atom in each bond that has the greater attraction for electrons. Oxidation corre-sponds to an increase in the oxidation number. The compound being oxidized is the reducingagent. The reducing agent causes a gain in electrons, a loss of oxygen atoms, or a gain of hydro-gen atoms. Reduction corresponds to a decrease in oxidation number. The compound beingreduced is the oxidizing agent. The oxidizing agent causes a loss of electrons, a gain of oxygenatoms, or a loss of hydrogen atoms.
Oxidation States for Common ReagentsMuch useful information about the behavior of oxidizing and reducing agents under various condi-tions can be summarized in the form of charts. Such charts for some common elements are pre-sented in Table 5.1 on page 42 and are repeated again in later experiments where these elements arestudied in greater detail. The charts, with their comments on the behavior of the various com-pounds, will help you predict the probable changes in oxidation state in a particular reaction. Notethat the oxidation state is given just before each formula in the chart.
Chemistry 141 Grossmont College 5–41

Writing Redox Reactions
TABLE 5.1
Oxidation State Formulas Comments
Sulfur Compounds+6 SO3, H2SO4, SO4
2– Concentrated acid is a strong oxidizing agent.
+4 SO2, H2SO3, SO32– Active either as oxidizing agent or reducing
agent.
+2 S2O32–
Thiosulfate ion decomposes to S and H2SO3 in acid solution.
Oxidized to S4O62– (tetrathionate ion) by free I2.
0 S
–1 S22– or Sx
2– Polysulfide ion decomposes to S and H2S in acid solution.
–2 H2S, S2– Strong reducing agent, usually oxidized to S.
Oxygen Compounds, PeroxidesAcidic Basic
0 O2
–1 H2O2 HO2– Active as an oxidizing agent or as a reducing
agent.
–2 H2O OH–
Chlorine Compounds
+7(Cl2O7), HClO4, ClO4
–Cl2O7 is unstable. HClO4 is a very strong oxi-dizing agent reduced to Cl–.
+5 HClO3, ClO3– Strong oxidizing agent. Reduced to Cl–.
+4 ClO2 Explosive.
+3 HClO2, ClO2– Good oxidizing agent. Reduced to Cl–.
+1 Cl2O, HClO, ClO– Good oxidizing agent. Reduced to Cl–.
0 Cl2 Good oxidizing agent. Reduced to Cl–.
–1 Cl–
Nitrogen Compounds
+5 N2O5, HNO3, NO3–
Strong oxidizing agent, usually reduced to NO2 and NO (in dilute. acid). With strong reducing agent may go to NH3.
+4 NO2, (N2O4) A heavy brown gas.
+3 (N2O3, HNO2), NO2– N2O3 and HNO2 are unstable. Nitrites are usu-
ally stable. Oxidizing or reducing agents.
+2 NO Oxidized by air to NO2.
+1 N2O Supports combustion vigorously.
0 N2
–3 NH3, NH4OH, NH4+
o r
o r
o r
o r
5–42 Chemistry 141 Grossmont College

Introduction
Let us comment briefly on the charts for sulfur and oxygen compounds.
It should be obvious from the chart of sulfur compounds that since H2S represents the lowest possi-ble oxidation state it can act only as a reducing agent in an oxidation-reduction, redox, process. Insuch a process it can be oxidized to free sulfur or to some higher state, such as a sulfate, its extent ofoxidation, depending on the conditions and the strength of the oxidizing agent. Sulfuric acid,H2SO4, representing the highest oxidation state, can act only as an oxidizing agent, its reductionproducts being any lower states of sulfur. However, since sulfurous acid, H2SO3, represents anintermediate state of sulfur, it can act either as a reducing agent with substances that can take onelectrons, or as an oxidizing agent with substances that can lose electrons.
Hydrogen peroxide and the peroxides are important oxidizing agents, both commercially and in thelaboratory. Note, from Table 5.1 on page 42, that when hydrogen peroxide acts as an oxidizingagent it is reduced to water or, in basic solution, to hydroxide ion. It is oxidized to free oxygen onlywhen it acts as a reducing agent, in the presence of certain catalysts, is due to the ability of one mol-ecule to oxidize another molecule of the same substance (auto-oxidation-reduction). The half-reac-tions corresponding to these statements are
Reduction: 2 H+(aq) + H2O2 (aq) + 2 e- H2O (l) (EQ 5.1)
Oxidation: H2O2 (aq) 2 H+(aq) + O2 (g) + 2 e- (EQ 5.2)
Auto-Redox: 2 H2O2 (aq) H2O (l)+ O2 (g) (EQ 5.3)
Listed below are some important categories of common oxidizing and reducing agents.
Oxidation State Formulas Comments
Chromium CompoundsAcidic Basic
+6 Cr2O72– CrO4
2– Strong oxidizing agents. Dichromate ion is orange and chromate ion is yellow.
+3 Cr3+ Cr(OH)42– Amphoteric. Cr3+ is green to violet. Cr(OH)4
2– is green.
+2 Cr2+ An uncommon ion, because it is a strong reduc-ing agent that reduces water to hydrogen gas.
0 Cr The metal.
Manganese Compounds
+7 MnO4–
Purple. Strong oxidizing agent, reduced to Mn2+ in acid solution or to MnO2 (sometimes MnO4
2–) in neutral or basic solution.
+6 MnO42– Green. Easily reduced to MnO2.
+4 MnO2, MnO(OH)2 Brown as precipitated from solution.
+3 Mn3+, Mn(OH)3 Mn3+ is unstable, gives Mn2+ and MnO2.
+2 Mn2+, Mn(OH)2Colorless in solution, pale pink as solid Mn(II) salts. Mn(OH)2 is oxidized by air to Mn(OH)3.
0 Mn The metal.
o r
o r
Chemistry 141 Grossmont College 5–43

Writing Redox Reactions
Some Common Oxidizing Agents1. The halogens and oxygen-reduced to their negative ions, such as the following:
2. Ions in which the metal ion has a stable lower oxidation state such as the following:
3. Oxygen containing complex ions, where the central atom is in a high oxidation state:
Some Common Reducing Agents1. The metal oxidized to their positive ions - such as these
2. Ions in which the metal has another higher oxidation state, such as the following:
3. Carbon and organic compounds may be oxidized to CO or CO2 and H2O: a. C (coke, much used in industry) oxidized to CO or to CO2
b. alcohols carboxylic acids
CH3CH2OH (ethanol) may be oxidized to CH3COOH (ethanoic acid) + 4 H+ + 4 e-
c. aldehydes carboxylic acids.
HCHO (formaldehyde) + H2O HCOOH (formic acid) + 2 H+ + 2 e-
Balancing of Oxidation-Reduction (Redox) EquationsIn balancing any oxidation-reduction, redox, reaction, you must first know all of the reactants andproducts. If you do not, you will not be able to balance it correctly. Once the reactants and productsare known, balance the reaction by keeping in mind that, in a redox reaction which is essentially anelectron-transfer reaction, relative amounts of reactants must be taken in such a way that all theelectrons supplied by the oxidation process are used in the reduction process. There are severalmethods for doing this, each differing in mechanics of operation, but all based on the same princi-ple.
The Half-Reaction MethodSeparated half-reactions, or electron reactions, are written for the oxidation and for the reductionprocesses. In developing these, we can first determine the number of electrons required from thechange in oxidation number, then insert H+ (or OH- if the solution is basic) to balance the charges,and finally add H2O to balance the atoms.
The reverse process is sometimes used. First, balance the atoms in half-reactions by inserting H+
and H2O as needed, then insert as many electrons as needed to balance the charges. Study the fol-lowing example:
F2 reduced to F- Cl2 reduced to Cl- O2 reduced to O2-
Ce4+ reduced to Ce2+ Mn3+ reduced to Mn2+ Co3+ reduced to Co2+
MnO- reduced to Mn2+ ClO3- reduced to Cl-
Cr2O72- reduced to Cr3+ NO3
- reduced to NO
Sn oxidized to Sn4+ Zn oxidized to Zn2+
Sn2+ oxidized to Sn4+ Fe2+ oxidized to Fe3+ Hg22+ oxidized to Hg2+
5–44 Chemistry 141 Grossmont College

Introduction
EXAMPLE 5.2
Let us consider the oxidation of potassium sulfite, K2SO3, by potassium dichromate, K2Cr2O7, in anacid solution (assume hydrochloric acid for this example). Referring to the charts of oxidationstates for sulfur compounds, we find that sulfite ions will be oxidized to sulfate ions ignoring thespectator ions of potassium:
SO32- (aq) SO4
2- (aq) (EQ 5.4)
We need another oxygen atom on the left; this is supplied by water, and we write the hydrogens as2 H+ on the right. (Note that we keep oxidation states of oxygen -2 and hydrogen +1 on both sidesof the equation, since they are not the substances oxidized and reduced.) Our partial equation thenbecomes:
H2O (l) + SO32- (aq) SO4
2- (aq) + 2 H+ (aq) (EQ 5.5)
We still need to balance the charges so they are the same on both sides of the equation. To do so we add two electrons to the right:
H2O (l) + SO32- (aq) SO4
2- (aq) + 2 H+ (aq) + 2 e- (EQ 5.6)
Thereby completing the oxidation half-reaction, and demonstrating the fact that in an oxidationprocess, electrons are lost.
Referring to the charts of oxidation states for chromium compounds, we find that the dichromateion will be reduced to the chromic ion, Cr3+, as will be evidenced by the green color of the solution.The several steps are as follows. First balance the number of chromium atoms by putting a 2 infront of Cr3+:
Cr2O72-
(aq) Cr3+ (aq) (EQ 5.7)
Next, balance the oxygen atoms by adding 7 H2O:
Cr2O72-
(aq) Cr3+ (aq) + 7 H2O (l) (EQ 5.8)
Then balance the hydrogen atoms and oxygen by inserting 14 H+ to react with the 7 oxygen atomsto form the 7 H2O:
Cr2O72-
(aq) + 14 H+ (aq) Cr3+
(aq) + 7 H2O (l) (EQ 5.9)
Finally, we balance the charges. As above written, we have 12 positive on the left and 6 positive onthe right, or a net charge of +6 on the left. We therefore need 6 electrons on the left to complete thereduction half-reaction:
6 e- + Cr2O72-
(aq) + 14 H+ (aq) Cr3+
(aq) + 7 H2O (l) (EQ 5.10)
This emphasizes the fact that in a reduction process electrons are gained. Note the requirement of 6electrons corresponds to the charge in oxidation state of chromium from +6 to +3, so two chro-mium atoms decrease by a total of 6 charges.
Finally, we may combine the two processes in such a way that we balance electrons gained againstelectrons lost.
Chemistry 141 Grossmont College 5–45

Writing Redox Reactions
To do this we multiply the oxidation half-reaction by 3 and add algebraically to the reduction half-reaction:
(H2O (l) + SO32- (aq) SO4
2- (aq) + 2 H+ (aq) + 2 e-) 3 (EQ 5.11)
Now that the number of electrons transferred for the oxidation and reduction half-reactions areequal, 6 e-, the two half-reactions are:
3 H2O (l) + 3 SO32- (aq) SO4
2- (aq) + 6 H+ (aq) + 6 e- (EQ 5.12)
6 e- + Cr2O72-
(aq) + 14 H+ (aq) Cr3+
(aq) + 7 H2O (l) (EQ 5.13)
Adding the two half-reactions together:
3 H2O (l) + 3 SO32-
(aq) + 6 e- + Cr2O72-
(aq) + 14 H+(aq) SO4
2-(aq) + 6 H+
(aq) + 6 e-Cr3+(aq) + 7 H2O (l)(EQ 5.14)
Canceling like terms, H2O (l), e-, and H+(aq), from both sides of the equation the balanced net ionic
equation is:
3 SO32- (aq) + Cr2O7
2- (aq) + 8 H+
(aq) SO42- (aq) +Cr3+
(aq) + 4 H2O (l) (EQ 5.15)
Always check your results to make certain that both atoms and charges are balanced in the equa-tion.
Adding back the potassium and chloride counterions for the reaction gives the balanced molecularequation of:
3 K2SO3 (aq) +K2Cr2O7 (aq) + 8 HCl (aq) 3 K2SO4 (aq) +CrCl3 (aq) + 4 H2O (l) + 2 KCl (aq) (EQ 5.16)
5–46 Chemistry 141 Grossmont College

Post Lab Questions
Oxidation number decrease per atom
Post Lab Questions1. As a review, in the following equations for familiar reactions, underline the reducing agent once and oxidiz-
ing agent twice. At the right, indicate the change in oxidation number per atom for each element concerned. Ifthere is no change write no valance change “NVC.”
TABLE 5.3
Reactions Element Oxidized
Oxidation Number increase per atom
Element Reduced
2 Al (s) + 3 Cl2 (g) 2 Al3+ (aq) + 6 Cl- (aq)
Ag+ (aq) + Cl- (aq) AgCl (s)
Mg (s) + 2 H+ (aq) Mg2+ (aq) + H2 (g)
Cu2+ (aq) + H2S (g) CuS (s) + 2 H+ (aq)
Ba (s) + 2 H2O (l) Ba2+ (aq) + 2 OH- (aq) + H2 (g)
3 Na2O2 (s) + Cr2O3 (s) + H2O (l) 6 Na+ (aq) + 2 CrO42- (aq) + 2 OH- (aq)
H2O2 (aq) H2O (l) + ½ O2 (g)
CO2 (g) + H2O (l) H2CO3 (aq)
CO2 (g) + C (s) 2 CO (g)
HCl (g) + NH3 (g) NH4Cl (s)
2 ZnS (s) + 3 O2 (g) 2 ZnO (s) + 2 SO2 (g)
4 H+(aq) + 2 Cl-(aq) + MnO2 (s) Mn2+
(aq) + Cl2 (g) + 2 H2O (l)
10 H+(aq) + SO4
2- (aq) + 8 I-
(aq) 4 I2 (s) + H2S (g) + 4 H2O (l)
Chemistry 141 Grossmont College 5–47

Writing Redox Reactions
2. Show the change in oxidation number (give the number of electrons gained or lost per atom) inthe following:
3. Give the formula of a product (derived from the first substance in the statement) that may beformed in the following reactions. (Note: in the example any lower oxidation state compound ispossible; but not any higher one. Some are more probable than others.)
TABLE 5.4
Reaction Number of e- lost of gained per atom PO3
3- (aq) PO43- (aq) P lost 2 e-
NO2– (aq)
NO3–
(aq)
SO2 (g) S22–
(aq)
MnO4– (aq) MnO2 (s)
KClO2 (s) KCl (s)
NH3 (g) NH4+
(aq)
HCOOH (aq) HCHO (aq)
TABLE 5.5
Reaction Possible ProductsH2SO3 is treated with a reducing agent S (s), S2
2– (aq), or H2S (g)
HClO2 is treated with a reducing agent
H2SO3 is treated with an oxidizing agent
SnCl4 is treated with zinc dust
Cr2O72-
is treated with SnCl2
KMnO4 is treated with FeSO4
MnO2 is treated with concentrated HCl
5–48 Chemistry 141 Grossmont College

Post Lab Questions
4. Write the half-reaction equation for the oxidation of:
5. Write the half-reaction equation for the reduction of:
TABLE 5.6
Reaction Balanced Net Ionic EquationNO2
– (aq) to NO3– (aq) (acidic)
H2S (g) to SO42-
(aq) (acidic)
NH4+
(aq) to NO3
– (aq)
(acidic)
H2O2 (aq) to O2 (g) (basic)
Cr(OH)4– (aq) to CrO4
– (aq)
(basic)ClO–
(aq) to ClO4
– (aq)
(acidic)
HCOOH (aq) to CO2 (g) (acidic)
TABLE 5.7
Reaction Balanced Net Ionic EquationSO3
2– (aq)
to H2S (g) (acidic)
MnO42-
(aq) to MnO2 (s) (basic)
HO2-
(aq) to OH–
(aq) (basic)
HCOOH (aq) to CH3OH (aq) (acidic)ClO3
– (aq)
to Cl– (aq) (acidic)
Cr2O72- (aq) to Cr3+
(aq) (acidic)
CH3NO2 (aq) to CH3NH2 (aq) (acidic)
Chemistry 141 Grossmont College 5–49

Writing Redox Reactions
6. Given the reactants and products, write balanced net ionic equations for the following reactions.Supply H2O, H+, or OH- as needed.
a. Iron filling are added to an aqueous iron(III) chloride solution.
Fe (s) + Fe3+ (aq) Fe2+ (aq)
b. Bismuth metal is dissolved in hot, concentrated nitric acid, HNO3, giving off a browngas.
Bi (s) + NO3- (aq) Bi3+ (aq) + NO2 (g)
c. A mixture of sodium sulfide, Na2S, sodium hypochlorite, NaClO, and sodium hydrox-ide, NaOH, solutions is warmed, giving a suspended precipitate.
S2- (aq) + ClO- (aq) S (s) + Cl- (aq)
d. Sulfur dioxide gas, SO2, is bubbled into an acidic potassium dichromate, K2Cr2O7, solu-tion.
SO2 (g) + Cr2O72-
(aq) Cr3+ (aq) + SO42-
(aq)
7. Predict the products and write a balanced net ionic equation for the following reactions:a. Tin(II) chloride is added to potassium permanganate solution in acidic conditions.
b. Zinc dust is treated with dilute nitric acid, forming ammonium ions.
c. Potassium permanganate oxidizes the oxalate ions in calcium oxalate to carbon dioxidein an acidic solution.
5–50 Chemistry 141 Grossmont College

EXPERIMENT 6 Redox Reactions – The Activity Series
ObjectiveIn this experiment you will perform several reactions between various metals and solutions of ioniccompounds. The goal is to determine the relative reactivity of the elements. By observing the reac-tions that occur (or do not occur), an activity series will be created.
IntroductionRedox reactions are defined as reactions in which electrons are transferred from one element toanother. The element that gains one or more electrons is said to be reduced and the element thatloses one or more electrons is said to be oxidized. There are many types of redox reactions but inthis experiment, we will limit our examination to single displacement reactions. These arereactions in which an ion in solution gets replaced by some other ion. The ion originally in solutiongets reduced or oxidized to the elemental form. The ion that ends up in the final solution is formedby oxidation of a metal atom, oxidation of a metal cation or reduction of a nonmetal.
EXAMPLE 6.1
1. Cu (s) + 2 AgNO3 (aq) 2 Ag (s) + Cu(NO3)2 (aq)In this reaction, copper metal is oxidized to the Cu2+ ion and replacesthe silver ion, which is reduced to silver metal.2. Fe(NO3)2 (aq) + 3 AgNO3 (aq) 3 Ag (s) + Fe(NO3)3 (aq)In this example, the Fe2+ ion is oxidized to the Fe3+ ion. Here the Fe3+
ion replaces the Fe2+ ion in solution while silver ion gets reduced to themetal.3. Zn (s) + 2 HBr (aq) ZnBr2 (aq) + H2 (g)Acids can also oxidize metals: notice that zinc metal gets oxidized bythe hydrogen ion. Hydrogen ion gets reduced to form H2
4. 2 KI (aq) + F2 (g) I2 (s) + 2 KF (aq)In this reaction, the nonmetal anion, iodide ion, is being oxidized toelemental iodine while fluorine gets reduced to the fluoride anion.
Chemistry 141 Grossmont College 6–51

Redox Reactions – The Activity Series
In each case in Example 6.1 the overall process is the same: one species gets oxidized whileanother species gets reduced. Or to say this another way: one species replaces another in solution.
Referring to Example 6.1, determine which species in each pair is more active:
1. copper or silver?
Answer: copper
2. silver ion or iron(II) ion?
Answer: iron(II) ion
3. iodide or fluorine?
Answer: fluorine
In this experiment, the student will perform several redox reactions and determine the relative easeof oxidation for each element. An activity table will be constructed based upon the results. Forexample:
Therefore, the activity series for Pb, Cu, and Hg from most active to least is Pb > Hg > Cu.
EXAMPLE 6.2
If a strip of copper metal is placed into a solution of mercury(II)chloride, the solution will become blue over time and a small pool ofliquid mercury will collect at the bottom of the container. The reactionwritten below is occurring.
Cu (s) + HgCl2 (aq) Hg (s) + CuCl2 (aq)
Copper is more easily oxidized than mercury because we observe thatthe copper replaces the mercury as the more oxidized substance. If wewere to try the reverse reaction, that is to pour some liquid mercuryinto a solution of copper chloride, there would be no reaction. Againwe would conclude that copper is more easily oxidized becausemercury is not able to replace copper as the more oxidized substance.We state that copper is more active than mercury because it is themost easily oxidized. The actual reaction that occurs is called the netionic reaction:
Cu (s) + Hg 2+ (aq) Hg (s) + Cu2+
(aq)
If the reaction proceeds to the right, copper is more active thanmercury. If the reaction proceeds to the left, mercury is more activethan copper. Because the reaction proceeds to the right, copper is themore active metal.
EXAMPLE 6.3
A strip of copper metal is dropped into a solution of lead(II) chloride.There is no visible reaction. Which is more active, copper or lead?
Answer: lead
Combining the results of this experiment with the results from thereaction between copper and mercury ion (Example 6.2), can youdetermine whether lead is more or less active than mercury?
Answer: lead is more active than mercury.
6–52 Chemistry 141 Grossmont College

Procedure
ProcedureYou will mix the following sets of substances and determine the more easily oxidized species ineach case. From the relative oxidizability of each set, you will develop a comprehensive activityseries. Be sure the data is clearly organized, and that clear and complete observations are made foreach reaction. Observations should include color changes, temperature changes, gas formation, andprecipitate formation.
In this procedure, there are various combinations of reactants to observe:
Reactions between a metal and a salt solution. The student must determine whether the metal orthe salt cation is more active. The actual comparison is to determine which metal is more easily oxi-dized (more active).
Reactions between a metal and an acid solution. The student must determine whether the metalor the hydrogen ion is more active. The actual comparison is between a metal and hydrogen.
Reactions between a halogen (I2 and Br2) and a halide ion. The student must determine whichhalide ion is more active. The actual comparison is that between halogens.
Reactions between a halide ion and a metal ion. ''The student must determine whether the halideion or metal ion is more active. The actual comparison is between a metal and a nonmetal.
As you perform each reaction, keep in mind the following:
1. Be sure to sand all of the metal pieces to provide a clean metal surface.2. Watch the reactions for at least 15 minutes before deciding whether or not a reaction has
occurred. Some of the reactions are slow.3. Describe the reactions that occur in such a manner that you could identify it from your lab note-
book. Describe texture, color, location of precipitate (i.e., bottom of test tube or a deposit on themetal strip), etc. Be detailed in these descriptions, they are you observations and therefore yourdata.
4. Note that some of the metals are reacted with acids. Here, the cation is H+, which will bereduced to H2 (g) if a reaction occurs.
Reactions:
Metal + salt solution.
1. Place a strip of copper metal into a 3 mL sample of 0.1 M ZnSO4.
EXAMPLE 6.4 Sample Data LogAu3+
(aq) + I- (aq)
Log: Mixed with 1 mL of KI with about 1 mL of gold(III) nitrate. Observations: The solution became darker and it was difficult todetermine what was happening. After the reaction had progressed forabout 10 minutes, I poured some of the supernatant into another tubeand added hexane. A pink color was extracted into the hexane layer.The net ionic reaction would be:2 Au3+
(aq) + 6 I- (aq)
2 Au (s) + 3 I2 (s)
Analysis: Stronger oxidizing agent is Au. More active element is I.
Chemistry 141 Grossmont College 6–53

Redox Reactions – The Activity Series
2. Place a strip of copper metal into a 3 mL sample of 0.1 M FeSO4.3. Place a strip of zinc metal into a 3 mL sample of 0.1 M CuSO4.4. Place a strip of zinc metal into a 3 mL sample of 0.1 M FeSO4.5. Place a piece of steel wool (iron) into a 3 mL sample of 0.1 M CuSO4.6. Place a piece of steel wool (iron) into a 3 mL sample of 0.1 M ZnSO4.
Metal + acid solution.
1. Place a strip of copper metal into a 3 mL sample of 1.0 M H2SO4 (or what the stockroom hasavailable for this experiment).
2. Place a strip of zinc metal into a 3 mL sample of 1.0 M H2SO4 (or what the stockroom has avail-able for this experiment).
3. Place a piece of steel wool (iron) into a 3 mL sample of 3.0 M H2SO4 (or what the stockroomhas available for this experiment).
Halogen + halide solution. For reactions involving the halogens, a two-phase system will be used.The halide ion is soluble in water and the halogen will be partitioned between an aqueous layer andan organic (hexane) layer. The student must first be able to recognize what happens when a halideion is oxidized to the halogen: When a halide gets oxidized, the resulting halogen dissolves into theorganic layer and the hexane becomes colored. Hexane is a colorless liquid. The appearance of acolored hexane layer is evidence for oxidation of a halide ion to the halogen.
1. Mix 3 mL of 0.1 M KBr with 1 mL of hexane (this may be already prepared for you by thestockroom). Add a few drops of I2.
2. Mix 3 mL of 0.1 M KI with 1 mL of hexane (this may be already prepared for you by the stock-room). Add a few drops of Br2.
Halogen/Halide + metal/metal ion. You will examine the redox chemistry of iron(III) ions andcopper metal with the halogen/halides. Use the information gained in these experiments to get acomplete activity series.
All balanced equations should be redox equations. Do not include the reactions of copper withammonia or the reactions to detect halides with silver nitrate. Note that the Fe3+ ion will be reducedto Fe2+ ion if a reaction occurs. Also remember that the hexane is used only to detect the presenceof either I2 or Br2.
NOTE: This simple procedure must be done before the halogen reac-tions are performed so that the student easily recognizes what happenswhen the halides are oxidized.
1. Add a few drops of I2 (in methanol) to a mixture of 3 mL of water and 1 mL ofhexane.
2. Shake well and record the color of the organic, hexane, layer and the color ofthe aqueous layer. The halogen will dissolve into the organic layer.
3. Repeat with the Br2 (in water). Now you know how to detect the presence of ahalogen.
CAUTION: When you are finished working with the halogen solu-tions, dispose of them in the appropriate container in the hood.
6–54 Chemistry 141 Grossmont College

Results and Calculations
1. Mix 1 ml of 0.1 M FeCl3 with 2 mL of 0.1 M KBr.2. Mix 1 ml of 0.1 M FeCl3 with 2 mL of 0.1 M KI.3. Add some copper turnings to 10 mL of Br2 water. Shake well for several minutes. Allow any
precipitate that forms to settle and pour off some of the liquid phase into each of two new testtubes. To the first tube add a few drops of 0.1M AgNO3, does a AgBr precipitate form?
To the second tube add 1 mL of 6 M NH3, does a blue Cu(NH3)42+ (tetraamminecopper(II) ion)
complex form?
4. Add some copper turnings to 15 mL of 0.05 M I2 methanol. Shake well for several minutes.Allow any precipitate that forms to settle and pour off some of the liquid phase into each of twonew test tubes. To the first tube add a few drops of 0.1M AgNO3, does a AgI precipitate form?
5. To the second tube add 1 mL of 6 M NH3, does a blue Cu(NH3)42+ (tetraamminecopper(II) ion)
complex form?
Results and Calculations
In your lab book create a table like Table 6.5 on page 56. Be sure to write balanced equations foreach reaction that occurred. If no reaction occurs state that by writing NO RXN. Do not write outreactions that will not occur. Remember that you can determine relative activity from a null resultas well as a positive result. For each experiment note which of the two elements is more active.
Be careful when you start working with the halogens. All of the balanced equations should be redoxequations. Do not include the reactions of copper with ammonia or the reactions to detect halideswith silver nitrate in your report.
Note that Fe3+ will be reduced to Fe2+ if a reaction occurs. Also remember that hexane is used onlyto detect the presence of either I2 or Br2.
From the data you have gathered in this experiment, develop an activity series for Br, Cu, Fe, Fe3+,H, I and Zn, as was done for Pb, Cu, and Hg in the introduction.
• Did you have any difficulties determining the activity series? • If so, what species are you unsure of the relative activities? • What additional experiments might help you to make a better assessment of the relative activi-
ties?
NOTE: You may see a precipitate of CuI2 here, do the test for Cu2+ to besure that the expected reaction occurred.
Chemistry 141 Grossmont College 6–55

Redox Reactions – The Activity Series
ore ctive
TABLE 6.5
Reactants Observation Net Ionic Reaction Element Oxidized
Element Reduced
Stronger Oxidizing Agent
MA
1 Cu Zn2+
2 Cu Fe2+
3 Zn Cu2+
4 Zn Fe2+
5 Fe Cu2+
6 Fe Zn2+
7 Cu H+
8 Zn H+
9 Fe H+
10 I2 Br
11 Br2 I
12 Fe3+ Br
13 Fe3+ I
14 Cu I2
15 Cu Br2
SAMPLE
6–56 Chemistry 141 Grossmont College

EXPERIMENT 7 Copper Reactions
ObjectiveSeven reactions are carried out, and their qualitative features are carefully observed and recorded.The basic objectives of this investigation are to illustrate the following:
1. the four reaction categories;2. some of the signs which indicate that a chemical reaction has occurred or is in progress;3. the wide variety of stoichiometric ratios featured in chemical reactions;4. transform copper into various copper compounds and reclaim pure copper.
IntroductionSeveral interesting concepts may be demonstrated by studying a sequence of reactions involvingcompounds of copper. Included in this series are double displacement, decomposition, acid-base,and oxidation-reduction processes.
A quantity of copper metal, issued to each student, is reacted in the first of several procedures to begiven. The experiment will guide you in transforming copper into various copper compounds andback to pure copper.
In the final step, copper metal is recovered and weighed. A comparison of the mass of reclaimedcopper with the mass of the original sample provides evidence of how carefully the experiment hasbeen performed by calculating the percent recovery of the copper.
(EQ 7.1)
% recovery actual yieldtheoretical yield-------------------------------------- 100 =
Chemistry 141 Grossmont College 7–57

Copper Reactions
For each reaction, you will write a balanced chemical equation, calculate a theoretical yield, andclassify the type of reaction. Example 7.1 below illustrates possible one transformation. It is notdone is this experiment, but could be.
Procedure
Step 1: Preparation of copper(II) nitrate from copper metal
Cu (s) + HNO3 (aq) Cu(NO3)2 (aq) + NO2 (g) + H2O (l) (EQ 7.4)
1. Place the weighed sample of copper in a 250 mL beaker and slowly add 2 mL of 16 M HNO3
(aq). The brown gas evolved is nitrogen dioxide, NO2. Be sure to describe the appearance of youroriginal piece of copper.
2. The reaction mixture may be heated on a hot plate to facilitate the reaction; do not boil the mix-ture to dryness.
3. Allow the mixture to stand until all the metal has reacted, and then slowly dilute the solutionthat remains with 20 mL of distilled water.
Step 2: Preparation of copper(II) hydroxide from copper(II) nitrate
Cu(NO3)2 (aq) + NaOH (aq) (EQ 7.5)
4. To the solution from “Step 1: Preparation of copper(II) nitrate from copper metal” on page 58,add 8 M NaOH (aq) solution drop by drop, with constant stirring. The solid that forms is cop-per(II) hydroxide.
5. Continue the addition of the 8 M NaOH (aq), frequently testing the solution with red litmuspaper. This is readily done by touching a clean stirring rod to the solution and transferring a
EXAMPLE 7.1
How would you prepare and isolate copper(II) sulfide from copper(II) nitrate?
Answer: You would mix it with a solution of potassium sulfide. The copper(II) sulfidewould precipitate and you could filter the solution and the precipitate would containpure copper sulfide. The potassium nitrate would remain in solution and be discardedwith the filtrate.
Balanced chemical reaction:
Cu(NO3)2 (aq) + K2S (aq) CuS (s) + 2 KNO3 (aq) (EQ 7.2)
Theoretical yield:
(EQ 7.3)
Reaction Type: Double displacement/precipitation
NOTE: You should have a clearly written log of what you did and saw.Be sure to note any unusual or unexpected observations in your runninglog. Good descriptions are important here.
0.578g Cu(NO3 2187.57g Cu(NO3 2
65.38mol Cu(NO3 2-------------------------------------------------- 1mol CuS
1mol Cu(NO3 2--------------------------------------- 95.61g CuS
1mol CuS----------------------------- 0.294 g CuS=
7–58 Chemistry 141 Grossmont College

Procedure
drop of liquid to a piece of litmus paper. When the solution becomes basic, the litmus paper willturn blue.
6. At this point, discontinue the addition of NaOH (aq) since the precipitation of the hydroxide isessentially complete.
Step 3: Preparation of copper(II) oxide from copper(II) hydroxide
Cu(OH)2 (s) (EQ 7.6)
7. Add 30 mL of deionized water to the mixture from “Step 2: Preparation of copper(II) hydroxidefrom copper(II) nitrate” on page 58.
8. Stirring constantly, gently boil the mixture until the solid copper(II) hydroxide is completelyconverted to copper(II) oxide.
9. The precipitate should settle to the bottom of the beaker as it boils. It may be stored until thenext lab period at this point.
10. Perform a suction filtration and collect the copper(II) oxide in a Büchner funnel. A fiberglasspad filter paper should be used. Be sure to place the rough side up and wet it with water beforebeginning the filtration.
FIGURE 7.1
11. The filtrate may be discarded if it is free of black copper(II) oxide; otherwise it must be pouredback into the funnel and filtered again.
12. Remove the suction from the filter flask and wash the solid in the funnel with a small volume ofdeionized water; apply suction in order to remove the wash liquid.
13. Repeat this operation and then discard all the wash solutions. 14. Do not store the solid collected here until the next lab period!
Be careful not to transfer any of the blue precipitate during this proce-dure since it can produce a blue coloration of the paper even though thesolution is not alkaline.
Chemistry 141 Grossmont College 7–59

Copper Reactions
Step 4: Preparation of copper(II) sulfate from copper(II) oxide
CuO (s) + H2SO4 (aq) (EQ 7.7)
15. Rinse the filter flask several times with distilled water. Reassemble the filtration apparatus, butdo not apply suction during this step, a reaction with sulfuric acid is occurring.
16. Slowly add 2 M H2SO4 (aq) drop by drop to the funnel. Allow sufficient time for the solid to reactin order to avoid using a large excess of the acid.
17. A total of 4 to 5 mL of the acid solution is required. 18. The contents of the funnel may be swirled, but this should be done carefully to avoid spillage. 19. There is a tendency for filter paper to lift off the surface of the funnel during this operation. This
should cause no problem as long as any oxide which passes through the filter undergoes reac-tion in the filtration flask.
20. Continue the addition of 2 M H2SO4 (aq) until the oxide has completely reacted and all thatremains is an aqueous solution containing copper(II) sulfate.
21. Apply suction to the filtration apparatus to draw the solution into the filter flask. 22. Rinse the funnel and filter paper with several small portions of deionized water and collect this
wash liquid in the flask. 23. Carefully pour the contents of the filter flask into a clean 250 mL beaker. 24. Rinse the flask with a stream of deionized water, allowing the liquid to flow into the beaker.
Step 5: Preparation of copper(II) phosphate from copper(II) sulfate.
CuSO4 (aq) + Na3PO4 (aq) (EQ 7.8)
25. Add 8 M NaOH (aq) drop by drop, with constant stirring, to the solution from “Step 4: Prepara-tion of copper(II) sulfate from copper(II) oxide” on page 60. This addition is continued until ablue precipitate of copper(II) hydroxide just begins to persist.
26. Then introduce 20 mL of 0.5 M Na3PO4 (aq) and stir the mixture thoroughly. 27. Allow any precipitate of copper(II) phosphate to settle and test the supernatant liquid with lit-
mus paper.28. If the liquid is acidic (indicator color is red), carry out a dropwise addition of 8 M NaOH (aq),
with constant stirring, until it is just basic, and allow the precipitate to settle. 29. Carefully decant the supernatant, if possible, and dispose of it. Use an eye-dropper to remove as
much of the remaining supernatant as possible without removing any precipitate. 30. Save all of the precipitate (note the color in your lab book) for“Step 6: Preparation of copper(II)
chloride from copper(II) phosphate” on page 60.
Step 6: Preparation of copper(II) chloride from copper(II) phosphate
Cu3(PO4)2 (s) + HCl (aq) (EQ 7.9)
31. Add sufficient 6 M HCl with stirring to the beaker containing the copper(II) phosphate precipi-tate to dissolve all of the precipitate.
Step 7: Preparation of copper from copper(II) chloride
CuCl2 (aq) + Al (s) (EQ 7.10)
7–60 Chemistry 141 Grossmont College

Calculations and Results
32. To the solution from “Step 6: Preparation of copper(II) chloride from copper(II) phosphate” onpage 60 add a piece aluminum foil about the size of your filter paper and stir.
33. Two chemical reactions are evident: (a) the principal one in which a deposit of elemental copperappears; and (b) a side reaction in which hydrogen gas is evolved.
34. It may be necessary to introduce an additional small quantity of aluminum in order to completethe principal reaction.
35. Additional 6 M HCl also may be needed to react with any excess aluminum. The completion ofthe principal reaction is indicated by the disappearance of the blue color of the solution and theabsence of further copper formation.
Al (s) + HCl (aq) (EQ 7.11)
36. To test for completeness of the reaction withdraw a 1-2 mL sample of the solution and add 6 Mammonia until you have a solution which is basic to litmus.
37. If copper is present you should observe the formation of a bright blue copper ammonium com-plex.
38. During the final stages of the reactions, weigh a piece of Whatman No. 4 filter paper. This papershould be suitable for gravity filtration of the copper metal product.
39. Proceed with the filtration once the formation of copper metal is complete and there are nopieces of aluminum remaining.
40. Fine particles of copper tend to pass through the filter paper, but usually the quantity is not sig-nificant and can be ignored.
41. Wash the copper with deionized water and then a few mL of acetone, a volatile liquid that per-mits the copper to dry rapidly.
42. Remove the filter paper from the funnel and spread it out on a dry watch glass so that the copperproduct may dry.
43. Meanwhile, weigh a clean, dry sample bottle. Be sure to describe the appearance of yourreclaimed copper.
44. Place the dried, reclaimed copper and the filter paper in the sample bottle and reweigh. 45. Put a label on the bottle containing your name and the mass of the recovered copper. 46. Give the sample to your lab instructor for further evaluation. 47. The quality of the product depends on color and dryness as well as absence of visible impurities.
Calculations and Results1. For each reaction you will:
a. Write a description of what you did and what you observed.b. Write a balanced equation for the reaction and identify its type as double displacement,
decomposition, acid-base, and/or redox.c. Calculate the theoretical yield (expected yield) of the product based upon the theoretical
yield of the preceding step.
NOTE: You need to summarize your major data. This may be done sev-eral ways including: a list or a table
Chemistry 141 Grossmont College 7–61

Copper Reactions
2. Obtain the mass of copper reclaimed in “Step 7: Preparation of copper from copper(II) chloride”on page 60.
3. Calculate the actual yield of the copper metal.4. Calculate the percent recovery of the copper metal.5. Calculate the percent error for the theoretical and actual amount of copper obtained.
.EXAMPLE 7.2
A 0.250 g sample of zinc metal was dissolved in 10.0 mL of 6.0M HCl. When the shiny zinc was added to the HCl, it dissolvedwith the production of considerable gas to yield a colorlesssolution. The reaction was highly exothermic.
Zn (s) + 2 HCl (aq) ZnCl2 (aq) + H2 (g) (EQ 7.12)
Reaction Type: Redox
If 0.4632 g of zinc chloride was recovered, what is the percentrecovery?
theoretical yield 0.250g Zn136.26g ZnCl2
65.38g Zn------------------------------------ 0.521 g ZnCl2= =
% recovery actual yieldtheoretical yield-------------------------------------- 100 0.4632g
0.521g-------------------- 100 88.9% = = =
7–62 Chemistry 141 Grossmont College

Post Lab Questions
Post Lab Questions 1. If you need to produce 3.50 kg of copper metal from a contaminated sample of reclaimed cop-
per wiring, which is 68.3% copper, how many kg of reclaimed copper wiring would you need tobuy if your percent yield at each step is 90%? Assume that you will isolate the copper wiring bygoing through the steps in this lab. Be sure to show all stoichiometry used.
Chemistry 141 Grossmont College 7–63

Copper Reactions
2. How might you prepare (in one step) copper(II) nitrate from copper(II) chloride? Include inyour answer: the reagent that you would add, a description of the equation that would takeplace, and an explanation of how you would then isolate the pure copper(II) nitrate from thereaction mixture.
3. How might you prepare (in one step) copper(II) hydroxide from copper(II) sulfate? Include inyour answer: the reagent that you would add, a description of the equation that would takeplace, and an explanation of how you would then isolate the pure copper(II) hydroxide from thereaction mixture.
7–64 Chemistry 141 Grossmont College

EXPERIMENT 8 Analysis of a Two-Component Alloy
ObjectiveThe goal in this experiment is to determine the mass percentage of each metal present in a sampleof zinc-aluminum alloy.
Introduction
Some of the more active metals, such as magnesium, will react readily with solutions of strongacids. The products from this reaction are hydrogen gas and a solution of a salt of the metal.
Mg (s) + 2 H+(aq) Mg2+
(aq) + H2 (g) (EQ 8.1)
From this equation it is clear that a mole of magnesium produces one mole of hydrogen gas. If thehydrogen was collected under known conditions, it would be possible to calculate the mass of mag-nesium in a pure sample by measuring the amount of hydrogen gas produced by reaction with acid.
Scandium reacts spontaneously with strong acids in a manner similar to that shown by magnesium.
2 Sc (s) + 6 H+(aq) 2 Sc3+
(aq) + 3 H2 (g) (EQ 8.2)
Using this reaction, it is possible to find the amount of scandium in a pure sample by measuring theamount of hydrogen produced by its reaction with an acid solution. In this reaction one and a halfmoles of hydrogen are produced by each mole of scandium that reacts.
Since the amount of hydrogen produced by a gram of Mg is not the same as the amount producedby a gram of Sc, it is possible to react an alloy of Mg and Sc of known mass with excess acid, deter-mine the amount of hydrogen gas evolved, and calculate the percentages of Mg and Sc in the alloyusing reaction equation 8.1 and 8.2 above.
Chemistry 141 Grossmont College 8–65

Analysis of a Two-Component Alloy
In this experiment, you will react a weighed sample of a two-metal alloy with excess acid and col-lect the hydrogen gas evolved over water. If you measure the volume, temperature, and total pres-sure of gas and use the Ideal Gas Law, taking into account the pressure of water vapor in thesystem, you can calculate the number of moles of hydrogen gas produced by the sample.
(EQ 8.3)
where P is the partial pressure of hydrogen gas. The volume, V, and the temperature T of the hydro-gen are easily obtained from the data. The pressure of the dry hydrogen, , requires more atten-tion. The total pressure Pbar, is, by Dalton's Law, equal to the partial pressure of the hydrogen, ,plus the partial pressure of the water vapor, , plus or minus the water head pressure (asexplained below), Ph. For this experiment Pbar is equal to the measured barometric pressure.
(EQ 8.4)
The water vapor in the bottle is present with liquid water so the gas is saturated with water vapor;the pressure under these conditions is equal to the vapor pressure of water at the temperatureof the experiment. This value is constant at a given temperature, and can be found in your textbook.Once the water vapor pressure is known it can be subtracted from equation 8.4. Now, the pressure,Pbar is equal to the pressure of the dry hydrogen and the head pressure.
The head pressure is measured by taking the difference in the heights of the liquid levels in thelarge bottle and beaker (not the reaction flask). This level represents the pressure difference in mmH2O between atmospheric pressure, Pbar, and the pressure inside the large bottle and reaction flask.It is important to note that this difference must be converted to mmHg before it can be added to orsubtracted from the atmospheric pressure. Since the density of Hg is 13.6 times as dense as water,the height difference values in mm must be divided by 13.6 to convert them to mmHg.
If the water level in the beaker is higher than the level in the large bottle then the pressure in thebottle is greater than atmospheric pressure. If the level in the beaker is below the level of the liquidin the large bottle, then the pressure in the bottle is less than atmospheric pressure. This will helpyou determine whether this difference is added to, or subtracted from the atmospheric pressurereading.
Now we know the pressure of the dry hydrogen. We now calculate the weight of each metal in thealloy as a mixture problem as the following equations illustrate:
mass Mg + mass Sc = mass sample = mass M (EQ 8.5)
mol H2 from Mg + mol H2 from Sc = mol H2 collected (EQ 8.6)
Now we have two equations and two unknowns. These can be solved simultaneously:
mass Sc = mass M – mass Mg (EQ 8.7)
(EQ 8.8)
(EQ 8.9)
Substituting Equation 8.8 and Equation 8.9 into Equation 8.6 yields: (EQ 8.10)
PV nRT= n PVRT--------=
PH2PH2
PH2O
Pbar PH2OPH2
Ph+=
PH2O
mol H2 from Sc mass Sc 1 mol Sc44.96 g Sc-------------------------
3 mol H22 mol Sc----------------------=
mol H2 from Mg mass Mg 1 mol Mg24.31 g Mg----------------------------
1 mol H21 mol Mg------------------------=
8–66 Chemistry 141 Grossmont College

Procedure
(EQ 8.11)
Using Equation 8.7 we can substitute for the mass of Sc into Equation 8.11:
(EQ 8.12)
Solving for the mass of Mg in Equation 8.12 gives the grams of metal, M, in the alloy sample. Sub-stituting this into Equation 8.7 gives the grams of Sc in the original sample. The percentages ofeach of the metals can be calculated in the following manner.
(EQ 8.13)
(EQ 8.14)
Procedure1. Obtain an unknown Zn-Al alloy sample and requisite apparatus from the stockroom. Assemble
the apparatus illustrated in Figure 8.1 :
FIGURE 8.1
2. A demonstration apparatus should also be displayed on your instructor's bench. The generatorflask is a 250 mL Erlenmeyer flask fitted with a one-hole stopper; the beaker is a 1000 mL bea-ker. Insert the glass tubes in the two-hole stopper of the large bottle with equal treatment andcare. The generator flask should be placed in a beaker.
3. Determine the mass of a piece of weighing paper to the maximum precision of the electronicbalance (this is called the “tare”). Do the same for a second piece of weighing paper and placeone piece of your unknown on the first paper and another piece on the second paper. Weigh eachagain and record these values.
4. Fill the large bottle to near the top with water. Determine the mass of the bottle and water on abalance of adequate capacity. Assemble the apparatus for the first experimental run.
CAUTION: Remember to lubricate the hole of the stopper with glyc-erin prior to inserting the glass tube.
mass Mg 1 mol Mg24.31 g Mg----------------------------
1 mol H21 mol Mg------------------------
mass Sc 1 mol Sc44.96 g Sc-------------------------
3 mol H22 mol Sc----------------------
+ PVRT--------=
mass Mg 1 mol Mg24.31 g Mg----------------------------
1 mol H21 mol Mg------------------------
mass M -mass Mg 1 mol Sc44.96 g Sc-------------------------
3 mol H22 mol Sc----------------------
+ PVRT--------=
mass Mgmass sample------------------------------ 100 %Mg=
mass Scmass sample------------------------------ 100 %Sc=
Chemistry 141 Grossmont College 8–67

Analysis of a Two-Component Alloy
5. Add 50-75 mL of dilute (6 M) HCl to the generator flask.6. Add your first alloy sample to the generator flask and immediately insert the stopper. The gas
will flow through the tubing and displace the water from the large bottle. Swirl the flask asneeded to continue the reaction until all of the alloy is reacted. Allow the system to equilibratefor 10 minutes after the reaction is complete.
7. Measure the difference in mm of the water level in the bottle and beaker. Remove the stopperfrom the large bottle and measure the temperature of the remaining water and reweigh it on thebalance. The difference between the initial and final mass of the bottle and water is the mass ofwater displaced by the gas. Using the density for water (look up the value in the CRC handbookof Chemistry and Physics), the volume of the gas displaced can be determined.
8. Take the temperature of the water and the temperature of the gas above the water.9. Repeat the experiment with the second sample of alloy using the acid solution from the previous
trial. When you are completely finished with the experiment, dump the bottle full of water in theplanter outside.
Results and Calculations
In the calculations show:
1. how you derived the equation to determine the amount of zinc in the sample from the mass ofthe alloy and the total number of moles of hydrogen gas from the reaction. Do this without put-ting the actual mass of alloy or number of moles of gas from the data;
2. a sample calculation using this equation on one of your trials; 3. create a table summarizing your major data.
NOTE: For an approximate quick check of the precision of your results,determine the ratio of the mL of H2 produced to the grams of alloy usedfor each trial. Excellent precision should give ratio values that are equalto two significant figures. For example, the values, 818 and 823, both
round to 8.2 102. Perform duplicate trials until you are satisfied with the preci-sion of your results.
8–68 Chemistry 141 Grossmont College

Post Lab Questions
Post Lab Questions1. Why was it not necessary to discard and refill the generator flask with fresh 6 M HCl for subse-
quent reactions? Show a calculation to demonstrate your reasoning.
2. In an experiment similar to yours, students were given an unknown sample that produced H2Sor NH3 gas. What problem(s), if any, might arise if the same procedures as this experiment werefollowed?
3. Why is it not necessary to consider the amount of air that was in the generator flask at the startof the reaction?
4. If there was a leak in the rubber tubing that allowed approximately 150 mL of H2 to escape, howwould it affect the relative amounts (% values) that you calculated as the results? Would the%zinc in the sample appear to be high, low, or remain the same? Show a calculation to justifyyour answer.
Chemistry 141 Grossmont College 8–69

Analysis of a Two-Component Alloy
5. What assumptions do we make regarding the temperatures of the generator and collectionflasks? Are they valid?
6. How would the calculated number of moles of H2 collected change if the generator flask werenot given time to fully equilibrate?
8–70 Chemistry 141 Grossmont College

EXPERIMENT 9 Calorimetry–Measuring Heat of Formation
Part A: Introduction to CalorimetryThe goal in Part A of this experiment is to determine the heat capacity of a calorimeter. Once thisvalue is known, your calorimeter can be used in Part B of the experiment to determine the heat offormation of magnesium oxide.
All chemical and physical processes are accompanied by heat changes. The measurement of heatchanges in physical and chemical processes is called calorimetry. Heat changes may be measuredby carrying out the process in an insulated vessel where the heat exchange between the systembeing observed and its surroundings is minimized. This type of system is called a calorimeter.The insulated vessel contains a temperature measuring device and a magnetic stirring bar.
The energy associated with the temperature changes in a substance can be expressed two ways.Specific heat, Csp, is defined as the amount of energy in joules required to raise the temperatureof one gram of that substance by one degree Celsius:
(EQ 9.1)
Where q is the quantity of heat, T°C is the temperature change in degrees Celsius, and m is themass of the substance in grams.
The term heat capacity, Cs, is used if a particular object, such as a particular calorimeter, is beingused repeatedly. Heat capacity is defined as the amount of energy required to raise the temperatureof that object one degree Celsius:
(EQ 9.2)
The heat capacity of your calorimeter will be determined in this part of the experiment so that youcan use your calorimeter in the following experiment, “Determination of Enthalpy of Formation”.The following example illustrates this procedure to determine the heat capacity of a calorimeter.
specific heat Cspq
m T C ----------------------=
heat capacity Csq
T C------------=
Chemistry 141 Grossmont College 9–71

Calorimetry–Measuring Heat of Formation
Procedure: Part AThe following operations are typical for determining the heat capacity of a calorimeter. The temper-ature of a known mass of water is recorded; the temperature should be approximately room temper-ature. Another sample of water, whose mass and temperature is measured, is added to the firstwater sample. The second water sample should be approximately 50 C higher than the originalsample. By carefully monitoring the temperature changes upon mixing the hot and cool water sam-ples, we can determine how much of the heat was transferred to the cool water and how much ofthe heat was transferred to the calorimeter; refer to equation Equation 9.4.
EXAMPLE 9.1
A 50.0 mL sample of warm tap water at 50.2 °C is mixed with 62.0 mL of cooler tap waterin the calorimeter, which is at 21.4 °C. The final temperature of the system after mixing is33.7 °C. The density of the water is 1.00 g/mL, and the specific heat of the tap water is4.184 J/g°C. Determine the heat capacity, Cp, of the calorimeter system.
If there was no heat transfer from the hot water to the calorimeter, all of the heat wouldbe conserved in the liquid. Therefore, all of the heat lost by the warm water would equalthe heat gained by the cool water. This, however, is not what is observed because someof the heat from the warm water is used to raise the temperature of the calorimetersystem.
The change in temperature is simply
(EQ 9.3)
As mentioned, the heat, q, lost by the warm water is gained by both the cool water andthe calorimeter, hence the negative sign represents a heat loss and a positive sign is aheat gain
(EQ 9.4)
By substituting the expressions for specific heat (equation 9.1) and heat capacity(equation 9.2), equation 9.4 can be expressed as
(EQ 9.5)
Using the data from this example gives:
Tcool = 33.7 °C - 21.4 °C = 12.3 °C (EQ 9.6)
Twarm = 33.7 °C - 50.2 °C = -16.5 °C (EQ 9.7)
(EQ 9.8)
Now the heat capacity of our calorimeter can be calculated:
(EQ 9.9)
T T final T initial–=
qwarm– qcool qcalorimeter+=
T warm mwarm Csp – T cool mcool Csp Cp T cool +=
16.5– C 50.0g 4.184 JgC----------
– 12.3C 62.0g 4.184 J
gC----------
Cp 12.3C +=
3452 J 3191 J Cp 12.3C +=
Cp 21.2 JC------=
9–72 Chemistry 141 Grossmont College

Part B: Introduction to Measuring the Heat of Formation of Magnesium Oxide
We will use a temperature probe called a thermistor to measure the temperature changes during thisexperiment. Your instructor will assist you in setting up and operating the thermistor. After youhave collected your data with the thermistor, we will use it to help analyze the data.
Obtain a calorimeter, a magnetic stir bar, a stirring plate and a thermistor. The temperature through-out the experiment as a function of time will be tabulated during the experiment. Measure allmasses to the nearest 0.1 g and all temperatures to the nearest 0.1C.
1. While one partner is performing Step 2 the other should be preparing the thermistor apparatus asdirected by your instructor.
2. Wipe out any water or solid debris from the inside of the calorimeter. Measure 50.0 mL of tapwater into a graduated cylinder and pour this into a dry, tared calorimeter cup. Weigh the con-tents of the calorimeter after the water has been added to obtain the mass of water actually trans-ferred to the cup. Add a stir bar and place the cover on the calorimeter then insert the thermistor.Click Start on the apparatus screen. Turn on the stirring plate and allow the system to reach aconstant temperature.
3. Measure approximately 50 mL of tap water and pour it into a clean 250 mL beaker. Weigh thebeaker and its water and record this mass. Gently heat the water to approximately 50-55 C.Remove from heat and place your thermometer in the beaker and record the temperature of thehot water. It is essential that you obtain the actual temperature of the hot water just before youadd the hot water to the calorimeter.
4. Add the hot water without splashing to the calorimeter. Stir gently to prevent splashing.5. The thermistor apparatus will commence temperature and time measurements automatically.
Observe the temperature and time measurements until a maximum temperature has beenreached. Continue recording temperature and time readings until the temperature decreases by 2C below the maximum temperature or after 10 minutes have elapsed since the maximum tem-perature was observed.
6. While you are waiting for the maximum temperature to be reached, weigh the empty (wet) bea-ker to obtain the actual mass of hot water that was added to the calorimeter. Be sure to use thesame balance each time that you weigh a particular piece of glassware. Compare this massto the mass of the water in the calorimeter.
7. Weigh the water in the calorimeter.8. Repeat steps 2-6 at least two more times and calculate the average heat capacity and the stan-
dard deviation for your calorimeter.9. Consult with your instructor to determine if you have good precision for your calorimeter heat
capacity.
Part B: Introduction to Measuring the Heat of Formation of Magnesium Oxide In Part B, the heat of formation of magnesium oxide will be determined. The heat capacity of yourcalorimeter that you calculated from Part A will be used in this part of the experiment.
The enthalpy of formation, Hf, of a substance is the heat absorbed when one mole of it isformed from the elements in their most stable forms at constant pressure. In some cases, elementsmay be combined in a calorimeter to form the desired product and thus the Hf may be measureddirectly. In other cases, the elements may not combine completely to form the desired product, orthere may be other difficulties with the direct determination. In these cases, Hf may be obtainedindirectly by combining results from reactions that may be successfully measured:
Chemistry 141 Grossmont College 9–73

Calorimetry–Measuring Heat of Formation
Hrxn =Hf ° products - Hf ° reactants (EQ 9.10)
A direct determination of the Hf for Mg2+ ion and an indirect determination for MgO will serve toillustrate the possibilities.
Consider the reaction of magnesium and HCl:
Mg (s) + 2 H+ (aq)
H2 (g) + Mg2+ (aq)
(EQ 9.11)
Since theHf for H+ and H2 are zero by definition under these conditions, the H for this reactionis the Hf for Mg2+. The variations in temperature, pressure, and concentration occurring duringthis experiment will not cause significant errors. So, the Hrxn would be the sum of the heat fromthe reaction of Mg and HCl and the heat from th e calorimeter:
(EQ 9.12)
Using Equation 9.1, Equation 9.2, and Equation 9.12 allows one to calculate Hrxn.
For MgO, the elements will combine directly, but the reaction is not easily accomplished and mea-sured in a calorimeter, so an indirect approach will be followed.
Consider the reaction of MgO with 1 M HCl:
MgO (s) + 2 H+ (aq)
H2O(l) + Mg2+ (aq)
(EQ 9.13)
The H for this reaction will be measured in your calorimeter. When this information is combinedwith known values for Hf of Mg2+ and H2O(l), the desired Hf value for MgO can be determined.
CalorimetryIf a reaction occurs in a calorimeter, the heat released during the reaction will be detected as anincrease in temperature, and the amount of heat will be the total heat capacity of the calorimeter andits contents multiplied by the temperature change. The temperature change should be obtained bytaking data and graphing the temperature as a function of time from before the reaction until wellafter the reaction is complete. A thermistor apparatus will be used to capture the temperaturechanges during this process; the set-up and operations will be similar to that used in previously.
The calorimeter has a heat capacity of approximately 18 J/°C. If your calculated heat capacity fromExperiment 9 is close to this value, then use your determined value for heat capacity. If you calcu-lated a heat capacity much different than this value, use 18 J/°C for your heat capacity. The heatcapacities of Mg and MgO are negligibly small and can be ignored. The 0.8 M HCl (the averagevalue during reaction) has a specific heat of 4.07 J g-1°C-1, and a density of 1.01 g/mL.
Procedure: Part B
Reaction of Mg with HCl1. Calibrate the thermistor as you did in “Heat Capacity of the Calorimeter.”
H rxnqsolution qcalorimeter+ –
n-----------------------------------------------------------=
9–74 Chemistry 141 Grossmont College

Procedure: Part B
2. Weigh approximately 0.5 g of Mg to the maximum precision; record this mass in your note-book.
3. Add 100.0 mL of 1.0 M HCl to the calorimeter and begin stirring. Click the Start button tobegin data collection. At this point you want to see the temperature stabilize and produce anearly straight line on the graph of the thermistor apparatus screen. This may take 2-5 minutes.
4. Add the Mg and continue to stir. It is important that you add the metal into the solution. Anymaterial that sticks to the sides of the calorimeter will introduce error into your results. You willnotice the temperature increase on the display as the Mg reacts with the acid.
5. After the temperature remains constant or begins to drop slowly (5-10 minutes), click Stop andthen Save Data.
6. Name your file with a unique name and save it to a flash drive. You want to obtain a graph inwhich the final temperature has been obtained by extrapolation of the first-order line-fit (seeFigure 9.1 on page 75).
FIGURE 9.1
Enthalpy of Magnesium with Hydrochloric Acid
Temperature (°C) vs. Time (minutes)
Reaction of MgO with HClWeigh out approximately 0.8 g of MgO. Clean out the calorimeter from the previous reaction andbe sure to use a new aliquot of HCl for this reaction. Then repeat the procedure given above for thefirst reaction of Mg and HCl. Obtain a graph with the final temperature calculated from the curve-fit function as before.
20
25
30
35
40
45
50
0 5 10 15
Temp. 0C
Time (min)
p
temperaturelinear regression
Chemistry 141 Grossmont College 9–75

Calorimetry–Measuring Heat of Formation
Calculations and Data Treatment1. By definition H°f for H+, O2 and H2 are zero. Therefore, the H for reaction 9.14 is equal to
the Hf for Mg2+. The H for reaction 9.17 can now be determined using the data from reac-tions 9.14-9.16. H for reaction 9.16 can be found in your text.
Mg (s) + 2 H+ (aq)
Mg2+ (aq)
+ H2 (g) (EQ 9.14)
MgO (s) + 2 H+ (aq)
Mg2+ (aq)
+ H2O (l) (EQ 9.15)
2 H2 (g) + O2 (g) 2 H2O (l) (EQ 9.16)
Mg (s) + ½ O2 (g) MgO (s) (EQ 9.17)
2. Make graphs and determine the corrected temperatures for each run. Be sure to completely andcorrectly label all graphs.
3. CalculateH for each reaction using the amounts of reagents that you measured for your reac-tions.
4. Calculate H per mole of Mg and MgO for each trial. 5. Calculate the percent error for each of your values.6. Tabulate your values for Hf for Mg2+ and MgO along with the literature values for each and
their percentage errors.
9–76 Chemistry 141 Grossmont College

EXPERIMENT 10 Atomic Spectra
ObjectiveIn this experiment, we will be investigating a number of emission spectra in a qualitative manner.The hydrogen emission spectrum in particular will be examined in greater detail. The visible wave-lengths in the hydrogen line spectrum will be measured with a spectroscope. These experimentalvalues will be analyzed graphically to determine the principle quantum number associated with theBalmer Series of hydrogen and to calculate a value for the Rydberg constant.
IntroductionAn emission spectrum is electromagnetic radiation emitted by a substance. The emission spec-trum of sunlight is a continuous spectrum; in other words, all wavelengths of visible light arerepresented in the spectrum and these can be observed if the beam of sunlight is split with a prism.The emission spectrum for an atom can also be observed if the sample absorbs energy in the formof heat or, for a gas, an electrical current. However, the emission spectra for atoms in the gas phaseare not continuous; only a few colors are observed which correspond to different wavelengths inthe visible region of the electromagnetic spectrum. Light emission that occurs only at specificwavelengths are called a line spectrum. Every element has a unique line spectrum and the char-acteristic lines are like fingerprints used for identification of unknown atoms.
There is a fundamental link between atomic spectra and atomic structure. Beginning with Thom-son’s discovery of the electron, the structure of the atom was revealed and a planetary model wasproposed in which the electrons were thought to be in circular orbits around the nucleus. Althoughthis model is no longer considered to be an accurate description of the atom, the notion of orbitssurvives. Modern interpretation of atomic structure still uses the idea of orbits which we refer to asenergy levels or electronic shells. Niels Bohr presented an explanation for atomic spectra based onthis idea of electrons orbiting a nucleus but he imposed a restriction on these orbits: For the hydro-gen atom, the single electron can only be located in specific orbits. Therefore, the electron can onlypossess certain fixed energy values which correspond to the energies of the allowed orbits. In otherwords, the energy of the electron is quantized. Bohr had embraced the idea of quantization con-
Chemistry 141 Grossmont College 10–77

Atomic Spectra
ceived by his contemporaries, Max Planck and Albert Einstein and was awarded the Nobel Prize inPhysics in 1922 for his theory explaining the spectrum of the hydrogen atom.
According to Bohr’s theory, the energy values of an electron in a hydrogen atom are expressed bythe equation
(EQ 10.1)
where B is a constant equal to 2.18 10–18 J and n is an integer called the principal quantum num-ber with values equal to 1, 2, 3, … etc. By convention, the negative sign signifies that the energy ofan electron is less than the energy of a free electron, that is, an electron infinitely distant from thenucleus. The energy of a free electron is arbitrarily given a value of zero; this corresponds to nequal to infinity in the equation and E approaches zero. As the electron moves closer to the nucleus(as the value for n decreases), E becomes larger and more negative. The largest negative value iswhen n = 1 which is the lowest energy state or ground state for the hydrogen electron. When n isgreater than 1, the hydrogen atom is said to be in an excited state. Since the radius of each circu-lar orbit depends on n2, the size of the orbit increases as n gets larger and the electron is located fur-ther from the nucleus in any excited state.
Think about a hydrogen atom that absorbs energy. The energy absorbed causes the electron to movefrom a low energy state (small n) to a higher energy state (larger n). When the electron falls back toa lower energy state this energy is released as a photon. This quantized movement between energystates is like a ball moving up and down a stairway. The ball can rest on any step but is neverlocated between steps. The energy associated with movement from one step to another is deter-mined by the distance between the steps. For the hydrogen atom, the energy required to move anelectron between energy levels depends on the difference in energy between the initial and finalstate. Movement of an electron between two energy states is called an electronic transition orsimply a transition. When an electron is promoted to an excited state, there exists more than oneemission pathway: The electron may return directly to the ground state by emitting a photon of fre-quency which is equal to the energy difference between the ground state and excited state, or theelectron may return to the ground state stepwise, emitting a photon for each successive movementto a lower energy level. These energy transitions are illustrated in Figure 10.1 on page 79.
E B 1n2----- –=
10–78 Chemistry 141 Grossmont College
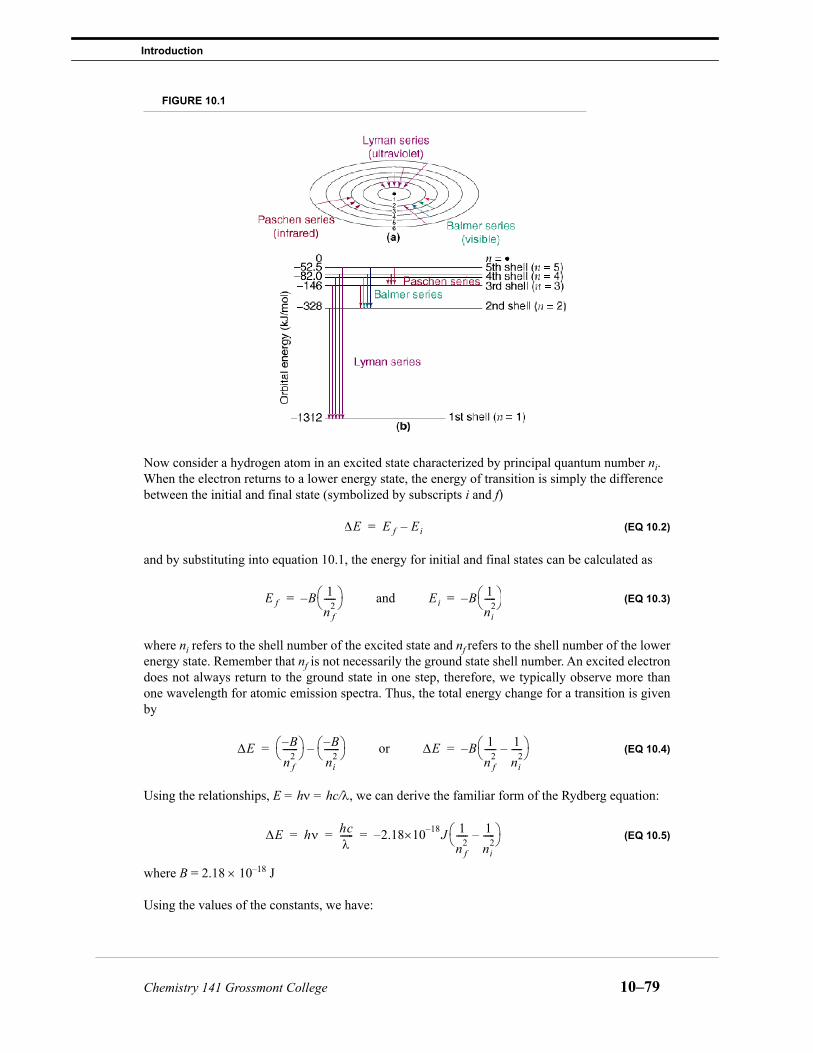
Introduction
FIGURE 10.1
Now consider a hydrogen atom in an excited state characterized by principal quantum number ni. When the electron returns to a lower energy state, the energy of transition is simply the difference between the initial and final state (symbolized by subscripts i and f)
(EQ 10.2)
and by substituting into equation 10.1, the energy for initial and final states can be calculated as
(EQ 10.3)
where ni refers to the shell number of the excited state and nf refers to the shell number of the lowerenergy state. Remember that nf is not necessarily the ground state shell number. An excited electrondoes not always return to the ground state in one step, therefore, we typically observe more thanone wavelength for atomic emission spectra. Thus, the total energy change for a transition is givenby
(EQ 10.4)
Using the relationships, E = h = hc/, we can derive the familiar form of the Rydberg equation:
(EQ 10.5)
where B = 2.18 10–18 J
Using the values of the constants, we have:
E E f Ei–=
E f B 1n f
2----- –= and Ei B 1
ni2
----- –=
E B–n f
2------- B–
ni2
------- –= or E B 1
n f2
----- 1ni
2-----–
–=
E h hc------ 2.18– 18–10 J 1
n f2
----- 1ni
2-----–
= = =
Chemistry 141 Grossmont College 10–79

Atomic Spectra
(EQ 10.6)
Multiplying through gives
(EQ 10.7)
Equation 10.7 is called the Rydberg equation where 1.09710–2 nm–1 is the value of the Rydberg constant for hydrogen (RH).
Finally, the Rydberg equation can be written as:
(EQ 10.8)
which is a useful expression since it is an equation for a line (y = mx + b). Thus, by graphing recip-rocal wavelength versus the correct values for 1/ni
2 a straight line should be obtained and from thegraph, the slope can be determined which is of course the value for R, the Rydberg constant. Recip-rocal wavelengths are also called wavenumbers symbolized by :
(EQ 10.9)
factoring in R gives the equation:
(EQ 10.10)
where y = , x = 1/ni2, the slope, m=-R, and the y-intercept, b = R/nf
2.
Which wavenumbers and which values of ni2 should be used? Wavenumbers are calculated from
the observed wavelengths that are measured with the spectroscope. As for the n values, each wave-length corresponds to a transition from energy level ni to level nf.. Energy level nf is the same for all wavelengths in a particular series (Balmer, Paschen, Lyman) and n values are always integers. (As you know, the principle quantum number is always an integer). These are the spectral series are shown in Figure 10.1 on page 79 and the wavelengths for each series are illustrated in Table 10.1 on page 81.
1--- 2.18– 18–10 J
hc--------------------------------- 1
n f2
----- 1ni
2-----–
2.18– · 18–10 J6.626 34–10 J s 3.0 810 m/s ------------------------------------------------------------------------ 1
n f2
----- 1ni
2-----–
= =
1--- 1.097 2–10 nm 1– 1
n f2
----- 1ni
2-----–
=
1--- R 1
ni2
----- 1n f
2-----–
–=
v
R 1ni
2----- 1
n f2
-----– –=
R 1ni
2-----– R
n f2
-----+=
v
10–80 Chemistry 141 Grossmont College

Procedure
Procedure1. Your instructor will explain the operation of the spectroscopes.2. Take precautions so that you …
3. For purposes of comparison, observe and sketch the spectra of: sunlight (do not aim the spectro-scope directly at the sun!), an incandescent bulb, a fluorescent bulb, and at least three elements(one of these must be the hydrogen discharge tube) Draw a rough scale below each sketch toidentify the approximate wavelengths in each spectrum.
4. Carefully measure the visible wavelengths in the hydrogen line spectrum. Create a Table ofwavelengths then convert these values into wavenumbers.
Results and Calculations1. Use a graphing program to plot these wavenumbers versus 1/ni
2, selecting the appropriate val-ues for ni for the visible wavelengths. The correct set of integer values will produce a straight-line plot vs. 1/ni
2 as show in Equation 10.10.
TABLE 10.1
ni Pashen Series (Infrared light)
Brackett Series
Pfund Series
Humphreys Series
nf = 3 nf = 4 nf = 5 nf = 6(nm) (nm) (nm) (nm)
4 18705 1280 40506 1090 2630 74607 1000 2170 4650 123708 954 1940 3740 75039 820 1820 3300 5910
10 1460 3040 513011 2280 467012 3280
DO NOT attempt to change a discharge tube while it is connected to a power supply. The system generates up to 15,000 volts.
DO wear the special protective tinted glasses which filter the ultraviolet radia-tion that comes from the discharge tubes. Your eyes may be damaged if left unprotected.
NOTE: What is the ground state, nf, for the visible spectrum? Refer toFigure 10.1 on page 79.
v
Chemistry 141 Grossmont College 10–81

Atomic Spectra
SAMPLE
You may want to create a table like the one below:.
2. From your graph, determine the slope and compare your value of the Rydberg constant with theaccepted value of 1.097 10–2 nm–1. Calculate the percent difference.
3. From your graph, find (and explain) the value of nf from the y-intercept of your plot.4. Also make graphs and analyze:
a. 1/ vs. 1/ni2 for the UV lines of Hydrogen (121.6 nm, 102.6 nm, 97.3 nm, 95.0 nm, 93.8
nm);
b. 1/ vs. 1/ni2 for the visible lines of Hydrogen from literature (656.3 nm, 486.1 nm, 434.1
nm, 410.2 nm).5. Determine what electronic transitions were responsible for each of the spectral lines in both the
UV and visible spectra.
TABLE 10.2
nm) ni nm) (nm) 1/ni 2
NOTE: What is the ground state, nf, for the ultraviolet spectrum? Referto Figure 10.1 on page 79.
10–82 Chemistry 141 Grossmont College

Post Lab Questions
Post Lab Questions
1. Determine the frequency of a photon of 5.0 10–7meter wavelength.
2. What is the energy (in joules) of the photon in question 1?
TABLE 10.3
Quantity Symbol Value
atomic mass unit amu 1.660565×10⁻²⁷ kg
Avogadro’s constant N or NA 6.022094×10²³ mol–1
electronic charge e 1.6021892×10⁻¹⁹ C
Faraday constant F 9.648456×10⁴ C/mol
gas constant R 0.0820568
8.314510
mass of electron me 9.109534×10⁻³¹ kg
mass of neutron mn 1.6745943×10⁻²⁷ kg
mass of proton mp 1.6726485×10⁻²⁷kg
Planck’s constant h 6.626176×10⁻³⁴ J s
Rydberg constant RH 1.0967758×10⁷ m–1
speed of light in vacuum c 2.997924×10⁸ m/s
L atmmol K------------------
Jmol K------------------
Chemistry 141 Grossmont College 10–83

Atomic Spectra
3. If the threshold frequency, 0, for a metal is 1.0×10¹⁴ s–1, what would be the velocity of an elec-tron ejected from the metal surface by a photon of 6.0×10¹⁴ s–1 frequency striking the metal? (kinetic energy = ½mv2)
4. Find the wavenumber of the photon in question 1.
5. Find the wavelength (in nm) of the light emitted by the n = 8 to n = 2 electronic transition in a hydrogen atom.
10–84 Chemistry 141 Grossmont College

Post Lab Questions
6. A stream of laser photons with a frequency of 3.0×10¹⁵ Hz excited electrons in the lowestenergy of the hydrogen atom shown in the energy level diagram below
a. Show to what level the photon excited the electron.
b. Show all the possible emission transitions as the elec-tron returns from the n = 3 energy level to the groundstate.
c. Calculate E for each line produced in b.
d. What is the wavelength of the photon that would just ionize the ground-state atom toH+?
7. An energy of 1.09×10³ kJ/mol is required to convert gaseous carbon atoms to gaseous C+ ionsand electrons. What is the maximum wavelength, in nm, of electromagnetic radiation with suffi-cient energy to cause ionization to a single carbon atom? In what region of the electromagneticspectrum is this photon found?
Energy
0
–6.02×10⁻²⁰J
–8.72×10⁻²⁰J
–1.36×10⁻¹⁹J
–2.42×10⁻¹⁹J
–5.45×10⁻¹⁹J
–2.18×10⁻¹⁸J
Chemistry 141 Grossmont College 10–85

Atomic Spectra
8. Answer the following questions about the ground-state electron configuration of a neutral ura-nium atom.
a. Write out the outer-shell ground-state electron configuration of the for the six electrons beyond the radon configuration of a neutral uranium atom.
b. Give the four quantum numbers that correspond to each of the six electrons beyond the radon configuration of a neutral uranium atom. Put your answers in Table 10.4 .
9. What is the maximum number of electrons that can be accommodated in each representation below?
TABLE 10.4
Electron n l ml ms
2p l = 3 ml = 3
n = 3 4f n = 3, l = 2
10–86 Chemistry 141 Grossmont College

EXPERIMENT 11 Periodicity of Chemical Properties
ObjectiveThe astute student can predict chemical behavior for the elements based on their position in theperiodic table. In this experiment the student will explore the chemistry of selected elements anddiscern periodic trends based on graphical analysis of periodic trends.
IntroductionThe Grossmont College Chemistry Department and the World Wide Web have available a varietyof computer programs which demonstrate the properties of the chemical elements. Some of theseare as follows:
Chemistry software
• An Excel spreadsheet has data from Periodic Table Alive on it, so that you can graph any prop-erty against any other. (Spreadsheet available on your instructor’s website.) Choose the elemen-tal properties option. Note that this first page contains all of the elements and subsequent pagescontain only the elements in specific groups or periods.
Internet sites - The following sites are interesting. Try them out...
• http://www.webelements.com/ This site has a periodic table and you can click on any element tolearn about it. Notice especially here the crystal structures in the right margin. They may be use-ful.
• http://www.chemeddl.org/resources/ptl This site has a periodic table and you can click on anyelement to learn about it. It includes information of price of elements. It is an electronic versionof the Periodic Table Alive software.
• http://chemcollective.org/applets/pertable.php This site shows the electron configurations of allthe elements including the orbital diagrams.
Chemistry 141 Grossmont College 11–87

Periodicity of Chemical Properties
• http://chemicalelements.com/ This site has periodic table with clickable elements to show prop-erties. You can also customize the chart to add different kinds of data under the symbol on thechart. This could be useful for determining trends.
• http://www.chemicool.com/Chemicool/ Another site with elemental data appearing when youclick on the element on the periodic table.
Procedure
Graphical AnalysisUsing the graph option in Periodic Table Alive or the data in the Excel spreadsheet investigate twoof the following:
1. Graph atomic number versus first ionization energy;2. Graph atomic number versus number of isotopes (Is there a relationship between odd and even
numbers of protons and neutrons?);3. Graph atomic number versus electron affinity;4. Graph atomic number versus atomic radius;5. Graph atomic number versus electronegativity and look for trends in groups 1, 3, 6, and 7;6. Graph atomic number versus atomic radius for groups 2, 3, 7, and 8 and for periods 2, 3, and 4;7. Graph second ionization energy for groups 1, 2, 7, and 8 and for periods 2, 3, and 4.
DiscussionFor the two relationships you investigated write a short report of your findings including the fol-lowing:
1. Name of the trend you examined.2. Definition - A short definition of the property you’ve studied.3. Summary - The summary should be a brief description of the trend or grouping you observed.
Describe the general trend, not every small “glitch” in the trend. A table summarizing your datawould be useful here.
4. Graph - The pictorial representation of the trend you examined. 5. Discussion - In this section, you should discuss why the trends you observed behave in the man-
ner illustrated by the programs. For example, if a certain property appears to decrease in valuegoing across a period, you should explain why (in an atomic sense) the value is decreasing. Aone or two paragraph discussion per relationship is sufficient.
6. References - You may use any book or journal article as a reference to help write your discus-sion. However, make sure you give proper credit for this reference at the end of your report. Abasic sample report is shown below; the one you write should be more comprehensive.
11–88 Chemistry 141 Grossmont College

Sample Report
oilingoint (°C)
232398
Sample Report1. Boiling point for groups 6, 7, and 8.2. Definition
The boiling point of a liquid under a given pressure is the temperature at which its vapor pres-sure is just equal to the applied pressure. The normal boiling point is the temperature at whichthe vapor pressure of the liquid is equal to exactly one atmosphere of pressure (1).
A group is a vertical column on the periodic table, which contains elements that have similarchemical properties (2).
3. SummaryThe boiling points of the elements increase as you go down groups 6, 7 and 8. There is not aregular trend for boiling point across a period.
4. Graph
FIGURE 11.1
5. DiscussionThe boiling points of the elements increase as you go down groups 6, 7 and 8. There is not asmooth trend for boiling point across a period. The boiling point depends on two factors: themolar mass of the particles and the cohesive forces holding the atoms or molecules together
TABLE 11.1
Element GroupNumber
BoilingPoint (°C) Element Group
NumberBoilingPoint (°C) Element Group
NumberBP
Cr 6 2963 Mn 7 2333 Fe 8 30Mo 6 4923 Tc 7 4840 Ru 8 48W 6 5773 Re 7 5923 Os 8 52Sg 6 ? Bh 7 ? Hs 8 ?
Chemistry 141 Grossmont College 11–89

Periodicity of Chemical Properties
making them more difficult to separate into individual gas particles; Going down a group bothbecome greater. Each factor will be discussed separately.
As we go down a group, the size of the atom increases because shells of electrons are added. Asthe nuclear charge decreases the positive charge felt by the electrons decreases so that electronsare not held as closely to the nucleus increasing the size of the atom. In multi-electron systemsthere is also a repulsion between electrons, which also slightly increases the atomic size. Theboiling point does not follow a trend across a period for transition metals because when elec-trons are added across a row the d electrons are added to the inner shell (n-1) and do not changethe size of the atoms greatly (3).
Cohesive interactions between atoms and molecules (intermolecular forces) increase withincreasing size and increasing number of electrons. As you go down a column there are moreelectrons, causing an increase in the cohesive interactions. Melting involves a change of statefrom the liquid state to the gaseous state. There are two types of energy involved in changingstate: potential energy and kinetic energy. When a substance is in one phase adding energy tothe system changes the potential energy, but not the average kinetic energy of the particles.During the change from a liquid to a gas, the temperature remains constant, but the potentialenergy of the particles in increasing (4). The larger the particle the more cohesive interactionsare present, thus, it takes more energy to pull atoms or molecules away from the liquid to thegas phase, which results in a higher boiling point. Across a period the change in cohesive inter-actions does not change as much resulting in an uneven trend.
6. References
(1) Whitten, Kenneth W., Gailey, Kenneth D., and Davis, Raymond E. General Chemistry 3rd
ed. Philadelphia: Saunders College Publishing, 1988, p. 308.
(2) Gilbert, Thomas, Kirss, Rein V., Foster, Natalie, Davies, Geoffrey Chemistry: The Sciencein Context 2nd ed. New York: W. W. Norton & Company, Inc., 2009, p. A-33.
(3) Gilbert, Thomas, Kirss, Rein V., Foster, Natalie, Davies, Geoffrey Chemistry: The Sciencein Context 2nd ed. New York: W. W. Norton & Company, Inc., 2009, p. 338-339.
(4) Dahm, Donald J., Nelson, Eric A., Calculations in Chemistry: An Introduction, 1st ed. NewYork: W. W Norton & Company, Inc. 2013, p. 361.
11–90 Chemistry 141 Grossmont College
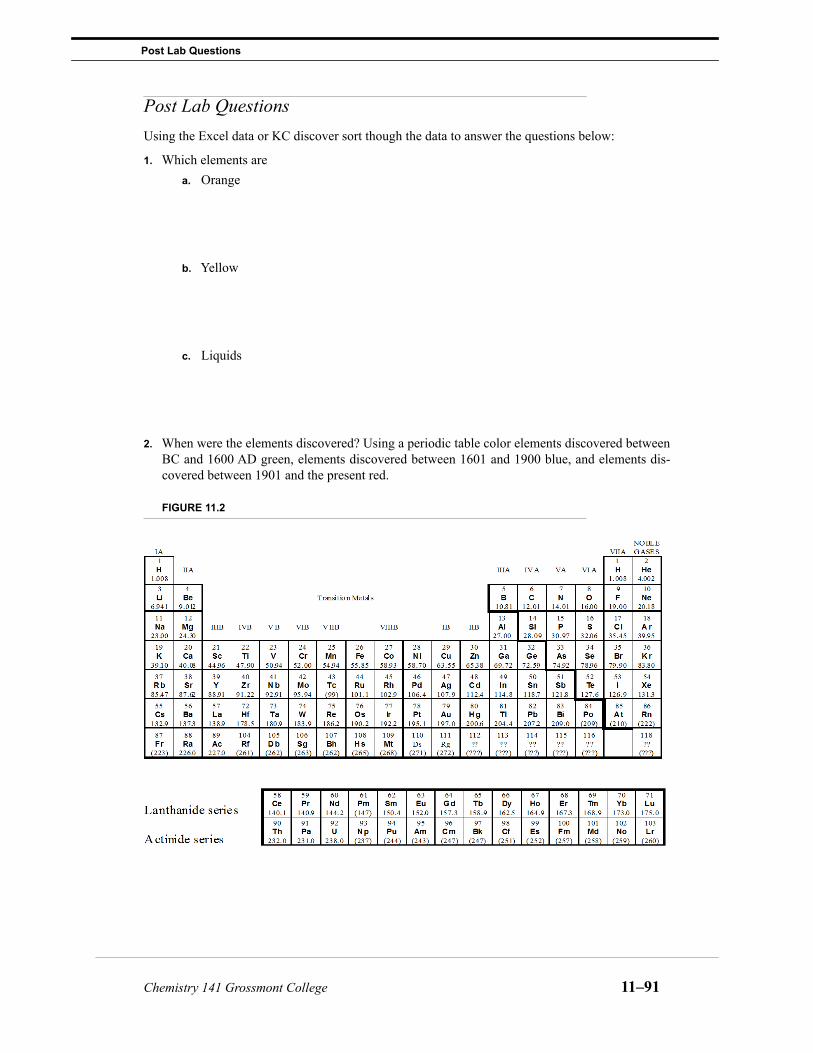
Post Lab Questions
Post Lab QuestionsUsing the Excel data or KC discover sort though the data to answer the questions below:
1. Which elements area. Orange
b. Yellow
c. Liquids
2. When were the elements discovered? Using a periodic table color elements discovered betweenBC and 1600 AD green, elements discovered between 1601 and 1900 blue, and elements dis-covered between 1901 and the present red.
FIGURE 11.2
Chemistry 141 Grossmont College 11–91

Periodicity of Chemical Properties
3. List the five most and least expensive pure elements.
4. Select the best element that meets all of the following: __________________________a. Reacts mildly with 6 M HCl.b. Has no reaction with base or water at 25 °C.c. Has an electrical conductivity of at least 200 m/cm.d. Costs less than $5 per 100 g pure.
5. Zirconium and hafnium occur together in nature. It is ever so difficult to obtain the pure ele-ments.
a. Why do you think this is so?
b. If you had two ingots of equal size, one Hf and the other Zr, how could you determinewhich is which?
6. A mystery element is expensive because it is not readily available on the surface of the earth. Ithas a high density and can be scratched by glass and iron. It can be melted in a chromium orvanadium crucible. It forms the chloride MCl3. Predict the identify of the mystery element andstate your reasons for making this conclusion.
TABLE 11.2
Rank Most Expensive Cost Least Expensive Cost
1.
2.
3.
4.
5.
11–92 Chemistry 141 Grossmont College

Post Lab Questions
7. Copper is used for electrical wiring. If copper became scarce, what element would make thebest substitute? Explain your reasoning.
8. Answer the questions below using a plot of ionization energy versus atomic number.a. Define ionization energy.
b. Explain why the ionization energy increases from Al to Ar.
c. Explain why there is a decrease in ionization energy from Mg to Al.
d. Explain why the ionization energy of S slightly lower than P when we would expect it to be higher based on the general trend.
e. Explain why there is a decrease in ionization energy form Zn to Ga.
Chemistry 141 Grossmont College 11–93

Periodicity of Chemical Properties
9. Answer the questions below using plots of electron affinity for groups IA, IIIA, and VIIA.a. Define electron affinity.
b. Explain why the electron affinities for groups IIA and VIIIA are ~0 kJ/mol.
c. Explain why the electron affinities for group VIIA is so high compared to the other groups.
d. Explain why the electron affinity for F is less than for Cl.
11–94 Chemistry 141 Grossmont College

EXPERIMENT 12 Molecular Structure
ObjectiveThe purpose of this experiment is to use molecular models to build and study structures of mole-cules and ionic species. In addition we will use molecular modeling software to analyze the bond-ing in a variety of compounds.
There are a number of theoretical models concerning the bonding between atoms in chemical com-pounds. We can explain bonding based upon empirical evidence and trends, as well as by applyingfundamental physical principles to the particles in question. We must keep in mind that the efficacyof a model, however, is based upon its ability to predict and explain chemical phenomena. While aspecific model may provide a very reasonable interpretation of certain characteristics exhibited bya system, it is never possible to say that this representation is complete or absolute. The failing of amodel in one aspect or another preceded some of the most interesting events in science.
We shall use ball and stick models to show correct molecular geometries. They offer no informa-tion concerning atomic sizes or bond lengths. Wooden spheres represent atoms of various elementsaccording to a color code. A number of holes drilled into each of these units are positioned so thatproper bond angles are portrayed when the spheres are connected. The connections represent chem-ical bonds (shared electron pairs) and are made by means of wooden or plastic dowels (singlebonds) or flexible springs (multiple bonds).
Procedure
Part ICreate models and draw Lewis structures for the molecules and ions in Table 12.2 , Table 12.3 , andTable 12.4 examples of each step are shown in Example 12.1:
Chemistry 141 Grossmont College 12–95

Molecular Structure
EXAMPLE 12.1 NH2–
1. Determine the total number of valence electrons that must beincluded in the Lewis dot structure. For molecules (neutral spe-cies) this equals the sum of the valence electrons for all atoms asdetermined by the group number for each element. For ionic spe-cies, this equals total valence electrons plus (or minus for cations)the ionic charge. This will include all of the valence electrons ofeach atom as determined by the group number of the element onthe periodic table.
Two atoms of hydrogen (Group IA) each contribute one valenceelectron, 1 atom of nitrogen (Group VA) contributes five valenceelectrons, the minus one charge indicates one additional electron,yielding a total of eight electrons for the Lewis structure.
2. Draw a Lewis electron dot structure for the species.
3. Build the model. If using the wooden balls and sticks, follow theseconventions.
For the atoms surrounding the central atom use the same conven-tions but include the yellow balls for hydrogen (one hole) whichcan only form one bond. Represent each non-bonding (unshared)pair of electrons in the Lewis structure with a dowel. This willhelp you to visualize the positions of the non-bonding pairs:
2 H 2e–
1 N 5e–
–1 ion charge 1e–
Total 8e–
Valence Electrons on Central Atom Ball Color (Number of Holes)
2 dark blue (2)3 light green (3)4 black (4)5 brown (5)6 silver (6)
12–96 Chemistry 141 Grossmont College

Procedure
4. Study carefully the model that you have constructed. Note thegeometry of the connected atoms and of all the electron pairsabout the central atom. Now draw in the space provided, a three-dimensional representation using your model as a guide:
The wedges represent a bond or electron pair coming out of theplane of the page. A dotted line represents a bond behind the planeof the page, and the solid lines are in the plane of the page.
5. Determine the orbital (electron pair) geometry about the centralatom using VSEPR theory and indicate the hybridization of thecentral atom.
The orbital geometry of NH2– is tetrahedral and the hybridization is sp3.
6. Determine the molecular shape of the molecule or ion. This isbased on the atomic geometry about the central atom. The molecu-lar shape structure often excludes unshared pairs. Ionic charge isoften included using brackets around the species.
NH2– has bent molecular geometry:
7. Now list the electronegativities of the bonded atoms and calculatethe differences in their electronegativities. Determine from thiswhich bonds are polar and which are nonpolar:
8. If the molecule has all nonpolar bonds, write ‘nonpolar’. If polarbonds are present draw another structure as in part (d) and add thedipole arrow to indicate the net dipole of the species. If the bonddipoles cancel due to the symmetry, show this and label the dia-gram as “nonpolar’. A compound may have polar bonds and still
be nonpolar, if the bond dipoles cancel due to symmetry (as inboron trifluoride).
EXAMPLE 12.1 NH2–
H 2.2N 3.0
0.8
Chemistry 141 Grossmont College 12–97

Molecular Structure
Molecular Polarity. The polarity of a molecule can be determined by looking at the shape of themolecule and the bonds withing the molecule. A polar molecule occurs when there is a net dipolemoment on the molecule as determined by electronegativity differences between atoms. A nonpolarmolecule will not have a net dipole moment. There are some visual indicators that can help deter-mine if a molecule is polar. For example, a molecule can usually be classified as polar if: there is alone pair (or lone pairs) on the central atom, or there are different types of atoms (or groups ofatoms) on the central atom with different electronegativity values. Be careful using these rulesespecially with expanded octets and molecules with multiple central atoms.
Part IIUse Spartan to build the molecules. Measure bond lengths and bond angles with MMFF calcula-tions. Then use semi-empirical calculations (AM1) to measure dipole moments, surfaces and inves-tigate molecular orbitals. Complete Table 12.5 and Table 12.6 .
Spartan Molecular Modeling. When you open the Spartan application you see a blank screenwith menus on top and along the side. To build a molecule, select an atom from the menu and clickon the screen. The atom appears on the screen. Select another atom and click. The new atom isbonded to the first one. Continue adding one atom at a time until the molecule is complete. Thecomputer adjusts the bond angles and bond lengths to give the correct molecular shape.
Now click on the “Energy” button” That’s it! What you see on the screen is a ball-and-stickrepresentation of your molecule. You can change the structure to a space-filling model, a wireframe, or other choices by selecting options under the MODEL menu.
The energy button. The energy button performs a calculation to determine the most stablearrangement of atoms in your molecule. Using Hooke's Law, the bond lengths and bond angles areadjusted until the structure with the lowest potential energy is produced. In the parlance of molecu-lar modeling, we say “the structure is minimized”, in terms of its potential energy.
9. Give the oxidation number for each element in the compound.
For NH2– the H's have an oxidation number of +1 and the nitrogen
must have an oxidation number of -3. Remember that the sum of theoxidation numbers must be equal to the charge on the particularspecies. Refer to your text for the rules for assigning oxidationnumbers.10. Give the formal charge for each atom in a compound. Remember
that the formal charge is nothing more that a means to make a bet-ter guess at the correct Lewis structure of a compound or ion. For-mal charge does not have any real physical significance.
For NH2– there really isn't any reason to calculate formal charges since
there is only one possible way to put these atoms together. That is, ifwe do not force H to bond more than once. Formal charge on an atomis equal to the group number minus the number of electronssurrounding atom (all lone pairs plus ½ shared pairs). NH2
– is shown:
(EQ 12.1)
EXAMPLE 12.1 NH2–
N 5 4 14--- 4 +– 1–=
H 1 12--- 2 – 0=
12–98 Chemistry 141 Grossmont College

Procedure
Once the molecule is built, you have several methods to investigate your structure:
• You can rotate the structure to see the 3-D arrangement of atoms; click and drag with the mouse.• Click on the menu buttons to inspect bond length or bond angle, use menu options to view prop-
erties such as dipole moment or heat of formation.• Use the calculation menu to generate an electron density surface for the molecule.
One of the more useful applications of Spartan is the electron density surface (electron cloud).The size and shape of the electron cloud defines the size and shape of an atom or molecule. You canmake the surface transparent and view the atoms within. If you make the surface opaque, you get astructure that is very similar to a space-filling model. A space-filling model illustrates the van derWaal volumes for each atom, showing how the atomic orbitals penetrate into each other.
FIGURE 12.1
Menu options allow you to calculate the electrostatic potential for all points on the electron densitysurface. The electrostatic potential is defined as the energy of interaction between a point-positivecharge and the nuclei and/or electrons in a molecule.
If the point charge is placed in a region of high electron density, the interaction is attractive, thepotential is negative, and Spartan colors these regions red. If the point charge is placed near lowelectron density regions, the interaction is repulsive, the potential is positive and Spartan colorsthese regions blue. Yellow and green regions represent intermediate values for the potential.
You must use higher-level calculations (semi-empirical or ab initio methods) to view dipolemoment, heat of formation and density surfaces. All these choices are available under the setupmenu. Below are some basic directions for using Spartan:
Spartan and Electron Density Viewing:
1. Go to START and select PC SPARTAN PLUS.2. Build molecule.3. Drop down SET UP menu and click on CALCULATIONS.4. Click OK.5. Drop down SET UP menu and SURFACES. 6. Click ADD: Surface DENSITY and Property DENSITY.7. Click OK and leave screen on the desktop.8. Click SET UP again and select SUBMIT.9. Be patient, the calculations can take a few minutes.10. Save your file when prompted.
Chemistry 141 Grossmont College 12–99

Molecular Structure
11. After Spartan says it has completed the save, click DISPLAY.12. Select PROPERTIES.13. On the Surfaces List screen put a check mark in the yellow density box.14. Click on a part of the molecule. The property screen will toggle between molecule properties
and surface properties.15. Have fun looking at the molecules in a new way!
Spartan and Molecular Orbitals:
1. Using the same programs, create a model for the formate ion, HCO2-. Be sure to designate when
you set up the calculations that the molecule has a minus one charge. 2. This time, have the program show the molecular orbitals for the molecule by checking the
appropriate model.3. Select SET UP then SURFACES check ADD under SURFACE select HOMO and click OK.
Select SET UP then SUBMIT. 4. Repeat with LUMO, etc. 5. Draw the three molecular orbitals, labeling them as pi, n (nonbonding), and pi* orbitals. Note
which is the highest occupied molecular orbital (HOMO) and which is the lowest unoccupiedmolecular orbital (LUMO).
12–100 Chemistry 141 Grossmont College

Prelaboratory Sheet
Prelaboratory Sheet 1. Complete the following table:
Valence shell electron pairs
Bonding electron “clouds”
Lone pairs
Formula Orbital geometry
Approximate bond angles
Molecular geometry
Hybridization
AX
AX2
AX3
AX4
AX5
AX6
Chemistry 141 Grossmont College 12–101

Molecular Structure
ry and Theory ions
etry
____
_____
y
etry
y
etry
f central
y
Report Sheet
TABLE 12.2 Inorganic Compounds - Be sure to show the proper geometries!
Species Lewis Dot Structure and Resonance structures including formal chargeVSEPR Theo
Valence Bond Classificat
HCN
Indicate the
hybridization of both the C and N
Total Valence Electrons
H-C-N bond angle Polarity
Molecular Geom
Hybridization
Carbon _______
Nitrogen______
Orbital Geometr
H2O
Total Valence Electrons H-O-H bond angle Polarity
Molecular Geom
Hybridization
Orbital Geometr
SO2
Show all reso-nance structures and formal charges.
Total Valence Electrons
O-S-O bond angle Polarity
Molecular Geom
Hybridization oatom
Orbital Geometr
12–102 Chemistry 141 Grossmont College

Report Sheet
tral
tral
tral
nd ory
CHCl3
Total Valence Electrons
H-C-Cl bond angle Polarity
Molecular Geometry
Hybridization of cenatom
Orbital Geometry
PF3
Total Valence Electrons F-P-F bond angle Polarity
Molecular Geometry
Hybridization of cenatom
Orbital Geometry
NH4+
Total Valence Electrons H-N-H bond angle
Molecular Geometry
Hybridization of cenatom
Orbital Geometry
TABLE 12.2 Inorganic Compounds - Be sure to show the proper geometries!
Species Lewis Dot Structure and Resonance structures including formal chargeVSEPR Theory a
Valence Bond TheClassifications
Chemistry 141 Grossmont College 12–103

Molecular Structure
etry
central
y
etry
central
y
etry
central
y
ry and Theory ons
CS2
Total Valence Electrons
S-C-S bond angle Polarity
Molecular Geom
Hybridization ofatom
Orbital Geometr
O3
Show all the
resonance
structures and formal charges.
This is a non-cyclic molecule.
Total Valence Electrons
O-O-O bond angle Polarity
Molecular Geom
Hybridization ofatom
Orbital Geometr
AsCl5
Are the Cl atoms equato-rial, axial, or both?
Total Valence Electrons
Cl-As-Cl bond angles __________and __________ Polarity
Molecular Geom
Hybridization ofatom
Orbital Geometr
TABLE 12.2 Inorganic Compounds - Be sure to show the proper geometries!
Species Lewis Dot Structure and Resonance structures including formal chargeVSEPR Theo
Valence Bond Classificati
12–104 Chemistry 141 Grossmont College

Report Sheet
tral
tral
tral
d ry
XeF4
Are the F atoms equatorial, axial, or both?
Total Valence Electrons
F-Xe-F bond angle Polarity
Molecular Geometry
Hybridization of cenatom
Orbital Geometry
ICl3
Are the Cl atoms equato-rial, axial, or both?
Total Valence Electrons
Cl-I-Cl bond angle Polarity
Molecular Geometry
Hybridization of cenatom
Orbital Geometry
SO32–
Show all reso-nance structures and formal charges.
Total Valence Electrons
O-S-O bond angle
Molecular Geometry
Hybridization of cenatom
Orbital Geometry
TABLE 12.2 Inorganic Compounds - Be sure to show the proper geometries!
Species Lewis Dot Structure and Resonance structures including formal chargeVSEPR Theory an
Valence Bond TheoClassifications
Chemistry 141 Grossmont College 12–105

Molecular Structure
etry
central
y
etry
central
y
etry
central
y
ry and Theory ons
SF6
Are the F atoms equatorial, axial, or both?
Total Valence Electrons
F-S-F bond angle Polarity
Molecular Geom
Hybridization ofatom
Orbital Geometr
P4
All of the phos-phorus atoms are equivalent with no multi-ple bonds or expanded octets. Draw the entire molecule.
Total Valence Electrons
P-P-P bond angle Polarity
Molecular Geom
Hybridization ofatom
Orbital Geometr
I3-
Don’t forget the formal charges!
Are the I atoms equatorial, axial, or both?
Total Valence Electrons
I-I-I bond angle
Molecular Geom
Hybridization ofatom
Orbital Geometr
TABLE 12.2 Inorganic Compounds - Be sure to show the proper geometries!
Species Lewis Dot Structure and Resonance structures including formal chargeVSEPR Theo
Valence Bond Classificati
12–106 Chemistry 141 Grossmont College

Report Sheet
tral
tral
tral
d ry
AsCl3F2
Are the F atoms equatorial, axial, or both?
Are the Cl atoms equato-rial, axial, or both?
Total Valence Electrons
Cl-As-Cl bond angle
F-As-F bond angle Polarity
F-As-Cl bond angle
Molecular Geometry
Hybridization of cenatom
Orbital Geometry
SO42-
Look for some resonance struc-tures that expand the valence of sul-fur. Remember to show the for-mal charges.
Total Valence Electrons
O-S-O bond angle Polarity
Molecular Geometry
Hybridization of cenatom
Orbital Geometry
SF4
Are the F atoms equatorial, axial, or both?
Total Valence Electrons
F-S-F bond angles __________and ___________ Polarity
Molecular Geometry
Hybridization of cenatom
Orbital Geometry
TABLE 12.2 Inorganic Compounds - Be sure to show the proper geometries!
Species Lewis Dot Structure and Resonance structures including formal chargeVSEPR Theory an
Valence Bond TheoClassifications
Chemistry 141 Grossmont College 12–107

Molecular Structure
etry
central
y
etry
central
y
etry
central
y
ry and Theory ons
BF3
Show all possi-ble resonance structures. Indi-cate which structures are likely to form and why. Be sure to include formal charges.
Total Valence Electrons F-B-F bond angle Polarity
Molecular Geom
Hybridization ofatom
Orbital Geometr
NO2
Show all four resonance struc-tures and charges. Iden-tify the advan-tages of each.
Total Valence Electrons
O-N-O bond angle Polarity
Molecular Geom
Hybridization ofatom
Orbital Geometr
BeCl2Show all possi-ble resonance structures. Be sure to include formal charges.
Total Valence Electrons
Cl-Be-Cl bond angle Polarity
Molecular Geom
Hybridization ofatom
Orbital Geometr
TABLE 12.2 Inorganic Compounds - Be sure to show the proper geometries!
Species Lewis Dot Structure and Resonance structures including formal chargeVSEPR Theo
Valence Bond Classificati
12–108 Chemistry 141 Grossmont College

Report Sheet
TABLE 12.3 Organic Compounds - Fill in the missing bonds, atoms, and/or lone pairs.
Species Lewis Dot StructureVSEPR Theory and
Valence Bond Theory Classification
C6H6 is benzene. Show the two resonance struc-tures for this cyclic
molecule
Total Valence Electrons
Hybridization of carbon atoms
C-C-H bond angle
Polarity
C6H12 is cyclo-hexane. There will be one large ring formed out of the carbon atoms.
Total Valance Electrons
Hybridization of carbon atoms
C-C-H bond angle
Polarity
H2C2O4
Oxalic acid aka Ethanedioic acid
Total Valence Electrons
Complete Lewis Structure on the skeleton below:
Redraw with the proper geometry:
Orbital Geometry
C3
O2
Hybridization of speci-fied atom
C3
O2
Chemistry 141 Grossmont College 12–109

Molecular Structure
es hy?
for
n s
d ry
CH2O
HCHO is form-aldehyde. Deter-mine the best structure by completing the structures to the right.
Total Valence Electrons
Structure 1
Structure 2
Which structure makthe most sense and w
HCO2H
Complete the structure for for-mic acid aka methanoic acid.
Total Valence Electrons
Give the bond angles
H1-C2-O3
C2-O4-H5
Polarity
CH3CO2H
Complete the structure for acetic acid aka ethanoic acid.
Total Valence Electrons
Give the hybridizatioof the numbered atom
1
2
3
4
TABLE 12.3 Organic Compounds - Fill in the missing bonds, atoms, and/or lone pairs.
Species Lewis Dot StructureVSEPR Theory an
Valence Bond TheoClassification
12–110 Chemistry 141 Grossmont College

Report Sheet
TABLE 12.4 Isomers of Organic Compounds
Species Lewis Dot Structures
C3H6
C3H6 has two distinct iso-mers. Draw each one.
Total Valence Electrons
C4H8
C4H8 has many possible varia-tions. Draw 5 distinct possibil-ities.
Total Valance Electrons
C4H9OH
Draw 4 distinct variations; each will have an OH group attached. Do not try to create any iso-mers without a hydroxyl, OH, group!
Total Valence Electrons
Chemistry 141 Grossmont College 12–111

Molecular Structure
TABLE 12.5 Spartan Molecular Modeling
Draw Arrow Representing the Dipole Moment where appropriate on Structure
Bond AngleMagnitude of Dipole Moment
Electrostatic Potential Surface (Use colored pencils)Several orientations for each molecule are possible.
H—C—H
Polarity
H—C—Cl
Cl—C—Cl
Polarity
H—N—H
Polarity
12–112 Chemistry 141 Grossmont College

Report Sheet
H—O—H
Polarity
F—N—F
Polarity
F—P—F
Polarity
TABLE 12.5 Spartan Molecular Modeling
Draw Arrow Representing the Dipole Moment where appropriate on Structure
Bond AngleMagnitude of Dipole Moment
Electrostatic Potential Surface (Use colored pencils)Several orientations for each molecule are possible.
Chemistry 141 Grossmont College 12–113

Molecular Structure
Draw the three molecular orbitals, labeling them as pi, n (nonbonding), and pi* orbitals. Note which is thehighest occupied molecular orbital (HOMO) and which is the lowest unoccupied molecular orbital (LUMO).
What is the significance to the stability of the nitrite ion of the fully occupied pi orbital?
TABLE 12.6 Spartan Molecular Orbitals
Species Molecular Orbital Drawings
nitrite ion
NO2-
12–114 Chemistry 141 Grossmont College

Post Lab Questions
Post Lab Questions1. Explain why the bond angles increase or decrease in the following series H-C-H bond in meth-
ane, CH4, H-N-H bond in ammonia, NH3, H-O-H bond in water, H2O.
2. Explain the differences between the H-C-H bond angle in methane, CH4, and the bond angles intrichloromethane, CHCl3 (Be sure to consider both the Cl-C-Cl and H-C-Cl bonding in tri-chloromethane, CHCl3.).
3. Compare the dipole moments and bond angles for ammonia, NH3, nitrogen trifluoride, NF3, andphosphorus trifluoride, PF3. Does each dipole point in the same direction? Explain.
TABLE 12.7
NH3 NF3 PF3
Dipole Moment
Bond Angles
Chemistry 141 Grossmont College 12–115

Molecular Structure
12–116 Chemistry 141 Grossmont College

EXPERIMENT 13 Propagation of Error: An Error Analysis Activity
ObjectiveMore often than not, quantities that are measured are used to determine derived quantities. Forinstance, mass and volume measurements are used to make density determinations. These measure-ments have a certain error associated with them. This lab will introduce a method of statistical anal-ysis to propagate error through calculations.
Introduction
Errors of a Calculated Result
If a balance with a ± 0.0001 g error and a pipet with a ± 0.01 mL error are used, how should theseerrors be combined to determine the error in the density? The use of significant figures is anapproximation of error, but for a more exact representation the following methods are used.
Absolute error () is the approximate error of a single measurement. The absolute error is bestestimated as the standard deviation for a measurement. Absent this data an estimation should bemade based upon the confidence the experimenter has with their ability to read the measuringdevice.
Relative error is the ratio of the size of the absolute error to the size of the measurement beingmade.
(EQ 13.1)
(EQ 13.2)
Relative Error absolute error experimental value---------------------------------------------
measurement ---------------------------------= =
%Relative Error absolute error experimental value--------------------------------------------- 100 %
measurement --------------------------------- 100 %= =
Chemistry 141 Grossmont College 13–117

Propagation of Error: An Error Analysis Activity
.
Using these values we can approximate the error in calculated values. For addition and subtraction the absolute value of the sum or difference can be roughly approximated as the sum of the absolute values.
FIGURE 13.1
EXAMPLE 13.1
When reading the volume of liquid in the graduated cylinder to theright, you would estimate 64 mL, but it might be 63 or 65 mL. So, thevalue would be reported as 64 ± 1 mL and the absolute error in thevolume measurement, V = 1 mL.
The relative error for the example would be:
or reported as 1.6% relative error.
EXAMPLE 13.2
If the volume of a rock is measured by the displacement of water two volume mea-surements will be found:
Volume water = 2.5 ± 0.3 mL (range 2.2 - 2.8 mL)
Volume water + rock = 6.8 ± 0.4 mL (range 6.4 - 7.2 mL)
Volume rock = (Volume water + rock) - (Volume water)
= 6.8 mL - 2.5 mL = 4.3 mL
But, the two volume measurements may range over a variety of values. Subtractingthe high value for water volume from the low value for water + rock will give a lowvalue for the rock volume:
6.4 mL - 2.8 mL = 3.6 mL
Subtracting the low value for water volume from the high value for the rock volumegives a high volume for the rock volume:
7.2 mL - 2.2 mL = 5.0 mL
The range of values for the rock volume is 3.6 - 5.0 mL or 4.3 ± 0.7 mL. Theabsolute error in this measurement of 0.7 mL is equal to the sum of the absoluteerrors for the two original volumes. This idea is illustrated in the picture below.
Relative Error 1 mL 64 mL--------------- 0.016= =
13–118 Chemistry 141 Grossmont College

Introduction
This method of error propagation overestimates the combined error because of the possibility thaterrors can cancel when more than one measurement is made.
In fact, if this process is looked at statistically, a better approximation of error in a sum or a differ-ence is given by the formula:
(EQ 13.3)
When performing multiplication and division, the propagation of error must use relative rather thanabsolute errors. This is illustrated when density is calculated. The error in mass is in grams, whilethe error in volume is in mL. Grams and milliliters cannot be added together to calculate the totalerror; The relative error is unitless. The sum of the relative errors is an approximation of the totalrelative error (although it is an overestimation as before. Again, if the simple idea of using statisticsis applied a better approximation of error results from the following:
(EQ 13.4)
where R is a calculated value and the final absolute error in the result is given by:
R = (relative error)(R) (EQ 13.5)
.
TABLE 13.3
Operation Example Error
Addition S = A + B
Subtraction D = A - B
Multiplication
Division
EXAMPLE 13.4
A chemist analyzes a compound containing only H, C, and O. What is the uncertainty in the %O? The C-H analysis results are:
%C = 54.80 ± 0.05
%H = 6.92 ± 0.05
Answer:
% O = 100.00% - 54.80% - 6.92% = 38.28%
Applying the rule for subtraction:
So, %O = 38.28 ± 0.07%
R a2 b2 + +=
Relative Error RR
------- a2
a--------- b2
b--------- c2
c--------- + + += =
S A2 B2+=
D A2 B2+=
P A B=PP
------- AA
------- 2 B
B------- 2
+=
Q AB---= Q
Q-------- A
A------- 2 B
B------- 2
+=
O % %C 2 %H 2+ 0.05 0.05 += = 0.07=
Chemistry 141 Grossmont College 13–119

Propagation of Error: An Error Analysis Activity
.
See the following web sites for a good discussion of error propagation:
http://www.rit.edu/cos/uphysics/uncertainties/Uncertaintiespart2.html
http://www.itl.nist.gov/div898/handbook/mpc/section5/mcp55.htm
http://teacher.nsrl.rochester.edu/phy_labs/AppendixB/AppendixB.html
EXAMPLE 13.5
A student finds the density of a liquid by allowing a 10.00 mL volumetric pipetfilled with liquid to drain into a previously weighed Erlenmeyer flask. The fol-lowing data was recorded:
Volume liquid = 10.04 ± 0.01 mL
Mass empty flask = 22.452 ± 0.002 g
Mass flask + liquid = 33.629 ± 0.002 g
Answer:
m = 33.629 - 22.452 g = 11.177 g
V = 10.04 mL
For the error in mass, use the addition rule:
For the error in density, use the rule for division:
d = 0.035 (d)
d = (0.035)(1.1113 g/mL) = 0.039 g/mL
However, normally error is only reported to one significant digit becausegenerally speaking, as demonstrated in the above example, error is the leastaccurate quantity and therefore determines the magnitude of the overall error.
d = 0.04 g/mL
Therefore, the student can now report the error in disunity as:
d = 1.12 ± 0.04 g/mL
Note that the final density and the error in the density end at the same decimal place.
d mV---- 11.177g
10.04mL--------------------- 1.113 g
mL--------= = =
m m flask 2 m flask liquid+ 2+ 0.002g 2 0.002g 2+ 0.003= = =
dd
------- mm
-------- 2 V
V-------- 2
+ 0.003g11.177g-------------------- 2 0.01mL
10.04mL--------------------- 2
+ 0.035= = =
13–120 Chemistry 141 Grossmont College

Procedure
ProcedureDensity is a physical property of matter. It is defined as the ratio of the mass of an object divided byits volume:
(EQ 13.6)
For solids and liquids, density is usually expressed in units of g/cm3. It is evident that the mass andvolume of an object must be known to determine its density. A cylindrical shaped metal slug will beused. Its mass will be determined by simple weighing. The volume, however, will be determined bytwo different methods. An estimate of error will then be made for each method, and then themethod or methods with the highest degree of precision will be decided
1. Prepare a data table in your lab book, so that there is space to record the quantities indicated ineach part. Be sure to estimate and record the uncertainty of each measurement as you are mak-ing the measurements.
2. Obtain the metal cylinder assigned to you. Weigh the cylinder, be sure to record the uncertaintyof the measurement.
Vernier Calipers1. Use Vernier calipers to measure the diameter and length of the metal cylinder to the 0.01 cm.
Your instructor will demonstrate how to use these calipers. Make your measurements in centi-meters and don’t forget to include the uncertainty of your measurements. This will give a vol-ume measurement in cm3.
2. Using the dimensions of the cylinder determine the volume:
(EQ 13.7)
3. Obtain the actual density of your cylinder from your instructor.
Volume by Water Displacement1. Partially fill a 50 mL graduated cylinder with water and read the volume. Don’t forget to record
the uncertainty of the volume measurements. You must initially have enough water in the cylin-der to completely cover the metal slug, but be careful that the displaced water does not exceedthe 50 mL mark.
2. Tip the graduated cylinder at a sharp angle to the vertical and carefully slide the metal slug intothe graduated cylinder. Do not drop the metal slug into the graduated cylinder. Take care toavoid splashing water up the sides of the graduated cylinder, or break the cylinder. Place thegraduated cylinder back on your bench and record the new volume. Don’t forget to include theuncertainty of the measurement and take the temperature of your water.
Results and Calculations
Vernier Calipers1. Use your length, diameter and mass measurements and their uncertainty values to calculate the
relative error and percent relative error in your length, diameter and mass measurements. Asillustrated in example 13.5.
d mV----=
V r2l=
Chemistry 141 Grossmont College 13–121

Propagation of Error: An Error Analysis Activity
2. Determine the volume and density of the cylinder. 3. Calculate the uncertainty in each measurement.4. Then calculate the relative error and percent relative error in your measurements.5. Calculate the percent error in your density determination.
Volume by Water Displacement1. Use your volume and mass measurements and their uncertainty values to calculate the relative
error and percent error in your volume and mass measurements.2. Determine the density of the cylinder and its uncertainty value. Then calculate the relative error
and percent relative error in your measurements.3. Calculate the percent error in your density determination.
Create a table summarizing your major data.
Which method is more accurate when determining the volume of the metal slug the calipers or thewater displacement? Be sure to use your data to support your answer.
Which method is more precise when determining the volume of the metal slug the calipers or thewater displacement? Be sure to use your data to support you answer.
13–122 Chemistry 141 Grossmont College

EXPERIMENT 14 Identification of an Unknown Acid
Objective
The objective in this experiment is to prepare and standardize a sodium hydroxide solution and useit to determine the equivalent weight, pKa, and melting point of an unknown acid. Using thisinformation the identify of an unknown acid will be determined. The techniques required for thislab include the preparation of a standard acid solution, standardization of a base solution, titrationmeasurement of pKa and the melting point of a crystalline solid.
IntroductionUp to now, you have done a number of labs which could be classified as quantitative analysis.Quantitative analysis is the analysis of a sample to determine the concentration of a solute in a mix-ture. Now you will begin to do what is known as qualitative analysis. Qualitative analysis can bedefined as the process of using the properties of an unknown substance in order to identify the sub-stance. It is a common occurrence for a chemist to be given a sample and asked to identify the sub-stances in a mixture. A forensic chemist might be asked to identify the toxin which killed a victim.A chemist working for the IOC might be asked to identify illicit substances in the urine samplefrom an athlete.
In this experiment, you will be given a sample of an unknown acid. Your job will be to identify thisacid from measuring a number of physical properties of the compound. First, quantitative analysiswill be used to determine the equivalent weight or gram molar mass (GMM) of an unknown acid.
Titration
The term titration refers to the addition of a solution of one reagent, usually from a burette, to aknown amount of the other reagent, and then determining the volume of solution added when thereaction is complete. If the titration is done by addition of a base to an acid, typically there is a rel-atively large and sudden increase in pH as the equivalence point is reached. This point may be
Chemistry 141 Grossmont College 14–123

Identification of an Unknown Acid
detected visually when a color change occurs by using an appropriate indicator, or by measuringthe change in pH with a pH meter.
As mentioned, sodium hydroxide will be used in the titration. However, sodium hydroxide solu-tions cannot be prepared with adequate precision simply by weighing out solid NaOH, since thecommercial material is not sufficiently pure and absorbs water and CO2 quickly from the air. Inorder for a titration to be accurate, the base solution must first be standardized. Standardizationrefers to the preparation of a solution of accurately known concentration. To standardize NaOH,oxalic acid is used since it can be obtained in a high state of purity and does not absorb moisturereadily. Thus, to standardize a sodium hydroxide solution, we first prepare the solution noting theapproximate concentration of NaOH and then titrate this solution with an oxalic acid solution ofknown concentration. The oxalic acid solution is referred to as a standard solution since it canbe prepared such that its exact concentration is known. This solution is also called a primarystandard solution and the student should be familiar with both terms. Phenolphthalein will beused as the indicator in this acid/base system.
The equivalent weight of an acid is defined as the weight of acid that provides one mole of H+ inthe reaction. The units are grams per equivalent. For a monoprotic acid like HCl, the equivalentweight and the molecular weight are the same. For a diprotic acid like oxalic acid, if both hydro-gens are consumed in the reaction, the equivalent weight is one-half the molecular weight. In thisexperiment, since the formula of the unknown acid is not available, the equivalent weight must bedetermined by the following relationship:
grams of acid/moles of H+ reacted. The number of moles of H+ is equal to the number ofmoles of OH- from the base
Some compounds exist as hydrates. A hydrate is a compound in which the solid contains one ormore molecules of water locked within the ions or molecules that make up the solid. The watermolecules are part of the formula unit and are included when writing the formula for the hydrate.Oxalic acid exists as the dihydrate; this means that there are two molecules of water for every mol-ecule of oxalic acid. Thus, the complete formula is written as:
H2C2O4 • 2 H2O (EQ 14.1)
Notice the “dot” inserted between the formula and water.
Melting Point
The problem with this is that there are many thousands of weak acids. Knowing the gram molarmass of an acid will certainly eliminate the great majority of possible compounds. However, simplyknowing the gram molar mass of an acid does not provide sufficient information to identify thesubstance unambiguously. More properties of the substance must be measured in order to reach aunique identification.
There are a number of methods used by chemists to do qualitative analysis. These would includemeasuring the boiling or melting point of the substance, measuring the density of the substance, orthe solubility of the substance. Also included are a number of more high tech methods such as var-ious types of spectroscopy. These methods would include infrared spectroscopy, UV/vis spectros-copy, and nuclear magnetic resonance (NMR) spectroscopy. Perhaps the qualitative tool of greatestpreference to chemists is the gas chromatograph (GC) in tandem with a mass spectrometer (MS) (aGCMS). Your instructor may explain some of these tools. These methods are all fairly expensive.
14–124 Chemistry 141 Grossmont College
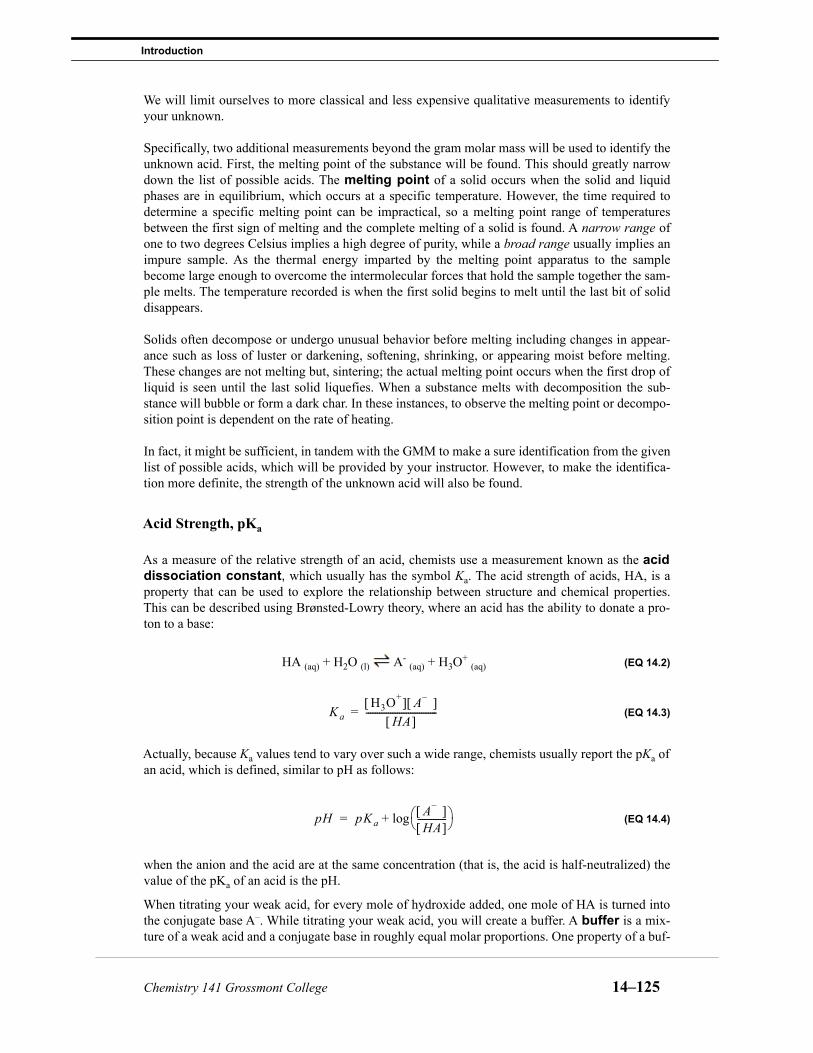
Introduction
We will limit ourselves to more classical and less expensive qualitative measurements to identifyyour unknown.
Specifically, two additional measurements beyond the gram molar mass will be used to identify theunknown acid. First, the melting point of the substance will be found. This should greatly narrowdown the list of possible acids. The melting point of a solid occurs when the solid and liquidphases are in equilibrium, which occurs at a specific temperature. However, the time required todetermine a specific melting point can be impractical, so a melting point range of temperaturesbetween the first sign of melting and the complete melting of a solid is found. A narrow range ofone to two degrees Celsius implies a high degree of purity, while a broad range usually implies animpure sample. As the thermal energy imparted by the melting point apparatus to the samplebecome large enough to overcome the intermolecular forces that hold the sample together the sam-ple melts. The temperature recorded is when the first solid begins to melt until the last bit of soliddisappears.
Solids often decompose or undergo unusual behavior before melting including changes in appear-ance such as loss of luster or darkening, softening, shrinking, or appearing moist before melting.These changes are not melting but, sintering; the actual melting point occurs when the first drop ofliquid is seen until the last solid liquefies. When a substance melts with decomposition the sub-stance will bubble or form a dark char. In these instances, to observe the melting point or decompo-sition point is dependent on the rate of heating.
In fact, it might be sufficient, in tandem with the GMM to make a sure identification from the givenlist of possible acids, which will be provided by your instructor. However, to make the identifica-tion more definite, the strength of the unknown acid will also be found.
Acid Strength, pKa
As a measure of the relative strength of an acid, chemists use a measurement known as the aciddissociation constant, which usually has the symbol Ka. The acid strength of acids, HA, is aproperty that can be used to explore the relationship between structure and chemical properties.This can be described using Brønsted-Lowry theory, where an acid has the ability to donate a pro-ton to a base:
HA (aq) + H2O (l) A- (aq) + H3O+ (aq) (EQ 14.2)
(EQ 14.3)
Actually, because Ka values tend to vary over such a wide range, chemists usually report the pKa ofan acid, which is defined, similar to pH as follows:
(EQ 14.4)
when the anion and the acid are at the same concentration (that is, the acid is half-neutralized) thevalue of the pKa of an acid is the pH.
When titrating your weak acid, for every mole of hydroxide added, one mole of HA is turned intothe conjugate base A–. While titrating your weak acid, you will create a buffer. A buffer is a mix-ture of a weak acid and a conjugate base in roughly equal molar proportions. One property of a buf-
KaH3O+ A–
HA --------------------------------=
pH pKaA– HA
------------- log+=
Chemistry 141 Grossmont College 14–125

Identification of an Unknown Acid
fer is that its pH is changed only slightly by adding strong acid or strong base to it. For this reason,as you titrate your unknown acid, the pH will only change very slowly. Something very interestinghappens to the equation for Ka at what is known as the half-titration point. By definition, the half-titration point is the point in the titration where exactly half the original weak acid has been con-verted to the conjugate base. In a titration, the half-titration point will occur at exactly half the vol-ume of titrant as that required to reach the endpoint. At the half-titration point,
[HA] = [A–] (EQ 14.5)
In this case, at the half-titration point the Ka equation above simplifies to:
Ka = [H+] or pKa = pH (EQ 14.6)
In other words, for example, if a titration of a weak acid required 9.00 mL to reach endpoint, then ifone could measure the pH when the volume of base was 4.50 mL, then the pH at that point wouldequal pKa of the acid. Put even more simply, pKa = pH at half-titration point.
Your job, then, is to simply measure the pH of a solution of your unknown acid which has beenhalf-titrated! When you half-titrate a weak acid, you are creating a pH buffer. This solution will befairly resistant to pH change. For this reason, if you add water to the half-titrated solution, it willnot affect the pH significantly.
pH = pKa (EQ 14.7)
The pH is measured with a pH meter. A graph of pH versus mL of sodium hydroxide added.
FIGURE 14.1
The equivalence point (V1), which is the point where the curve is the steepest, and the half-equiva-lence point (V1/2) of the titration are shown on Figure 14.1 . Using the half-equivalence point todetermine the pKa of the unknown acid, and from the volume of base added at the equivalencepoint, the equivalent weight of the acid can be calculated. A list of all the possible acids for you toconsider along with the pKa value for each of the acids will be provided by your instructor.
14–126 Chemistry 141 Grossmont College

Procedure
Once you have successfully measured the GMM, the melting point, and the pKa of your unknown acid, you should be able to make an unambiguous identification of your acid from the list of possi-ble acids which will be provided by your instructor.
Procedure
Read through the entire procedure first and determine what type of data and observations that youwill be collecting. In the data and observations section of your notebook, construct an appropriatedata table that facilitates efficient data recording.
Preparation of the Standard Oxalic Acid Solution1. Calculate the mass of oxalic acid dihydrate, H2C2O4 • 2 H2O, needed to make 250 mL of 0.050
M solution. Do not waste time trying to weigh out the exact amount that you calculated sinceyou will know the final concentration once the solution is prepared.
2. Weigh a sample of the hydrate that is within 20 percent of the calculated amount. Tare a clean,dry beaker on the analytical balance, add an appropriate amount (within 20 percent of calcu-lated) of oxalic acid, and weigh the beaker containing the acid. Do not transfer chemicals insidethe analytical balance.
3. Transfer all of the acid to a 250.0 mL volumetric flask, fill the volumetric flask half-full withwater and swirl contents until the acid is all dissolved. When you are certain that all of the solidhas dissolved, add water to the mark, stopper the flask and invert several times to mix thor-oughly. Return the volumetric flask at the end of the lab today!
Standardization of NaOH1. Prepare one liter of approximately 0.10 M NaOH by dilution of the stock solution provided.
Mix it thoroughly and store in a properly labeled plastic bottle. Be sure to record the originalconcentration of the stock solution, the amount of water that you used to dilute the stock solu-tion and the final concentration of your NaOH solution.
2. Using a volumetric pipet, transfer 25.00 mL of your oxalic acid solution into a 125 or 250 mLErlenmeyer flask. Add two drops of phenolphthalein indicator to the acid solution. Fill theburette with your NaOH solution and titrate the acid in the flask with the NaOH from theburette. The titration is complete when the first pink color persists in the flask. Swirl the flaskduring the addition of base to ensure complete mixing.
3. Be sure to rinse the pipet with the acid solution and the burette with base before use, to removeany traces of water. The inside of the titration flask should be washed down with water justbefore reaching the end point to remove any drops of acid or base stuck on the side of the flask.
4. Try to add no more than one drop in the last addition as you approach the end point.
NOTE: Record volumes to 0.01 mL and masses to 0.0001 g
Remember that all of these concentrations of NaOH are approximate;the first goal is to determine the exact concentration of NaOH by stan-dardization
Chemistry 141 Grossmont College 14–127

Identification of an Unknown Acid
5. Perform titrations until you get three that differ in only the second decimal place for the mL ofbase used. Calculate the concentration of the base for each trial, and obtain a mean and standarddeviation. The average concentration that you calculate is the concentration of your now stan-dardized NaOH. Your standardized base will be used to titrate your unknown acid so be sure tocover the solution to prevent loss of water (which changes the concentration) and save it for uselater in the experiment.
Molar Mass of a Monoprotic Unknown AcidUsing standardized sodium hydroxide titrate the unknown monoprotic acid to determine the equiv-alent weight of the acid. Since the unknown acid is a monoprotic acid, you will not need to worryabout the distinction between equivalent weight and gram molar mass.
1. On the analytical balance, measure out approximately 0.50 g of your unknown acid. Be sureto record your unknown number in your lab book. Being very careful not to lose any ofthe acid, transfer to a 250 mL Erlenmeyer flask which has been cleaned but not necessarilydried. Add 50-100 mL of water as well as two drops of phenolphthalein indicator to the flask.
2. If the acid does not dissolve easily, you may need to heat the mixture gently. If most, but not all the acid dissolves, you may proceed with the titration, as the conjugate base of the acid created during the titration will be quite soluble in water.
3. Clean, rinse and condition a 50-mL buret with standardized approximately 0.10 M sodiumhydroxide solution. Be sure to record the concentration of the NaOH in your labbook. Fill the buret to somewhere near the top and titrate your sample to phenolphthalein end-point.
4. Repeat the procedure three times. To be sure your results are good, calculate the ration of gramsof unknown used to volume of titrant used. The ratios should agree within 1%. At this point,you may want to calculate the GMM of your unknown acid from the three titrations and calcu-late the average of your values.
The Melting PointFirst, you will be measuring the melting point of your acid. (If the melting point apparatus iscrowded, you can go on and do the experiment to measure pKa first if you like). The melting pointof a substance is the temperature at which the solid crystals of that compound turn to a liquid. Thiswill be a fairly simple measurement.
1. Place just a few small crystals of your unknown acid in the center of the top of your meltingpoint apparatus. Only a very small amount of solid is required to determine a melting point.Insert a thermometer in the appropriate channel in the apparatus.
2. Allow the temperature to increase fairly slowly and record the temperature at which it melts.You should not bother to be extremely careful in this first attempt, as you are just trying to getan approximate melting point the first time around.
3. Once you have an approximate melting point, now you will measure the melting point muchmore carefully by approaching the melting point very gradually. Clean off the surface of themelting point apparatus and put more crystals on top as before. This time, when you are a fewdegrees below the melting point, begin to raise the temperature quite slowly. This can be doneby turning down the hot plate or by putting a few layers of paper between the hot plate and themelting point apparatus. You may have to use your imagination a bit at this point! The tempera-ture should rise at no more than two degrees per minute at the melting point to measure an accu-rate melting point.
14–128 Chemistry 141 Grossmont College

Determining the Identity of Your Unknown Acid
4. If you have any doubt at all about the melting point, perform the procedure one additional time.If you have two fairly good values which are slightly different, you can take the melting point tobe the average of those two values. Record your results in the data section.
Measuring pKa
Your job, then, is to simply measure the pH of a solution of your unknown acid which has beenhalf-titrated! When you half-titrate a weak acid, you are creating a pH buffer. This solution will befairly resistant to pH change. For this reason, if you add water to the half-titrated solution, it willnot affect the pH significantly.
1. Measure out another sample of the unknown acid on the analytical balance.
Using the Vernier Interface
1. Calibrate the pH electrode using two buffer solutions of known pH. Once the reading stabilizes,follow the directions on the screen.
2. Using the known GMM of the unknown acid obtained from your earlier titration, calculate thevolume needs to titrate it.
3. Divide the volume by two and add this volume to your sample.4. Measure the pH using the calibrated pH meter. This will be the pKa of your unknown.5. Repeat the process to get an average pKa.
Determining the Identity of Your Unknown AcidAt this point, you should use the pKa you measured to begin to eliminate possible weak acids fromthe list provided. Once you have narrowed the list down a bit, you should narrow it further, eitherby determining the GMM of your candidates from their formulas and comparing the result to yourmeasurements, or by looking up the melting points of the candidates in the Handbook of Chemistryand Physics (known as the CRC).
With any luck, the pKa in combination with either the melting point or the GMM should reduceyour possibilities down to just a couple of acids. Now, use the third measurement (MP of GMM) tonarrow your choice to one. This is your proposed choice of the identity of your unknown acid.
If you like, you may use the template provided below for recording your experimental values foryour unknown acid, as well as the values your find in the literature for your best guess as to theactual acid, as well as your second best guess.
Chemistry 141 Grossmont College 14–129

Identification of an Unknown Acid
14–130 Chemistry 141 Grossmont College

Sample Data Sheet
SAM
PLE
Sample Data Sheet
Do not use this data sheet for your records. This is provided as an example of what should be in your lab notebook before you begin the experiment.
TABLE 14.1 Preparation of Standard Oxalic Acid Solution
mass of oxalic acidvolumetric flask
TABLE 14.2 Standard Solution Preparation
Initial concentration of stock solutionPipet size Amount of water used for dilutionApproximate concentration of your standard solution
TABLE 14.3 Standardization of NaOH Solution
Trial #1 Trial #2 Trial #3 Trial #4Initial buret readingFinal buret readingVolume of base used
TABLE 14.4 Melting Point of Unknown Solid Acid
Trial #1 Trial #2 Trial #3 AverageMelting Point Range
TABLE 14.5 Titration of Unknown Solid Acid
Trial #1 Trial #2 Trial #3 Trial #4Initial buret readingFinal buret readingVolume of base usedMass of unknown
Chemistry 141 Grossmont College 14–131

Identification of an Unknown Acid
SAMPLE
Sample Calculation SheetDo not use this sheet for your records. This is provided as an example of what should be in your lab notebook before you begin the experiment.
TABLE 14.6 Standard Oxalic Acid Solution
Mass of oxalic acidMoles of oxalic acidVolumetric flaskMolarity of oxalic acidMolarity of H+ions in oxalic acid
TABLE 14.7 Standardization of NaOH Solution
Trial #1 Trial #2 Trial #3 Trial #4Moles of oxalic acidVolume of NaOHMolarity of NaOHAverage molarity
TABLE 14.8 Determination of Equivalent Weight
Trial #1 Trial #2 Trial #3 Trial #4Mass of unknownVolume of NaOHMoles of NaOHMoles H+ reactedEquivalent weightAverage equivalent weight
TABLE 14.9 Identification of Unknown Acid
Average Measured Values
Identity of Acid
Literature Values
Second Best Guess
Literature Values
Gram Molar MassMelting PointpKa
14–132 Chemistry 141 Grossmont College

Post Lab Questions
Post Lab Questions1. What mass of oxalic acid dihydrate, H2C2O4 • 2 H2O, is needed to prepare 250.0 mL of 0.050 M
solution?
2. If 0.750 grams of oxalic acid dihydrate required 31.0 mL of NaOH solution in a titration, whatwas the concentration of the base?
3. What was the equivalent weight of an acid if 0.250 grams of it just neutralized 41.0 mL of 0.161M NaOH solution?
Chemistry 141 Grossmont College 14–133

Identification of an Unknown Acid
14–134 Chemistry 141 Grossmont College

EXPERIMENT 15 Determining the Effectiveness of an Antacid
Objective
In this lab you will gain further experience with titrations by observing reactions with hydrochloricacid and commercial antacids, calculate the amount of acid neutralized by commercial antacids,and tabulate and compare results to determine most cost-effective antacid.
Introduction
Double displacement reactions that involve acids and bases are neutralization reactions, com-bining to form salts and water.
Acid + Base Salt + Water (EQ 15.1)
HCl (aq) + NaOH (aq) NaCl (aq) + H2O (l) (EQ 15.2)
The determination of unknown concentrations of acids or bases can be done using the methodknown as titration. Titrations involve adding one solution whose concentration (of acid or base) isknown, the titrant, usually from a buret to a specific volume of an another solution of unknownconcentration (acid or base), the analyte. One mole of H+ ion neutralizes one mole of OH–. As thereaction proceeds, the pH of the solution changes. When all H+ ions have been neutralized, this isthe titration's equivalence point. At this point the addition of the basic solution will have a dra-matic effect on pH. This point may be detected visually when a color change occurs by using anappropriate indicator, or by measuring the change in pH with a pH meter. A chemical indicatorwhich changes color at various pHs, can be used to find the end point, which should be near theequivalence point. For example, the indicator phenolphthalein is a pinkish-red in basic solutionsbetween pH 8.2-10.0 and colorless in acidic solutions changes colors. There is often a slight differ-ence between the change in the indicator color and the actual equivalence point of the titration. Thisis an indeterminate error (i.e. systematic error). To minimize this error an indicator with an endpoint very close to the equivalence point of the reaction should be used.
Chemistry 141 Grossmont College 15–135

Determining the Effectiveness of an Antacid
Back titration is a method of indirect titration, where the concentration of the analyte is deter-mined by reacting it with a known number of moles of excess reagent. The excess reagent is thenneutralized by titrating it against a second reagent of known concentration. The concentration of theanalyte in the original solution can be found based on the amount of reagent consumed.
EXAMPLE 15.1
A back titration is useful if the end point of the revise titration is easier to identify than the endpoint of the normal titration. They are also useful if the reaction between the analyte and the titrateis very slow.
Hydrochloric acid is the acid present in our stomachs. Many of us are plagued with a conditioncalled heartburn. Heartburn is a result of acid reflux into the esophagus. Commercial antacids areeffective in neutralizing stomach acid. How effective an antacid may be is determined by theamount of acid neutralized. In this experiment you will make this determination. The mixing ofhydrochloric acid and a commercial antacid in an Erlenmeyer flask mimics what goes on in thestomach. The antacid is made up of active and inactive ingredients. The base component of the ant-acid is the active ingredient, calcium carbonate, sodium bicarbonate, and magnesium hydroxide arecommon examples:
2 HCl (aq) + CaCO3 (s) CaCl2 (aq) + H2O (l) + CO2 (g) (EQ 15.9)
A student places 100.00 mL of 0.1000 M HCl solution in a flask with a crushed antacid table andphenolphthalein indicator. After the reaction has gone to completion, he titrates the excess acidwith 0.1000 M NaOH solution. The initial reading of the buret is 0.40 mL. At the end point, the finalreading of the buret is 27.15 mL. The student wants to determine the number of H+ moles that wereneutralized by the antacid.
First, calculate the volume of base required to neutralize the acid.
(EQ 15.3)
Second, calculate how many moles of base were used to neutralize the acid.
(EQ 15.4)
Third, calculate the number of moles of acid neutralized by the added NaOH. Since this is amonoprotic acid it is a one-to-one reaction. Therefore, one mole of base neutralizes one mole ofacid.
(EQ 15.5)
Fourth, determine how many moles of acid were in the flask prior to titration.
(EQ 15.6)
Fifth, calculate number of moles of acid that the antacid tablet neutralized. The number neutralizedis the difference between the number that was added initially and that left over.
(EQ 15.7)
(EQ 15.8)
final volume initial volume– volume of base required to neutralize acid=27.15 mL 0.40 mL– 26.75 mL required to neutralize acid=
molarity of base L of base used to neutralize acid moles of base used=
0.02675 L 0.1000 mol NaOH1 L NaOH soln
-------------------------------------------- 0.002675 mol NaOH=
0.002675 mol NaOH 1 mol HCl1 mol NaOH------------------------------- 0.002675 mol HCl=
0.10000 L HCl 0.1000 mol HCl1 L HCl soln
--------------------------------------- 0.01000 mol HCl=
mol HCl before neutralization mol HCl neutralized by titration = mol HCl neutralized by antacid–
0.01000 mol HCl 0.002675 mol HCl– 0.007325 mol HCl = 0.00733 mol HCl neutralized=
15–136 Chemistry 141 Grossmont College

Introduction
HCl (aq) + NaHCO3 (s) NaCl (aq) + H2O (l) + CO2 (g) (EQ 15.10)
2 HCl (aq) + Mg(OH)2 (s) MgCl2 (aq) + 2 H2O (l) (EQ 15.11)
Once the antacid has exhausted its neutralizing capabilities there will be acid left in the flask. Youwill determine and compare the neutralizing capabilities of several commercial antacids. The moreeffective the antacid, the more moles of acid it can neutralize. You will titrate the solution with aknown concentration of base to figure out how many moles of acid are left in the flask after the ant-acid has been used up. This is an example of a back titration.
After gathering and analyzing your data, you will be able to do determine mass effectiveness:
(EQ 15.12)
and cost effectiveness of each antacid:
(EQ 15.13)
You will also determine the mass of base per tablet and compare it to the manufacturer’s values.Using this information you will determine the “best” antacid from the ones supplied.
mass effectivenes = mol HCl neutralized by antacidg antacid tablet
---------------------------------------------------------------------------
cost effectivenes = mol HCl neutralized by antacidcost of tablet
---------------------------------------------------------------------------
Chemistry 141 Grossmont College 15–137

Determining the Effectiveness of an Antacid
Procedure
Part A: Sodium Hydroxide Standardization1. In a beaker prepare about 400 mL of a 0.1 M sodium hydroxide solution from the pellets pro-
vided. Record the mass of the sodium hydroxide to as many decimal places as you can. Be sure to stir well.
2. Obtain a volumetric pipet and buret from the stockroom. Be sure to throughly clean and condi-tion them.
3. Carefully pipet 10.00 mL of the 1.00 M HCl into the Erlenmeyer flask. 4. Add an appropriate indicator, such as bromothymol blue, to your solution. 5. Fill the buret with the NaOH solution. Record the initial volume to 2 decimal places. 6. Titrate the HCl solution by adding the NaOH solution drop-wise to the flask that contains your
acid and the indicator. Gently swirl the flask while titrating. As you approach the end point, besure to rinse off the tip of the buret and the sides of the flask with deionized water. When yousee the indicator permanently change color that lasts at least 60 seconds, you have reached theend point.
7. Record the final volume of the base solution. 8. Repeat the procedure four more times. Your volume of base added should be within 0.05 mL of
each other.
Part B: Antacid Titration1. Obtain one tablet of antacid. Weigh the tablet and record the weight to the nearest 0.001 g.2. Crush the tablet with the mortar and pestle. 3. Add the crushed tablet quantitatively to an Erlenmeyer flask. Use a powder funnel or weigh
paper to transfer the powdered tablet to the flask and rinse the mortar, pestle, and funnel withseveral aliquots of DI water to be sure that all of the antacid has been transferred to the Erlen-meyer flask.
4. Obtain a volumetric pipet and buret from the stockroom. Be sure to throughly clean and condi-tion them. If you have not already done so.
5. Carefully pipet 10.00 mL of the 1.00 M HCl into the Erlenmeyer flask with the crushed tabletand swirl. Gently heat the mixture to help dissolve the tablet and any inert ingredients, whichmay be in the antacid.
6. If the tablet does not dissolve add an additional 10.00 mL of acid.7. Test with litmus paper. If still basic continue to add aliquots of HCl until the solution is acidic to
litmus. 8. Add an appropriate indicator, such as phenolphthalein, to your now acidic solution. 9. Obtain about 150 mL of NaOH in a beaker. Fill the buret with the NaOH solution. Record the
initial volume to 2 decimal places. 10. Titrate the antacid solution by adding the NaOH solution drop-wise to the flask that contains
your antacid and the indicator. Gently swirl the flask while titrating. As you approach the endpoint, be sure to rinse off the tip of the buret and the sides of the flask with deionized water.
NOTE: Notice how the numbers on the balance are increasing! Sodiumhydroxide is hygroscopic.
15–138 Chemistry 141 Grossmont College

Results and Calculations
When you see the indicator permanently change color that lasts at least 60 seconds, you havereached the end point.
11. Record the final volume of the base solution. 12. Repeat the procedure four more times, remembering to use the same brand of antacid. 13. Titrate with at least one other antacid or the number specified by your instructor.
Partner Variation1. Work with a partner and as a group titrate four different antacids and compare the antacids in
terms of effectiveness.
Results and Calculations1. Complete Table 15.2 to determined the concentration of the NaOH solution and the standard
deviation. 2. Complete Table 15.4 and Table 15.5 to analyze the antacid tablets. Be sure to show one calcula-
tion of each type. 3. What does your standard deviation tell you about your results?4. What does the percent deviation tell you about your results? 5. Identify the best antacid based on your analysis of your data.
Chemistry 141 Grossmont College 15–139

Determining the Effectiveness of an Antacid
SAMPLE
Report
Copy Table 15.3 , Table 15.3 , and Table 15.4 into your lab notebook to use during the experiment.Complete Table 15.2 , Table 15.4 , and use Table 15.5 to analyze your data.
.
.
TABLE 15.2 Standardization of NaOH Solution
Trial #1 Trial #2 Trial #3 Trial #4
Molarity of HCl solution
Volume of analyte
Initial buret reading
Final buret reading
Volume of titrant
Molarity of NaOH solution
Average Molarity of NaOH solution
Standard Deviation
TABLE 15.3 Reagent Data
Brand of antacidCost of antacid per tabletsAmount of base per tabletConcentration of HCl solutionConcentration of NaOH solution
TABLE 15.4 Antacid Back-Titration Data using Standardized NaOH Solution
Trial #1 Trial #2 Trial #3 Trial #4
Mass of flask
Mass of flask and tablet
Mass of tablet
Volume HCl added
Initial buret reading
Final buret reading
Volume of titrant
15–140 Chemistry 141 Grossmont College

Report
SAMPLE
.
TABLE 15.5 Antacid Analysis
Trial #1 Trial #2 Trial #3 Trial #4
Number of moles of HCl initially added
Number of mol NaOH from buretNumber of moles of base from tablet (i.e. moles of HCl neutralized by antacid tablet) Number of moles HCl neutralizedper gram tablet Average number moles of acid neutralized per tablet
Standard deviation Average number of moles neutralizedper gram tablet
Standard deviation
Cost of antacid per tablet
average moles of base/tablet
average mass of base/tablet
% deviation
average number of moles HCl neutralizedcost of tablet
----------------------------------------------------------------------------------------------------
Chemistry 141 Grossmont College 15–141

Determining the Effectiveness of an Antacid
15–142 Chemistry 141 Grossmont College
Post Lab Questions
Post Lab Questions1. Which of the antacid tablets analyzed by your lab section is the most cost effective?
2. Calcium dietary supplements are composed primarily of calcium carbonate which is also themain component of marble.
a. Briefly explain why calcium carbonate would be a good calcium ion source for thosesuffering from chronic heartburn.
b. Marble statues erode when exposed to acid rain. Give a brief explanation for this ero-sion; include a chemical equation.
3. How does the dye affect your titration? Propose some modifications that might be made to theprocedure if you are trying to analyze a pink colored tablet.
4. Carbonate functions as a buffer. Buffers are weak acids or bases, which are capable of mini-mizing pH changes. How might this affect the results of your titrations?
Chemistry 141 Grossmont College 15–143

Determining the Effectiveness of an Antacid
5. A student analyzed an antacid tablet from a bottle of 50 tablets purchased at a discount store for$1.00. The mass of the tablet was 1.470 g. After adding 25.00 mL of 0.7989 M HCl solution tothe tablet, the student back-titrated the excess HCl with 3.55 mL of 1.017 M NaOH solution.
a. Calculate the number of moles of stomach acid neutralized by one tablet.
b. Calculate the mass effectiveness of the tablet.
c. Calculate the cost effectiveness of one tablet.
15–144 Chemistry 141 Grossmont College

EXPERIMENT 16 Determination of Molar Mass by Freezing Point Depression
ObjectiveTo determine the molar mass of an unknown that is a nonelectrolyte and nonvolatile using freezingpoint depression of a known solvent and the freezing point depression, Kf, from experimental data.
IntroductionWhen a non-volatile substance is dissolved in a solvent, the vapor pressure of the solvent is low-ered. This affects the boiling and freezing temperatures of the solution by lowering the freezingpoint and elevating the boiling point relative to the pure solvent. Those properties that dependsolely on the number of solute particles (ions or molecules) and are not dependent on the propertiesof those particles are called colligative properties.
Can this freezing point depression or boiling point elevation be put to any practical use? Certainly!In this experiment you will use the freezing point depression to determine the molar mass of anunknown substance. You can also use this phenomena to raise the boiling point of the water thatcools your car. It is called antifreeze, but in San Diego there is little reason to be concerned aboutyour coolant freezing. Antifreeze depresses the freezing point and elevates the boiling point of thecoolant water in your radiator. This is important because as soon as the water in your radiator boilsit no longer is useful as a coolant.
Molality, m, is used to express the concentration of the solute. Remember, molality is the numberof moles of a solute dissolved in kilograms of solvent.
(EQ 16.1)
Freezing point depression is found by finding the difference in the freezing point of the pure sol-vent from that of the solution.
Tf = T°f pure solvent - T°f solution (EQ 16.2)
molality m moles of solutekg of solvent
------------------------------------= =
Chemistry 141 Grossmont College 16–145

Determination of Molar Mass by Freezing Point Depression
The relationship between the freezing point of solution and the freezing point of the pure solvent is:
(EQ 16.3)
It is important to note that this equation is for non-dissociating substances. You need to account forthe number of ions in solution for those substances that dissociate. For these compounds the totalnumber of ions must be accounted for.
(EQ 16.4)
In Equation 16.4, the van’t Hoff factor, i, represents the total number of ions produced in solutionper formula unit of salt. For example, i for CaCl2 is three; for each formula unit there are three ionspresent upon dissociation.
EXAMPLE 16.1
Analysis of -carotene, a dietary source of vitamin A, shows that itcontains 10.51% H and 89.49% C. Dissolving 0.0250 g of -carotene in1.50 g of camphor (Kf = 37.7 °C/m) gives a freezing point depression of1.17 C.
a. What is the molecular weight of -carotene?
Use Equation 16.3 to solve for the number of molality of solution.
(EQ 16.5)
Now, use the calculated molality to determine the number of moles ofsolute.
(EQ 16.6)
Remember, molar mass has units of g/mol. You know the number ofmoles of solute and the mass of the solute. The molar mass can now becalculated.
(EQ 16.7)
b. What is the molecular formula of -carotene?
(EQ 16.8)
(EQ 16.9)
Therefore, the molecular formula of -carotene is C40H56.
T f Kf m=
T f i Kf m=
m TiKf-------- 1.17C
1 37.7Cm----
--------------------------- 0.0310 mol -carotene
1000 g camphor---------------------------------------= = =
1.50 g camphor 0.0310 mol -carotene1000g camphor
--------------------------------------------------------- 4.66 5–10 mol -carotene=
0.0250 g -carotene4.66 5–10 mol -carotene---------------------------------------------------------------- 537g/mol=
537 gmol---------
89.49100
-------------
480.5613 gmol---------
12.011 gmol---------
-------------------------------- 40.01009908 40C= =
537 gmol---------
10.51100
-------------
56.4387 gmol---------
1.008 gmol---------
----------------------------- 55.99077381 56H= =
16–146 Chemistry 141 Grossmont College

Procedure
Procedure
Part I: Determining the Freezing Point of Pure Lauric AcidIn order to calculate the molar mass of the unknown solute in Part III, you will need to measure thefreezing point of the pure solvent.
1. Weigh a large test tube and add approximately 8 g of lauric acid. Re-weigh the test tube and itscontents.
2. Prepare a water bath by filling a 400 mL beaker with tap water and support the beaker on a ringclamp furnished with wire gauze. Heat the beaker of water with a Bunsen burner or hot plate tobetween 70-80 °C. Make sure that the water level remains above 200 mL in this beaker.
3. Fill a second beaker with room temperature tap water on your bench (20-25 °C). 4. Clamp the test tube containing the lauric acid to the ring stand and immerse it in the hot water.
After all the lauric acid has been liquefied wait an additional 2-3 minutes. The lauric acid willbegin to melt as soon as the water temperature is above its melting point. Be Cautious! Donot spill hot lauric acid on yourself or touch the bottom of the test tube.
5. Lower the test tube into the room temperature bath, add a stir bar and the thermistor. Makesure that the thermistor does not touch or become to close to the stir bar. Run thethermistor program until the liquid is solid and the stir bar stops moving. Your sample willbegin to freeze and the stirrer will no longer spin. Your curve may look something like thatillustrated in Figure 16.1. Make sure that you save your data to a flash drive.
FIGURE 16.1
While the sample is melting prepare the electronic interface to run an experi-ment collecting the temperature. Sample the temperature about once every two seconds.
Chemistry 141 Grossmont College 16–147

Determination of Molar Mass by Freezing Point Depression
Optional
6. Do not attempt to pull the probe out of the solidified sample (even a little) - thismight damage it. Use the hot water bath to re-melt the acid and gently remove the probewhen the sample liquefies. Repeat the experiment a second time.
7. Once finished re-melt the sample and remove the probe. Carefully wipe any excess sample fromthe probe with a tissue. Clean up any drips or spills in the hood and balance area. Save your datato a flash drive. Do not put the reagents down the sink! Be sure to remove the mag-netic stir bar before disposing of your chemicals. Dispose of chemicals asinstructed.
Part II: Measuring the Freezing Point for Lauric Acid/Water SolutionIn order to determine Kf for lauric acid, you need to also determine the freezing point for a solutionwith known concentration. You will use DI water as your known solute.
1. Add 1-2 drops of DI water to your test tube containing the lauric acid. Re-weigh the test tubeand contents.
2. Repeat steps 2-7 in Part I to determine the freezing point of this solution. Make sure that yousave your data to a flash drive.
Part III: Measuring the Freezing Point for Lauric Acid/Unknown Solute SolutionIn order to determine the molar mass of the unknown solute, the freezing point of the solution mustbe determined. In this manner the molar mass can be determined using the value for Kf and Tf. Anexample of this calculation is found in Example 16.1.
1. Discard the contents of the previous steps in the labeled waste container under the hood. Weighabout 1 gram of an unknown solute to the nearest 0.001 g.
2. Add this to a known amount of lauric acid. Once again, use approximately 8 grams of the sol-vent weighed to the nearest 0.001 g. Mix the solute and solvent using a mortar and pestle. If thetwo solids are not well mixed, the unknown acid will form a layer at the bottom of the test tubeand will not melt.
3. Repeat steps 2-7 in Part I to determine the freezing point of this solution. Make sure that yousave your data to a flash drive.
4. Dispose of your solution appropriately and make sure the balance area, reagent area and hoodsare clean.
Data Treatment1. Determine the freezing point for each run using the graphs. Make sure that you use appropriate
techniques to account for any supercooling (Your instructor will help you with this). Thereshould be a total of six experimental runs: 2 for the pure solvent, 2 for the known solute(optional), and 2 for the unknown solute. Average the two runs for each determination and usethose in subsequent calculations. Compare your freezing point for the pure solvent to that foundin the CRC Handbook. Calculate a percent error.
2. If Part II was completed, calculate Kf for lauric acid and compare it to the literature value bycalculating a percentage error. If Part II was not completed use the literature value of lauric acid(Kf = 3.90 °C/m) in your molar mass determination.
3. Calculate the molar mass of your unknown solute. Compare your molar mass to that of benzoicacid by calculating a percent error.
4. Create a table summarizing your major data.
16–148 Chemistry 141 Grossmont College

Post Lab Questions
Post Lab Questions1. A solution is prepared by dissolving 4.9 g sucrose (C12H22O11) in 175 g water. Calculate the
freezing point of this solution.
2. Is the freezing point of 0.01 m KF (aq) higher or lower than that of 0.01 M glucose (aq)? Explain.
3. The freezing point of t-butanol is 25.50 oC and Kf is 9.1 oC/m. Usually t-butanol absorbs wateron exposure to air. If the freezing point of a 10.0 g sample of t-butanol is 24.59 oC, how manygrams of water are present in the sample?
4. A 0.350 g sample of a large biomolecule was dissolved in 15.0 g of chloroform, and the freezingpoint depression was determined to be 0.240 oC. Calculate the molar mass of the biomolecule(Kf for chloroform is 4.70 oC/m).
5. In the winter of 1994, record low temperatures were registered throughout the United States.For example, in Champaign, Illinois, a record low of –29 oF was recorded. At this temperaturecan the salting of icy roads with calcium chloride be effective in melting the ice? Assume thatthe solubility of calcium chloride in cold water is 74.5 g per 100.0 grams of water.
Chemistry 141 Grossmont College 16–149

Determination of Molar Mass by Freezing Point Depression
6. The freezing point depression constants of the solvents cyclohexane and naphthalene are 20.1oC/m and 6.94 oC/m respectively. Which would give a more accurate determination by freezingpoint depression of the molar mass of a substance that is soluble in either solvent? Why?
7. A forensic chemist is given a white solid that is suspected of being pure cocaine (C17H21NO4,molar mass = 303.35 g/mol). She dissolves 1.22 ± 0.01 g of the solid in 15.60 ± 0.01 g benzene.The freezing point is lowered by 1.32 ± 0.04 oC.
a. What is the molar mass of the substance?
b. Assuming that the percent uncertainty in the calculated molar mass is the percent uncer-tainty in the temperature change, calculate the uncertainty in the molar mass.
c. Could the chemist unequivocally state that the substance is cocaine? For example, is theuncertainty small enough to distinguish cocaine from codeine (C18H21NO3, molar mass= 299.36 g/mol)?
d. Assuming that the absolute uncertainties in the measurements of temperature and massremain unchanged, how could the chemist improve the precision of her results?
16–150 Chemistry 141 Grossmont College

EXPERIMENT 17 Chemical Equilibrium and Le Châtelier's Principle
ObjectiveIn this experiment, you will study the equilibrium conditions of six different reactions. You willfirst establish the equilibrium by mixing the solutions provided for each reaction and then addreagents in order to perturb the established equilibrium. Each time that you cause a change in theequilibrium, you will observe the changes (look for evidence of reaction), write a net ionic equationillustrating the changes and then comment on how the reaction rate is affected, either the forward orreverse reaction rate. The goal is to learn how equilibria respond to changes in concentrations andchanges in temperature.
Introduction
Many chemical reactions are considered to be reversible, meaning that the reactants are not com-pletely converted into the products due to a competing reverse reaction. Consider the reaction:
A + B C + D (EQ 17.1)
The forward reaction is A + B C + D and the reverse reaction is C + D A + B. Both of thesereactions occur simultaneously as indicated by the double-headed arrow in the original reaction.The forward reaction occurs at some characteristic rate dependent upon the concentrations of thereactants and the temperature. The reverse reaction also occurs at some particular rate that is alsodependent upon concentrations and temperature. When the rate of the forward reaction is equal tothe rate of the reverse reaction, the system is said to be at equilibrium. At equilibrium, the productsreact at the same rate they are produced; thus the concentrations of the substances do not change.
Equilibrium Effects from Changes in ConcentrationLe Châtelier's Principle states that, for a system at equilibrium, if the conditions are changed, thesystem responds in such a manner to counteract the change. For example, in the reaction above, therate of forward reaction is increased when component A is added to the system. This results in a
Chemistry 141 Grossmont College 17–151

Chemical Equilibrium and Le Châtelier's Principle
Q 17.3)
decrease in the concentration of component B and an increase in the concentrations of C and D.This shows that the equilibrium has been shifted to the right.
Looking at the effect of changing the concentrations of any of the reactants or products we see that:
• An increase in the concentration of A or B will increase the rate of the forward reaction andshift the equilibrium to the right.
• An increase in the concentration of C or D will increase the rate of the reverse reaction and shiftthe equilibrium to the left.
• A decrease in the concentration of A or B will decrease the rate of the forward reaction and shiftthe equilibrium to the left.
• A decrease in the concentration of C or D will decrease the rate of the reverse reaction and shiftthe equilibrium to the right.
Equilibrium Effects from Changes in TemperatureTemperature changes can also affect the position of equilibrium. For the endothermic reactionshown here:
A + heat B (EQ 17.2)
a temperature increase would increase the rate of both reactions. However, the forward reactionrequires heat to proceed and an increase in temperature would provide this heat thereby increasingthe rate significantly. The reverse reaction generates heat and more available heat in the form ofincreased temperature does not significantly affect the rate. Thus, in this case, a temperatureincrease will shift the equilibrium to the right.
Stated another way: an endothermic reaction shifts to the right if the temperature of reaction isincreased. An exothermic reaction shifts to the left if the temperature of reaction is increased.
When studying chemical equilibria, one must observe a system, determine measurable indicationsof equilibrium shifts, and write chemical equations describing the shifts that are occurring. Follow-ing is a sample experiment.
Sample Write-Up
The following equilibrium can be established:
Reagents available to establish this equilibrium: 0.1 M NiCl2, 6 M NH3, 1 M NaCN, 12 M HCl
1. What is the equilibrium expression for Equation 17.3?
Answer: Equilibrium expression:
[Ni(NH3)6]2+(aq) + 4 CN–
(aq) [Ni(CN)4]2–(aq) + 6 NH3 (aq) (E
hexaamminenickel(II) ion
blue-violet
cyanide ion
colorless
tetracyanonickelate(II) ion
yellow
ammonia
colorless
KcNi CN 4
2 – N H 3 6
Ni N H 3 62 + C N –
4-------------------------------------------------------------=
17–152 Chemistry 141 Grossmont College

Sample Write-Up
2. What reaction will produce hexaamminenickel(II) complex ion, [Ni(NH3)6] 2+?
Answer: Mixing nickel(II) chloride, NiCl2, with ammonia, NH3, will generate the complex:a. Write the net ionic reaction taking place:
Answer: NiCl2 (aq) + 6 NH3 (aq) [Ni(NH3)6]2+(aq) + 2 Cl– (aq) (EQ 17.4)
Ni2+(aq) + 2 Cl– (aq) + 6 NH3 (aq) [Ni(NH3)6]2+
(aq) + 2 Cl– (aq) (EQ 17.5)
Ni2+(aq) + 6 NH3 (aq) [Ni(NH3)6]2+
(aq) (EQ 17.6)
3. Addition of what reagent will shift the equilibrium to the right?
Answer: Add 1 M sodium cyanide, NaCN.4. What do you observe?
Answer: Color changes from blue violet to yellow.5. What is the net ionic equation?
Answer: [Ni(NH3)6]2+(aq) + 4 CN-
(aq) [Ni(CN)4]2-
(aq) + 6 NH3 (aq) (EQ 17.7)
6. What is the reason for the shift?
Answer: The rate of the forward reaction has increased.7. If the sodium cyanide, NaCN, is used up, how else could the reaction be shifted to the right?
Answer: Add 12 M hydrochloric acid, HCl.8. What do you observe?
Answer: Color changes from blue violet to yellow.9. What is the net ionic equation?
Answer: NH3 (aq) + H+(aq) NH4
+(aq) (EQ 17.8)
10. What is the reason for the shift?
Answer: The rate of the reverse reaction has decreased.11. Addition of what reagent will shift the equilibrium to the left?
Answer: Add 6 M aqueous ammonia, NH3.12. What do you observe?
Answer: Color changes from yellow to blue violet.13. What is the net ionic equation?
Answer: [Ni(CN)4]2–(aq) + 6 NH3 (aq) [Ni(NH3)6]
2+(aq) + 4 CN–
(aq) (EQ 17.9)
14. What is the reason for the shift?
Answer: The rate of the reverse reaction has increased.
Chemistry 141 Grossmont College 17–153

Chemical Equilibrium and Le Châtelier's Principle
(EQ 17.10)
Equilibrium Experiment Demonstration
Your instructor will demonstrate how to manipulate the following equilibrium. Complete the ques-tions that follow.
Equilibrium established:
Reagents: 0.1 M CoCl2, 2 M HCl, 0.1 M AgNO3
1. Equilibrium expression:
2. Hexaaquacobalt(II) ion, [Co(H2O)6]2+, is produced by:3. The net ionic equation is:
4. The equilibrium will be shifted to the RIGHT by (Choose a reagent to add in order to shift equi-
librium):
5. Observation that suggests the equilibrium is shifted to the right: (Color change, gas formation,
temperature change, precipitate formation)
6. The net ionic equation is:
7. The reason for the shift: (Forward or reverse reaction speeds up or slows down)
8. The equilibrium will be shifted to the LEFT by: (Choose a reagent to add in order to shift equi-
librium)
9. Observation that suggests the equilibrium is shifted to the left: (Color change, gas formation,
temperature change, precipitate formation)
10. The net ionic equation is:
11. The reason for the shift::(Forward or reverse reaction speeds up or slows down)
12. Increasing the temperature will shift the equilibrium in which direction?
13. Observation that suggests the equilibrium is shifting: (Color change, gas formation, temperature
change, precipitate formation)
14. The reasons for the shift: (Forward or reverse reaction speeds up or slows down)
15. Is the reaction exothermic or endothermic?
16. The net ionic equation is:
[Co(H2O)6]2+(aq) + 4 Cl– (aq) [CoCl4]2–
(aq) + 6 H2O (l)hexaaquacobalt(II) ionpink
chloride ioncolorless
tetrachlorocobaltate(II) ionblue
watercolorless
17–154 Chemistry 141 Grossmont College

Procedure
SAMPLE
ProcedureThere are six reactions to study in this part of the experiment. For each reaction, select solutionsfrom the list of reagents to establish the equilibrium, that is, to produce ALL the species shownin the equilibrium equation.
Once you have established the equilibrium, manipulate the concentrations in order to shift the equi-librium first to the right and then to the left. Record your observations, verifying that the shift hasoccurred and write the ionic equations to illustrate what is happening on a molecular level. Indicatethe change in reaction rate (for the forward or reverse reaction) after each change that you induce inthe equilibrium.
Use small test tubes and minimal amounts of solutions; usually a few drops will suf-fice. Do not add more reagent than the minimum amount needed to change the equilibrium. If theconcentration of a reagent becomes too great, you may not be able to shift the equilibrium backagain, or, unexpected side reactions may occur. If you keep your solutions dilute, you should beable to shift the equilibrium back and forth with relative ease.
1. Reagents: 0.1 M K2Cr2O7, 1 M HCl, 1 M NaOH
a. Dichromate ion produced byb. Equilibrium shifted to the right byc. Observationd. Net Ionic Equatione. Reason for shiftf. Equilibrium shifted to the left byg. Observationh. Net Ionic Equationi. Reason for shift
2. Reagents: 0.1 M BaCl2, 0.1 M (NH4)2C2O4, 1 M HCl, 1 M NH3
a. Barium oxalate produced byb. Net Ionic Equationc. Equilibrium shifted to the right byd. Observatione. Net Ionic Equationf. Reason for shiftg. Equilibrium shifted to the left byh. Observationi. Net Ionic Equationj. Reason for shift
Cr2O72–
(aq) + H2O (l) 2 CrO4 2–(aq) + 2 H+
(aq) Kc = ? (EQ 17.11)
orange yellow
BaC2O4 (s) + H+(aq) Ba2+
(aq) + HC2O4–(aq) Kc = ? (EQ 17.12)
white
Chemistry 141 Grossmont College 17–155

Chemical Equilibrium and Le Châtelier's Principle
SAMPLE
3. Reagents: 0.1 M AgNO3, 6 M NaCl, 6 M NH3
a. Silver chloride produced byb. Net Ionic Equationc. Equilibrium shifted to the right byd. Observatione. Net Ionic Equationf. Reason for shiftg. Equilibrium shifted to the left byh. Observationi. Net Ionic Equationj. Reason for shift
4. Reagents: 0.01 M FeCl3, 0.01 M NH4SCN, 0.01 M HgCl2
Hint: A few drops of Hg2+(aq) removes SCN– ions from solution:
Hg2+(aq) + 4 SCN–
(aq) [Hg(SCN)4]2–(aq) (EQ 17.15)
tetrathiocyanatomercurate(II) ion
a. Hexathiocyanatoferrate(III) ion, [Fe(SCN)6]3- produced by
b. Net Ionic Equationc. Equilibrium shifted to the right byd. Observatione. Net Ionic Equationf. Reason for the shiftg. Equilibrium shifted to the left byh. Observationi. Net Ionic Equationj. Reason for the shift
AgCl (s) + 2 NH3 (aq) [Ag(NH3)2]+(aq) + Cl–(aq) Kc = ? (EQ 17.13)
white
diamminesilver(I) ion
[Fe(SCN)6]3–(aq) Fe3+
(aq) + 6 SCN–(aq) Kc = ? (EQ 17.14)
hexathiocyanatoferrate(III) ionred yellow
17–156 Chemistry 141 Grossmont College

Procedure
SAMPLE
5. Reagents: 0.1 M Cu(NO3)2, 1 M HCl, 1 M NH3
For reaction 5, there are two equilibria to consider:
a. Cu(OH)2 (s) produced by
b. Net Ionic Equationc. Equilibrium shifted to the left byd. Observatione. Net Ionic Equationf. Reason for shiftg. Equilibrium shifted to the right byh. Observationi. Net Ionic Equationj. Reason for the shift
2 H2O (l) + Cu 2+(aq) + 2 NH3 (aq) Cu(OH)2 (s) + 2 NH4
+(aq)
Kc = ?
(EQ 17.16)pale blue blue ppt
Cu(OH)2 (s) + 4 NH3 (aq) [Cu(NH3)4]2+(aq) + 2 OH–
(aq)
Kc = ?
(EQ 17.17)
blue ppt
tetraamminecopper(II) ion
deep blue
Be careful with the amount of reagent added. It is easy to make [Cu(NH3)4]2+ instead of Cu(OH)2!
Chemistry 141 Grossmont College 17–157

Chemical Equilibrium and Le Châtelier's Principle
SAMPLE
6. Reagents: NH4Cl (s), DI water, saturated NH4Cl (aq), 12 M HCl (aq)
NH4Cl (s) NH4+
(aq) + Cl–(aq) Kc = ? (EQ 17.18)
Hint: Be sure that the saturated ammonium chloride is saturated (i.e has solid ppt at the bottom ofthe reagent container). If not add ammonium chloride to your beaker until saturated.
a. Add about 0.5 g of ammonium chloride to a small test tube, which is about one-third fullwith DI water. After adding the solid stir and feel the bottom of the test tube to note anytemperature change. Record your observations in your lab book.
Is the solution of ammonium chloride exothermic or endothermic?
Write the net ionic equation, putting heat as a reactant or product.
b. To a second test tube add about 3.0 mL of saturated ammonium chloride.c. To this test tube, add 12 M hydrochloric acid (CAUTION!) drop wise until you see a
definite change. Record your observations of this change in your lab book.
Is the reaction shifted to right or the left?
Reason for shift.
Write the net ionic equation.
d. Put the resulting test tube into a hot water bath while stirring the mixture. Record yourobservations.
Is the reaction shifted to the right or the left?
Reason for shift.
Write the net ionic equation.
e. Put the test tube in ice water. Record your observations.
Is the reaction shifted to the right or the left?
Reason for the shift.
Write the net ionic equation.
17–158 Chemistry 141 Grossmont College
12-0071-168