GRID SIZE EFFECTS WITH SMEARED CRACKING IN …iri/publications/sm6.pdf · ELEMENT ANALYSIS OF...
132
GRID SIZE EFFECTS WITH SMEARED CRACKING IN FINITE ELEMENT ANALYSIS OF REINFORCED CONCRETE by Robert H. Dodds David Darwin Jerry L. Smith Linda D. Leibengood A Report on Research Sponsored By THE NATIONAL SCIENCE FOUNDATION Research Grant PFR 79-24696 UNIVERSITY OF KANSAS LAWRENCE, KANSAS August 1982
Transcript of GRID SIZE EFFECTS WITH SMEARED CRACKING IN …iri/publications/sm6.pdf · ELEMENT ANALYSIS OF...

GRID SIZE EFFECTS WITH SMEARED CRACKING IN FINITE
ELEMENT ANALYSIS OF REINFORCED CONCRETE
by
Robert H. Dodds
David Darwin
Jerry L. Smith
Linda D. Leibengood
A Report on Research Sponsored By
THE NATIONAL SCIENCE FOUNDATION
Research Grant
PFR 79-24696
UNIVERSITY OF KANSAS
LAWRENCE, KANSAS
August 1982


50272 JOl
REPORT DOCUMENTATION : l. REPORT NO. : 2. 3. Recipient's Accession No.
PAGE ! -NSF /CEE-82034 4. T\tle and Subtitle l 5. Report Date
Grid Size Effects \Hth Smeared Cracking In Finite Element
Analysis of Reinforced Concrete i '· I .. . ···--------·- ------ . -~-
7. Authogs) Dodds, D. Darwin, J. Smith, L. Leibengood : 8, Performing Organization Rept. No.
R. ~ . SH Report ~o. 6 9. Performing Organization Name and Address ~ 10. Project/Task/Work Unit No.
University of Kansas Center for Research, Inc. I I I.
2291 Irving Hill Drive, West Campus i .t.l. Contract(C) or Grant(G} No.
Kansas 66045 I
Lawrence, I {C)
I NSF PFR 79-24696 I (G)
12. Sponsoring Organization Name and Address i 13. Type of Report & Period Covered I
National Science Foundation [,.~--Washington D.C. 20550 ·-
I -15. Supplementary Notes
--·~---- .. ----- ~---- .. - ·-------------lt5, Abstract (L.imit: 200 words)
The effects of modeling parameters on the response of finite element repres en ta-
tions of reinforced concrete members are examined. Convergence of load-deflection curves and cracking patterns is studied. Nonlinear behavior is limited to cracking of the concrete and yielding of the reinforcement. The "smeared 11 crack representation is governed by a lind ting tensile stress criterion. Concrete is treated as linear elastic
in compression. Reinforcement has a bilinear stress-strain curve. Constant strain bar elements and rectangular isoparametric elements model the steel and the concrete,
respectively. Analyses are performed for flexural members with span-to-depth ratios
of 12-1, 5-1 and 2-1, under both a uniformly distributed load and a concentrated load at midspan, using a minimum of three variations in grid refinement. Load-deflection curves exhibit convergence with grid refinement. Concrete tensile strength has a negligible influence on response for the members studied. Load increment size affects the response only in unstable regions of the load-deflection curve and does not affect the stiffness or the past-yield response.
. 17. Document Analysis a. Desc:riptor5
cracking (fracturing), cracking patterns, concrete (reinforced), finite
load-deflection, structural engineering.
b. ldentifier5/0pen-Ended Terms
c. COSATI Field/Group
18. Availability Statement 19". Security Class (This Report)
Trnlimited Release Unlimited 20, Security Class (This Pagel
! Unlimited (5« ANSI Z39".1B) - See Instructions on Reverse
elements,
21. No. of Pages
-~
22. Price
OPTIONAL FORM 272 (4-77) (Formerly NTIS-35) Department of Commerce


i
ACKNOWLEDGMENTS
The initial phase of this work was performed by Mr. Jerry
Smith in partial fulfillment of the requirements for the Master of
Science degree. Ms. Linda Leibengood conducted the final computer
analyses and prepared the figures.
This research was supported by the National Science Foundation
under NSF Grant PFR 79-24696. Additional support was provided by the
University of Kansas General Research Allocation 3842-20-0038.
Numerical computations were performed on the Harris 500 com
puter system operated by the Computer Aided Engineering Laboratory at
the University of Kansas.


ii
TABLE OF CONTENTS
CHAPTER 1 INTRODUCTION .
1.1 General
1.2 Previous Work
1.3 Objective and Scope
CHAPTER 2 NUMERICAL PROCEDURES
2.1 General .
2.2 Nonlinear Material Models
2.3 Finite Elements ..
2.4 Solution Procedures
CHAPTER 3 RESULTS AND DISCUSSION
3.1 General ....
3.2 Beam Properties and Modeling Details.
3.3 Numerical Examples.
Page
1
1
5
12
14
14
14
17
19
23
23
24
27
3.4 Stiffness Characteristics of Cracked Elements 36
3.5 Effects of Load Increment Size.
3.6 Effects of Concrete Tensile Strength.
3.7 Concluding Remarks.
CHAPTER 4 SUMMARY AND CONCLUSIONS.
4.1 Summary
4.2 Conclusions
4.3 Recommendations for Further Study
REFERENCES .
APPENDIX A NOTATION.
44
49
50
54
54
55
59
61
117
iii
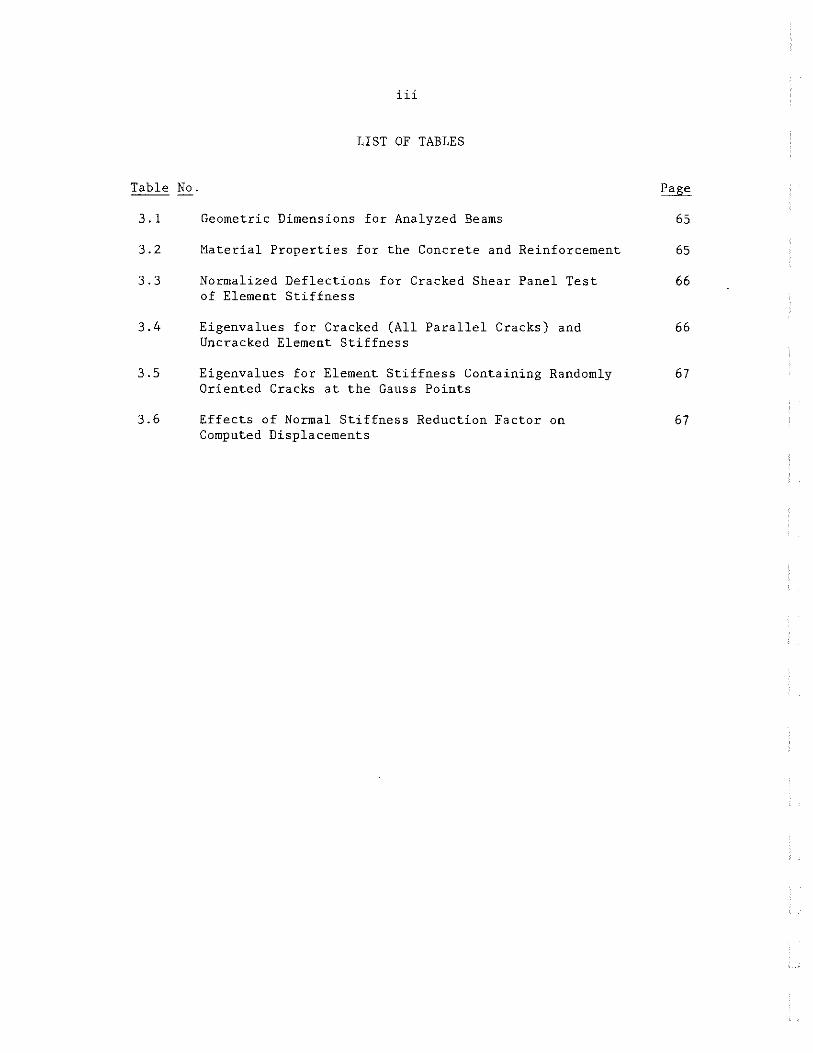
LIST OF TABLES
Table No.
3. 1 Geometric Dimensions for Analyzed Beams 65
3.2 Material Properties for the Concrete and Reinforcement 65
3.3 Normalized Deflections for Cracked Shear Panel Test 66 of Element Stiffness
3.4 Eigenvalues for Cracked (All Parallel Cracks) and 66 Uncracked Element Stiffness
3.5 Eigenvalues for Element Stiffness Containing Randomly 67 Oriented Cracks at the Gauss Points
3.6 Effects of Normal Stiffness Reduction Factor on 67 Computed Displacements

iv
LIST OF FIGURES
Figure No.
1.1
1.2
1.3
1.4
1.5
1.6
2.1
2.2
2.3
2.4
2.5
2.6
3.1
3.2
3.3
3.4
3.5
3.6
3.7
Finite Element Model for Reinforced Concrete Beam
Discrete Representation of a Single Crack
Discrete Crack Representation with Spring Elements to Model Aggregate Interlock
Discrete Crack Representation at Interior and Exterior Grid Points
Discrete Representation of Two Cracks
Interpretation of Smeared Crack Model
Bar Element for Reinforcement
Four Node, Linear Displacement Isoparametric Element
Eight Node, Quadratic Displacement Isoparametric ~lement
Gauss Point Locations for 2 x 2 Integration
Gauss Point Locations for 3 x 3 Integration
Single Degree of Freedom Representation of the Newton-Raphson Solution Procedure
Uniaxial Stress-Strain Curve for Reinforcing Steel
Qualitative Load-Deflection Response for All Span-to-Depth Ratios
Load-Deflection Curves for Slender Beam, Distributed Load, Linear Elements
Load-Deflection Curves for Slender Beam, Distributed Load, Quadratic Elements (Reduced Integration)
Crack Patterns for Slender Beam, Distributed Load, Linear Elements
Crack Patterns for Slender Beam, Distributed Load, Quadratic Elements (Reduced Integration)
Comparison of Load-Deflection Curves for Slender Beam, Distributed Load, Linear Elements and Quadratic Elements with Reduced Integration
68
68
69
69
70
70
71
71
71
72
72
73
74
75
76
77
78
79
80

3.8
3.9
3.10
3.11
3.12
3. 13
3.14
3.15
3.16
3.17
3.18
3.19
3.20
3.21
3.22
3.23
v
LIST OF FIGURES (continued)
Load-Deflection Curves for Slender Beam, Concentrated Load, Linear Elements
Load-Deflection Curves for Slender Beam, Concentrated Load, Quadratic Elements (Reduced Integration)
Crack Patterns for Slender Beam, Concentrated Load, Linear Elements
Crack Patterns for Slender Beam, Concentrated Load, Quadratic Elements (Reduced Integration)
Comparison of Load-Deflection Curves for Slender Beam, Concentrated Load, Linear Elements and Quadratic Elements with Reduced Integration
81
82
83
84
85
Load-Deflection Curves for Moderate Beam, Distributed Load, 86 Linear Elements
Load-Deflection Curves for Moderate Beam, Distributed Load, Quadratic Elements (Reduced Integration)
Crack Patterns for Moderate Beam, Distributed Load, Linear Elements
Crack Patterns for Moderate Beam, Distributed Load, Quadratic Elements (Reduced Integration)
Comparison of Load-Deflection Curves for Moderate Beam, Distributed Load, Linear Elements and Quadratic Elements with Reduced Integration
Load-Deflection Curves for Moderate Beam, Concentrated Load, Linear Elements
Load-Deflection Curves for tfoderate Beam, Concentrated Load, Quadratic Elements (Reduced Integ~ation)
Crack Patterns for Moderate Beam, Concentrated Load, Linear Elements
Crack Patterns for Moderate Beam, Concentrated Load, Quadratic Elements (Reduced Integration)
Comparison of Load-Deflection Curves for Moderate Beam, Concentrated Load, Linear Elements and Quadratic Elements with Reduced Integration
Load-Deflection Curves for Deep Beam, Distributed Load, Linear Elements
87
88
89
90
91
92
93
94
95
96

3.24
3.25
3.26
3.27
3.28
3.29
3.30
3.31
3.32
3.33
3.34
3.35
3.36
3.37
3.38
3.39
vi
LIST OF FIGURES (continued)
Load-Deflection Curves for Deep Beam, Distributed Load, Quadratic Elements (Reduced Integration)
Load-Deflection Curves for Deep Beam, Distributed Load, Quadratic Elements (Full Integration)
Crack Patterns for Deep Beam, Distributed Load, Linear Elements
Crack Patterns for Deep Beam, Distributed Load, Quadratic Elements (Full Integration)
Comparison of Load-Deflection Curves for Deep Beam, Distributed Load, Linear Elements and Quadratic Elements with Full Integration
Load-Deflection Curves for Deep Beam, Concentrated Load, Linear Elements
Load-Deflection Curves for Deep Beam, Concentrated Load, Quadratic Elements (Reduced Integration)
Crack Patterns for Deep Beam, Concentrated Load, Quadratic Elements (Reduced Integration)
Load-Deflection Curves for Deep Beam, Concentrated Load, Quadratic Elements (Reduced Integration), Mid-Span Only Deflection
Load-Deflection Curves for Deep Beam, Concentrated Load, Quadratic Elements (Full Integration)
Crack Patterns for Deep Beam, Concentrated Load, Linear Elements
Crack Patterns for Deep Beam, Concentrated Load, Quadratic Elements (Full Integration)
Comparison of Load-Deflection Curves for Deep Beam, Concentrated Load, Linear Elements and Quadratic Elements with Full Integration
Test Problem Geometry for the Determination of Cracked Element Stiffness Characteristics
Effects of Load Increment Size on Computed Load-Deflection Curves for the Deep Beam
Effects of Load Increment Size and Grid Refinement on Computed Load-Deflection Curves for the Deep Beam
97
98
99
100
101
102
103
104
105
106
107
108
109
110
111
112

3.40
3.4la
3.4lb
3.42
vii
LIST OF FIGURES (continued)
Crack Patterns for Load Increment Size Effects, Deep Beam, Concentrated Load, Linear Elements
Effect of Load Increment Size and Element Type on Load-Deflection Curves
Effect of Load Increment Size and Element Type Continued
Effect of Concrete Tensile Strength on Load-Deflection Curves
113
114
115
116
CHAPTER 1
INTRODUCTION
1. 1 General
The finite element method has been widely adopted for
predicting the response of structures loaded into the nonlinear region.
Successful application of this analysis tool requires the synthesis of
element types, material constitutive relationships, and solution methods
into a modeling scheme that incorporates the important nonlinear ef-
fects occurring in the actual structure. Structural analysts must also
balance the level of modeling detail with the computational effort re
quired for numerical solution. Overly detailed models, while capable of
accurately predicting nonlinear response, may be too expensive to imple
ment.
Reinforced concrete structures pose unique modeling problems
due to the number, type, and interaction of effects that contribute to
nonlinear response. Analysis procedures for structures such as shear
walls and beams must include nonlinearity arising from a number of
sources. These are: 1) yielding and strain hardening of reinforce-
ment, 2) degeneration of bond between concrete and reinforcement,
3) nonlinear response of concrete subjected to compression, and
4) cracking of concrete in tension.
The response of a reinforced concrete structure (or member)
can be examined at either the microscopic or the macroscopic level.
Microscopic analysis predicts the detailed stress distribution near

2 Introduction
cracks, bond stresses, and the propagation of individual cracks under
loading. A macroscopic analysis provides the strength and overall
deformation characteristics of the structure expressed in terms of load-
deflection curves and generalized cracking patterns. Modeling
procedures for the prediction of microscopic response may be unneces
sarily complex for macroscopic analysis and may not be justified due to
the large computational effort. A shear wall, for example, may develop
hundreds of cracks under loading; the detailed consideration of each in
dividual crack is clearly impractical and may be unnecessary for a
strength and deformation analysis. In contrast, the propagation of a
single crack in a large unreinforced concrete structure, such as a
gravity dam, may have disasterous consequences. A microscopic analysis
is both warranted and feasible for this type of structure, i.e., one for
which the propagation of a single crack dominates the response.
Recent microscopic response studies by Bazant and Cedolin
(4,5) have raised a serious question regarding the general applicability
of cracking models based on a simple limiting tensile stress criterion.
Tensile panels containing a predefined crack (Mode I) were analyzed
using a blunt band crack representation. The material stiffness normal
to the crack plane and the shear stiffness were reduced to zero for ele-
ments within a one element wide crack band. The load required to
propagate the predefined crack for plain concrete was shown to be
strongly dependent on the refinement of the finite element grid when the
limiting tensile strength criterion was used. Uniform refinement of the
element grid produced a sharper crack tip and rapidly increased the com
puted tensile stress in the element nearest to the crack tip. Predic-

Introduct_ion 3
tion of crack extension using the computed tensile stress ~as thus shown
to be highly dependent upon the finite element grid selected. However,
the energy release rate, G, associated with extension of the blunt crack
converged to a constant value with mesh refinement and was therefore
recommended as a more appropriate parameter to govern crack extension.
Similar computations for a reinforced panel predicted a constant energy
release rate but only following the introduction of a bond slip model
for the reinforcement traversing the crack plane.
Extrapolated to the analysis of common reinforced concrete
structures that develop numerous cracks, these microscopic studies imply
that load-deflection curves generated using a limited tensile stress
cracking criterion will not converge with increasing mesh refinement.
For such structures, cracks are most commonly incorporated in element
grids with either a 11 discrete 11 or a ''smeared" representation. The
discrete crack model allows element edges to uncouple thereby in
troducing a geometric discontinuity, with a strain concentration ahead
of each crack tip. The magnitude of the computed strain (stress) con
centration naturally depends on the degree of mesh refinement. In the
limit of mesh refinement, the discrete crack representation and the
blunt band crack representation are identical. The same sensitivity to
mesh refinement exhibited by the blunt band model should also be ex
pected with the discrete crack model. With the widely used "smeared"
crack representation, simple pointwise stress discontinuities within
elements simulate the loss of stiffness due to crack formation. Strain
fields within the elements and displacements across element boundaries
remain continuous> irrespective of grid refinement. For this reason,

4 Introduction
the smeared representation may be considered a macroscopic damage model
for cracked concrete.
The smeared crack representation and limiting tensile stress
criterion have been used extensively for the analysis of beams, plates,
shells, shear walls, etc. Good correlations with experimental load
deflection curves and crack patterns have been reported. This appears
to contradict implications of the microscopic crack extension studies.
The level of finite element mesh refinement used for beam, plate, and
shell models was generally based on engineering judgement within the
constraints of computer program capacity and funds available for the
analysis. Bazant and Cedolin (4) suggest that the correct predictions
of structural response in those studies were obtained by the fortuitous
selection of element dimensions relative to the aggregate si~e and con
crete tensile strength, and that more refined meshes would have
predicted divergent load-deflection curves. Clearly, grid refinement
has some effect on computed results as for all finite element analyses.
Yet, it is not obvious how grid refinement affects the computed response
when cracks are represented using the smeared model.
In view of these questions and with the continued widespread
use of smeared crack-tensile stress models, this study was conducted to
investigate the effect of a number of finite element modeling
parameters, including grid refinement, on the macroscopic, nonlinear
response of reinforced concrete structures.
Introduction 5
1.2 Previous Work
This section provides a brief summary of the major approaches
that are used to incorporate cracking in the finite element analysis of
reinforced concrete. Cracking models must address two problems:
1) material constitutive relationships that predict the formation and
possibly propagation of a crack, and 2) representation within the ele
ment mesh of the discontinuity introduced by the crack. Predictive
methods for crack formation have traditionally been based on a limiting
tensile stress or strain criterion and are collectively termed stress
controlled models. More recently, procedures to predict the propagation
of an existing crack have been developed following the principles of
linear elastic fracture mechanics.
Two methods are commonly employed to accommodate the crack in
a finite element grid. In the first method, termed "discrete cracking",
the boundaries between elements are permitted to separate, while
preserving geometric continuity within the elements. In the second
method, termed "smeared cracking'', element boundaries remain
geometrically continuous during deformation, with cracks introduced by
eliminating the material stiffness normal to the cracks at sampling
points within elements. The smeared crack representation therefore does
not introduce a direct geometric discontinuity in the mesh
stress discontinuity.
only a
The following sections describe the use of smeared and
discrete crack representations in conjunction with the stress controlled
and fracture mechanics based constitutive models. More detailed discus-

6 Introduction
sions can be found in Ref. (33).
1.2.1 Stress Controlled Models
The first finite element model for reinforced concrete was
developed by Ngo and Scordelis (25) to study local bond, concrete and
steel stresses along predefined cracks in beams (Fig. 1.1). Two nodes
were defined at each mesh point on element boundaries along the path of
each crack. A crack was formed by allowing separation of the nodal
points (Fig. 1.2). Ngo, Scordelis and Franklin (26) later used linkage
elements along the cracks to simulate aggregate interlock (Fig. 1.3).
Constant strain triangle elements were used to model the concrete in
these early studies.
Nilson (24) eliminated the necessity to predefine crack loca-
tions. An automated process was developed to introduce cracks between
elements. When the average tensile stress at the interface of two adja
cent elements exceeded the modulus of rupture, common nodes were discon
nected, thus introducing a crack. This scheme, in effect, propagated
the crack (either new or existing) by one element dimension and created
some degree of strain (and thus stress) concentration at the crack tip.
For elements at the exterior of the mesh, only common outside nodes were
disconnected. For interior cracks all common nodes were separated
(Fig. 1.4).
Mufti, et al., (21,22) further improved the discrete cracking
model by initially incorporating two separate nodes at each element con
nection point. The nodes were connected with a linkage element having
stiffness parallel and perpendicular to the crack. All possible crack
Introduction 7
locations were thus predefined. The stiffness of a linkage element per
pendicular to the crack was gradually decreased to zero as the tensile
stress exceeded the cracking strength. The linkage elements parallel to
a crack were used to simulate aggre,gate interlock. Al-Mahaidi (1) con
ducted a similar investigation but with two or four nodes connected by
linkage elements at one point. The four nodes allowed cracking in two
perpendicular directions (Fig. 1.5).
Despite their apparent simplicity, the discrete cracking
models have not been widely employed in analysis. Two major drawbacks
have existed for this approach: 1) crack paths are constrained to fol-
low predefined element boundaries, and 2) the solution procedure may be
inefficient. Each time a crack forms, a new node must be introduced to
uncouple the nodal degrees of freedom. This changes the mesh topology
and thus necessitates a regeneration of the structure stiffness and
triangulation. Addition of nodal points to model numerous cracks also
increases the bandwidth of the global stiffness matrix, thereby
quadratically increasing solution time. Recently, some progress has
been made in equation solving techniques that reduce these objections to
discrete cracking (30).
To help overcome early objections associated with the discrete
crack model, Rashid (27) introduced the 11 smeared crack model 11, in which
cracked concrete is represented as a linearly elastic, orthotropic
material. When the principal tensile stress (or strain) at a material
sampling point within an element exceeds the tensile strength, a crack
is formed by reducing the modulus of elasticity to zero in the direction
of the principal stress~ The tensile stress carried prior to cracking

8 Introduction
is then redistributed to surrounding elements. Subsequent stress
changes are related to strain increments in the cracked coordinate
system by the following constitutive matrix:
= 0 E 0 l 0 0 0
(1.1)
0 0 0
in which E is Young's modulus for concrete. a1
, a2
, c1
, and c2
are the
principal stresses and strains in the cracked coordinate system (direc-
tion 1 is perpendicular to the crack plane). The shear modulus is
reduced to zero upon crack formation in this early model.
Whereas the discrete crack model represents a single crack
with fixed direction, determined by element orientation, the orthotropic
constitutive relationship simulates many closely spaced (or smeared)
cracks near the sampling point, oriented perpendicular to the principal
tensile stress (Fig. 1.6). A consequence of incorporating the crack in
this manner is that no real geometric discontinuity develops in the
finite element grid as it does for the discrete crack representation.
Strain fields within the finite elements remain continuous functions of
the spatial coordinates.
The smeared model was used successfully by several in-
vestigators (7,8,19,34). However, the absence of shear stiffness along
the crack interface sometimes led to ill-conditioned stiffness matrices
once large areas of the structure cracked (17,31). To eliminate these
problems, later investigators (2,3,10,11,16,32) reinserted the shear
modulus, G, with a reduction factor, ~ (assigned a value between zero

Introduction 9
and one). In this case, the incremental) orthotropic constitutive
matrix becomes:
0 0 0
= 0 E 0 ( 1. 2)
0 0 ~G
Retention of a non-zero shear modulus, G, effectively places springs
parallel to the crack and simulates aggregate interlock and dowel ac-
tion. Fortunately, the particular choice of~ is not critical (16,17).
A value of 0.4 is normally adopted. The inclusion of some shear stiff-
ness alleviates the stiffness ill-conditioning problems and improves the
computed crack patterns.
Eq. (l.l) and (1.2) predict subsequent stress changes once a
crack forms. Techniques are also required to reduce the existing ten-
sile stress at crack formation. In the simplest of these, the tensile
stress normal to the crack is immediately reduced to zero. In other
methods, collectively termed 11 tension stiffening" (15,17,30,35), the
tensile stress is gradually reduced to zero through a descending branch
of the tensile stress-strain curve. Tension stiffening has improved
both numerical stability of the solution process and comparisons with
experimental results (15), but has not been universally adopted.
The smeared crack model offers two major advantages compared
with the discrete crack representation. First, no redefinition of the
element mesh topology is required during analysis. Significant reduc-
tions in computational effort are therefore realized. Secondly, the
smeared model eliminates the bias of predetermined crack orientations

10 Introduction
inherent in most discrete representations.
1.2.2 Fracture Mechanics Models
Because concrete in tension responds in a brittle manner, con-
siderable effort has been made to derive constitutive models based on
linear elastic fracture mechanics. These models predict the direction
in which a crack propagates and the load increase required to extend the
crack. Fracture mechanics models are applied as follows. With a known
crack geometry, a finite element analysis is performed to determine the
rate of energy release, G, that would occur for an increase in crack
length. When the energy release rate exceeds a critical value, G , the c
crack extends until G is again below the critical value, i.e., the
structure reaches another equilibrium configuration for the same applied
loading. During crack extension, the stresses in the previously un-
cracked material are redistributed to the reinforcement and to the con-
crete ahead of the crack. The major parameter in this process is the
critical value of the energy release rate. G is assumed to be a c
material property of concrete that is independent of the crack length,
loading, structure dimensions, etc.
Rostam and Bysckov (28), and Salah El-Din and El-Adawy Nassef
(29) effectively combined the discrete crack representation with frac-
ture mechanics constitutive models to compute moment versus crack length
relationships for singly reinforced beams. Crack propagation for these
Mode I (tension) type problems was modeled by incrementally releasing
constraints applied to nodes along the crack front. These studies used
constant strain triangle elements, not singularity type elements, to

Introduction 11
model the crack tip. Modeer (20) has also used the discrete crack ap
proach with constant strain triangles) but with crack propagation con
trolled by a crack opening displacement (COD) criterion. Both rein
forced and unreinforced beams were considered with a stress controlled
criterion to initiate cracks. These studies considered members con-
taining only one crack and did not attempt to accurately model the
strain singularity ahead of the crack tip. More recently, Saouma (30)
developed a procedure to follow the propagation of combined tlode I and
Mode II (shear) cracks in beams and shear panels. An automated computer
procedure was devised to construct new element meshes (containing spe
cial singularity elements) each time one or more cracks extended. Crack
propagation occurred when G reached a critical value, with the crack ex
tending in the direction of maximum calculated G. Specialized solution
algorithms were also developed to minimize the impact of new nodes and
elements incorporated in the mesh. Saouma's work is notable as combined
Mode I (tension) and Mode II (shear) cracks were allowed, without the
necessity to predefine crack paths.
A combination of the computationally more efficient smeared
crack representation and a fracture mechanics constitutive model is
presented by Bazant and Cedolin (4,5). A single crack is modeled by a
one element wide Hband" of quadrilaterals composed of constant strain
triangles. When the energy release rate (computed using a scheme to ac
count for reinforcement bond slip) exceeds the critical value, the ten
sile and shear stiffness in the crack tip element is reduced to zero,
thus affecting a crack extension equal to the dimension of one element.
Bazant and Cedolin (4) showed that the computed energy release rate con-

12 Introduction
verges to a constant value with increasing mesh refinement, while cor
responding stress estimates at the crack tip increase without bound.
Therefore, they argue that the stress controlled constitutive model is
not objective, since the degree of mesh refinement employed near the tip
directly controls the predicted tensile stress.
1.3 Objective and Scope
This report examines the effects of finite element modeling
parameters on the nonlinear strength and deformation response of rein
forced concrete members due to cracking. Convergence properties of the
macroscopic measures of response, including load-deflection curves and
general cracking patterns, are of primary interest. Acceptable finite
element models must generate convergent load-deflection curves for in
creasing grid refinement.
Nonlinearity is limited to cracking of the concrete and
yielding of the reinforcement. Crack formation is governed by a
limiting tensile stress criterion. A ''smeared'' representation is used
to incorporate cracks in the finite element mesh. Since the major em
phasis of the study concerns nonlinearity due to cracking, the concrete
is treated as a linear elastic material in compression. While this as
sumption simplifies the parametric study of cracking, it precludes the
comparison of computed solutions with experimental results. The rein
forcement stress-strain curve is linear elastic with linear strain
hardening after yield. Constant strain bar elements are used to model
the reinforcement.

Introduction 13
Finite element analyses are performed for slender, moderate,
and deep beams, with respective span-to-depth ratios of 12 to 1, 5 to
1, and 2 to 1. Each beam is analyzed for a uniformly distributed load
and a midspan, concentrated load using a minimum of three variations in
grid refinement. Both the four node (linear) and eight node (quadratic)
isoparametric elements are employed to model concrete portions of the
members.
Additional analyses are conducted for the shear critical deep
beam (2;1 aspect ratio) to assess the influence of concrete tensile
strength and loading increment size on the solutions. Separate analyses
of the deep beam are also performed to study the effect of numerical in
tegration order for models constructed with the quadratic element.

14 Numerical Procedures
CHAPTER 2
NUMERICAL PROCEDURES
2. 1 General
This chapter describes the major components of the analytical
model and the solution procedures adopted in this study. Items
specifically addressed include: 1) material constitutive relationships
selected to model concrete and reinforcement, 2) finite element for-
mulations for modeling concrete and reinforcement, and 3) relevant
aspects of the iterative process used to solve the resulting nonlinear
equilibrium equations. The formulations and procedures described are
incorporated in the POLO-FINITE (12,13,18) system, which was used to ob-
tain the numerical results presented in Chapter 3.
2.2 Nonlinear Material Models
2.2.1 Concrete
Cracking under tensile stress is the only nonlinear behavior
of concrete modeled. A "crack" is formed when the computed tensile
stress exceeds the tensile strength, f' Cracks are incorporated in the t"
finite element mesh using the smeared representation. Concrete is as-
sumed to respond linearly for all levels of compressive stress.
Prior to cracking, concrete is modeled as a linearly elastic,
isotropic material in a state of plane stress. The incremental stress-
strain relationship prior to any cracking is:

Numerical Procedures
= E
2 1 - v
1
v
0
15
v 0
1 0 (2. 1)
0 (1 - v)/2
Initially, all stress-strain sampling points are assumed to be
uncracked. At each loading stage, strain increments are converted to
elastic stress increments using Eq. (2.1). The accumulated total
stresses are rotated to principal axes, and the maximum tensile stress
is compared to the tensile strength of the concrete. If the computed
stress exceeds the tensile strength, a crack is introduced by setting
the total stress to zero in the corresponding direction. Concrete at
the point is thereafter modeled as an elastic, orthotropic material with
material directions fixed parallel and normal to the crack. The in-
cremental stress-strain relationship becomes:
aE 0 0
= 0 E 0 (2.2)
0 0 tlG
in which subscripts 1 and 2 refer to material axes (direction 1 is nor-
mal to the first crack). The shear modulus, G, = O.SE/(1+v). All sub-
sequent stress computations are performed by transforming strain incre-
ments to the 1-2 material directions and then applying Eq. (2.2). The
resultant stress increments are added to previous stresses in the 1-2
system, followed by a rotation of the new total stresses to the global
coordinate axes. The normal stiffness reduction factor, a, is a
numerical device that may improve the stability of the equilibrium equa-

16 Numerical Procedures
tions by retaining a very small stiffness normal to the crack. Unless
otherwise noted> a zero value for a is employed in this study. Wilen
used, ·typical values of a range from 10-3 to 10-6
. Retention of a non-
zero shear stress-strain term in Eq. (2.2) simulates aggregate interlock
by allowing the concrete to develop additional shear stress along the
crack. A constant value of 0.4 for the shear stiffness reduction fac-
tor, ~' is used in this study. No attempt is made to gradually reduce
~ with increasing crack width. No provisions are included to model
crack closure.
Eq. (2.2) implies that no Poisson effect exists between stress
increments in the 1-2 material directions once a crack forms. However,
at the instant of crack formation, the stress a2
parallel to the crack
contains a Poisson coupling term with direction 1 due to the isotropic
constitutive relationship in effect prior to cracking. The loss of
Poisson coupling at the instant of cracking lets the concrete "rebound"
along direction 2. 2
Stress a2
changes by the amount -v£1E/(l-v ). This
effect may be included or neglected in the cracking material model.
When included, cr2
becomes simply E£2
immediately after cracking. A
number of preliminary analyses were conducted to determine the effects
of Poisson coupling. Computed load-deflection curves and general crack
patterns with and without "rebound" showed no detectable differences.
This result might be anticipated considering the very small value of e1
when the tensile stress exceeds f~. The "reboundu effect was neglected
in this study.
Numerical Procedures 17
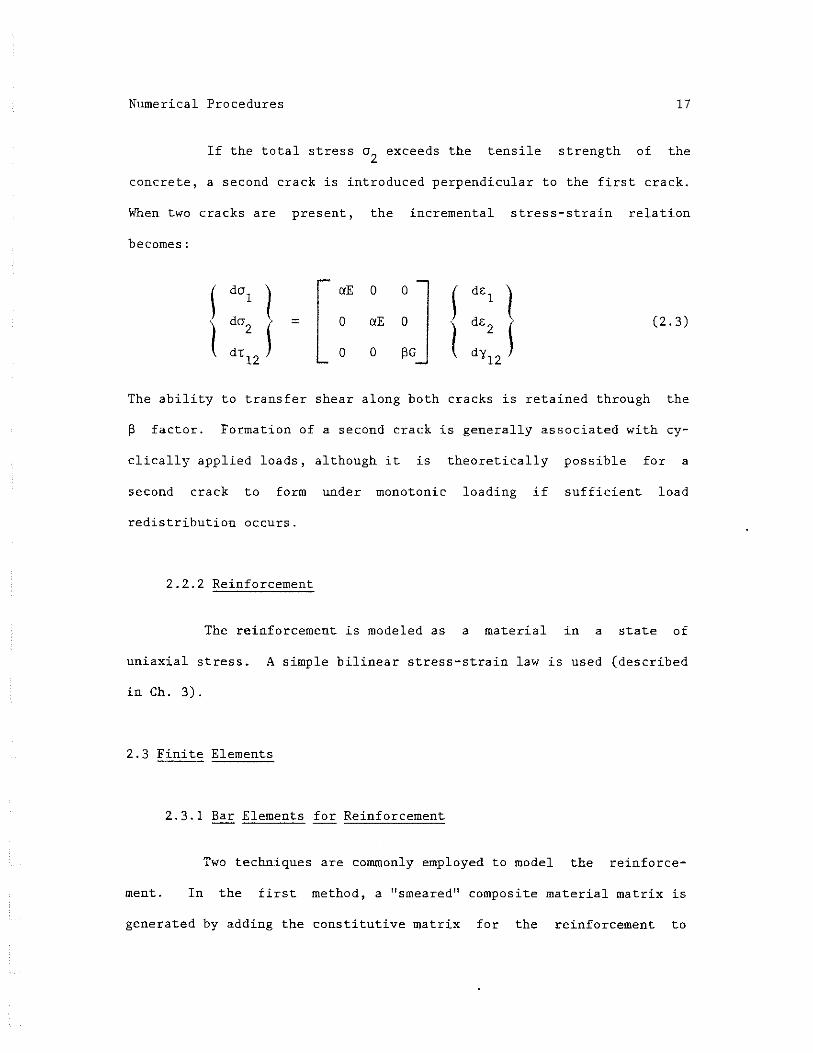
If the total stress a2
exceeds the tensile strength of the
concrete, a second crack is introduced perpendicular to the first crack.
When two cracks are present, the inCremental stress-strain relation
becomes:
I da1 l
aE 0 0 I d£1
da2
= 0 aE 0 "' l (2.3)
{ { dtl2 0 0 ~G d)' 12
The ability to transfer shear along both cracks is retained through the
~ factor. Formation of a second crack is generally associated with cy-
clically applied loads, although it is theoretically possible for a
second crack to form under monotonic loading if sufficient load
redistribution occurs.
2.2.2 Reinforcement
The reinforcement is modeled as a material in a state of
uniaxial stress. A simple bilinear stress-strain law is used (described
inCh. 3).
2.3 Finite Elements
2.3.1 Bar Elements for Reinforcement
Two techniques are commonly employed to model the reinforce-
ment. In the first method, a 11 smeared11 composite material matrix is
generated by adding the constitutive matrix for the reinforcement to

18 Numerical Procedures
that of the concrete in volumetric proportions. A single, 2-D finite
element may then model both the concrete and the reinforcement. This
approach is particularly convenient when the reinforcement is not paral
lel to the element edges.
In the second approach, termed the "discrete11 model, separate
finite elements are utilized for the concrete and the reinforcement.
Simple constant strain bar elements are adequate to represent the rein-
forcement. These elements have two nodes, each with a single axial
degree of freedom (Fig. 2.1). The discrete reinforcement model is
adopted in this study due to its simplicity and availability in the com
puter code.
2.3.2 Isoparametric Elements
Numerically integrated finite elements, based on the
isoparametric formulation, are used to represent the concrete.
Isoparametric elements have several advantages compared to simple con
stant strain triangular elements. Substantially more accurate solutions
are obtained with fewer elements, thus reducing input and computational
effort. Isoparametric elements generally distribute residual forces oc-
curring in nonlinear analysis over a larger portion of the model. This
may reduce the number of corrective iterations required. The Gauss
points in isoparametric elements have proven to be optimal locations for
the calculation of strains and stresses. For 2-D linear analysis, Nayak
(23) presents computational evidence indicating that a linear displace
ment (4 node) isoparametric element is approximately equivalent to eight
constant strain triangles. Similarly, the quadratic displacement (8

Numerical Procedures 19
node) isoparametric element is approximately equivalent to sixteen
triangular elements.
Both the four node and eight node isoparametric elements (Fig.
2.2 and 2.3) are used in this investigation. Complete details of the
element formulation are given in Ref. (37).
Isoparametric element stiffnesses are calculated using the
standard Gauss numerical integration procedure. A four point (2x2)
Gauss quadrature rule (Fig. 2.4) exactly integrates the four node ele
ment stiffness in linear analysis. Both the four point and nine point
(3x3, Fig. 2.5) integration rules are considered for the eight node ele
ment. The four point rule comprises "reduced" integration for the eight
node element. Reduced integration saves considerable computational ef
fort compared to the 3x3 rule and has been extensively employed in non
linear plasticity analyses (23). The 3x3 rule exactly integrates the
eight node element stiffness in linear analysis.
2.4 Solution Procedures
When cracking of the concrete and yielding of the reinforce
ment are considered, the finite element method produces a nonlinear set
of equilibrium equations. However, the load path dependent nature of
cracking precludes generation of the equation coefficients for an ar
bitrarily specified load level. Therefore, structural response is com
puted by applying the total load in a sequence of incremental load
steps. Within each step, the nonlinear equilibrium equations are
linearized using a tangent stiffness approach. These equations are
solved to determine approximate increments of the nodal displacements.
20 Numerical Procedures
Residual or 11unbalanced" forces develop since the linearized displace
ment increments do not satisfy the nonlinear equilibrium equations. The
true equilibrium configuration at each load step is found by iteratively
correcting the displacements with small changes arising from application
of the residual forces. The procedure continues until residual force
components vanish within some prescribed tolerance. Although the solu
tion method is incremental, the iterative process employed in this study
considers total equilibrium conditions for the structure to compute
residual forces. No errors accumulate from one step to the next with
this solution method.
Variations of this solution procedure, known as the Newton
Raphson method, are widely used for nonlinear finite element analysis.
Fig. 2.6 illustrates the basic process for a single degree of freedom
system. With the Newton-Raphson method, the analyst has several options
to control the solution process. In this investigation, the incremental
(tangent) stiffness is updated before each load step and before each
equilibrium iteration. Frequent updating of the tangent stiffness
produces a more accurate distribution of residual forces, accelerates
the convergence rate, and reduces the number of iterations required for
a load step. Cedolin and dei Poli (6) studied the solution convergence
rates for various modifications of the Newton-Raphson method applied to
cracking problems. Stiffness updating before each iteration was found
to yield the best convergence rate, and in some cases, the use of any
other scheme resulted in a non-convergent or very slowly convergent
solution.

Numerical Procedures 21
The following outline summarizes the major computational
phases necessary to analyze the structure for each load step.
1) Compute the incremental equivalent nodal loads, {~], cor-
responding to the increment of applied load defined for the step. Set
the residual nodal loads equal to the applied load increment,
{R] = {~], for the first iteration of a load step.
2) Update the total nodal loads applied to the structure through
the current step, {PNEWJ = {POLDJ + {~], to reflect the new loading
increment.
3) Generate the incremental (tangent) constitutive relation, [DT]'
for all concrete and reinforcement elements using the current stresses,
strains, and loading history.
4) Using the updated [DT] matrices, recompute the stiffness
matrices for newly cracked elements and assemble the new structure tan-
gent stiffness matrix, [KT]. Triangulate the new tangent stiffness.
5) Solve for the increment of nodal displacements using the
triangulated stiffness. Update the total nodal
displacements, {UNEW} = {uowl + {t.U}.
6) Compute increments of strain at Gauss points within each ele-
ment. Update the total strains at each Gauss point.
7) Update stresses at each Gauss point given previous strains,
stresses, and loading history (number of cracks and crack angles). New
total stresses at each Gauss point result from these computations.
B) Evaluate the nodal forces required to maintain each element in
its deformed configuration, {IF]. These are given by (IF] =
T fv [B] (cr} dv. Assemble these into a nodal vector for the structure,

22 Numerical Procedures
{IF S] .
9) Compute the structure residual nodal load vector as {R] =
10) Apply convergence tests to determine the level of residual
loads remaining. If the convergence tests are satisfied, go to (1) and
begin processing the next load step; otherwise go to (3) and begin the
next iteration.
The two convergence tests used to terminate the iterative
solution process are:
II{Rlll <
HAX I{Ri]l o.o3 ,, II{&] II (2. 4)
< o. 02 ,, II {LlP J II (2.5)
where {R] is the residual load vector and {LlP] is the applied incremen-
tal load vector. The first test, Eq. (2.4), compares Euclidean norms
(square root of the sum of the squares) of the residual load and applied
load vectors and represents an average measure of equilibrium. The
second test, Eq. (2.5), detects any highly localized residual loads that
could be missed by a vector norm computation. Both tests must be satis-
fied for acceptance of a solution. These convergence tests force the
equilibrium iterations to continue until no further cracks develop for
the applied load increment.

Results and Discussion 23
3.1 General
CHAPTER 3
RESULTS AND DISCUSSION
A parametric study of nonlinear simple beam responses was con
ducted using the solution and modeling procedures described in the
previous chapter. Three span-to-depth ratios of 12:1, 5:1, and 2:1 were
considered. These span-to-depth ratios cover beam responses ranging
from those dominated primarily by flexure (12:1) to those controlled by
shear (2:1). In subsequent discussions, these geometries are referred
to as the slender beam (12:1), the moderate beam (5:1), and the deep
beam (2:1). Analyses were conducted for a uniformly distributed load
applied across the top surface of the beam and for a single concentrated
load applied on the top surface at midspan.
Analyses were also performed to assess the influence of
smeared cracks on the stiffness characteristics and convergence proper-
ties of the four and eight node isoparametric elements. Difficulties
arising from the development of zero-energy modes in cracked eight node
elements were explored. Additional analyses were conducted to in-
vestigate the effect of loading increment size on the path dependent
formation of cracks.
This chapter presents a detailed description of the problems
selected for the parametric study, the numerical results obtained, and a
discussion of the findings.
24 Results and Discussion
3.2 Beam Properties and Modeling Details
All beams analyzed were 7 inches thick, 15 inches deep and
simply supported at each end. Span lengths of 180, 75, and 30 inches
for the slender, moderate, and deep beams provided the span-to-depth
ratios desired. A concrete elastic modulus of 3,600 ksi and a rein-
forcing steel modulus of 29,000 ksi were used. A reinforcing steel
yield point of 60 ksi was selected, with linear strain hardening at a
slope of 5% of the elastic modulus (Fig. 3.1). All beams were singly
reinforced with a reinforcing ratio of 1.5% (1.6 sq.in.). No shear
reinforcement was provided. A limiting tensile strength (f') t
of
400 psi was used to predict cracking in the model. Several analyses
were also performed for the deep beam to assess the influence of tensile
strength on the response of shear critical members. A 10 psi tensile
strength was employed to approximate a zero strength condition for these
analyses (a tensile strength of zero leads to numerical difficulties in
the finite element solution, as extensive cracking occurs at a very
small load) . Tables 3.1 and 3.2 summarize the beam dimensions and
material properties:
To eliminate possible effects of the finite element shape,
square elements were used whenever the geometry permitted. In those few
cases which required rectangular elements to be used, the rectangular
elements were placed immediately above the simple support.
The slender and moderate beams were analyzed using 1, 2, and 5
elements through the 15 in. depth. For the deep beam, grids were
analyzed with up to 20 elements through the depth.

Results and Discussion 25
Early in this study, it was found that placement of concrete
elements below the reinforcement (modeled with bar elements) produced
numerical problems during solution when the normal stiffness reduction
factor, a in Eq. 2.3, was assigned a zero value. In the high moment re
gions, elements below the reinforcement develop a near vertical crack at
each Gauss integration point. When a perfectly vertical crack develops
at each point in an element, a complete l~ss of stiffness occurs in the
horizontal direction. In solutions for the beam problems, exactly ver
tical cracks do not form in an element due to small shear stresses
present below the bar elements. However, the single precision arith
metic (48 bit word) employed for the computations was insufficient to
detect these small differences in crack orientation, and a singular or
near singular stiffness resulted at the adjacent bottom nodes. The
situation was remedied by eliminating the layer of concrete elements
below the reinforcement, which produced a very slight decrease in the
initial cracking loads. Alternatively, a very small value for the nor
mal stiffness reduction factor could have been retained to prevent the
numerical problems.
When connected, the eight node isoparametric element and the
tWo node constant strain bar element do not maintain interelement
displacement compatibility. Models in this study were constructed with
two rod elements for each eight node element at the level of the rein
forcement, i.e., a bar element connected a corner and a mid-side node.
To determine the error introduced by the displacement incompatibility,
several analyses were performed for the deep beam meshes. Models were
constructed with a single bar element connecting the quadratic element

26 Results and Discussion
corner nodes. The mid-side node displacements of the quadratic element
were constrained to be the average of the adjacent corner node displace
ments, thus re-establishing displacement compatibility with the bar ele-
ment. Comparison of solutions with and without displacement com-
patibility revealed negligible differences in the load-deflection
curves.
Uniformly distributed loads were modeled using energy equiva
lent forces applied to the nodes along the top surface. The concen
trated loading was modeled by a single force applied to the midspan top
surface node. Symmetry of the loads and constraints about mid-span per
mitted the use of only one half of the beam in the finite element
models. Horizontal constraints imposed on all midspan nodes enforced
the symmetry boundary condition. The simple support was modeled by a
vertical constraint imposed at the bottom edge node.
A deflection measure was developed to minimize the effect of
localized deformation at the simple support and under the concentrated
load. For the purpose of comparison, deflections were computed by sub
tracting the mid-depth deflection over the support from the mid-depth
deflection at center span. These values are termed umid-depth deflec
tions" on all load-deflection curves. If a node did not fall at mid
depth, the average displacement for the two nodes on each side of mid
depth was used.
Loads were applied to the finite element models in a sequence
of increments or steps. Initially, load step sizes were estimated using
theoretical predictions of the loads corresponding to first cracking and
yielding. During subsequent analyses, load step sizes were selected to

Results and Discussion 27
provide an adequate description of the load-deflection curves. Variable
size load increments were used in each case to obtain a better resolu
tion 6f the load-deflection curves near loading levels at which exten
sive cracking or yielding occurred. Load-displacement curves presented
in this chapter show the individual load steps for each analysis. Sec-
tion 3.5 examines the sensitivity of computed displacements and cracking
patterns to the selected load increment size.
The qualitative load-deflection response for all beams is il
lustrated in Fig. 3.2. Four distinct regions may be identified in this
figure. For discussion, these regions are denoted: l) elastic pre
cracking, 2) cracking prior to yield of the reinforcement, 3) rounded
knee that develops at initial yielding, and 4) post-reinforcement yield
and strain hardening with little additiona~ cracking. The unlimited
strain hardening, coupled with the elastic model for concrete in com
pression, permits the load to increase almost linearly with displacement
once significant yielding occurs. Therefore, no limit loads are at
tainable with this model.
3.3 Numerical Examples
3.3.1 Slender Beam
Analyses were conducted for the slender beam (12:1 span-to
depth ratio) considering both distributed and concentrated loading for
1, 2, and 5 elements through the depth. A 2 x 2 integration order was
used for both the linear and quadratic elements. Load-deflection curves
and crack patterns for the uniform load case are shown in Figs. 3.3-3.7.

28 Results and Discussion
The linear element grids become more flexible as the number of elements
through the depth increases; the quadratic element grids, however,
become progressively stiffer with grid refinement. As will be discussed
in Section 3.4, this unusual trend can be traced to the development of
zero energy deformation modes in cracked quadratic elements that are
evaluated with a reduced (2x2) integration order. The computed load-
displacement responses for both element types rapidly converge to a com
mon solution, as shown in Fig. 3.7, and appear to provide an upper and
lower bound strength predict~on.
Several analyses were performed using fully (3x3) integrated
quadratic element grids. Load-deflection curves were found to coincide
exactly with those for the four node element and are therefore not shown
on the figures.
The quadratic element solution for one element through the
depth (Fig. 3.4) shows the greatest departure from the other five solu-
tions obtained for this problem. This solution predicts initial
yielding of the reinforcement at approximately 80% of the load obtained
in other solutions. Similar behavior is also observed for the concen
trated load case (Fig. 3.9). The coarse grid is stiffer than the finer
grids before cracking; but once cracks develop, the region affected is
larger than for the finer grids which results in a significant loss of
stiffness. The stiffness loss apparently increases the strain in the
reinforcement, which causes the lower yield load.
The extensive vertical cracks in the uniformly loaded beam
(Figs. 3.5 and 3.6) clearly indicate the flexural nature of the
response. Crack orientations in the linear element grids are erratic

Results and Discussion 29
until a grid with five elements through the depth is used. The
inability of the linear element to accurately model the shear stress
distribution leads to the alternating crack directions. The eight node
element, even for the coarse grid, produces realistic crack orientations
due to the improved shear stress representation. Fine grids for both
element types show the influence of the simple support reaction. The
region of inclined cracks due to high shear stress extends approximately
twice the beam depth from the support.
The extent of cracking through the beam depth is an important
aspect of the crack patterns. For the linear element, coarse grids (1
element through the depth) develop cracks at all Gauss points, whereas
the intermediate and fine grids have one or more layers of completely
uncracked points above mid-depth. In the coarse grids, both the shear
force and the compression force of the couple providing the internal
resisting moment must be transferred by a completely cracked, and thus
more flexible, element.
Crack patterns for the fine meshes (5 through the depth) ex
hibit gaps near the neutral axis-- several uncracked or partially
cracked elements are surrounded by totally uncracked elements. The ap
pearance of ttgaps 11 in the cracking pattern has been termed 11 Strain
localization" by other investigators (5). Almost no partial cracking
occurs within linear elements (Fig. 3.5). All Gauss points within an
element are either cracked or uncracked, with the resulting longitudinal
saw-tooth crack pattern near the neutral axis. In contrast, many
quadratic elements have only one or two cracked Gauss points (Fig. 3.6).
This difference may be attributed to the mid-side node of the quadratic

30 Results and Discussion
element which provides considerably more freedom for deformation once
cracks form. The displacements of a mid-side node relative to those of
the corresponding corner nodes and the linear strain variation within
the element permit a crack at one Gauss point to .. relieve 11 stresses at
adjacent points in the same element. Linear elements) ~.;oith their
simpler strain variation, are unable to relieve other points in an ele
ment when one point cracks. They do relieve adjacent elements through
the normal discontinuity of strains across element boundaries, as in
dicated by the gaps in crack patterns. A similar situation can occur
for the quadratic element, in which full or partial cracking in one ele
ment completely relieves an adjacent element. The absence of partially
cracked and/or completely relieved elements (gaps) for the coarse and
intermediate grids indicates that the stress relief effect diminishes
rapidly with distance from a cracked Gauss point.
Load-deflection curves and cracking patterns for the same
grids subjected to a concentrated load are shown in Figs. 3.8-3.12. As
for the uniform load case, the four node element grids converge from the
stiff side, whereas the eight node element grids converge from the
flexible side. Fine grids for both element types converge to a common
solution, as shown in Fig. 3.12.
3.3.2 Moderate Beam
Analyses were performed for the moderate beam (5:1 span-to
depth ratio), considering models with 1, 2, and 5 linear and quadratic
elements through the depth. The response of beams within this range of
span-to-depth ratio is controlled by shear and flexure over approx-

Results and Discussion 31
imately equal portions of the length.
Load-deflection curves and crack patterns for the distributed
and concentrated load models are shown in Figs. 3.13-3.17 and 3.18-3.22,
respectively. Linear element grids decrease in stiffness, while the
quadratic element grids (again using 2x2 integration) first increase and
then decrease in stiffness with grid refinement. After the reinforce
ment yields, the trends become similar to those observed for the slender
beams, with the linear element grids continuing to decrease in stiffness
while the quadratic element grids increase in stiffness. Convergence of
load-deflection curves to a common solution with increased grid refine
ment is shown in Fig. 3.17.
The crack patterns for the uniform load (Figs. 3.15 and 3.16)
clearly distinguish those regions controlled by flexure and those con
trolled by shear. Extensive di·agonal cracks inclined at approximately
45 degrees, indicate the high shear, low flexure stresses near the sup
port. Linear element coarse and intermediate grids again do not predict
realistic crack patterns. The alternating crack directions within an
element become much less noticeable for the fine grid. The quadratic
elements produce reasonable crack patterns for all three levels of grid
refinement. Gaps observed in cracking patterns for the slender beam
solutions occur infrequently for the moderate beam. It can be argued
that, due to the more complex stress field within the moderate beam, a
grid with five elements through the depth does not reflect the same
degree of grid refinement as it does for the slender beam. Considering
the ratio of element size to span length, the fine grid for the moderate
beam is actually less refined than it is for the slender beam.

32 Results and Discussion
The trends evident for the concentrated load case
(Figs. 3.18-3.22) closely follow those for the uniform load case. Fine
element grids for both element types appear to be converging to a common
solution (Fig. 3.22). However, the rate of convergence is not as rapid
as for the uniform load case.
3.3.3 Deep Beam
Analyses were performed for the deep beam (2:1 span-to-depth
ratio) subjected to a distributed load and a concentrated load. Due to
the high stress gradients present in the deep beam, finer grids were em
ployed than for the slender and moderate beams. Up to 20 linear ele
ments and 10 quadratic elements were used through the depth for the deep
beam analyses. Load-deflection curves and cracking patterns are given
in Figs. 3.23-3.36. The response of beams with this span-to-depth ratio
is controlled almost entirely by shear, especially for the concentrated
load case. Consequently, diagonal tension cracks oriented at near 45
degrees develop along a line connecting the simple support and the beam
top surface at mid-span (see, for example, Fig. 3.34). Only small re
gions near the bottom edge and at mid-span develop flexural cracks.
Load-deflection curves for the linear element (Figs. 3.23 and
3.29) follow the same trend of increased flexibility with grid refine
ment observed for the slender and moderate beams. For the distributed
load, quadratic element load-deflection curves, generated using reduced
integration, also indicate increasing flexibility with grid refinement
(Fig. 3.24). Under a concentrated load, the quadratic element load-
deflection curves (Fig. 3.30) show, at first, increased flexibility,

Results and Discussion 33
then increased stiffness with additional grid refinement. This trend is
due in part to the formation of a horizontal crack (labelled 11 A11) just
below mid-depth of the 5x5 grid, as shown in Fig. 3.31. Nodes above
crack "A" displace upward (positive) rather than dowmvard. When used to
calculate the mid-depth deflection, the positive displacement over the
support increases, rather than decreases, the mid-depth deflection at a
given load. The 2x2 element grid does not develop a similar horizontal
crack and thus appears much stiffer (edge nodes displace downward). The
lOxlO grid has several nearly horizontal cracks near mid-depth as shown
in Fig. 3. 31, and yet nodes on the leftmost edge displace downward"'.
The linear element grids~ shown in Fig. 3.34, also exhibit
horizontal cracks near mid-depth above the simple support; but all nodes
on the edge displace downward. When solved with full (3x3) rather than
reduced integration, quadratic element grids exhibit the same trend in
load-deflection curves (increased flexibility with grid refinement,
Fig. 3.33) and the same trend in the cracking patterns (horizontal
cracks above support, Fig. 3.35) as the linear element grids. The
response sensitivity to the formation of a horizontal crack above the
support and the reversal of trends in load-deflection curves obtained
for the quadratic element with reduced integration cast doubt on the
element's integrity when smeared cracks are present. These problems
prompted a detailed study of the stiffness characteristics of
isoparametric elements containing smeared cracks (see Section 3.4).
* If only the absolute deflection at quadratic element load-deflection curves trated load case show much better agreement. yield very similar curves; however, the stiffer.
mid-span is considered, the (Fig. 3.32) for the concenThe 5x5 and lOxlO grids
lOxlO grid remains slightly

34 Results and Discussion
Full (3x3) integration for the quadratic element was tried for
each loading type in an attempt to obtain load-deflection curves with
monotonic convergence. The results shown in Figs. 3.25 and 3.33 in
dicate that the desired monotonic behavior is obtained with full in
tegration. Full (3x3) integration was then adopted to generate the
quadratic element results described in the remainder of this section.
Load-deflection curves and crack patterns for the distributed
load case are shown in Fig. 3.23 and 3.25-3.28. Coarse element grids
did not demonstrate satisfactory convergence. Thus, linear element
grids up to 15xl5 and quadratic element grids up to lOxlO were analyzed
to obtain convergence. As observed for the slender and moderate beams,
the linear element grids decrease in stiffness with increasing grid
refinement. Solutions for the lOxlO and 15x15 linear element grids are
essentially identical (Fig. 3.23). Prior to yielding of the reinforce
ment, the response is insensitive to grid refinement. As observed for
the slender and moderate beams, gaps in the linear element grid cracking
patterns are present and indicate stress relief in adjacent elements due
to cracking. Fig. 3.25 shows the quadratic element (3x3 integration)
load-deflection curves for the distributed load. Small differences
between the solutions occur prior to yielding of the reinforcement. In
creased grid refinement slightly lowers the load required to yield the
reinforcement. Load-deflection curves for the 5x5 and lOxlO quadratic
element grids are essentially the same, indicating convergence. Gaps in
the quadratic element cracking patterns are also obtained (Fig. 3.27).
Results and Discussion 35
Linear and quadratic element load-deflection curves, compared
in Fig. 3.28, exhibit convergence toward a common solution, as obtained
for the slender and moderate beams. The linear element 15xl5 grid solu
tion closely parallels the IOxlO grid solution for the quadratic ele
ment. The lOxlO quadratic element grid has 33% more nodes than the
15xl5 linear grid and becomes slightly more flexible between the 4 and 6
kip/in load levels.
Load-deflection curves and crack patterns for the concentrated
load case (Figs. 3.29 and 3.33-3.35) follow the same general trends ob
served for the distributed load case. The crack patterns (Figs. 3.34
and 3.35) exhibit regions of flexural cracks similar to those obtained
for the distributed load case. Gaps in the cracking patterns are not
nearly as common as for the distributed load case. These figures also
reveal that complete 11 through depth11 cracking occurs at a small percen
tage of the load required to yield the reinforcement. Even after all
elements through the depth are cracked, the beam has considerable
strength remaining due to the shear capacity of the cracked concrete.
To insure that a fully converged solution had been obtained, a 20x20
grid analysis was performed using the linear element. As shown in
Fig. 3.29, the 15xl5 and 20x20 grid load-deflection curves are nearly
identical over the entire loading range.
Fig. 3.36 compares the linear and quadratic element load
deflection curves for the concentrated load case. Differences in the
two curves develop between the 20 and 40 kip loading levels. Above the
80 kip load level the stiffnesses are very similar; the average slope of
the linear load-deflection curve is just slightly larger than the
36 Results and Discussion
quadratic element curve slope. Moreover, the loads at which the rein
forcement yields are identical. The displacement jumps between the 20
and 40 kip load levels for the quadratic element and between the 40 and
80 kip load levels for the linear element occur as the structural system
changes from a beam to a tied arch due to the very extensive shear
cracking. Section 3.5 demonstrates that the exact load at which the
shear cracking occurs is sensitive to the element type, grid refinement,
and load increment size. It is also shown that the four load increments
used here to reach the 80 kip load level are not sufficient for the
linear element to adequately predict the displacement shift due to the
transition.
3.4 Stiffness Characteristics of Cracked Elements
For the deep beam, the quadratic element with reduced integra
tion produces load-deflection curves that have oscillating, rather than
monotonic, convergence characteristics with increased grid refinement
(Fig. 3.30). This behavior was at first attributed solely to the
development of specific horizontal cracks above the support, as
discussed in Section 3.3.3. However, upon closer study, the basic
stiffness characteristics of quadratic elements containing smeared
cracks are also found to affect the response.
In the slender and moderate beam solutions, load-deflection
curves for the quadratic element with reduced integration exhibit
monotonically increasing stiffness with grid refinement, irrespective of
the load case and deflection measure. When the same problems are
analyzed with the fully integrated quadratic element, the load-

Results and Discussion 37
deflection curves show increased flexibility with grid refinement, as
expected for most finite element solutions. These observations raise
questions about t~e stiffness characteristics of quadratic elements con
taining smeared cracks, particularly "shear11 cracks, as observed in the
deep beam. This section presents the results of numerical tests devised
to study the stiffness characteristics of cracked isoparametric ele-
ments.
3.4.1 Elements With Parallel Cracks
To study the behavior of a cracked element in shear, a simple
test problem was devised, as illustrated in Fig. 3.37. The problem con
sists of a square, unreinforced single element fixed at one end and
loaded in shear. The material constitutive matrix at each integration
point represents a smeared crack oriented at 45 degrees with the
horizontal. The normal stiffness reduction factor, a, is assigned a
value of zero. Table 3.3 lists the tip displacements computed for the
linear element, the quadratic element with reduced integration, and the
quadratic element with full integration. Values are normalized relative
to the deflection at node 4 of the linear element (Fig. 3.37). Both the
linear element and fully integrated quadratic element produce finite
displacement values, as required for a non-zero value of the shear
stiffness reduction factor, ~. The quadratic element with reduced in
tegration, however, produces extremely large displacements, indicative
of a singular stiffness matrix. The fully integrated quadratic element,
while not singular, is noticeably more flexible than the linear element.
The large difference between top and bottom node deflection for the

38 Results and Discussion
quadratic element clearly demonstrates the additional freedom of defor
mation introduced by the mid-side node.
To further explore the singularity that occurred with reduced
integration, an eigenvalue analysis was performed on the stiffness
matrix for the elements of the test problem. Eigenvalues of a stiffness
matrix are proportional to the strain energy generated when an element
is deformed in the shape of the corresponding eigenvector. Rigid body
motion (two translations and a rotation for these 2-D elements)
generates no strain energy and thus is associated with a zero eigen
value. Table 3.4 lists the number of zero and non-zero stiffness matrix
eigenvalues for the uncracked and cracked elements (all cracks at 45° as
shown in Fig. 3.37). The same number of zero eigenvalues is also ob-
tained for each case shown in the table for a rectangular element (2:1
aspect ratio). The uncracked linear and fully integrated quadratic ele
ments have the three required zero eigenvalues to represent rigid body
motion. The uncracked quadratic element with reduced integration has
four zero eigenvalues, indicating the existence of an additional defor
mation mode that causes no strain at the 2x2 Gauss point locations. The
additional 11 zero energy mode" was discovered soon after reduced integra
tion came into widespread use. In most analyses, reduced integration
dramatically improves the element performance. A discussion of zero
energy modes and reduced integration can be found in most recent finite
element texts (37).
Of interest here is the number of additional zero energy modes
that occur when all integration points are cracked at similar angles.
As shown in Table 3.4, the linear element in the test problem has one

Results and Discussion 39
additional zero eigenvalue for a total of four; the fully integrated
quadratic element has three additional zero eigenvalues for a total of
six. The reduced quadratic element, however, has four additional zero
eigenvalues for a total of eight. From this analysis, it is now clear
why the quadratic element with reduced integration fails in the simple
shear test problem. Removal of the constrained degrees of freedom (at
nodes 1-3) from the stiffness matrix of the quadratic element in
Fig. 3.37 leaves a lOxlO set of equations with a rank of eight, two less
than the number of equations. Constraints applied to the boundary nodes
eliminate only six of the zero energy modes. The shear loading ac-
tivates one, or a combination, of the two remaining zero energy modes
for the cracked element resulting in an unstable structure. The con-
strained stiffness matrices for the linear and fully integrated
quadratic elements, however, possess sufficient rank to remain positive
definite and thus are stable.
3.4.2 Elements With Differing Crack Orientation
The particular case discussed above for an element containing
parallel cracks represents the most severe condition for element stiff
ness degradation. In most analyses, this condition rarely occurs due to
the load redistrihution process. Cracks with varying orientations
generally form at the Gauss points. This should have the effect of in
creasing the element stiffness relative to parallel crack configura
tions. To study this effect, additional eigenvalue analyses were per-
formed. A randomly oriented smeared crack was imposed at each Gauss
point of an element. The element stiffness matrix was computed, and the

40 Results and Discussion
eigenvalues extracted. Results of these computations are summarized in
Table 3.5.
Both the linear element and the fully integrated quadratic
element have no zero energy deformation modes in excess of the three re
quired for rigid body motion. The remaining non-zero eigenvalues for
these elements are smaller in magnitude than those for the uncracked
elements. The quadratic element with reduced integration, however, has
eight zero energy modes irrespective of the crack orientations.
Moreover, the formation of a crack at each Gauss point in this element
introduces a zero energy deformation mode, i.e., an element with one
cracked Gauss point has a total of five zero energy modes of deforma-
tion. The same number of zero energy modes was also obtained for each
case shown in Table 3.5 with a rectangular element (2:1 aspect ratio).
For the linear element, altering the orientation of just one
of four initially parallel cracks eliminates the single excess zero
energy mode. In a fully integrcted quadratic element, the three zero
energy modes are eliminated by varying the orientation of just three (of
nine) initially parallel cracks.
3.4.3 Effects of the Normal Stiffness Reduction Factor
The normal stiffness reduction factor, a, is often used
simply to avoid placing a zero on the diagonal of the material constitu
tive matrix. The exact role of a non-zero a in the solution process
has not been studied previously. It is generally known that small
values do not drastically alter the nodal displacements. The eigenvalue
analyses conducted as part of this study have defined the role of the
Results and Discussion
stiffness reduction factor. It suppresses the formation of zero energy
deformation modes in cracked elements. Consider, for eX3.mple, an ele-
ment with dimensions of lxlxl. The zero eigenvalues in excess of the
three associated with rigid body motion become simply a times Young's
modulus, E.
-3 The test problem in Fig. 3.37 was solved for a=lO and
to assess the sensitivity of the computed displacements to a range of a
values. Results for these two cases and for a=O are listed in Table
3.6. The four node element results show little effect for this range of
a, with only a 4% displacement reduction occuring for the relatively
large a value of 10-3 . The quadratic element displacements show a much
larger effect for both full and reduced integration cases. The 50/o
displacement reduction for the fully integrated element suggests that
-3 a=lO is too large.
For the reduced integration case, any small positive value of
a is sufficient to render the stiffness matrix positive definite. The
computed displacements appear to vary inversely with the prescribed
value of a ; the artificial stiffness normal to the crack provides the
primary load resisting mechanism. These numerical results suggest that
the use of a normal stiffness reduction factor is a questionable tech-
nique and may in some instances disguise undesirable element behavior.

42 Results and Discussion
3.4.4 Significance of Stiffness Test Results
explain
The test problem and eigenvalue analyses provide a basis to
the trends in load-deflection curves obtained using the
quadratic element. When the structure geometry and loading are such
that cracked elements must resist the applied loading, then the struc
ture stiffness degradation is unpredictable if the cracked elements have
zero energy modes. Zero energy modes in cracked elements that are not
required to resist the applied loads (due to redistribution among other
elements) do not appear to adversely affect the structure stiffness.
For beams analyzed with the linear and the fully integrated
quadratic elements, load-deflection curves show an increased flexibility
with grid refinement. This trend is observed in most finite element
analyses. A set of four cracks for the linear element, and seven cracks
for the quadratic element, with precisely the same orientation is re
quired to introduce the first zero energy mode. Non-uniform strain
fields and the redistribution of loads among elements prevent this from
occurring.
The quadratic element with reduced integration exhibits two
different trends in the convergence of load-deflection curves with grid
refinement. Load-deflection curves for the slender beam indicate a
stiffness increase with grid refinement; for the deep beam, load
deflection curves show a general flexibility increase with grid refine-
ment. The moderate beam behavior lies between that for the slender and
deep beam; grid refinement at first increases the flexibility but
further refinement increases the stiffness.

Results and Discussion 43
Results of the element stiffness study point to the formation
of zero energy modes as the source of the different convergence trends.
Once a crack forms at a Gauss point, regardless of the crack orienta
tion, an additional zero energy mode is obtained in the quadratic ele
ment with reduced integration. The type of convergence observed in the
load-deflection curves depends directly on whether or not cracked ele
ments provide the internal resisting forces. In the slender beam, for
example, the load transfer mechanism is bending, with the internal mo
ment provided by compression in elements at the top surface and ·tension
in the reinforcement. The coarse grid has a single element through the
depth which is subjected to both tension and compression. Tension
cracks along the bottom row of Gauss points (Fig. 3.11) introduce zero
energy modes that decrease the element stiffness in compression. As a
consequence, the load-deflection curve is more flexible and a much lower
yield load is predicted (Fig. 3.9). The intermediate and fine grids
have completely uncracked elements available near the top surface that
provide the compression force and shear transfer. These grids are
therefore stiffer than the coarse grid. Just above the yield load,
cracks develop in the top row of elements for the intermediate grid.
The top row of elements in the fine grid does not crack after yielding.
The fine grid is therefore stiffer after the reinforcement yields. The
presence of fully cracked elements with zero energy modes along the bot
tom surface in the fine and intermediate grids has no effect on the
load-deflection curves.

44 Results and Discussion
In contrast to the slender beam, the primary load transfer
mechanism for the deep beam is shear, which must be resisted by the con
crete. Virtually all elements develop shear cracks, including those
near the top surface, independent of the grid refinement. Only cracked
elements, usually with eight zero energy modes each (four Gauss points
cracked), are available to resist the shear force. Grid refinement
simply increases the flexibility for this case.
3.5 Effects of Load Increment Size on Load-Deflection Curves
The formation of cracks is generally considered to be a
loading path dependent phenomenon. Bazant and Cedolin (5) suggest that
the load increment size used in a finite element analysis significantly
affects the computed response. They adjust load increment sizes as the
solution progresses such that a single element (composed of 4 triangles)
cracks for each increment of external load. However, during iterations
to distribute residual loads, any number of additional cracks may form
as necessary to reach the equilibrium configuration.
There are two major problems with this solution method. The
first problem concerns the practicality of cracking a single Gauss point
(or element as the case may be) with each external load increment. When
considering grids of isoparametric elements, the number of sampling
points is generally large compared to grids of quadralateral elements
formed from triangles. In the 20x20 grid of linear elements, for ex-
ample, there are 1600 Gauss points at which a crack may form. An extra
ordinarily large number of load increments is required to reach a fully
cracked state using this procedure, which may render the analysis

Results and Discussion 45
economically infeasible. Furthermore, most finite element codes do not
support automatic determination of load increment sizes based upon
projected stress increments. Load increment sizes are usually specified
directly by the analyst as a multiplier applied to a loading pattern.
The second problem with the procedure followed by Bazant and
Cedolin is the inconsistency between allowing formation of only one
crack for an external load increment and permitting any number of cracks
to form during an equilibrium iteration at fixed external load. A mere
consistent approach is to successively scale the residual load vector to
permit the formation of only one crack per iteration. Chen (9) has
adopted this solution strategy for relatively coarse grids of constant
strain triangle elements. However, with the large number of sampling
points in isoparametric element grids, this solution strategy may not be
feasible.
To gain some insight into the sensitivity of load-deflection
curves to load increment size, the deep beam (shear panel) with the con-
centrated load at mid-span was subjected to additional study. A 15xl5
grid of linear elements was used for the load increment size study.
Cracking patterns for the load increment sizes used to generate the
load-deflection curves in Fig. 3.29 revealed that essentially all cracks
formed below the 80 kip load level. The effects of load increment size
on crack formation could therefore be determined by considering the load
level from first cracking (24 kips) through 80 kips. The loading range
was divided into 8, 15, 29, and 83 equal size load steps. This con-
trasts to four steps used to reach the 80 kip load level for this grid
in prior analyses (Fig. 3.29). For the 83 load steps, only one or two

46 Results and Discussion
Gauss points cracked in the first iteration of each step (which cor
responds to the application of the external load increment). The solu
tion procedure thus became that recommended by Bazant and Cedolin. As a
final check, the 20x20 linear element grid was also analyzed using 83
load steps to detect any combined load step-grid size effects.
Fig. 3.38 shows load-deflection curves generated for the
varying numbers of load steps with the 15xl5 grid. For 8 or more load
steps, the response up to the 80 kip load level consists of four
distinct regions: (1) linear elastic below 24 kips, (2) flexural
cracking below approximately 0.006 in. of deflection, (3) a transition
region in which the structural behavior changes from a beam to a tied
arch, as indicated by the displacement jump, and (4) additional minor
shear cracking once the tied arch configuration is attained. Fig. 3.39
compares the 15xl5 and 20x20 grid load-deflection curves that were
generated using 83 load steps. The two curves are identical with the
exception of the beam to tied arch transition, which occurs at different
load levels. The cracking patterns for
clearly illustrate the transition behavior.
the 15x15 grid (Fig. 3.40)
For the first 50 load
steps, primarily flexure cracks formed below a diagonal line connecting
the simple support and the load point at mid-span. During load step 51
(P=49 kips), extensive diagonal shear cracks formed during the
equilibrium iterations, although only one Gauss point cracked in the
first iteration qf the load step. The development of extensive diagonal
shear cracks characterizes the transition in structural behavior from a
beam to a tied arch. The tied arch has only about 65% of the stiffness
of the beam. These cracking patterns also reveal more distinct gaps
Results and Discussion 47
than those generated with the larger load increments (Fig. 3.34). A
large load increment in the early stages of loading may cause the
stresses to be overestimated and thus lead to excessive cracking.
The curves in Figs. 3.38 and 3.39 demonstrate the sensitivity
of the beam to tied arch transition to both load step size and grid
refinement. For the 15x15 grid, the use of smaller load steps increases
the load at which the transition initiates. Increasing the grid refine
ment lowers it. The slope of the load-displacement curve for the 20x20
grid during the transition is very nearly zero> which indicates an
unstable structure. This behavior is analagous to snap-through buckling
in shells when driven by applied loads rather than applied displace
ments. The 11 snap-through" behavior observed for the deep beam transi
tion occurs when, for a very small load increase, the level of cracking
rapidly increases until the stable tied arch configuration is attained.
This clearly indicates that the transition behavior in the deep beam is
fracture sensitive. Fracture mechanics techniques are required to
predict accurately the transition response, if this is the purpose of
the analysis.
These results demonstrate equally as well that the macroscopic
stiffness and strength of the structure are insensitive to the load step
sizes used in the finite element computations. This is expected since
structural behavior before the transition (a beam) and after (a tied
arch) is not dependent upon the load that initiates the transition, but
rather the current extent of the cracking. The exact load to initiate
the transition plays a minor role in the response of this particular
member. The transition behavior does not affect the stiffness of the

48 Results and Discussion
tied arch configuration or the load necessary to yield the reinforce
ment. It does, hm.;ever, produce the load-deflection curve jump observed
in Figs. 3.38 and 3.39. The magnitude of the displacement jump is
nearly identical for the range of load steps considered (8 to 83). The
load-deflection curves agree very well after the transition, both in
slope and absolute position. The four load steps used to reach the 80
kip load level in earlier analyses (Figs. 3.33 and 3.36) are clearly
inadequate to sense the displacement shift during the transition. This
example emphasizes the importance of proper load increment selection.
The nonlinear analysis of reinforced concrete structures must consider
different combinations of grid refinement and load increment size.
In other types of structures, for which there is not an alter
native equilibrium configuration, the transition load may indeed con
stitute the "failure" load. Unreinforced structures and certain struc
tures with very low reinforcement ratios would be included in this
category. A fracture mechanics based analysis may then be necessary to
accurately predict the transition load. The stress controlled-smeared
crack model and the solution algorithms employed in this study will
predict an unstable structure if another equilibrium configuration does
not exist. The stress controlled model thus serves as a good indicator
of its own adequacy, and will indicate when a fracture mechanics
analyses is required.
The effect of element type is illustrated in Figs. 3.4la and
b, which compare the load-deflection curves for the lOxlO grid of eight
node elements with the lSxlS grid of four node elements for 4, 8 and 29
load increments. While both models attain stable configurations fol-

Results and Discussion 49
lowing the beam to tied arch transition, it is clear that the models
differ in both the stiffness following the transition and the transition
load itself. The lOxlO grid of quadratic elements remains more flexible
than the 15x15 grid of linear elements (see also Fig. 3.36). This dif
ference may be traced to the lo\.;er stiffness exhibited by the cracked,
fully integrated eight node element, observed in Section 3.4. These
results suggest that the effects of element type remain an open question
and require additional study.
3.6 Effects of Concrete Tensile Strength
The deep beam was selected to study the effect of concrete
tensile strength on response. Diagonal tension stresses in 11 shear
panels" of this type usually cause large areas to crack and may lead to
a considerable loss of stiffness. The effect of concrete tensile
strength should be more pronounced for such a structure than for a
slender beam which is controlled by flexure. Of the problems con
sidered, the deep beam with the concentrated load at mid-span provides
the most severe diagonal tension.
Load-deflection curves obtained in Section 3.5 for a tensile
strength of 400 psi represent an upper bound solution. To obtain a
lower bound solution, the 1Sx15 linear element grid was analyzed using a
tensile strength of 10 psi. Load-deflection curves for the 400 and 10
psi tensile strengths are given in Fig. 3.42. The tensile strength
directly controls the load at which initial cracking occurs. The crack
patterns that are obtained with a 10 psi tensile strength closely
resemble those in Fig. 3.40, only they occur at 1/40 of the load. These

50 Results and Discussion
results clearly demonstrate the negligible influence of f' t
on the
overall response.
3.7 Concluding Remarks
This chapter presents the results of a large number of
numerical studies designed to evaluate the response characteristics of a
limiting tensile strength-smeared crack model for nonlinear analyses of
reinforced concrete structures. Questions raised by recent investiga-
tions concerning this modeling approach have been addressed. The
specific concerns include:
1) Do load-deflection curves converge with grid refinement? If yes,
in what manner, and what governs the type of convergence?
2) Are numerical or response problems introduced when the tensile
stress is immediately reduced to zero upon crack formation?
3) What is the impact of load increment size on the response, i.e.,
how path dependent is the response?
4) What are the effects of concrete tensile strength on response?
Each of these questions was studied from the viewpoint of the
macroscopic response, as measured by the overall load-deflection curves
and cracking patterns. It must be emphasized that for the types of
problems considered in this study, the flexure reinforcement enabled the
members to reach stable equilibrium configurations following extensive
crack formation. Consequently, the 11 limit" strength of each structure
was only partially determined by the degree of cracking. A stable
equilibrium configuration, either a beam or tied arch, was attained for
Results and Discussion 51
each member, even after very significant cracking occurred. Large
changes in structural stiifness due to the softening effect of cracking
were generally limited to early portions of the load deflection-curves
(up to one-half the load to yield Lhe reinforcement).
This study indicates that load-deflection curves do exhibit
convergence toward a common solution with grid refinement. The rate of
convergence depends on the geometry, type of loading, and element type.
The shear dominated deep beam solutions converge more slowly and require
finer grids than do those for the flexure controlled members. The
linecr and fully integrated quadratic element load-deflection curves
show monotonically increased flexibility with grid refinement, very
similar to the response obtained in ordinary linear analyses. Conver-
gence characteristics of load-deflection curves generated using
quadratic elements with reduced integration are problem dependent and
vary based on whether or not cracked elements must resist the applied
load. These elements contain one additional zero energy deformation
mode for each cracked Gauss point, which may considerably increase the
structure flexibility unless adjacent elements suppress the zero energy
modes. In the coarse grids (1 element through depth) for flexure
dominated problems, cracked elements must resist the shear and compres
sive forces. Adjacent elements are not available to suppress the zero
energy modes. Consequently, grid refinement leads to increased stiff-
ness as uncracked elements above the mid-depth become available to
resist the load. For the deep beam problem, cracking occurs completely
through the depth for all grids, thus requiring that the cracked ele
ments resist the load. Grid refinement simply increases the flexibility

52 Results and Discussion
for this case. The linear and fully integrated quadratic elements do
not develop zero energy modes, except when all Gauss points within an
element crack at precisely the same orientation.
It has been suggested that immediately reducing the tensile
stress to zero upon crack formation may lead to solution instability as
grids are refined. No such difficulties are experienced in analyzing
the beam and shear panel structures considered in this study. From a
qualitative viewpoint, it may be argued that the impact of crack forma
tion at a Gauss point is determined by the cracked element size and the
sizes of the adjacent elements. The residual load magnitude imposed on
adjacent elements is governed by the cracked element size; the influence
of the residual load applied to the nodes of adjacent elements depends
upon their size-- larger elements are influenced less. In this study,
element grids are uniformly refined, which probably minimizes any ef
fects of this type.
Below a certain magnitude, load increment size is found to
have no influence on the overall stiffness and strength predictions for
the deep beam considered. The load increment size does affect the load
at which the beam to tied arch transition occurs for this type of
member. Fracture mechanics based analyses are recommended when accurate
prediction of the transition load is the goal of the analysis. For the
deep beam studied, the transition behavior is a very minor aspect of the
overall structural response. The transition load constitutes only
10-15% of the load required to yield the reinforcement. The load incre
ment study also shows that a reasonable number of load steps is required
to predict the displacement jump that occurs during the transition.

Results and Discussion 53
Analyses with a range of load increment sizes may be necessary if a
major transition is structural behavior is suspected.
The concrete tensile strength controls the initial cracking
load and the rate at which cracking penetrates through the depth.
Neither of these responses appears to have a significant impact on the
overall load-deflection curve. Once a stable, fully cracked configura
tion is attained, the response is independent of the tensile strength.

54 Summary and Conclusions
CHAPTER 4
SUMMARY AND CONCLUSIONS
4.1 Summary
A parametric study has been conducted to examine the influence
of finite element modeling parameters on the predicted nonlinear
response of reinforced concrete members. Nonlinear effects were limited
to cracking of the concrete and yielding of the reinforcement. The in
vestigation focused on the sensitivity of macroscopic response to the
finite element modeling parameters. In this study, macroscopic response
was characterized by load-deflection curves and general trends in the
cracking patterns.
Three classes of problems were considered in the study;
namely, 1) long, shallow beams with flexure dominated response,
2) moderate length beams influenced by both flexure and shear, and
3) deep beams (shear panels) in which shear dominated the response.
Span-to-depth ratios of 12:1, 5:1) and 2:1 were selected for analysis to
represent the three problem classes. The beams were singly reinforced
and simply supported. Each beam was analyzed for a uniformly
distributed load applied across the top surface and for a concentrated
load applied at mid-span.
The finite element modeling parameters studied were: the ele
ment type (order of displacement approximation), the element grid
refinement, the order of Gauss numerical integration, the concrete ten
sile strength, f~, and the load increment size.
Summary and Conclusions 55
The concrete was modeled as a linear material in compression.
Cracks were introduced in the finite element grid using a 11 Smeared 11
representation that simulates a crack by a stress discontinuity within
the continuous strain field of an element. Cracks were formed when the
principal tensile stress exceeded a limiting value for the material.
The tensile stress was immediately reduced to zero upon crack formation.
Flexural reinforcement was modeled using constant strain,
discrete bar elements. The stress-strain curve for the reinforcement
followed a simple bilinear, strain hardening approximation.
Concrete portions of the beams were modeled with four node,
linear displacement and eight node, quadratic displacement isoparametric
elements. The nonlinear response was computed incrementally using the
Newton-Raphson procedure with corrective equilibrium iterations. The
structural tangent stiffness was recomputed before each iteration to as
sure accurate distribution of the residual loads and to maximize the
convergence rate.
4.2 Conclusions
Results of the finite element parametric study presented in
this report support the following conclusions.
1. Load-deflection curves for the reinforced concrete members con
sidered in this study exhibit general convergence toward a com
mon solution With increased grid refinement. Flexure controlled
members converge more rapidly than do shear controlled members.

56 Summary and Conclusions
2. The type of convergence, whether from the stiff or the flexible
side) depends on the geometry, loading, element type, and
numerical integration order (for the quadratic element).
3. For the member geometries and load cases considered, changes in
structural stiffness due to cracking are generally complete at
loads less than one-half the load required to yield the rein-
forcement. Each member reaches a stable, cracked configuration
early in the loading process and experiences only minor crack
development under additional loading. No difficulties were ex
perienced in continuing the analysis beyond yielding of the
reinforcement.
4. Detailed analyses for a flexure reinforced deep beam show that
below a certain magnitude, the load increment size does not af
fect the macroscopic stiffness or strength (yield load) predic-
tions. For a specific grid refinement, the load increment size
does influence the load at which the transition in structural
behavior from a beam to a tied arch occurs. With the use of
large load increments, the analysis may not detect the existence
of such a transition.
5. Concrete tensile strength has only a minor effect on the overall
load-deflection curve for the flexure reinforced deep beam. The
tensile strength controls the initial cracking load and the
loading at which the stable cracked configuration is attained.
6. Cracking patterns for the slender and moderate beams are sensi
tive to the element type and grid refinement. Coarse grids of
linear elements exhibit alternating crack directions within each

Summary and Conclusions 57
element due to the poor shear stress representation. Even for
coarse grids, the quadratic element, with its higher order
strain variation, produces more .realis·tic crack patterns that do
not show large differences in crack angles within an element.
7. Crack patterns for the slender and deep beam fine grids show
partially and completely uncracked elements adjacent to fully
cracked elements. This behavior is attributed to "stress
relief" of neighboring Gauss points that occurs when a point
cracks. Other investigators have referred to this phenomenon as
"strain localization".
B. For the flexure reinforced deep beam studied, considerably finer
element grids (more elements through the depth) are required to
eliminate grid size effects in the response. A 15xl5 grid of
linear elements is found to be adequate.
9. Eigenvalue analyses of cracked element stiffness matrices reveal
that the linear and the fully integrated quadratic elements have
one and three additional zero energy modes, respectively, when
all Gauss points are cracked and the cracks are parallel. A
similarly cracked quadratic element with reduced integration has
four additional zero energy modes. Thus, eight of the sixteen
deformation modes produce no strain at the 2x2 Gauss points.
10. Further, eigenvalue analysis studies show that the four node
element and the fully integrated quadratic element develop no
spurious zero energy modes when cracks at the Gauss points have
slightly different orientations, as occurs in most analyses.
The quadratic element with reduced integration has an additional

58 Summary and Conclusions
spurious zero ener6Y mode for each cracked Gauss point) regard
less of the crack orientation.
11. The development of zero energy deformation modes in the
quadratic element ~.;ith reduced integration causes unpredictable
response when cracked elements are required to resist the ap
plied load (e.g. for a coarse mesh in flexure problems and in
all grids for a deep beam or shear panel).
12. Because of response variations with the reduced quadratic ele
ment, it is not recommended for general use. The linear element
and the fully (3x3) integrated quadratic element are both recom-
mended for general use. Load-deflection curves exhibiting
monotonic convergence from the stiff side with grid refinement
can be expected.
13. The stress controlled-smeared crack modeling scheme is suitable
for macroscopic strength and deformation analyses of members in
which the "limit" strength is not governed solely by cracking.
Clearly, unreinforced and very lightly reinforced members re
quire analysis using fracture mechanics procedures.
14. The stress controlled-smeared crack representation adequately
models the general softening effect that results from cracking
in common reinforced concrete members. Such members invariably
achieve stable equilibrium configurations following extensive
crack formation when load is transferred to the reinforcement.
The failure of the solution procedure adopted in this study to
reach the stable cracked configuration would strongly indicate
the need for a fracture mechanics investigation.

Summary and Conclusions 59
4.3 Recommendations for Further Study
A nwnber of areas remain to be examined for the analytical
prediction of cracking behavior in reinforced concrete structures.
These are briefly outlined below.
1. The effect of tension stiffening, i.e., the gradual decrease of
stress to zero after cracking, was not considered. Various
schemes have been proposed to represent the descending branch of
the tensile stress strain curve but few, if any, studies have
been conducted to determine the interaction with grid refine
ment.
2. All beams in this study had a reinforcing ratio of 1.5%, which
approaches the upper bound permitted in design codes. The ef
fect of lower reinforcement ratios, perhaps the minimum allowed,
should be examined~
3. None of the beams analyzed had stirrups for shear reinforcement.
It is not clear what affect various amounts of shear reinforce
ment would have on the convegence properties of the solution.
Shear reinforcement would contribute significantly to the
response of the deep beam (shear panel).
4. A simple nonlinear model for biaxial compression incorporated in
the finite element model would permit meaningful comparisons
with experimental data. It would also enable investigation of
the descending branch of the overall load-deflection curve,
e.g., stability behavior.

60 Summary and Conclusions
5. The use of a '1 smeared 11 representation for the reinforcing steel
should be considered. The discrete bar element approach, while
quite simple 1 restricts reinforcement to the interelement boun
daries.
6. The difference in stiffness between a fully cracked, four node
element and a fully cracked, eight node element requires further
study. The use of a nine node, Lagrangian element should also
be examined to assess any effects due to the non-uniform shear
strain variation that occurs over the eight node element.

References 61
REFEREXCES
1. Al-Hahaidi, 11Nonlinear Finite Element Analysis of Reinforced Concrete Deep Members, 11 thesis presented to Cornell University, Ithaca, N.Y.) in 1979, in partial fulfillment of the requirements for the degree of Doctor of Philosophy.
2. Bashur, F .K., and Dan.;rin, D., ttNonlinear Model for Reinforced Concrete Slabs," CRINC Report SL-76-03, University of Kansas Center for Research, Lawrence, Ks., Dec. 1976.
3. Bashur, F.K., and Darwin, D., "Nonlinear Model for Reinforced Concrete Slabs,'' Journal of the Structural Division, ASCE, Vol. 104, No. STl, Jan. 1978, pp. 157-170.
4. Bazant, Z.P., and Cedolin, 1., "Blunt Crack Finite Element Analysis, Journal of the Division, ASCE, Vol. 105, No. EM2, Apr. 1979,
Band Propagation in Engineering Mechanics pp. 297-315.
5. Bazant, Z.P., and Cedolin, 1., 11Fracture Mechanics of Reinforced Concrete, 11 Journal of Vol. 106, No. EM6, Dec. and Dodds, Vol. 108, Vol. 108, No. EM2, Apr.
the Engineering Mechanics Division, ASCE, 1980, pp. 1287-1306. (Discussion by Darwin No. EM2, Apr. 1982, pp. 464-466. Closure,
1982, pp. 466-471.)
6. Cedolin, 1., and dei Poli, S., "Finite Element Studies of Shear Critical R/C Beams,lf Journal of the Engineering Mechanics Division, ASCE, Vol. 103, No. EM3, June 1977, pp. 395-410.
7. Cervanka, V., "Inelastic Finite Element Analysis of Reinforced Concrete Panels Under In-plane Loads, 11 thesis presented to the University of Colorado, Boulder, Colorado, in 1970, in partial fulfillment of the requirements for the degree of Doctor of Philosophy.
8. Cervanka, V, and Gerstle, K.H., "Inelastic Analysis of Reinforced Concrete Panels Part I:Theory, 11 International Association of Bridge and Structural Engineers Publications, Vol. 31-11, 1971, pp. 31-45, "Part II :Experimental Verification and Application, 11 Vol. 32-11, 1972, pp. 25-39.
9. Chen, W.F., Plasticity In Reinforced Concrete, McGraw-Hill Co., 1982.
10. Darwin, D., and Pecknold, D.A., "Inelastic Model for Cyclic Loading of Reinforced Concrete, 11 Civil Engineering Studies 409, UIUC, Urbana, Ill., July 1974.
Biaxial SRS No.
11. Darwin, D., and Pecknold, D.A., "Analysis of RC Shear Panels Under Cyclic Loading," Journal of the Structural Division, ASCE, Vol. 102, No. ST2, Feb. 1976, pp.~SS-369.

62
12. Dodds, R.H., and Lopez, L.A., "A Generalized Software !{on-Linear Analysis, n Advances in Engineering Software, 4, 1980, pp. 161-168.
References
System for VoL 2, No.
13. Dodds, R.H., Lopez, L.A., Pecknold, D.A., 11 Numerical and Software Requirements for General Nonlinear Fini·te Element Analysis," Civil Engineering Studies SRS No. 454, UIUC, Urbana, Ill., Sept. 1978.
14. Franklin, H.A., "Nonlinear Analysis of Reinforced Concrete Frames and Panels, 11 thesis presented to the University of California at Berkeley, in 1970, in partial fulfillment of requiremen·ts for the degree of Doctor of Philosophy.
15. Gilbert, R.I., and Warner, R.F., "Nonlinear Analysis of Reinforced Concrete Slabs with Tension Stiffening," UNICIV Report No. !'c-167, University of New South Wales, Kensington, N.S.W., Austrailia, Jan. 1977.
16. Hand, F.R., Pecknold, D.A., and Schnobrich, W.C., "Nonlinear Layered Analysis of RC Plates and Shells," Journal of the Structural Division, ASCE, Vol. 99, No. ST7, July 1973, pp. 1491-1505.
17. Lin, C.S., and Scordelis, A.C., "Nonlinear Analysis of RC Shells of General Formtn Journal of the Structural Division, ASCE, Vol. 101, No. ST3, March 1975, pp. 523-528.
18. Lopez, L.A., Dodds, R.H., Rehak, and Urzua, J., "POLO-FINITE: A Structural Mechanics System for Linear and Nonlinear Analysis,'' Issued as a technical report by: Civil Engineering Laboratory, Univ. of Ill. at Urbana-Champaign, and Department of Civil Engineering, Univ. of Ks., Lawrence, Ks, 1980.
19. Mikkola, M.J., and Schnobrich, W.C., "Material Behavior Characteristics for Reinforced Concrete Shells Stressed Beyond the Elastic Range," Civil Engineering Studies SRS No. 367, UIUC, Urbana, Ill., Aug. 1970.
20. Modeer, M., 11A Fracture Mechanics Approach to Failure Concrete Materials," Report TVBM-1001, Division Materials, University of Lund, Sweden, 1979.
Analysis of of Building
21. Mufti, A.A., Mirza, M.S., McCutcheon, J.O., and Houde, J., "A Study of the Behavior of Reinforced Concrete Elements," Structural Concrete Series No. 70-~, McGill University, 1970.
22. Mufti, A.A., Mirza, M.S., McCutcheon, J.O., and Houde, J., "A Study of the Nonlinear Behavior of Structural Concrete Elements,tt Proceedings, The Speciality Conference on Finite Element Methods in Civil Engineering, Montreal, Canada, June 1972.
23. Nayak, Finite Wales,
G.C., "Plasticity and Large Deformation Problems by the Element Method,u unpublished Ph. D. thesis, University of
Swansea, 1971.
References 63
24. Nilson, A. H., "Nonlinear Analysis of Reinforced Concrete by the Finite Element Method," Journal of the American Concrete Institute, Vol. 65, No. 9, Sept. 1968, pp. 157-776.
25. Ngo, D., and Scordelis 1 A. C., nFinite Element Analysis of Reinforced Concrete Beams," Journal of the American Concrete Institute, Vol. 64, No. 14, Mar. 1967, pp. 152-163.
26. Ngo, D., Scordelis, A. C.) and Franklin, H.A., 11Finite Element S·tudy of Reinforced Concrete Beams with Diagonal Tension Cracks, 11 UC-SES~1
Report No. 70-~, University of California at Berkeley, Dec. 1970.
27.
28.
Rashid, Y.R., 11 Analysis of Nuclear Engineering and 334-344.
Prestressed Concrete Pressure Design, Vol. 7, No. 4, Apr.
Vessels,n 1968, pp.
Rostam, Report sity of
S., and Bysckov, E., ncracks in Concrete Structures, 11
No. I15, Structural Research Laboratory, Technical UniverDenmark, 1971.
29. Salah El-Din, A.S., and El-Adawy Nassef, M.M., "A Modified Approach for Estimating the Cracking Moment of Reinforced Concrete Beams, 11
Journal of the American Concrete Institute, Vol. 72, No. 7, 1975, pp. 356-360.
30. Saourna, V., "Automated Nonlinear Finite Element Analysis of Reinforced Concrete: A Fracture Mechanics Approach, 11 thesis presented to Cornell University, Ithaca, NY, in 1980, in partial fulfillment of the requirements for the degree of Doctor of Philosophy.
31.
32.
Schnobrich, W,C., et. al., Discussion of of Reinforced Concrete, 11 by Valliappan Structural Division, ASCE, Vol. 98, pp.2327-2328.
"Nonlinear Stress Analysis and Doolan, Journal of the No. ST10, Oct. 1972,
Sui dan, forced 99, No.
M., and Schnobrich, W.C., "Finite Element Analysis of ReinConcrete," Journal of the Structural Division, ASCE, Vol. ST10, Oct. 1973, pp. 2109-2122.
33. Task Committee on Finite Element Analysis of Reinforced Concrete Structures, State-of-the-Art Report on Finite Element Analysis of Reinforced Concrete, American Society of Civil Engineers, New York, N.Y., 1982, 545 pp.
34. Valliappan, S., and Doolan, T.F., 11Nonlinear Stress Analysis of Reinforced Concrete Structures, 11 Journal of the Structural Division, ASCE, Vol. 98, No. ST4, Apr. 1972, pp. 885-898.
35. Vangreunen, J., "Nonlinear Geometric, Material and Time Dependent Analysis of Reinforced Concrete and Prestressed Concrete Slabs and Panels, 11 UC-SESM. Report No. 79-l, University of California at Berkeley, Oct. 1979.

64 References
36. Yuzugullu, 0., and Schnobrich, W.C., "A Numerical Procedure for the Determination of the Behavior of a Shear Wall Frame System,n Journal of the American Concrete Institute, Vol. 70, No. 7, July 1973, pp. 474-479.
37. Zienkiewicz, O.C., The Finite Element Method 3rd Edition, McGrawHill, London, 1977.
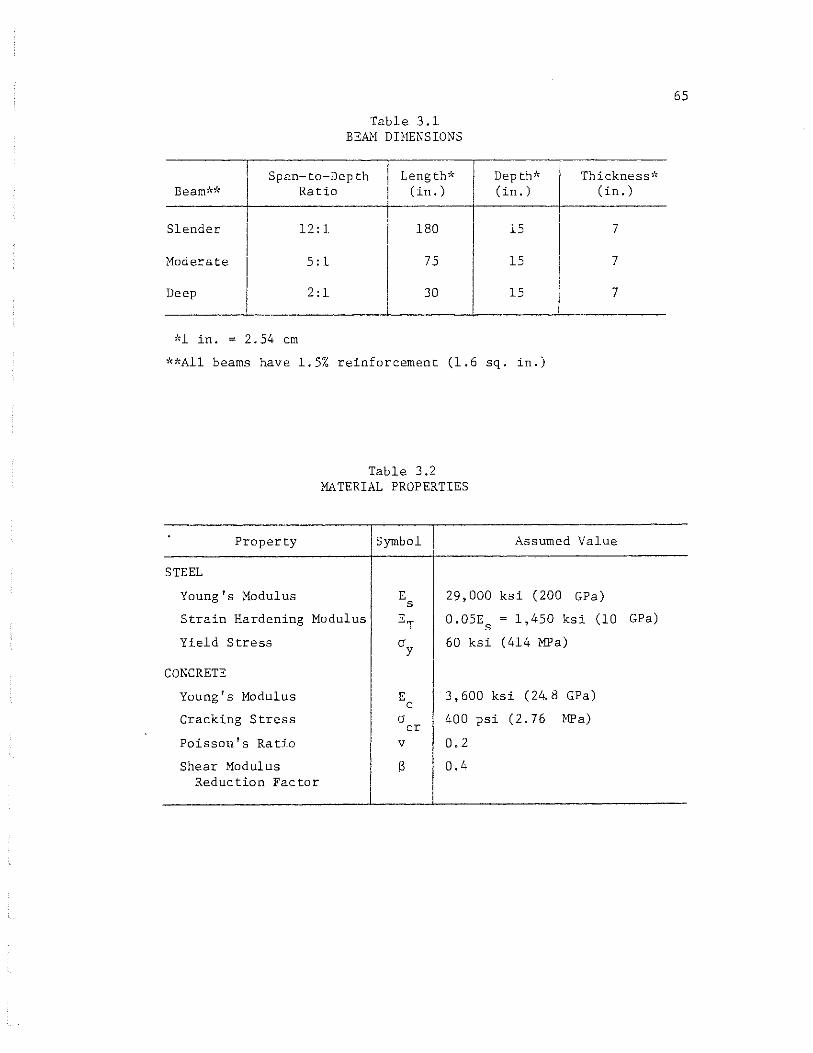
Table 3.1 BEAN DIHENS IONS
Span-to-Depth Length* Depth'' Thickness~\::
Beam** Ratio (in.) (in.) (in.)
' I Slender
I 12:1 I
180 15 7
Moderate 5:1 75 15 7
Deep 2:1 30 15 7
''l in. = 2.54 em
''*All beams have 1.5% reinforcement (1.6 sq. in.)
Table 3.2 MATERIAL PROPERTIES
Property
STEEL
Young's Nodulus
Strain Hardening Modulus
Yield Stress
CONCRETE
Symbol
E 29,000 s
E~ 0.05E ' s
Ciy 60 ksi
Assumed Value
ksi (200 GPa)
= 1,450 ksi (10
( 414 MPa)
Young's Modulus
Cracking Stress
Poisson's Ratio
E c
3,600 ksi (24.8 GPa)
Shear Modulus Reduction Factor
Ci
v
s
cr 400 psi (2.76 MPa)
0.2
0.4
GPa)
65
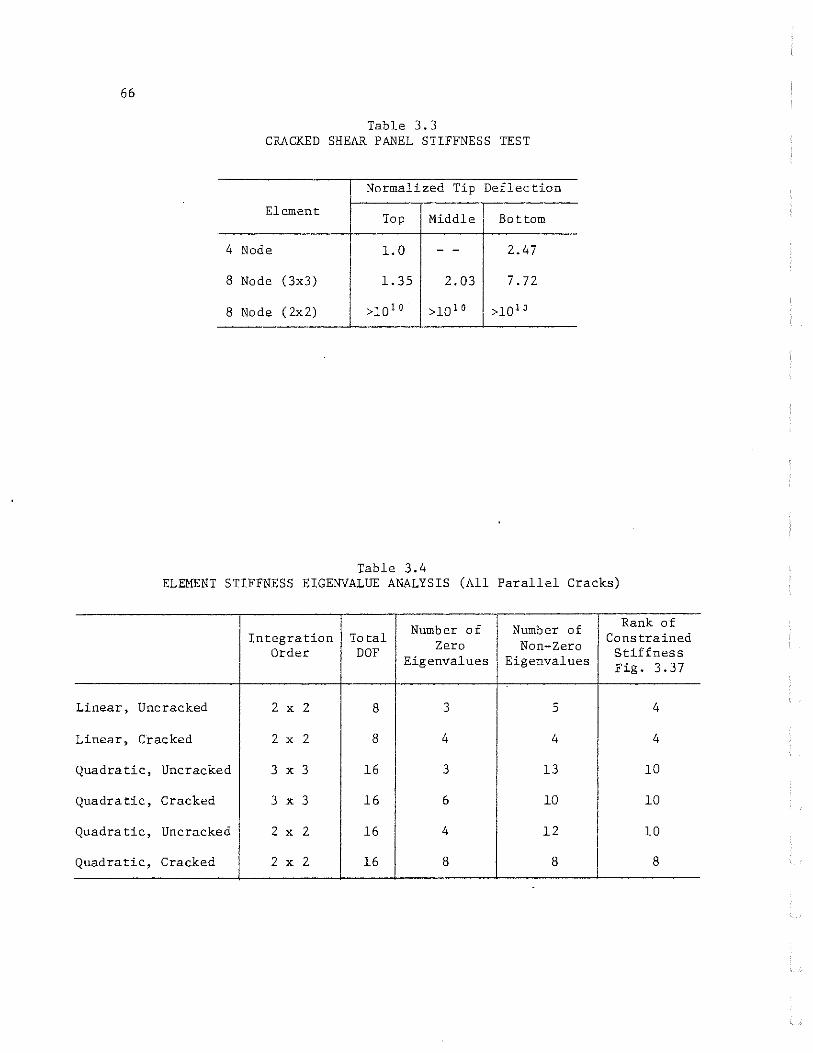
66
Table 3.3 CRACKED SHEAR PANEL STIFFNESS TEST
Normalized Tip Deflection
Element Top Middle Bottom
4 Node l.O - - 2.47
8 Node (3x3) 1.35 2.03 7. 72
8 Node ( 2x2) >10 1 0 >10 10 >10 1 0
Table 3.4 ELEMENT STIFFNESS EIGENVALUE ANALYSIS (All Parallel Cracks)
Number of Number of Rank of Integration To tal
Zero Non-Zero Constrained
Order DOF Eigenvalues Eigenvalues
Stiffness Fig. 3.37
Linear, Uncracked 2 X 2 8 3 5 4
Linear, Cracked 2 X 2 8 4 4 4
Quadratic, Uncracked 3 X 3 16 3 l3 10
Quadratic, Cracked 3 X 3 16 6 10 10
Quadratic, Uncracked 2 X 2 16 4 12 10
Quadratic, Cracked 2 X 2 16 8 8 8

67
Table 3.5 ELEMENT STIFFNESS EIGENVALUE ANALYSIS (Randomly Oriented Cracks)
Element Integra ted Total Number of Zero Order DOF Eigenvalues
Linear, Uncracked 2 X 2 8 3
Linear, Cracked 2 X 2 8 3
Quadratic, Uncracked 3 X 3 16 3
Quadratic, Cracked 3 X 3 16 3
Quadratic, Uncracked 2 X 2 16 4
Quadratic, Cracked 2 X 2 16 8
Table 3.6 EFFECTS OF NORMAL STIFFNESS REDUCTION FACTOR
Normalized Tip Deflection (See Fig. 3.35)
--s -3
a = 0 a = 10 a = 10
Top Bottom Top Bottom Top Bottom
4 Node 1.0 2.4 7 1.0 2.4 7 0.976 2.37
8 Node (3x3) 1.35 7.72 1. 34 7.63 0.85 3. 72
8 Node (2x2) >1010 >1010 310 1301 3.26 13.18

68
"[ypico I Triongu lor Concrete Element
Node I Point
Typicol Triongu lor Steel Elements
Steel Reinforcement
Fig. 1.1 -Finite Element Model for Reinforced Concrete Beam, Ngo and Scordelis (25).
Fig. 1.2 - Discrete Representation of a Single Crack, Ngo and Scordelis (25).

p:
1..-
Fig. 1.3 - Discrete Crack Representation with Spring Elements to Model Aggregate Interlock, Ngo, Scordelis, and Franklin (26).
"" )
_\, -t-J-- Edge of Concrete
(a) Exterior Crack
- 1-
\. Edge of Concrete
(b) Interior Crack
Fig. 1.4 - Discrete Crack Representation at Interior and Exterior Grid Points, Nilson (24).
69

70
c h
L J
Fig. 1.5 -Discrete Representation of Two Cracks, Al-Mahaidi (l).
Fig. 1.6- Interpretation of the Smeared Crack Model.

y
u 2 u - 11--------e-
-----------------x
Fig. 2.1 -Bar Element for Reinforcement
{ ____ _.~u L c \__2 Degrees of
' Freedom at Each Node
L
Fig. 2.2- Linear, Four ~ode, Isoparametric Element .
• v ,_ _ _,,_ _ _. __ u
.7) '-._ 2 Degrees of L..._g Freedom at
Each Node
Fig. 2.3 -Quadratic, Eight Node, Isoparametric Element.
71

72
7)
(-1, 1) r----1-----, (1, 1)
2. 4.
1. 3. (-1,-1) ,___ ___ ___. ( 1 '-1)
· 2 4 Gauss Point Location for 2x2 Integration in Flg. • -Isopararnetric Coordinates.
(-1 ' 1) r----1------., (l ' 1) •3 6 •9
•2
•1 e4 •7 (-1,-1) '---------' (1 '-1)
_L ~
_L ~
Eig. 2.5 - Gauss Point Location for 3x3 Integration in Isopararnetric Coordinates.
577
775

p
t.PI
Actual Solution
Equilibrium Correction
New [K] Each Iteration
u
Fig. 2.6 - Single llegree of Free,lom Represenlntitln of the Ncwton-Haphson Solution Procedure.
" w

74
1
E
Steel Stress-Strain .ReI at ion
'---.E T
E=29,000KSI ET = (0.05) E
Oy = 60 KSI
Ey = 0.00207
oL-------L-------L-------~----~ 0 1 3 4
Fig. 3.1 - Uniaxial Stress-Strain Curve for Reinforcing Steel.
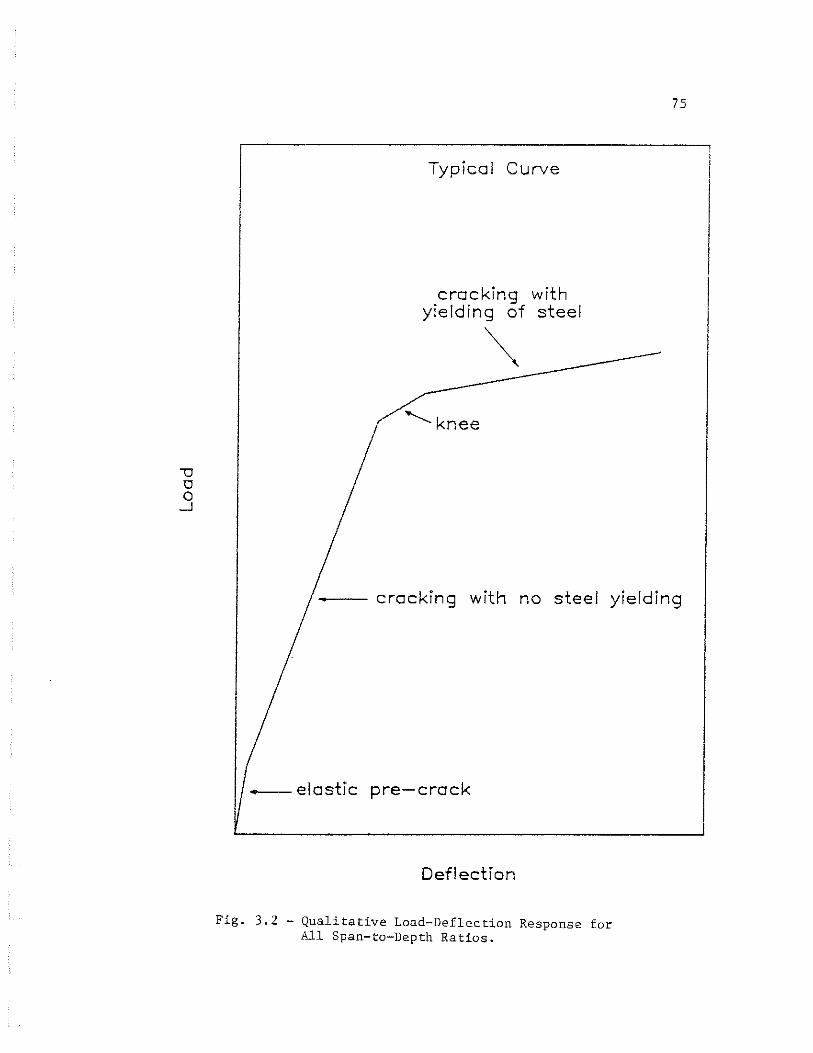
\J a 0 _j
Typical Curve
cracking with yielding of steel
~ .......____knee
75
cracking with no steel yielding
--elastic pre-crack
Deflection
Fig. 3.2 -Qualitative Load-Deflection Response for All Span-to-Depth Ratios.

76
0.50~------------------------------------~
4 node elements distributed load
0.45
0.40
1!3-
0.35
..c 0.30 0 c ·-......... en Q_
0.25 ::c. - ~
""0 0 0 0.20 _j
I I I I I I !It ttl I I I I I I T 15" i..
0.15 90"
LEGEND
0.1 0 [!J - 1 element thru depth (!)- 2 elements thru depth A-5 elements thru depth
0.05 '
o.oo--~~~---L--~--~--L-~--~--~~
0.0 0.5 1.0 1.5 2.0 2.5 Mid-Depth Deflection, inches
Fig. 3.3 - Load-Deflection Curves for Slender Beam, Distributed Load, Linear Elements.

77
0.50~----------------------------------~
8 node elements distributed load
0.001----~-J--~--~--~--L-~~~---L~
0.0 0.5 1 .0 1.5 2.0 2.5 Mid-Depth Deflection, inches
Fig. 3.4 - Load-Deflection Curves for Slender Beam, Distributed Load, Quadratic Elements (Reduced Integration).
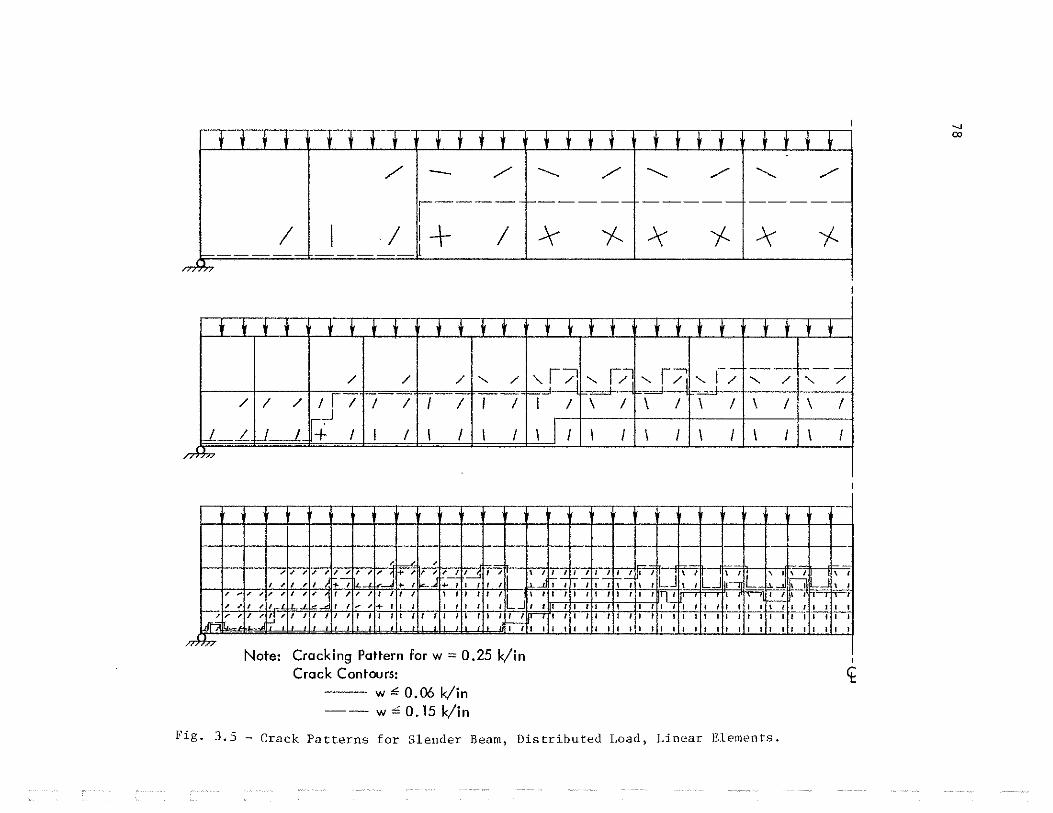
+ ' ' + t + t t t ' t t + ' + ' ./ - / .......__ /
,-----·-r--------I
I I I I+ I
""'
' ' ' f f ' f ' ' ' ' j_
/ / / '- /
/ / / I I I I I I I I I _j
I / j_ I f".+ I I I I I I I m
-
' ' '' '' " ' ' ' ' + ' ' ' ' I I--" I ' I
I ' I ' I +I ""
._j +- I k +.I I I I I
' '' " ' I ' ' ' I ' I I I I I I I I I I IL I
' ' I " '-"'' I, ,.. + I I I ' I I I I I _j I
,,: ' ' I ,~"I I I I I I I I I I I I I I I I I I I I I I
t"!ll -177
Note: Cracking Pattern for w = 0,25 k/in Crack Contours:
w <= 0,06 k/in -- w =' 0.15 k/in
--Y '!-
_lj_lj
"r/1 '- 1/l I I \ I
\ I I I I
I I I I I I I
~~· """"' IJ-; '' I I I I I I I I I I I I I
I I I I I I I I ' '' I I I I I I I I
' ' '' '' ' ' ' '
t t + t t t t t .......__ / '-.... /
------ ------
)( '!- )( '!-
_Lt t t _i_tij
, r7 -- -- r--·-'-I/ '- / '- /
:==!- --\ I \ I \ I \ I
\ I \ I \ I \ I I I
I \ I I I
L \ ' \ I \ I
,LJI ~LJ In __J '" l._.J I ' ' 1: t_; - ' I ' I I
I I I I I I I I :r+--: :;--I I I I ' ' ' I I ' ' '' '' ' '' i ' ' ' ' '' ' ' ' ' '' ' ' '' '' ' ' ' ' ,,
't
Fig. 3.5 - Crack Patterns for Slender Beam, Distributed Load, Linear Elements.
_, "'

,- ---- ----- ---- -----
/ I _i I I I I I I I I I ----
+ ' t ' t t t ' t t t t t t t ' t t t ' t t t J
/
I / I I I I I I I I I I I I I I I I I I I I r---- ---
J I I -- :::_ I I I I I I I I I I I I I I I I I I I I -m
I r ' I 'I r I _':-" I I' I I I I I I I -
"/ ; I -I +1 I U ,I I I 'I I I I r. I I II !~ I I I I '1-i Jl 1-;-~ --, r-- I -rr
' " /" , I IU I ,_. '! r I I I I I I I I I I I ' ' ;u J: 'rJ r:l' ' ' ,, I ,.,. / ,. ,, I I I I I I IL l,iJ' ' I I '' I I I I I I ' ' I I I I ' ' I I I
I : -~ -~ - -' ' ~U- 1_1 ~~ I I I I I I I I I I I I Yl-' I I I I I I I I I I I I I I ' ' I I I I ' ' ' ' I I
"-' Lt. J) I I I I I I I I I I '' I I ' ' I I I I I t '' Note: Crocking Pattern for w = 0.25 k/in
Crack Contours: -- w =" 0.06 k/in -- w o£: 0.15 k/in
'' '' I I I I I I '' I I I I '' I I I I '' I I
Fig. 3.6 - Crack Patterns for Slender Beam, Distributed Load, Quadratic. Elements (Reduced Integration).
I I '
<t ..._, 'D

80
..c () c
'-.... rn 0.
.::£.
-iJ 0 0 -'
0.50r----------------------------------.
0.35
0.30
0.25
0.20
0.15
0.10
0.05
Element Type Comparison For Distributed Load - Fine Meshes
<t I I
111111111111 I 111111111111 i 1------ 90"
LEGEND
<!)- 4 Node Element C!l- 8 Node Element
o.oo·m---~~--~--~--~--~~--~--~~ 0.0 0.5 1.0 1.5 2.0 2.5
Mid-Depth Deflection, inches
Fig. 3.7- Comparison of Load-Deflection Curves for Slender Beam, Distributed Load, Linear Elements and Quadratic Elements with Reduced Integration.

81
50~----------------------------------~
4 node elements point load
01----L---~~--~--~--~--~--~--~~ 0.0 0.5 1 .0 1 .5 2.0 2.5
Mid-Depth Deflection, inches
Fig. 3.8 - Load-Deflection Curves for Slender Beam, Concentrated Load, Linear Elements.

82
8 node elements point load
45
018---~--~~--~--~--~--~--~--~~
0.0 0.5 1.0 1.5 2.0 Mid-Depth Deflection, inches
Fig. 3.9 - Load-Deflection Curves for Slender Beam, Concentrated Load, Quadratic Elements (Reduced Integration).
2.5

I/ -----f------/ / ----- ----- / ------ / I ~-----
__ j
I I 4-- I -\" I -\" '/. -\-' '!-r-----------
-Hn
r-1 ,J~ r- --- --- r----/ / / _j / I ':J / " / " / " /
/ / /I / I I I I I I I I I I I I I I I I I \ I r-J
__ j_ I I I I I I I I I I I I I I I I I I I I I I .Jb>
~- ' ' ---" --"- ~ L. \ L
' ' ' ~ ' ~ /I I '' /1 / I I " ' ~~ I I J I !__;I ~/ I~" I i /' ' I I I I I I I I I I \ I
' ~ ~ _J
I I / 1,-_ + I I lk \ I j I I~ ' I I I I I I I I I I I I I' I I I I I I I I I I I I I I
' ~ I 1 I / I I I I I I I I I I I I I \ I I I I I I I I I I I I I I I I I I
...L .L..iJ I I L_j I I I I I I I I I I I I I I I I I I I I I I I I I I I I I I I I I I I I I I
, '' " / I / I I I I I I I I I I I ~~· I I I I I I -I I I I I I I I I I I I I I I I I I I I I I I I I I I I
L.LL .J I I I I I I I I I I I I I I f I I I I I I I I I I I I I I I I I I I I I I I I I I I I I I I I I I I I I
7'77 I Note: Cracking Pattern for P = 30 k
Crack Contours: <t -- p <= 10 k -- p ~20 k
Fig. 3.10- Crack 'Patterns for Slender Beam, Concentrated Load, Linear Elements.
P/2
co w
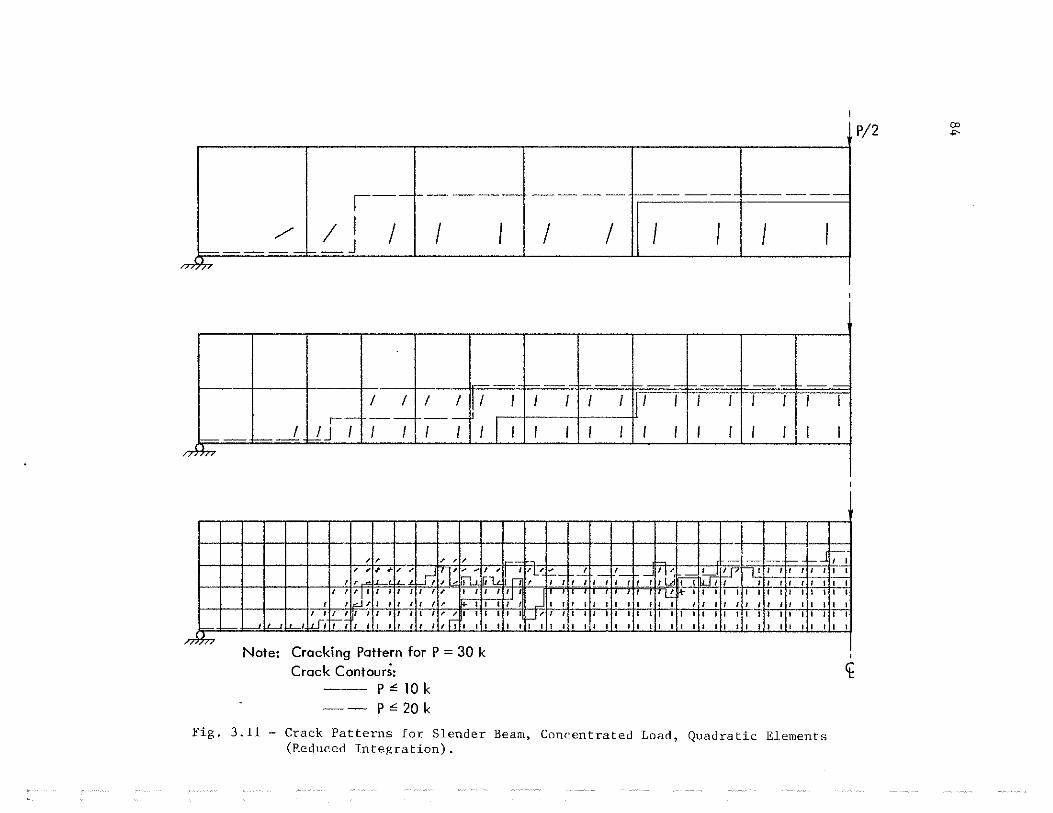
~---1------ ---- ---- ------
/ ;I I I I I I I I I I J ~
I I I I I I I I I I I I I I I I I I ,-1---- --
I I I I IJ I I I I I I I I I I I I I I I I I h7
c--" / " -- - I I
/ ~.,. .,. " / ,-I T ' ' I ' I 'L' t7~ I
;--; I
r,~ I!' f.-=i I
fi-J I I I I I I I I I
I / -'-- _jl it' lr,l_ in ' t;--; ~--; IL<I hl! I I I I I I I I I
I I J I I I I I I I ' I I I I I I I r- I I I I I I I I I I I I I I I
I I ..- ~ I I I I I I ' I I I I I I I I I I I I I I I;~ I I I I I I I I I I I I I I I I I I I I I I I I I I I / / I I I I I ·~ ... , I I I I I I I I I I I I I I I I I I I I I I I I I I I
1U1 r,-; I I I I I I I I ,JJ, I I I I I I I I I I I I I I I I I I I I I I I I I I I I I I I I I I .l n
Note: Cracking Pattern for P = 30 k Crack Contours: ~
p"' 10 k -- p"' 20 k
Fig, 3.11- Crack Patterns £or Slender Beam, Concentrated Load, Quadratic Elements (Reduced Integration).
P/2 00 -<--

UJ Q_
:.;;: .
"0 0 0 _l
85
50~------------------------------------~
40
35
30
25
20
15
Element Type Comparison For Point Load - Fine Meshes
err rz1
m
' '
l
,J!J
- G!J' O!T
<t I I P/2
>I 90"
LEGEND
"' - 4 Node Element [!]- 8 Node Element
01~--~~---L--~__l~~--_l_--~__l--~
0.0 0.5 1 .0 1 .5 2.0 2.5 Mid-Depth Deflection, inches
Fig. 3.12 - Comparison of Load-Deflection Curves for Slender Beamt Concentrated Load, Linear Elements and Quadratic Elements with Reduced Integration.

86
..c ()
c
"'"' (/)
0. .X
-'"0 0 0
...J
3.0~-----------------------------------,
4 node elements distributed load
2.5
2.0
1.5 tf ,. Tlt!!lttttt
T 15"
1 1.0 "' f?T : 37 .5'
LEGEND .,_, element thru depth
"' - 2 elements thru depth 0.5 ""'- 5 elements thru depth
0.018---~--~----L---~---L--~----~---
0.0 0.2 0.4 0.6 0.8 Mid-Depth Deflection, inches
Fig. 3.13 - Load-Deflection Curves for Moderate Beam, Distributed Load, Linear Elements.

..c ()
c ·-"'-.. (/J
a. ..:s: -
\J 0 0
..J
87
3.0r-------------------------------------~
8 node elements distributed load
2.5
.2:!
2.0 .m· -'"" .
1 .5 <k
tltttl!lllt
T 15"
1.0 1 ,l ~
37.5"
LEGEND
C!J - 1 element thru depth 0.5 C!l- 2 elements thru depth
.... - 5 elements thru depth
0.0-----L--~----~---L--~~--~--~--~
0.0 0.2 0.4 0.6 Mid-Depth Deflection, inches
Fig. 3.14 - Load-Deflection Curves for :Hod era te Beam, Distributed Load, Quadratic Elements (Reduced Integration)
0.8

Note: Cracking Pattern for w = 1.7 k/in Crack Contours:
w:;; 0.5 k/in -- w"' 1.0 k/in
• t t
/ ----
I I h
t t j
I I / _ _j
I I f7
• /
I /
I / / /
[)I / /
I / / /
I / / /
I / / ~
"' !LI + I
77
t t t t t t t t t t t t r I / ------
//
I 1--_j
+ I + I
ttttttttt t t t /
I ~~ l_;l " I/ ---
-\- " / _j J _j
I I / I I I I \ I
+ I I I I I I I
' t t t t t t t t
/ ~ / / /_j ~ ~ ~ ~ ~
/ / I / I / ~ / I / I _], - -/ / I / / / I I 1 r1 ! I I I I I I I I
/ / I / / / T- I I I l_l 1 / I I I / I /
I / I I ' / I I I I / I I I I / I I I I
-;_ I II I I I I / I I I / I I I I I / I I I I I' ' ' / / I / I / I / I / I I I I
+ I I I I I I I I I I I I I I I I I I I
Fig. 3.15- Crack Patterns for Moderate Beam, Distributed Load, Linear Elements.
I
'
' I 't
"' "'

Note: Cracking Pattern for w = 1.7 k/in Crack Contours:
-- w "'0.5 k/in -- w"' 1.0 k/in
t t ' ,,,,,,,,,,,,
1-----r---· ----- ---------
./" / I I I ~~ I
J.J_jJ_li_tJ t t t t t t t
,- ---- --- --1 L/ / / / / / /
L := ----= / 1/ I / / I I I I
,-J I I 1---- I I I I I I I
~
" ' ' t ' .1. 1 .1. t t t ' t t
/ / / / / / ~
,r;; t::. -/ L b71 / / / / / / / = r- -J ,. rr ' / / / / I / / I / I II~_, I I
l-J/ / / / / I I I I I I I I I I I I I I I / / / / I I I J, I' • I I I I l I r;-,
\ I/ / - - / I I I / I I I I I I I I I I I I I I I/ / / / I / I 'II' I I I I I I I I I I I I I I I
/ ... + I -1- jl I I I I I I I I I I I I I I I I I I
77 ' I <t
Fig. 3.16- Crack Patterns for Moderate Beam, Distributed Load, Quadrati.c Elements (Reduced Integration).
CXl
"'

90
3.0.-----------------------------~--~
Element Type Comparison For Distributed Load - Fine Meshes
0 .0'dl----.....l-----L--_..J..-__....I __ J..._ _ _.L__...J..._ _ _j
0.0 0.2 Mid-Depth
0.4 0.6 Deflection, inches
Fig. 3.17 - Comparison of Load-Deflection Curves for Moderate Beam, Distributed Load, Linear Elements and Quadratic Elements with Reduced Integration.
0.8

(/) Q.
~ .
"0 0 0 _j
91
1 20 ;-------------------------,
100
80
60
40
.:f • • . . .
20
4 node elements point load
)!l
(£ I
P/2
T 15"
1 f---- 37. 5" ----i
LEGEND
"'- 1 element thru depth "'- 2 elements thru depth "'- 5 elements thru depth
a----~--~----~--~--~----~--~--~ 0.0 0.2
Mid-Depth 0.4 0.6 0.8
Deflection, inches
Fig. 3.18 - Load-Deflection Curves for Moderate Beam, Concentrated Load, Linear Elements.
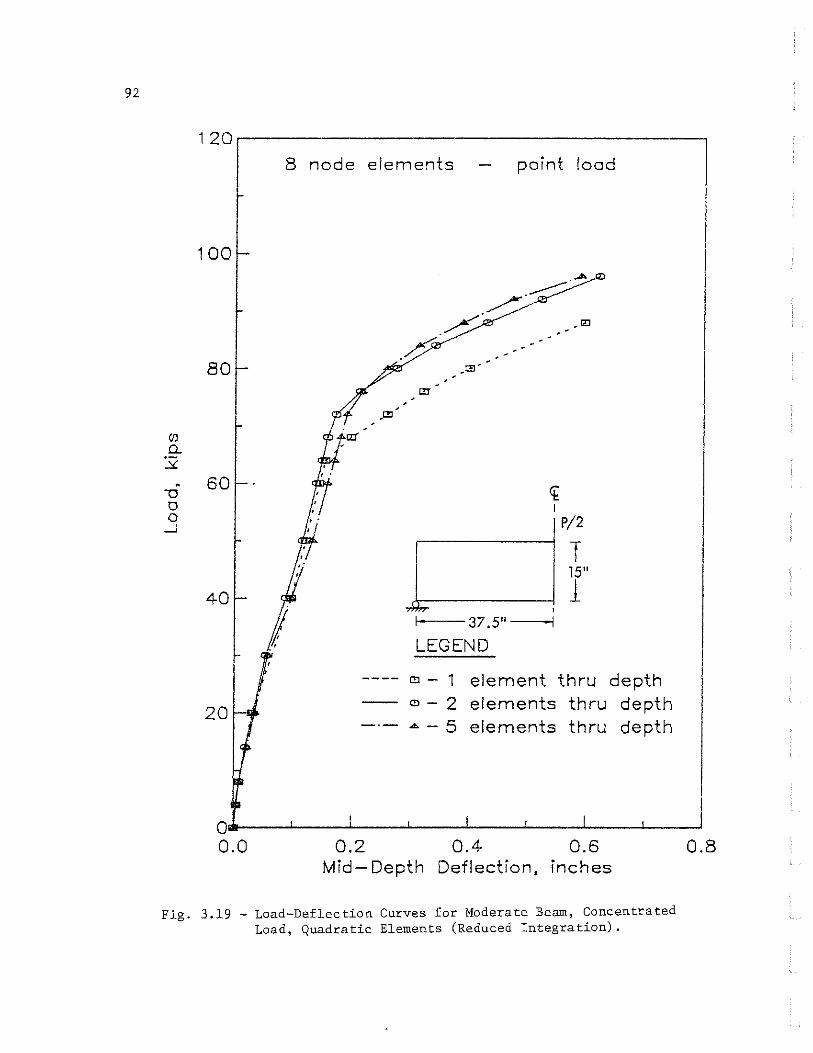
92
120,------------------------------------, 8 node elements point load
100 ....
__..--;; ~
~ ·"" » 80 ·"".
"" . flO
"' o._
~ . -a 60
~ 0 I 0 P/2 _j
T 15"
40 l 37.5"
LEGEND
(!] - 1 element thru depth
20 (!)-2 elements thru depth ""-5 elements thru depth
0._--~--~--~--~--~--~--~--~ 0.0 0.2 0.4 0.6 0.8
Mid-Depth Deflection, inches
Fig. 3.19 - Load-Deflection Curves for Moderate Beam, Concentrated Load, Quadratic Elements (Reduced Integration).
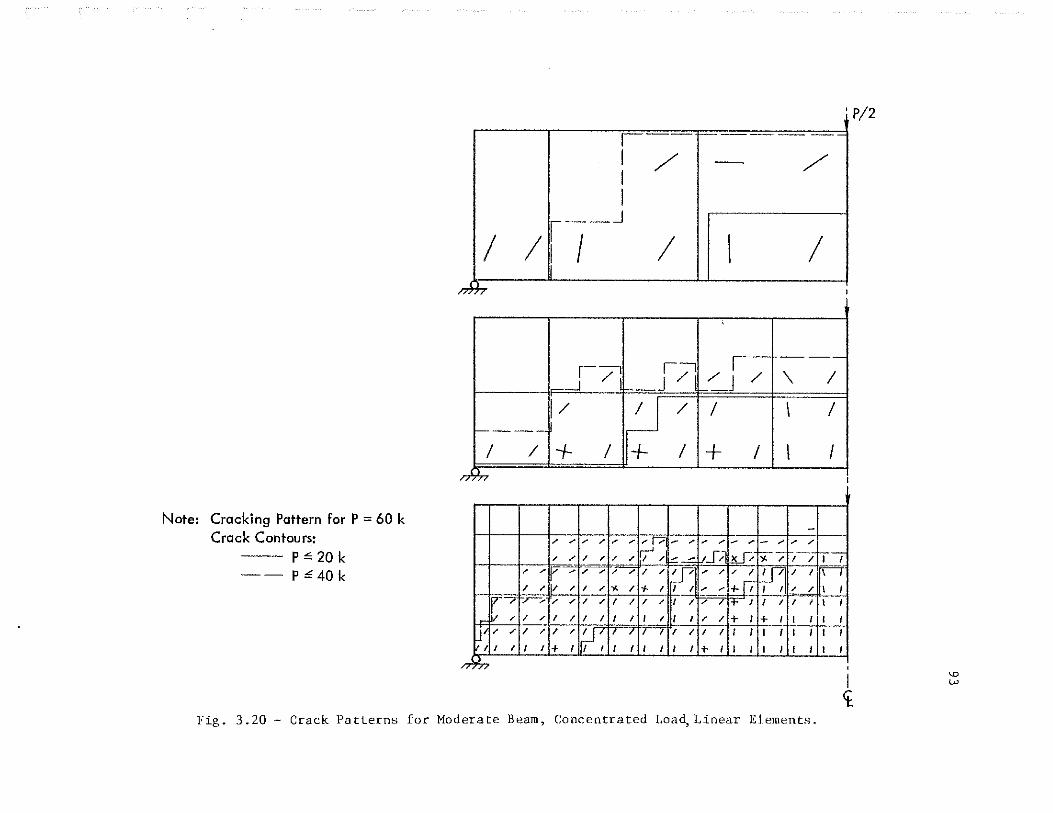
Note: Cracking Pattern for P = 60 k Crack Contours:
p "' 20 k -- p <f40 k
'P/2
I I / -- / I I
I I ,--J I I I I I
b I
1,71 ~- ----17 / J / '\ I
--' J I/ I;J / I \ I
r-----
I / + I + I + I I I 77 I
-/ / / / / / .-D - /
--/ / - / - ,.. / ,..
/ / / / / "r: / - -!J_[, 1Lf/ ~-T/ T/ / ... F .... ,.,. ,.. / ,.. /
/ ~/ / / / / ~/I I I' I / / / / /
/ " / .,. I I / / / -1-jt I I ' I l I r7 ;;-, / / / / I / I ...-)- / / / .,_ I I / I I \ -~ IV ,.. / ,- I / I I I I I I I I / / + I+ I I I I I
~~ ~ / / / / , I~ I I I
I I I + I I I I I I I I
7'77
/ I I I I I
I + I I I I
I I I I I
I I I I I
' I ct
Fig. 3.20- Crack Patterns for Moderate Beam, Concentrated Load, Li.near El.ements.
"' w

Note: Cracking Pattern for P = 60 k Crack Contours:
p "'20 k -- p "'40 k
~- ---------!---------I 1..-------
_ _j I I I I b '
~
,- ,--- --------I / 1----_ __:-::__ / / / / / I ~-=+ t--·
/I / / / I I I I I l_J
I I _/ J / I I I I I I I i-T
'
-- - ~ ~ / ~- -- -- -- -~ ~ - ~ - ~ -- - -- ~ ~ ~ ~ /
~ ~ [<, ld-::. r;-/ 7/ ~~ '/1- ~I/ ';;t:J -I I - 1 - r ...... ,•-~ /
~ / / / / / / I ' p / / ' L. '" /
/ / .... -/ / / ...... f / / / I / + / I I I 1 r, LP / / / / / / I .1' ,. - I / + .-I I I I
1;, ~1 !r- lc I I L-"1 / / / / / / I I I -/ I I /!fi- + I I
I .-, rl / / / I I I I I / I I I I I I I I (/ ,I, J_L li 1'1/ I I I I I I I I I I l I
"' I Ct.
Fig. 3.21 - Crack Patterns for Moderate Beam, Concentrated Load, Quadratic Elements (Reduced Integration).
P/2 "' .,..

(/) Q._
:s<: . \J 0 0
_J
95
120r---------------------------------~
100
80
60
40
Element Type Comparison For Point Load Fine Meshes
"' ' JZl
'
IZl
~[!) ~
"' ~
~
P/2
T 15"
l """ 37.5"
LEGEND
a:~- 4 Node Element C!J- 8 Node Element
QG---~--~--~----~--~--~--~~___J
0.0 0.2 Mid-Depth
0.4 0.6 0.8 Deflection, inches
Fig. 3. 22 - Comparison of Load-Deflection Curves for the Hader ate Beam, Concentrated Load, Linear Elements and Quadratic Elements with Reduced Integration.

96
20~----------------------------------------~
16
.r:: 1 2 Q c
......... [/) Q. ~ 10 .
"0 0
_g 8
6
4
2
4 i'Jode Elements - Distributed Load
,.~,-_....~Is" rl 15"
I • • I
LEGEND
~ - 2 Elements Thru Depth "' - 5 Elements Thru Depth o - 1 0 Elements Thru Depth !!l - 1 5 Elements Thru Depth
0--~---L--~--~-J---L--~--~~--~
0.0 0.1 0.2 Mid-Depth o~;flection, inches
Fig. 3.23 -Load-Deflection Curves for Deep Beam, Distributed Load, Linear Elements

..c u c "-(}) 0.
.::£.
. "Q 0 0 _j
97
20.-------------------------------------~
1 6
14
12
10
8
6
4
2
8 Node Elements - Distributed Load 2x2 Integration Order
/ /---- -
-~------./- ""'-
~----~-~
?·--. '
t' t ~
f T
/?' 15" 1
.t t---15"--1
' LEGEND
C!l-2 Elements Thru Depth ... - 5 Elements Th ru Depth
.<!]
['J- 10 Elements Thru Depth
o----~~~~--~--~--~--~--~--~~
0.0 0.1 0.2 Mid-Depth Deflection, inches
Fig. 3.24 - Load-Deflection Curves for the Deep Beam, Distributed Load, Quadratic Elements (Reduced Integration).

98
.s= u c
.:.:::. (/)
a. 32 -"0
0 0
__J
20r----------------------------------.
16
14
12
10
8
6
4
2
8 Node Elements - Distributed Load 3x3 Integration Order
~
/
./ ./
/.l!l /r·--
#~-. '
tf' . '
t <t
#4f I
T
# 15"
l ·'
.t f---15'!..-J
LEGEND
(!) - 2 Elements Thru Depth ... -5 Elements Thru Depth [!]- 10 Elements Thru Depth
0*-~--~--~--~~--~--~--~~--~
0.0 0.1 0.2 Mid-Depth Deflection, inches
Fig. 3.25- Load-Deflection Curves for the Deep Beam, Distributed Loa~ Quadratic Elements (Full Integration).

t + t + -
,---I I I
I I I I 1/
f---_j
I I L _ _j
~,.,
I '\ I I Cj;
t I t t
/
"''l' 7l""l"'' Ill////
I -'177fT ... , ... "I' ~ I .1 J .111 .1 I "I tl /l//1"1' /117177 11/tll'!tAt.i
I'
·r 'I' A" "'I' ··y t "l' lff' 1///JI/t//J 1/;,l I
"1"1' '1"1' rr ~,!...!,,, I 1///,t/.l'l/l.t!.J/_ II I
,, I'
I I ,117717"~ 1~ ·r .. l' ·t j" ,
1, ,
1/ ,
Jtli//1.1//1//_LIIt
"I' 'I' 'I' T :r 'r. ~~ '"' IJ/JI/1,;/ t/V.tlllh I
' lj' 'I' '1"1"1'-'1/-<!0j' ''~ II AI .t//1/l.llrTI-11 J/.-Ui I
I 'I' 111 X '!' ':1;'31' 'I' 11/IKI I I f.IJ)/ ///;IJ ..-,llll'.rlh I
II _jJ/ il//11 '1?'1' 'I' 'I' 'I' 'II' ' /!/1.1 tl/ ,..J/ " I I I I/ I I I' I I I
11111" I II II! I
lllnrf llf Ill lh .!..llnrf II tU 1lr
''1\-HH il II II I
·~I'RIH!j~t,M: ' ' Ill Ill Ill Ill I
Cj;
• • t j +
17 I /l /
I J I / ) / / I I I I /1 /
I I; r- fi--I I <:...1/ I I I I / 'J / I I I / / :> rrl I
-- / I I I I I I
I I'- L--' l[iJ I I ...... ' \ \ I t,
Cj;
Note: Crocking Pattern for W = 8 k/in Crock Contours:
W <:. I .4 k/in ---- W <:. 4.0 k/in
t t
I I
I I I I I I / /
I I I I I I/ I I I // //
I I I I // /I I I I I // / I I I I / / /I
I I I/ // /I 1/
I / / I I I I I I 1/ / / I/ 1/ I , r; I I /I I I I
I ~/ 1'-' II f7 I I I -,- I I/ ITI I I I I I 11- \ I \ I ' I I I
I I \ \ \ I I I I I I I
~ ...
Fig. 3.26 - Crack Patterns for Deep Beam, Distributed Load, Linear Elements.
t
/ / I/
I I I I / / I/
/ / / /
I I / /I I I I I I J1l I I I I I I I I I I I I I
I I I I I I I I I I I I I I I
•
I I I I fit ,, I I I I
II I I I I I I I I I I I I I I I I I I I I I I I I I I I I I I I I I I I
tf
"' "'

J t _i _t
,-I 1/ / I
/ / I 1 I r_j I
/ - I I I I r----o I I \ I \ I I
...... ~
Note: Cracking Pattern for W = 8 k/in Crack Contours:
W ~· 1.4 k/in --- W ~ 4.0 k/in
I I I / '
I Ill I I/ I 1 I I I I I I / til I
I I /1/ II t;fFTJI II I ;II I I/ / I I I
1 II I ;I; 1 I I 1 111! I I I I f71 I I (_JFl~ _Lfi I I I I I I I;:; I IV / I I I II I I I , 1; / / /I/ I I I I I I I 1-_!_:: !J" - \. I I I I I I I I
;'-"".--1111111111 /j_/ '\ I 1 \ I I I I I I rm
If
+ + -~ r
' ' :1 II/ I'
l'~jll/1 ~~ ~
;~~~~~~~~~~~~ / 11
' / ' .I """I/ / [f' I
I tlf J I // /I' .1 • r I I I I I 1 .1' " /,
I I/ // / ;r I I I I ''''""",./ ;/JIIltli'' 1//J /"// Jll/1 1/ ~ I 'I' .I/ / f. ~: II I I / I I 1
J/11/ /VI ~/ ll,Jt'fl Ill -~~ J I I 1 .1 ; I I I I I II I I 111/1/// J 111 I II I /I/ /,Ai> }{'''" ,,(:.- ill I/// Ill ltl 1111 .1// IJir""lll \II I "1' .1// / __ II I f I I IV// I I I I 1 I I I I
/.L If\ I J I I T7 / .... 1.!1 I // I I I I ! T I
" ==-I \-~~I t I I II I I I I I I I ~ ~I t : I "" I I
'""-
,__. 0 0
<k
Fig. 3.27- Crack Patterns for Deep Beam, Distributed Load, Quadratic Elements (Full Integration).

101
20~--------------------------------,
~ (.) c ·-........... (I)
0. :s;: -"0
0 0
_J
18
16
14
12
10
8
6
4
Element Type Comparison For Distributed Load
..m'
' !!l' '
<t I
!--15'~
LEGEND
T 15"
1
(!)- 4 Node Element (1 5 Thru Depth) 2 [!J- 8 Node Element (1 0 Thru Depth)
QIG-----~~--~--~------~----~--~~--~
0.0 0.1 Mid-Depth Deflection, inches
Fig. 3.28 - Comparison of Load-Deflection Curves for the Deep Beam, Distributed Load, Linear Elements and Quadratic Elements With Full Integration .
0.2

102
320r---------------------------------~
4 Node Elements Point Load
280
240
200
(/) a. ~ . 160
"'0 ~ 0 0
P/2 ....J
T 120 15"
1 J--15''--j
80 LEGEND
""- 5 Elements Thru Depth ~-10 Elements Thru Depth
40 C!)-15 Elements Thru Depth 1!1- 20 Elements Thru Depth
0--~--~--~--~~--~--~--~~--~
0.0 0.1 0.2 Mid-Depth Deflection, inches
Fig. 3.29- Load-Deflection Curves for the Deep Beam, Concentrated Load, Linear Elements.

UJ Q_
~
-a 0 0 _j
103
320.---------------------------------~
280
240
200
160
120
80
40
8 Node Elements Point Load 2X2 Integration Order
.!!l'
ai
·"'· /___..~
' OJ '
r;6 OJ
[!J
r;6 OJ
OJ ' [!]
' [!J
'
/ I
'
/ /
/
__ )'J/ LEGEND
/
nh 15" 1 4 • I
.·/ =. ~-=-' · <!)- 2 Elements Thru Depth
"" - 5 Elements Thru Depth [!J - 1 0 Elements Thru Depth
o,._ __ L-_J---L--~--~--L-_J---L--~~ 0.0 0.1 0.2
Mid-Depth Deflection, inches
Fig. 3.30 - Load-Deflection Curves for the Deep Beam, Concentrated Load, Quadratic Elements (Reduced Integration).
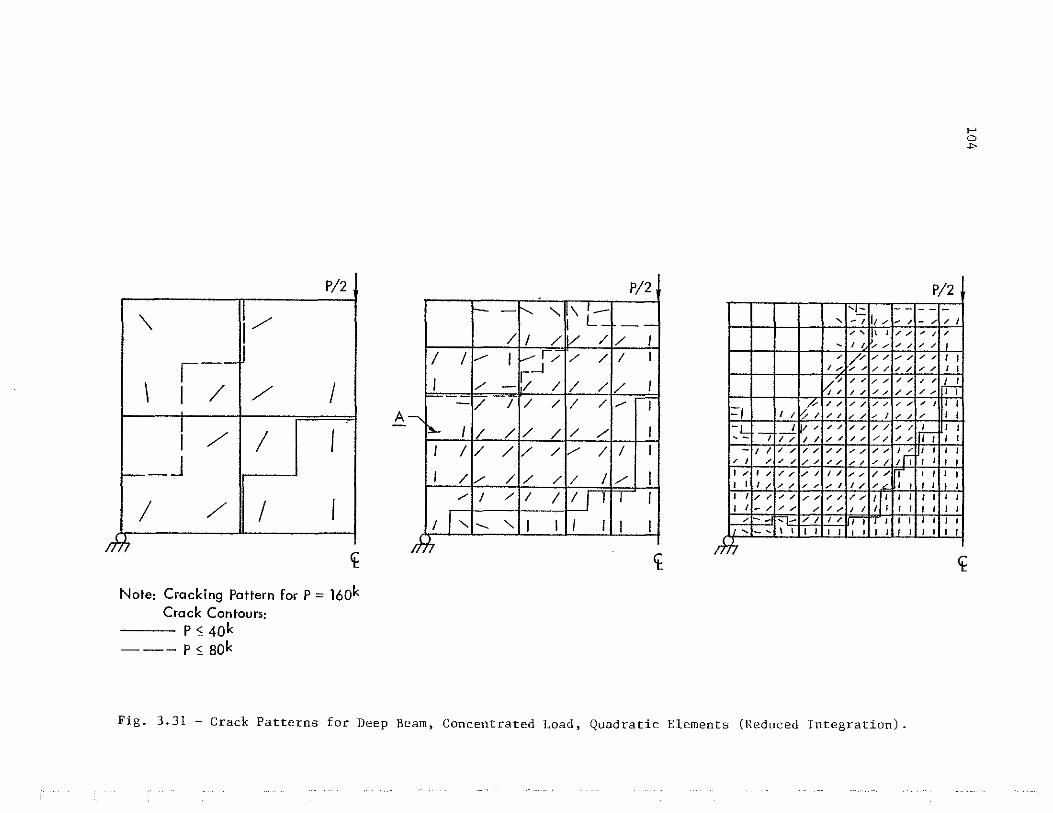
P/2
" '1/ I
,--I / / I
1/ I I 1---J
I / I I
t Note: Cracking Pattern for P = 160k
Crack Contours; P <: 4ok
---- P <: sok
A
r--- r--... " / I /
I I __.. I ~r> _J
I /- r;;. / - / I / /
' ~ I/ / / /
I // / / /
I // / / /
/ I / I I
I I " '- " I I 17
P/2 \ ,_
I L_ --lv / / I / / I I
/ / / I / / ./ I
/ / I / / I I
/ // I I I 1 I I
I I I I
<t
'!.:: ' -I I,, -/ /' I I//
' I / // / /
/ // // // I; / / // / /
t,{; / / / / / /
/ / // //
1::-J L!~ 1/ / / // ' /
I I / / / / ; I / /
=~ _I /1 / / / / / /I / /
t, I / I I / / / / /J //
- I I / / / / // // / / I '
' I / / / // // // 'I ~~~ I / I I /; / / I I // ;/ I I I I I / / / / / I I / // I I I I / I // // / / // w I I I I - / /; / / / I I I I I --- '- /I I I I 'I' I
I I
'-' \ I I I I I I I I I I I
7f7
Fig. 3.31- Crack Patterns for Deep Beam, Concentrated Load, Quadratic Elements (Reduced Integration).
>-' 0
""'
P/2 - -- / ' I ' / /
/ / l_j_ / / I I / / I I / / rH / / I I / I I I / I I I I I
ltiJ I I I I I I I I I I I I I I I I I I I I I
I I I I I I ' I I I I I
<t

lOS
320~-----------------------------------,
8 Node Elements Point Load 2x2 Integration Order
280
240
,C!J
--m
200 ~ _.~;:;:: (/) Q_ ·'1 ~ .
"0 0 0
_.J
¢.
1 60 ·i <t ci.
~i P/2
T 120 , 15"
·,; i '""t:-15't-j ,.
80 I LEGEND
I "' - 2 Elements Thru Depth .... - 5 Elements Thru Depth
40 C!J - 1 0 Elements Thru Depth
015---L---L-~--~--~--~--~--~--~~
0.0 0.1 Mid-Span Deflection, inches
Fig. 3.32- Load-Deflection Curves for the Deep Beam, Concentrated Load, Quadratic Elements with Reduced Integration, Mid-Span Only Deflection.
0.2
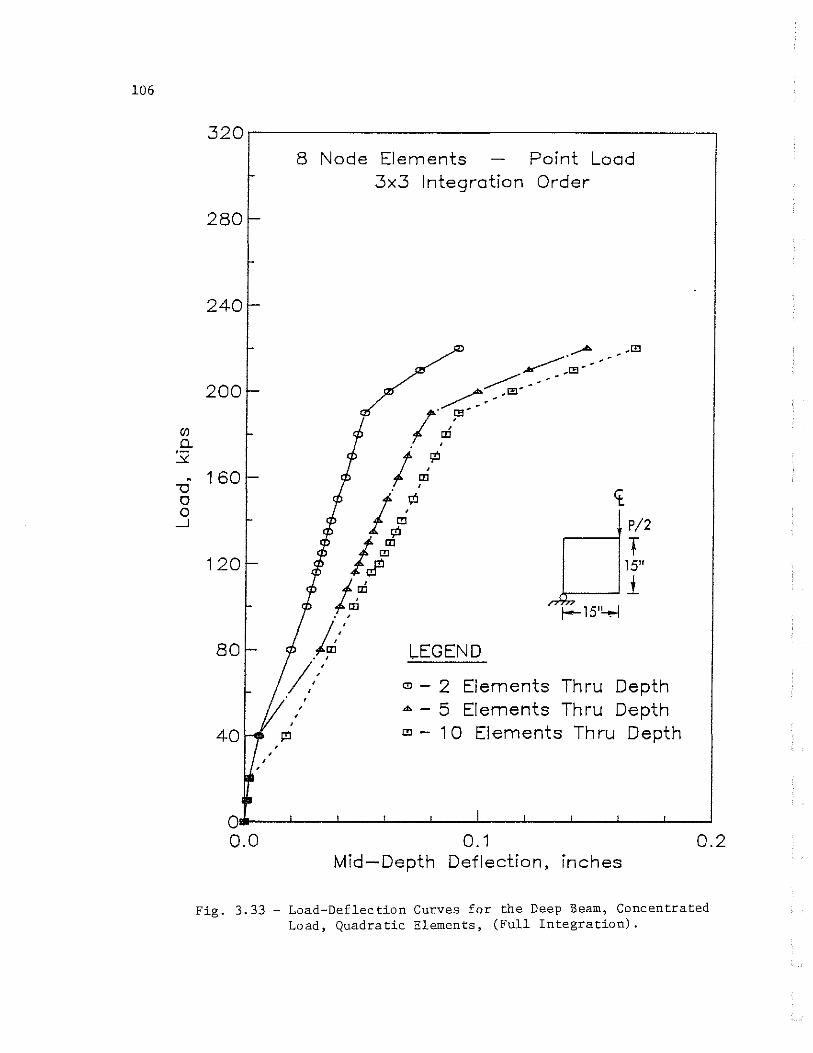
106
(/)
0. ~ .
-o 0 0
_j
320r-----------------------------------~
8 Node Elements Point Load 3x3 Integration Order
280
240
.......... -,[!]
....--------_[!]- ---200 ------=-~-----;·rD ~-
. '
.:~ ¢
160 <t f/ P/2
lr:tl T 120 15"
li i n\~15'~ . '
80 !i . ' LEGEND
/:' C!l-2 Elements Thru Depth ' ' "'-5 Elements Thru Depth
' ' 40 m-10 Elements Thru Depth
0*---L-~~~--~---L--~--~--~--L-~
0.0 0.1 0.2 Mid-Depth Deflection, inches
Fig. 3.33 - Load-Deflection Curves for the Deep Beam, Concentrated Load, Quadratic Elements, (Full Integration).

P/2
- - ' ' 1\1-f/1; JL
1-/l I / / '-'-
/ /j / / / / I -,- /1, /!/ / / / I I I-
c___l I / / / / r-1
I / / / / / / I
' I I / / / / / I
I / / / / / I I I / / / I I I II I I
I I/ I / I I I I I I
17' q;
P/2
~
P/2 tq I // IV-''
I I I fo; // I-/ '-.// f/1 // // / I -/r 1v1 // /I J J
// V' // // 1/ I J // // // // / / I I
// V/ f/ // // /I I/ // // // // /; I I
I I/ f~
// // /I // /I I I I J I I // I// // // // I I
// I/ J/1 // // // // //I I I I 1--- I I II/ // // ;/ // // I I I I I/ jll // // // /I // // I I I I I I I I // // // /I // - I I I I / I/ // // // /I // I I I I I I I / I ' // // // /I I I I I I I I I I I I/ // I/ // // ~~ I I I I I I I I /I // I I J I J / I l I I I I
'! ~ -/ . .u; I J 1: I I I I I I I I I
I I tl I I I I I I I I I I I I ... <:£
Note: Crocking Pottern for P = 160k Crocking Contours:
P " 4ok ----· P" sok
P/2 I I "' --
' ' - I "" f .,. /I
; ... \ ..... ,; .,.,.,. /
:~_, ~--;;~~ ~ I
~;;::/ .... ~ .... /~ ',' -f 'l""-' / .r /-'/J I I I
~/., //"' / I "" //// ///f/11 J I ,;t // ; I/ I
~",-; /~/~/~/~~j,~'IG I
/ """'"' """" 1"1"" I Ill /1// / ///, I/
I/ // / /// //// I I I I I / / //1 "
- 11~ /.f// / ////,/ / /I Jill I -..\ II //"'"'"II ""'I - 1 1~///~/,"',"" ~~~ /Ill ~I I:
~/!I//_. ,r /~~ ~~~~~/~~;~: l!:: II I
~ ~ ~ / ~ ~ ~ ~ ~ /~ I / "'~" ~ : : : I I I I l : J/.1/// // ,///f/1' IIIII 1111 I / " ;/ / 1 I I 1 I/ 1 I II I I I I I 1 I
rl-" /i"f · 1 I I I Jl I I ,,,~fr'rr , , , 1 1 1li • , ,, , , , , , • , a
H, q;
Fig. 3.34 - Crack Patterns for Deep Beam, Concentrnt~~d Load, Linear Elements.
,... 0 ..._.

Note: Crocking Potterns for P = l60k Crack Contours:
--- p" 40k --- p, aok
P/2
I \ / / /
" / ,----7 -/ -r, 1 I r- I
I I / / / I IT I / /. / I I
I / / I I I
I I I \ I I I ~f.,
G;
'\/ 1/j II I I I
/ I /
I I I / / I / -I II '\
~7
P/2,
t.Lll I -- -/I-/// v / /;. / / I / I I
~--'17 / /// I I I / / !:;;' / / / / I I I I I II / / / / //I I I
I 1]7 / / / /// I I I ~-/ / /// / / / I I I / I // / / lfl I I / / / /// / / I I I I / / I / / / ~&;I I I / / I / / I I I I I I /// ~~/I I I I I I / / / I I I I I I I I I I\ I I I I I I I I I I I
~
P/2 _l_j LL't! I 1 - 1 "
>-' 0 00
1: I - ,..,..y / ' I
- 'V'I'? // ,.,_...17_;.,....11"".,.._,. /.Ill I .r.;..-/ ,;,- I I
..,._.~~ ~...- "' "I I I I ...-;~, / / I If I I / ,_, "'-"""'/ I
'f"o//~ "'"'-" ""' I I I I "'"17.0:"' ///;"1/Jllf 1 """' / / ' I I 'I.~"'V""" ... ., ,,,,,,~
.t .I~':;' .I .1//// 1// f/ I I I I/ I // / s f I
L:'";::' I II 1//v./ // ///.1'"//JII /I fl r-::;...~ ... ,~.,, ";_"'"'• //ll/l/1111 ·-Cod,../ I / "// II
' Y'Vr " " ... _, ' ' .. , ,-r ' --t{'ll /1/_..j:.._, //II/ ..,_..,...IJIIJ l1 //I 1 ""'"' //J / ..-...-1111
:#'ill/'~ ... , .... ,. , ... ,. ,. ...., , J r: rT// ""' .... "'-'""//!/ // Ill JIll! ,·I/ /' / // I """''' I I
"II~//""'"'""'"""//.;/ 1111\j I I II/~/ ...-~~~.-: 1 ;/ 1 ~/~::11~1~1~:1 I//,._..,...,.._.."_/_"IIIJII IIIII
~~ ... _, ... {j~~~l :~''!'!:"::'':!'
~
Fig. 3.35- Crack Patterns for Deep Beam, Concentrated Load, Quadratic Elements (Full Integration).

(/)
a. ·-~ . "'C 0 0
_J
Fig.
109
320~--------------------------------,
280
240
200
160
120
80
' ' ' ' ' 40 ¢
0
Element Type Comparison For Point Load
,l!l' --,[E'
[!!'
'
""" .;,.
,l!l
<t P/2
T 15"
i f--15"--1
' ' IIl
' ' '
l,.EGEND
(!)- 4 Node Element (20 Thru Depth) [!J- 8 Node Element (1 0 Thru Depth)
0.0 0.1 Mid-Depth Deflection, inches
3.36 - Comparison of Load-Deflection Curves for Deep Beam, Concentrated Load, Linear Elementsand Quadratic Elements with Full Integration.
0.2

110
Crack
"' T ::r 2 v 4 ~ 245° ~ I L p
j_ ~ /
l / f A-- 3 "" I· L ·I
(a) Linear, Four Node Element (2x2 Integration)
T / / / f
/ f L / / p
j_ f / / / f
I· L ·I (b) Quadratic Element (3x3 Integration)
A-..
T~3 / 5 /
8 t I L t 2 7 p
j_ l / / I
4 6 I p I . L ·I
(c) Quadratic Element (2x2 Integration)
Fig. 3.37 - Test Problem for Determination of Cracked Element Stiffness Characteristics.

en Q_
~
. \J 0 0 _j
lll
100~------------------------------------~
80
60
40
20
4 Node Elements - Point Load Effect of Load Step Size
(15 X 15 Grid)
P/2 --<; -('1 ----.~. e>
~·····
LEGEND
A- 8 Load Steps ¢- 15 Load Steps J:!l- 29 Load Steps "' - 83 Load Steps
0---L~--L-~-L--L-~-L~--L-~~--L-~~
0.00 0.01 0.02 0.03 Mid-Depth Deflection, inches
Fig. 3.38 - Effect of Load Increment Size on Load-Deflection Curves.

112
100.----------------------------------~
80
4 Node Elements - Point Load Effect of Load Step Size
0~-L~--L-~~~--~-L~--L-~-L~L-~~
0.00 0.01 0.02 0.03 Mid-Depth Deflection, inches
Fig. 3.39 - Effect of Load Increment Size and Grid Refinement on Load-Deflection Curves.

" I I /0
I / / /
I ,, "' /I/ 1/
/1 " /'I / / / / , /I/ ,, I I //I I 1
/ / /1/ I/ , //1 / /II ,, I I I Ill " Ill
7?
(a) Cracking Pattern for P
Load Increment No. 50
P/2
I I I
I
I I I
I~' I I I
I I /I I I I
I I I I
I I I
II Ill
I I II II I
/1 I
I I
C£
k 48.5 .
~
// , , , 1'//;'f
P/2
/ ;' // f I' I; J'/ I I
/ / ; I /;',/'/ ; ///1 //-'.-'// ,
//,l'i' /// ,,
/ / /II I I
~/~/~~~// tft~ l' -;~ ... ~~~!'; ~~~,jl~ j :
//////1'1'//J///I;' II / I 11//IIJI II
/ /// ///l/l/f///1 II I / // //// /
/ / /// / ///1/// II l II// .-r/11 >' 1111
/ / "'""'"'" /;'/1'/11' / I II /// /;/F/ /II 11/1 1
/// /// ////;'1///f/ / I I I l///////////1/ltl 1111
t// " //////.11'// //// I I I I II ,.///;>/,;/;/ ////1'/ .II/ I ill I / //I I' ' /1'/J///1 II
,\JIIIJ/1111 II/J/111 I 11 I
?n
(b) Cracking Pattern for P
Load Increment No. 51
<h
k 49 •
Fig. 3.40- Cracking Patterns for Load Increment Size Effects (Linear Element, l5xl5 Grld). ..... ..... w

114
{f) Q_
.:Y.
. -o 0 0 _j
320.------------------------------------,
280
240
200
160
120
Effect of Element Type and Load Step Size - Point Load
""'~
<f P/2
T 15"
i l--15'~
LEGEND
<'>-4 Node, 15x 15 Grid, 4 Steps A- 4 Node, 1 5x 15 Grid, 8 Steps [!] - 4 Node, 15x15 Grid, 29 Steps +- 8 Node, 1 Ox 1 0 Grid, 4 Steps "' - 8 Node, 10x10 Grid, 8 Steps X- 8 Node, 1 Ox 1 0 Grid, 29 Steps
0----L-~---L--~--L---L-~ __ _L __ J_~
0.0 0.1 0.2 Mid-Depth Deflection, inches
Fig. 3.4la - Effect of Load Increment Size and Element Type on Load-Deflection Curves.

(/) o_
~
--o 0 0 _j
80
60
40
20
115
Effect of Element Type and Load Step Size - Point Load
l -------~-
~/ /
LEGEND
"'- 4 Node, 15x15 Grid, ""- 4 Node, 15x15 Grid, "'- 4 Node, 15x15 Grid, +- 8 Node, 1 Ox1 0 Grid, "'- 8 Node, 1 Ox1 0 Grid, x- 8 Node, 1 Ox1 0 Grid,
4 Steps 8 Steps
29 Steps 4 Steps 8 Steps
29 Steps
o~--~~~L-L-L-L-L-~~~~~~~~~_L__J
0.00 0.01 0.02 0.03 0.04 Mid-Depth Deflection, inches
Fig. 3.4lb - Effect of Load Increment Size and Element Type, Continued.

116
([) Q_
.:::£.
--a 0 0
__j
320,-------------------------------------,
280
240
200
160
120
80
40 ' [!]
Effect of Concrete Tensile Strength 4 Node Elements - 15 x 15 Grid
<£
P/2
T 15"
1 r&
l--15'!...1
LEGEND
C!l- 10 Psi Tensile Strength (!)- 400 Psi Tensile Strength
o----~--~---L---L--~--~--~~--L---~~
0.0 0.1 0.2 Mid-Depth Deflection, inches
Fig. 3.42 - Effect of Concrete Tensile Strength on Load-Deflection Curves ..

Notation
[ B]
(de]
[da}
[DT]
E
f' t
G
G
G c
{IF}, [IF5
]
[l<.rl
[P}
{R}
[U}
Ci
j)
{L'J' l
{I>U}
APPENDIX A
NOTATION
matrix relating strains at a point to
nodal displacements
differential strain vector
in material coordinates: d~ 1 , dE2
, dy12
in local (element) coordinates: dEx' dey' dyxy
differential stress vector
in material coordinates: dcr1
, da2
, dt12
in local (element) coordinates: da , dcr , dT x y xy
incremental (tangent) constitutive matrix
Young's modulus
concrete tensile strength
shear modulus
energy release rate
critical energy release rate
vector of nodal forces required to maintain an
element or structure in its deformed configuration
tangent structure stiffness matrix
total nodal load vector
residual nodal load vector
total nodal displacements
normal stiffness reduction factor
shear stiffness reduction factor
vector of incremental nodal loads
vector of incremental nodal displacements
117

118 Notation
(,;} vector of strains at a point
in material coordinates: El' E2' )'12
in local (element) coordinates: E x' £ y' yxy
v Poisson's ratio
(a] vector of stresses at a point
in material coordinates: al' a2, t12
in local (element) coordinates: ax' a ' t y xy