post-cracking characteristics of high performance fiber reinforced
327
POST-CRACKING CHARACTERISTICS OF HIGH PERFORMANCE FIBER REINFORCED CEMENTITIOUS COMPOSITES by Supat W. Suwannakarn A dissertation submitted in partial fulfillment of the requirements for the degree of Doctor of Philosophy (Civil Engineering) in The University of Michigan 2009 Doctoral Committee: Professor Sherif El-Tawil, Co-Chair Professor Emeritus Antoine E. Naaman, Co-Chair Professor Richard E. Robertson Associate Professor Gustavo J. Parra-Montesinos
Transcript of post-cracking characteristics of high performance fiber reinforced
POST-CRACKING CHARACTERISTICS OF HIGH PERFORMANCE FIBER REINFORCED CEMENTITIOUS
COMPOSITES
by
Supat W. Suwannakarn
A dissertation submitted in partial fulfillment of the requirements for the degree of
Doctor of Philosophy (Civil Engineering)
in The University of Michigan 2009
Doctoral Committee:
Professor Sherif El-Tawil, Co-Chair Professor Emeritus Antoine E. Naaman, Co-Chair Professor Richard E. Robertson Associate Professor Gustavo J. Parra-Montesinos

© Supat W. Suwannakarn All Rights Reserved
2009

To My Family
`
ii

ACKNOWLEDGEMENTS
I wish to express my deepest gratitude and sincere appreciation to Professor
Antoine E. Naaman, and Professor Sherif El-tawil advisors and Co-Chair of my doctoral
committee, for their guidance, support and patience. I also would like to thank the
members of my doctoral committee, Associate Professor Gustavo Parra-Montesinos, and
Professor Richard E Robertson, for reviewing this thesis, and giving valuable comments
on my research work.
Special thanks to my colleagues, for their friendship and invaluable help. Thanks
are also due to laboratory technician Robert Fischer, Jan Pantolin, and Bob Spence, for
fabricating the test setup and specimen molds for my experiments.
Finally, I would like to dedicate this work to my family, who always give me their
love, care and encouragement for which I am extremely grateful.
iii

TABLE OF CONTENTS
DEDICATION …………………………...……………………………………… ii
ACKNOWLEDGEMENTS ………….……………………………….………… iii
LIST OF FIGURES …………………………………………………………...… x
LIST OF TABLES ………………………………………………………….…… xxiv
ABSTRACT ………………………………………………………..……………. xxviii
CHAPTER
1. INTRODUCTION ………………………………………………..…... 1
1.1 General ……………………………………...…………..…….. 1
1.2 Dissertation Objectives and Scope ……...………..……….…. 3
1.3 Research Significance ………………………..……..………... 4
1.4 Structure of the Dissertation ……...……………...……..…… 4
2. LITERATURE REVIEW MODELING OF HPFRCC IN
TENSION ………………………………………………...…………… 8
2.1 Introduction ………………………………………………...… 8
2.2 First Cracking Point (A), (σcc, εcc) …………………………… 9
2.3 Multiple Cracking Stage (A-B), (σcc, εcc to σpc, εpc) …...… 10
2.4 Maximum Tensile Strength Point (B), (σpc, εpc) ………...… 13
2.5 Localization Stage (B-C), (After σpc, εpc) …………..……… 16
2.6 Crack-Opening in HPFRCC ………………………………… 17
2.7 Crack Spacing in HPFRCC …...………………..…………… 21
3. EXPERIMENTAL PROGRAM FOR EVALUATING HPFRCC
TENSILE BEHAVIOR ……………………………………………… 25
3.1 Introduction ………………………………………………...… 25
3.2 Materials ……………………………………………………… 26
iv
3.2.1 Mortar ………………….…………………………… 26
3.2.2 Fibers ……………………………………………...… 27
3.2.2.1 Polyvinyl Alcohol (PVA) ………………… 29
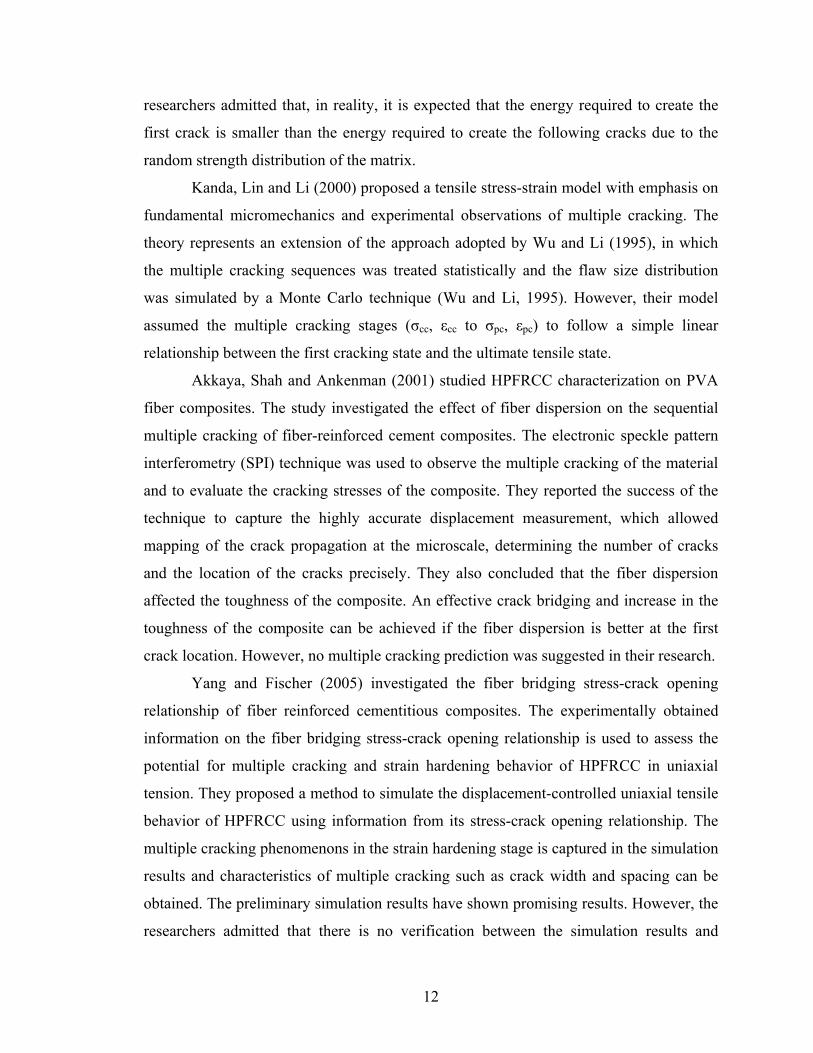
3.2.2.2 Spectra ………………………………...…. 30
3.2.2.3 Hooked ……………………………….…… 31
3.2.2.4 Twisted Polygonal Steel Fibers (Torex) … 33
3.3 Specimen Preparation ……………………………………..… 34
3.4 Direct Tensile Test (Dogbone Test) …………………….…… 35
3.5 Crack Opening Displacement Test (COD, Notched
Prism Test) …………………………………………………… 38
3.6 Ring Tensile Test ……………………………………..……… 40
3.6.1 Result of Finite Element Analysis ………………… 42
3.7 Data Acquisition System. ……………………….…………… 45
3.8 Image Acquisition …………………..…………………...…… 47
3.9 Data Processing ……………………………………………… 48
3.10 Concluding Remarks ……………………………….……… 49
4. DIRECT TENSILE TESTS OF FIBER REINFORCED
CEMENT COMPOSITES………………………..……………...… 51
4.1 Introduction ……………………………………………......… 51
4.2 Direct Tensile Behavior of Mortar without Fibers ……...… 54
4.3 Direct Tensile Behavior of FRCC Reinforced PVA Fibers 60
4.3.1 Result of Test Series with PVA-H Fiber .………… 61
4.3.2 Result of Test Series with PVA-L Fiber .………… 66
4.3.3 Concluding Remarks ……………………………… 69
4.4 Direct Tensile Behavior of HPFRCC Reinforced Spectra
Fibers…………………………………………………………. 70
4.4.1 Concluding Remarks ……………………………… 76
4.5 Direct Tensile Behavior of HPFRCC Reinforced with
Hooked Steel Fiber ………………………………………….. 79
4.5.1 Result of Test Series with High Strength Hooked
Steel Fiber .……………………………………….… 80
v

4.5.2 Result of Test Series with Regular Strength Hooked
Steel Fiber .……………………………………….… 88
4.5.3 Concluding Remarks ……………………………… 90
4.6 Direct Tensile Behavior of HPFRCC Reinforced with Torex
Twisted Steel Fiber ………………………………………….. 91
4.6.1 Result of Test Series with High Torex Steel Fiber 92
4.6.2 Result of Test Series with Regular Strength Torex
Steel Fiber ……………………………...………...… 100
4.6.3 Concluding Remarks ……………………………… 102
4.7 Comparison Between HPFRCC with Different Fibers ....… 103
4.8 Concluding Remarks on the Direct Tensile Tests of FRC
Composites with Different Fibers……………………..…… 104
5. STRESS VERSUS CRACK OPENING DISPLACEMENT TESTS 106
5.1 Introduction ………………………………………………..… 106
5.1.1 Typical Overall (σ-COD) Response ……………… 107
5.2 Typical Tensile Response (σ-COD) of Double-Notched
Specimens ……………………………………………………. 109
5.3 Notched Mortar Specimens without Fiber …………………. 114
5.4 Tensile Response (σ-COD) of Double-Notched Specimens
with PVA Fiber ……………………………………………… 116
5.5 Tensile Response (σ-COD) of Double-Notched Specimens
with Spectra Fiber …………………………………………… 125
5.6 Tensile Response (σ-COD) of Double-Notched Specimens
with High Strength Hooked Fiber …………..……………… 134
5.7 Tensile Response (σ-COD) of Double-Notched Specimens
with Torex Fiber …………………………...………………… 142
5.8 Comparison of Test Series Reinforced with Difference
Fibers ………………………………………………………… 151
5.9 Concluding Remarks …………………..……………………. 152
vi
6. PROPOSED MODEL FOR POST-CRACKING BEHAVIOR OF
HPFRCC UNDER TENSION …...…………………………..……… 154
6.1 Introduction ………………………..………………………… 154
6.2 First Cracking Stress ……………………………………...… 156
6.2.1 FRC Reinforced with PVA Fiber ………………… 157
6.2.2 HPFRCC Reinforced with Spectra Fiber ……….. 158
6.2.3 HPFRCC Reinforced with Hooked Fiber ……….. 159
6.2.4 HPFRCC Reinforced with Torex Fiber …...…….. 160
6.3 Strain at First Cracking Stress …..………………………… 161
6.4 Maximum Post-Cracking Stress or Ultimate Stress ……… 162
6.4.1 FRC Reinforced with PVA Fiber ………………… 163
6.4.2 HPFRCC Reinforced with Spectra Fiber ……….. 164
6.4.3 HPFRCC Reinforced with Hooked Fiber ……….. 165
6.4.4 HPFRCC Reinforced with Torex Fiber …...…….. 166
6.4.5 Comparison of Coefficient λpc for Different Fibers 167
6.5 Multiple Cracking Behavior and Strain at Maximum
Stress …………………………………………………………. 168
6.5.1 Test Series with Hooked Fiber ……………………. 169
6.5.1.1 Calculation of Strain at Maximum Stress
for Test Series with Hooked Fiber ……… 172
6.5.2 Test Series with Torex Fiber ……...………………. 173
6.5.2.1 Calculation of Strain at Maximum Stress
for Test Series with Torex Fiber ……...… 175
6.5.3 Test Series with Spectra Fiber ……………………. 176
6.5.3.1 Calculation of Strain at Maximum Stress
for Test Series with Spectra Fiber ……… 178
6.6 Modeling the Softening Response after Localization ……… 179
6.7 Correlation between Direct Tensile Tests and Stress versus
Crack Opening Displacement Tests ……………………….. 186
6.7.1 FRC Reinforced with PVA Fiber ………………… 190
6.7.2 HPFRCC Reinforced with Spectra Fiber ……….. 192
vii

6.7.3 HPFRCC Reinforced with Hooked Fiber ……….. 194
6.7.4 HPFRCC Reinforced with Torex Fiber …...…….. 198
6.8 Outline of Stress-Strain Computations ……………………. 201
6.9 Verification of the Model ……………………………………. 203
6.9.1 Tensile Specimen with Torex Fiber ………………. 203
6.9.2 Other Model Predictions ………………………….. 205
6.10 Concluding Remarks ………………….…………………… 212
7. TENSILE VARIABILITY OF FIBER REINFORCED
CEMENTITIOUS MATERIALS …...……………………………… 214
7.1 Introduction ………………………………………..………… 214
7.2 Confidence Interval (CI) ……………………..……………… 218
7.3 Coefficient of Variation (COV) Analysis …...……………… 220
7.4 Goodness-of-Fit ………………………………………………. 223
7.5 Variability Graph ………….………………………………… 245
7.6 Concluding Remarks ……………………………………...… 248
8. RING-TENSILE TEST ……………………………………………… 250
8.1 Introduction …………………………………..……………… 250
8.2 Measurement Comparisons ………………………………… 251
8.3 Testing Results ………………………………………………. 258
8.4 Concluding Remarks ………………………………………… 262
9. CONCLUSION………………………………………………..……… 264
9.1 Summary …………………………………………………….. 264
9.2 Conclusions Drawn From Direct Tensile Test (Dogbone)
Test of HPFRCC ……………..........................……………... 265
9.2.1 PVA Fiber ………………………………………….. 265
9.2.2 Spectra Fiber ………………………………………. 266
9.2.3 Hooked Steel Fiber ………………………………… 266
9.2.4 Torex Steel Fiber …………………………………... 267
9.2.5 Direct Tensile Tests: General Conclusions ………. 267
9.3 Conclusions Drawn from the Stress-Crack Opening
Displacement (COD) Tests on Notched Tensile Prisms ....… 269
viii

9.3.1 PVA Fiber ………………………………...………... 269
9.3.2 Spectra Fiber ……………………………………….. 269
9.3.3 Hooked Steel Fiber …………………………………. 270
9.3.4 Torex Steel Fiber …………………………………… 270
9.3.5 Stress Crack Opening Displacement (COD)
Tests: General Conclusions ……………………….. 271
9.4 Conclusions from the Study on Modeling Tensile
Stress-Strain Response …………………………………….. 272
9.5 Conclusions from the Statistical Analysis and
Variability of Results ………………………………………… 273
9.6 Conclusions for the Ring Tensile Test Study ………………. 274
9.7 Main Conclusions ……………………………………….…… 274
9.8 Recommendation for Future Works ………………….……. 276
APPENDICES....……………………………………………………………….…… 277
APPENDIX A DIRECT TENSILE TESTS USING SIFCON……….….278
APPENDIX B DEFINITION OF FIRST CRACKING, MAXIMUM
STRESS POINT, AND LOCALIZATION STARTING
POINT……………………………………………….…….282
APPENDIX C VARIABILITY OBSERVED IN SAME TEST SERIES
USING 12 SPECIMENS PREPARED ON THE SAME
DAY AND TESTED ON THE SAME DAY………..…...284
APPENDIX D COMPARISON OF α1α2, α1α2τ, λpc AND λpcτ……..287
BIBLIOGRAPHY………………………………………………………………...… 289
ix

LIST OF FIGURES
FIGURE
1.1 Stress-strain relation of typical tensile behavior of HPFRCC………........ 6
1.2 Typical schematic tensile behavior of HPFRCC, i.e., strain hardening
behavior………........................................................................……………… 6
1.3 Research plan and objectives………………………………………...…….. 7
2.1 HPFRCC stress-strain relation………….……………….………..……….. 8
2.2 Crack model for HPFRCCs showing (a) fracture zone and (b) possible
Stress distribution…………………….….………….……………....……... 24
3.1 Flow chart of experimental program……….…………………………..… 26
3.2 Fibers used in present research, (a) PVA, (b) Spectra, (c) Hooked,
and (d) Torex…………………………………………………..…..………. 28
3.3 Fibers used in present research: length comparison ....……….………… 28
3.4 PVA fiber……………………………………………………….….……..… 30
3.5 PVA fiber in composites………………………………………….…......… 30
3.6 Spectra fiber……….………………………………………………..……… 31
3.7 Spectra fiber in composite………………………………………….……… 31
3.8 Hooked steel fiber (before mixing)………...………………………………. 32
3.9 Hooked steel fiber in composites………………………………….………. 32
3.10 Pull-out mechanism in Hooked steel fiber………………………………… 32
3.11 Formation of two plastic hinges for maximum resistance……….…….… 32
3.12 Torex fiber geometry………………….…………………………………… 33
3.13 Torex steel fiber……………………………………………………………. 34
3.14 Torex steel fiber in composites………………………………………….… 34
x

3.15 Specimen dimension of tensile dogbone specimens (mm) ……………..… 36
3.16 Specimen dimension of tensile dogbone specimens (inch) …………….… 36
3.17 Tensile test setup, (a) specimen ready for testing and
(b) instrumentation………………..……………………………………….. 37
3.18 Dogbone specimen……………………………………………………......… 37
3.19 Mold for dogbone specimen and added end reinforcement…………..…. 37
3.20 Dimensions of notched tensile prim for crack-opening displacement test
(mm) ……………………………………………………….……………….. 38
3.21 Dimensions of notched tensile prism for crack-opening displacement
test (inch) ………………………………………………………………..…. 39
3.22 Crack opening displacement test set-up………………………………...… 40
3.23 Test setup configuration………………… ………………………………… 40
3.24 Ring tensile test set-up…….….…………………………………..………… 41
3.25 HPFRCC ring specimen………………………...…………………………. 41
3.26 Ring HPFRCC specimen……..…………………….….…………………… 42
3.27 Ring HPFRCC setup………….………………..…………………………… 42
3.28 Interaction between steel plate and cone wedge setup………..…….……. 42
3.29 Stress-contour of finite element analysis for two, four, and eight
piece steel-plate configurations……………..……………………………… 42
3.30 Specimen setup………………………………………………………….….. 43
3.31 Optotrak sensors…………………………………………………………… 43
3.32 Testing machine and tensile ring setup…….……………………………… 44
3.33 Testing machine and tensile setup……………………………………….… 44
3.34 LVDT setup at specimen’s surface……………...……………………….…44
3.35 LVDT setup at cone wedge…………………..…………..…………….……44
3.36 Data collecting system for the direct tension tests....……………………...45
3.37 Data acquisition system……………………………….………………….…46
3.38 View of real-time records of stress-elongation response curves…..…….. 46
3.39 Diagram for image acquisition system……………….…………………… 47
3.40 Image acquisition processing hardware (NI-CVS1453)…………………. 48
3.41 Image acquisition system…………………………………………………... 48
xi

3.42 Typical data and average curve…………...……………………..…….…. 48
4.1 Typical tensile behavior of (a) strain hardening composite and
(b) strain softening composite………..……………………...…………….. 52
4.2 Typical behavior of HPFRCC……………………………………………... 53
4.3 Strain at maximum stress and strain at the end of multiple cracking
stages…..……………………………………………………………………. 54
4.4 Testing results of specimen without fiber (control specimen)…………… 58
4.5 Testing of typical specimen without fiber (D-N-O-7), (a) initial status,
(b) maximum status, and (c) failure ………………….………..…………. 59
4.6 Dogbone specimen without fibers (specimen 1, 2, 3)….…….…………… 59
4.7 Dogbone specimen without fibers (specimen 4, 5, 6)……………………... 60
4.8 Stress-strain curves of specimens reinforced with PVA-H (D-P-H),
(a) Vf = 0.75%, (b) Vf = 1.0%, (c) Vf = 1.5%, and (d) Vf = 2.0% ……….. 62
4.9 Crack in direct tensile specimen reinforced with PVA fiber…………….. 63
4.10 Comparison of average curves for specimens reinforced with
PVA-H fiber with different volume fractions…………………………… ...63
4.11 Comparison of different properties of test series with oiled PVA
fibers at different fiber volume fractions, (a) first cracking stress,
(b) energy at first cracking stress, (c) maximum stress, and (d) energy
at post cracking stress ………………………………………………..……. 64
4.12 Specimens reinforced with PVA-H after testing (D-P-H) ……………….. 66
4.13 Comparison of tensile response of specimens with PVA-L fiber at
different fiber volume fraction……………………..……………………… 66
4.14 Typical failure sections of specimens reinforced with (a) non-oiled
PVA-L fibers and (b) oiled PVA-H fibers………………………………… 67
4.15 Stress-strain curves of specimens reinforced with Spectra (D-S) fiber
at volume fractions of: (a) 0.75%, (b) 1%, (c) 1.5%, and (d) 2% …...… ...71
4.16 Comparison of average curves for specimen reinforced with Spectra
fiber at different fiber volume fractions………..……….………………… 72
4.17 First cracking stress versus volume fraction………..…………………….. 73
4.18 Strain at first cracking stress versus volume fraction…………..………... 73
xii

4.19 Energy at first cracking stress versus volume fraction……….……...…... 73
4.20 Specimen at maximum stress……………………………………………… 74
4.21 Strain at maximum stress……………………………………………….… 74
4.22 Specimens’ energy at maximum stress………………………….………… 75
4.23 Variation of strain at the end of multiple cracking…………….…………. 75
4.24 Variation of energy at the end of multiple cracking………………...…….. 75
4.25 Stress strain curves of HPFRCC reinforced with high strength
Hooked steel fiber at different volume fractions of fiber and average
curves, (a) Vf = 0.75%, (b) Vf =1.0%, (c) Vf =1.5%, and (d) Vf =2.0%..... 81
4.26 Average stress strain curves of HPFRCC reinforced with high strength
Hooked steel fiber………………………………………………………….. 82
4.27 Stress at first cracking versus fiber volume fraction ...……………...….. 83
4.28 Strain at first cracking versus fiber volume fraction….………………… 83
4.29 Energy at first cracking versus fiber volume fraction……...………..….. 83
4.30 Maximum stress versus fiber volume fraction……………..…………….. 84
4.31 Strain at maximum stress versus fiber volume fraction………………… 84
4.32 Energy at maximum stress point versus fiber volume fraction……...….. 84
4.33 Strain at the end of multiple cracking versus fiber volume fraction……. 85
4.34 Energy at the end of multiple cracking versus fiber volume fraction….. 85
4.35 Average stress strain curves of HPFRCC reinforced with regular
strength Hooked steel fiber at different volume fractions……………..... 88
4.36 Stress strain curves of HPFRCC reinforced with high strength
Torex steel fiber at different volume fractions of fiber and average
curves, (a) Vf = 0.75%, (b) Vf =1.0%, (c) Vf =1.5%, and (d) Vf =2.0%..... 93
4.37 Average stress strain curves of HPFRCC reinforced with high strength
Torex steel fiber at different fiber volume fractions…………………….. 94
4.38 First cracking stress versus fiber volume fraction……………………….. 95
4.39 Strain at first cracking stress versus fiber volume fraction……...…..….. 95
4.40 Energy at first cracking stress versus fiber volume fraction…….…..….. 95
4.41 Maximum stress versus fiber volume fraction ……………….………….. 96
4.42 Strain at maximum stress versus fiber volume fraction……………..….. 96
xiii

4.43 Energy at maximum stress versus fiber volume fraction…………….….. 96
4.44 Strain at the end of multiple cracking stage versus fiber volume
fraction…....………………..……………………………………………….. 97
4.45 Energy at the end of multiple cracking stage versus fiber volume
fraction…………………………………………………………………..….. 97
4.46 Average stress strain curves of HPFRCC reinforced with regular
strength Torex steel fiber at different fiber volume fractions……….… 100
4.47 Comparison of average stress-strain response of FRCC test series with
different fibers at fiber volume fractions of: a) Vf = 0.75%, (b) Vf =1.0%,
(c) Vf =1.5%, and (d) Vf =2.0%………….…………………………….… 103
5.1 Typical behavior of notch HPFRCCs test…………...…………………. 107
5.2 Typical behavior of notched specimen, (a) with one crack and (b) with
several cracks…………………………………………………………...… 108
5.3 Zone of cracking influence in notch specimen……………………….… 108
5.4 Typical crack propagation and localization in HPFRCC…………....… 109
5.5 (a) Strain hardening material with multiple cracks and (b)
corresponding specimen……………………………………………..…... 110
5.6 (a) Strain hardening material with single major crack and (b)
corresponding specimen…………………………………………………. 111
5.7 (a) Strain softening material with a post cracking stress that picks up
after a first dip and (b) corresponding specimen……………………..… 112
5.8 (a) Strain softening material and (b) corresponding specimen…………113
5.9 Typical stress-crack opening displacement curves…………………….. 113
5.10 Stress-displacement curves of notched specimens with 2% Spectra
fiber and average curve………………………………………………...… 114
5.11 Stress-displacement curve of plain mortar matrix without fiber……… 115
5.12 (a) (σ-COD) curves of specimens reinforced with 0.75% PVA fiber
and (b) photo of tested specimens reinforced with 0.75% PVA fiber…. 117
5.13 (a) (σ-COD) curves of specimens reinforced with 1% PVA fiber and
(b) photo of tested specimens reinforced with 1% PVA fiber…….…… 117
xiv

5.14 (a) (σ-COD) curves of specimens reinforced with 1.5% PVA fiber and
(b) photo of tested specimens reinforced with 1.5% PVA fiber ….…… 118
5.15 (a) (σ-COD) curves of specimens reinforced with 2% PVA fiber and
(b) photo of tested specimens reinforced with 2% PVA fiber ………… 118
5.16 Comparison of average (σ-COD) curves with PVA fiber……………… 119
5.17 Definition of localization start point, (a) for specimen with only one
global maximum stress and (b) for specimen with a second local
maximum ………………………………………………………………… 120
5.18 First cracking stress……………………………………………………… 122
5.19 Displacement at first cracking stress…………………………………… 122
5.20 Energy at first cracking stress…………………………………………… 122
5.21 Maximum stress ………………………………………………………….. 123
5.22 Displacement at maximum stress………………………………………... 123
5.23 Energy at maximum stress…………………………………………….… 123
5.24 Displacement at localization start……………………………………...…124
5.25 Energy at localization start…………………………………………….… 124
5.26 (a) (σ-COD) curves of specimens reinforced with 0.75% Spectra and
(b) photo of tested specimens reinforced with 0.75% Spectra ………… 126
5.27 (a) (σ-COD) curves of specimens reinforced with 1% Spectra and
(b) photo of tested specimens reinforced with 1% Spectra……….…… 126
5.28 (a) (σ-COD) curves of specimens reinforced with 1.5% Spectra and
(b) photo of tested specimens reinforced with 1.5% Spectra…………... 127
5.29 (a) (σ-COD) curves of specimens reinforced with 2% Spectra and
(b) photo of tested specimens reinforced with 2% Spectra ………….… 127
5.30 Comparison of average (σ-COD) curves with Spectra fiber………...… 128
5.31 First cracking stress…………………………………..………………..… 129
5.32 Displacement at first cracking stress……………………………………. 129
5.33 Energy at first cracking stress…………………………………………... 129
5.34 Maximum stress…………………………………………………………... 130
5.35 Displacement at maximum stress……………………………………….. 130
5.36 Energy at maximum stress………………………………………………. 130
xv

5.37 Typical multiple cracking in notched specimens with Spectra fiber..... 131
5.38 Displacement at the end of multiple cracking stage…………………… 131
5.39 Energy at the end of multiple cracking stage…………………………... 131
5.40 (a) (σ-COD) curves of specimens reinforced with 0.75% Hooked fiber
and (b) photo of tested specimens reinforced with 0.75% Hooked fiber 135
5.41 (a) (σ-COD) curves of specimens reinforced with 1% Hooked fiber
and (b) photo of tested specimens reinforced with 1% Hooked fiber … 135
5.42 (σ-COD) curves of specimens reinforced with 1.5% Hooked fiber …… 136
5.43 (σ-COD) curves of specimens reinforced with 2% Hooked fiber ……... 136
5.44 Comparison of average (σ-COD) curves with Hooked fiber ………...…136
5.45 First cracking stress……………………………..……………………….. 137
5.46 Displacement at first cracking stress………………………………….… 137
5.47 Energy at first cracking stress…………………………………………… 137
5.48 Maximum stress…………………………………………………………... 138
5.49 Displacement at maximum stress………………………………………... 138
5.50 Energy at maximum stress………………………………………………. 138
5.51 Displacement at the end of multiple cracking stage……………………. 139
5.52 Energy at the end of multiple cracking stage…………………………… 139
5.53 (a) (σ-COD) curves of specimens reinforced with 0.75% Torex fiber
and (b) photo of tested specimens reinforced with 0.75% Torex fiber…143
5.54 (a) (σ-COD) curves of specimens reinforced with 1% Torex fiber
and (b) photo of tested specimens reinforced with 1% Torex fiber…… 143
5.55 (a) (σ-COD) curves of specimens reinforced with 1.5% Torex fiber
and (b) photo of tested specimens reinforced with 1.5% Torex fiber .…144
5.56 (a) (σ-COD) curves of specimens reinforced with 2% Torex fiber
and (b) photo of tested specimens reinforced with 2% Torex fiber ...… 144
5.57 Comparison of average (σ-COD) curves with Torex fiber…………...…145
5.58 First cracking stress……………………………………..……………….. 146
5.59 Displacement at first cracking stress………………….………………… 146
5.60 Energy at first cracking stress…………………………………………… 146
xvi
5.61 Maximum stress………………………………..……………………..…... 147
5.62 Displacement at maximum stress……………………………..………… 147
5.63 Energy at maximum stress………………………………………………. 147
5.64 Displacement at the end of multiple cracking stage ……..……………. 148
5.65 Energy at the end of multiple cracking stage……………………………148
5.66 Comparison of stress-crack opening displacement for the four fibers
used at (a) Vf = 0.75%, (b) Vf =1.0%, (c) Vf =1.5%, and (d) Vf =2.0% .. 151
6.1 Proposed diagram of HPFRCC model…………………….………….… 154
6.2 Typical tensile response of HPFRCC and chain material……………… 155
6.3 Variation of first cracking stress for test series with PVA fiber………. 158
6.4 Product α1α2 versus Vf…………………………………………………… 158
6.5 Variation of first cracking stress for test series with Spectra fiber….… 159
6.6 Product α1α2 versus Vf……………………………………………………. 159
6.7 Variation of first cracking stress for test series with Hooked fiber…... 160
6.8 Product α1α2 versus Vf …………………………………………………… 160
6.9 Variation of first cracking stress for test series with Torex fiber …...… 161
6.10 Product α1α2 versus Vf …………………………………………………… 161
6.11 Variation of maximum stress for test series with PVA fiber…………… 163
6.12 Coefficient λpc versus Vf………………………………………………….. 163
6.13 Variation of maximum stress for test series with Spectra fiber ………. 164
6.14 Coefficient λpc versus Vf ………………………………………………… 164
6.15 Variation of maximum stress for test series with Hooked fiber …….… 166
6.16 Coefficient λpc versus Vf ……………………………………………….… 166
6.17 Variation of maximum stress for test series with Torex fiber ………… 167
6.18 Coefficient λpc versus Vf ………………………………………………… 167
6.19 λpc of HPFRCC and Vf…………………………………………………… 168
6.20 Typical increase in number of cracks with fiber volume fraction…..… 169
6.21 Crack formation under increasing load in test series reinforced with
1.5% Hooked steel ……………………………..……………………….…169
6.22 Average crack spacing at saturation for test series with Hooked fiber.. 170
6.23 Average crack width at saturation for test series with Hooked fiber … 170
xvii

6.24 Average crack width versus average crack spacing for test series
with Hooked fiber ……………………………………………………...… 171
6.25 Crack formation under increasing load in test series reinforced
with 1.5% Torex steel fiber ……………………………………..……….. 173
6.26 Average crack spacing at saturation for test series with Torex fiber … 174
6.27 Average crack width at saturation for test series with Torex fiber ……174
6.28 Average crack width versus average crack spacing at saturation in tensile
test series with Torex fiber ……………………………….……………… 175
6.29 Average crack spacing at saturation for test series with Spectra fiber ..176
6.30 Average crack width at saturation for test series with Spectra fiber ..... 176
6.31 Average crack width versus average crack spacing at saturation in
tensile test series with Spectra fiber……………………………………... 177
6.32 Typical tensile specimens reinforced with Spectra fiber at the end of
test …………………………………………………………………..…….. 178
6.33 Stress-displacement relation after localization ……………………….... 179
6.34 Localization-failure in test series with PVA fiber …..…………..……… 180
6.35 Fibers assumed to pull-out for specimens with Hooked, Torex,
and Spectra fibers………………………………………………………… 180
6.36 Embedded length of aligned fibers bridging a crack………………...… 182
6.37 Example of normalized stress-displacement response of test series
reinforced with 2% Torex fiber…………………………………………. 184
6.38 Normalized curves after localization and their average for the test
series with: (a) PVA fiber, (b) Spectra fiber, (c) Hooked fiber, and
(d) Torex fiber ……………………………………………………….….... 185
6.39 Predicted average stress-displacement curves after localization for
all test series with notched specimens…………………………………... 186
6.40 Correlation between strain and maximum stress from a direct tensile
test and displacement at maximum stress from a notched prism test… 186
6.41 Zone of cracking influence around main crack………………………… 187
6.42 Correlation between “zone of cracking” from a stress-crack
opening displacement test and a direct tensile test (Dogbone test)……. 187
xviii

6.43 Schematic stress-strain curve and crack clusters………………………. 188
6.44 Definition of Ede ,Ene, Dde, and Dne………………………………………. 189
6.45 Typical failure crack in a tensile specimen reinforced with PVA fiber...190
6.46 Cracking in a notched prism with PVA fiber…………………….…….. 190
6.47 Ede/Ene for test series with PVA fiber…………………………………..…191
6.48 Typical failure crack in a tensile specimen reinforced with Spectra
fiber test ……............................................................................................... 192
6.49 Cracking in a notched prism with Spectra fiber ………...……………... 192
6.50 Number of equivalent cracks in a cluster in notched test series with
Spectra fiber……………………………..……………………………….. 193
6.51 Ede/Ene for test series with Spectra fiber………………………………… 193
6.52 Comparison of the number of cracks in direct tensile test series with
Spectra fiber (Dogbone test) obtained experimentally and estimated
from the energy method………………………………………………….. 194
6.53 Typical failure crack in a tensile specimen reinforced with Hooked
fiber……………………………………………………………………….. 195
6.54 Cracking in a notched prism with Hooked fiber ………………………. 195
6.55 Number of equivalent cracks in a cluster in notched test series with
Hooked fiber …………………………………..…………………………. 196
6.56 Ede/Ene for test series with Hooked fiber …………………………………197
6.57 Comparison of the number of cracks in direct tensile test series with
Hooked fiber (Dogbone test) obtained experimentally and estimated
from the energy method………………………………………………..… 197
6.58 Typical failure crack in a tensile specimen reinforced with Torex
fiber………………………………………………………………………... 198
6.59 Cracking in a notched prism with Torex fiber ………………………….198
6.60 Number of equivalent cracks in a cluster in notched test series with
Torex fiber …………………....................................................................... 199
6.61 Ede/Ene for test series with Torex fiber ………………………………..… 199
xix

6.62 Comparison of the number of cracks in direct tensile test series with
Torex fiber (Dogbone test) obtained experimentally and estimated
from the energy method………………………………………….…….… 200
6.63 Flowchart of proposed post-cracking model…………………………… 202
6.64 Comparison of predicted versus experimental stress-strain curve……. 205
6.65 Schematic stress-strain response of FRC reinforced with PVA fiber
(Direct tensile test) ……………………………………………..……….... 206
6.66 Schematic stress-displacement response of FRC reinforced with PVA
fiber (Notch tensile test)…………………………………………………... 206
6.67 Schematic stress-strain response of FRC reinforced with Spectra fiber
(Direct tensile test)………………………………………………………... 207
6.68 Schematic stress-strain response of FRC reinforced with Hooked fiber
(Direct tensile test)………………………………………………………... 207
6.69 Schematic stress-displacement response of FRC reinforced with Hooked
fiber (Notch tensile test)….……………………………………………….. 208
6.70 Schematic stress-strain response of FRC reinforced with Torex fiber
(Direct tensile test)…..…………………………… ……………………… 208
6.71 Schematic stress-displacement response of FRC reinforced with
Torex fiber (Notch tensile test)……………………………………….….. 209
6.72 Crack formation under increasing load in test series reinforced
with 0.75% Torex steel fiber (Notch test) ……………………………… 213
7.1 Probability density function with different μ and σ …………………... 216
7.2 Cumulative distribution function………………………………………. 216
7.3 95% confidence interval in normal distribution ……………………..… 216
7.4 Energy at localization start: area under the curve, toughness …………217
7.5 Multiple cracking stage in notch HPFRCC reinforced Spectra fiber … 217
7.6 (a) Direct tensile curve of HPFRCC reinforced Torex 1.5% and
(b) its corresponding confidence interval ………………………………. 218
7.7 (a) Direct tensile curve of HPFRCC reinforced Torex 2.0% and
(b) its corresponding confidence interval ………………………..………219
xx

7.8 (a) Direct tensile curve of HPFRCC reinforced Hooked 1.5% and
(b) its corresponding confidence interval ………………………………. 219
7.9 (a) Direct tensile curve of HPFRCC reinforced Hooked 2.0% and
(b) its corresponding confidence interval ………………………………. 220
7.10 Coefficient of variation, maximum stress ………………………………. 221
7.11 Coefficient of variation, energy at maximum stress...………………….. 221
7.12 Coefficient of variation, strain at maximum stress ……………………. 222
7.13 Comparison of coefficient of variation with different fiber types…....... 223
7.14 (a) Distribution of maximum stress, (b) cumulative histogram, and
(c) normal probability plot for HPFRCC reinforced Spectra 1.5%....... 227
7.15 (a) Distribution of energy at the end of multiple cracking stage, (b)
cumulative histogram, and (c) normal probability plot for HPFRCC
reinforced Spectra 1.5%…………………………………………………. 228
7.16 (a) Distribution of strain at the end of multiple cracking stage,
(b) cumulative histogram, and (c) normal probability plot for
HPFRCC reinforced Spectra 1.5%…………………………………...…. 229
7.17 (a) Distribution of maximum stress, (b) cumulative histogram,
and (c) normal probability plot for HPFRCC reinforced Spectra
2.0%.............................................................................................................. 230
7.18 (a) Distribution of energy at the end of multiple cracking stage, (b)
cumulative histogram, and (c) normal probability plot for HPFRCC
reinforced Spectra 2.0%…………………………………………………. 231
7.19 (a) Distribution of strain at the end of multiple cracking stage,
(b) cumulative histogram, and (c) normal probability plot for
HPFRCC reinforced Spectra 2.0%……………………….……………. 232
7.20 (a) Distribution of maximum stress, (b) cumulative histogram, and (c)
normal probability plot for HPFRCC reinforced Hooked 1.5%……… 233
7.21 (a) Distribution of energy at maximum stress, (b) cumulative
histogram, and (c) normal probability plot for HPFRCC reinforced
Hooked 1.5%……………………………………………………………... 234
xxi

7.22 (a) Distribution of strain at maximum stress, (b) cumulative
histogram, and (c) normal probability plot for HPFRCC reinforced
Hooked 1.5%…………………………………………………………….. 235
7.23 (a) Distribution of maximum stress, (b) cumulative histogram,
and (c) normal probability plot for HPFRCC reinforced Hooked
2.0%.............................................................................................................. 236
7.24 (a) Distribution of energy at maximum stress, (b) cumulative
histogram, and (c) normal probability plot for HPFRCC reinforced
Hooked 2.0%…………………………………………………………….. 237
7.25 (a) Distribution of strain at maximum stress, (b) cumulative
histogram, and (c) normal probability plot for HPFRCC reinforced
Hooked 2.0%………………………………………………….………….. 238
7.26 (a) Distribution of maximum stress, (b) cumulative histogram, and
(c) normal probability plot for HPFRCC reinforced Torex 1.5%……. 239
7.27 (a) Distribution of energy at maximum stress, (b) cumulative
histogram, and (c) normal probability plot for HPFRCC reinforced
Torex 1.5%................................................................................................... 240
7.28 (a) Distribution of strain at maximum stress, (b) cumulative
histogram, and (c) normal probability plot for HPFRCC reinforced
Torex 1.5%……………………………………………………………..… 241
7.29 (a) Distribution of maximum stress, (b) cumulative histogram, and
(c) normal probability plot for HPFRCC reinforced Torex 2.0%…..… 242
7.30 (a) Distribution of energy at maximum stress, (b) cumulative
histogram, and (c) normal probability plot for HPFRCC reinforced
Torex 2.0%………………………………………………………….….… 243
7.31 (a) Distribution of strain at maximum stress, (b) cumulative
histogram, and (c) normal probability plot for HPFRCC reinforced
Torex 2.0%…………………………………………………..……………. 244
7.32 First cracking stress range and average ……………………………….. 245
7.33 Maximum stress range and average ……………………………………. 246
7.34 Strain at maximum stress range and average ………………………..… 247
xxii

7.35 Energy at maximum stress range and average ………………………… 248
8.1 Comparison of specimens between ring-tensile and Dogbone shaped… 251
8.2 Illustrates the displacement obtained (a) from the Optotrak, (b) the
LVDT is on the perimeter of the specimen’s surface, and (c) at the
tip of the cone wedge………………………………………………..…... 251
8.3 An Optotrak displacement sensor location…………………………….. 252
8.4 Ring-tensile test results of Hooked 2.0% specimen 2 composites with
varying measurements………................................................................... 253
8.5 Ring-tensile test results of Hooked 1.0% composites with various types
of measurements………………………………………………………….. 254
8.6 Localization crack of PVA specimen……………………………………. 255
8.7 Localization crack of Hooked specimen………………………………… 256
8.8 Multiple cracking from inside surface of ring specimen…..................... 256
8.9 One of the four minor localization cracks………………………………. 257
8.10 Multiple cracking for both inside and outside surface of specimens….. 257
8.11 Testing result of all ring specimens tested…………………………….… 258
8.12 Comparison of maximum stress of all ring-tensile specimens tested….. 259
8.13 Cracking steps in ring-tensile specimen (a) elastic stage, (b) multiple
cracking stage, and (c) localization……………………………………… 260
8.14 Stress-strain result of PVA 2% specimen with error in strain hardening and multiple cracking behavior…………………..…………. 262
xxiii

LIST OF TABLES
TABLE
3.1 Cement compositions and properties of Portland cement type III.....… 27
3.2 Mix proportion of matrix by weight…………………………………...…27
3.3 Fiber properties…………………………………………………………… 29
3.4 Summary of testing program…………………………………………… 50
4.1 Common mechanical properties of mortar…………………………….. 55
4.2 Identification of mortar specimens and mortar composition…………. 55
4.3 Direct tensile test of mortar (US-units)…………………………………. 57
4.4 Direct tensile test of mortar (SI-units)………………………………...… 57
4.5 Summary of direct tensile test series with PVA fiber……………………61
4.6 Test results of direct tensile specimens reinforced with PVA-H fiber
(US-units)…………………. ………………………………………………65
4.7 Test results of direct tensile specimens reinforced with PVA-H fiber
(SI-units)……………………………………… …………………………. 65
4.8 Summary of test results of specimens reinforced PVA-L (US-units) … 68
4.9 Summary of test results of specimens reinforced PVA-L (SI-units) ..… 69
4.10 Summary of HPFRCC reinforced Spectra test………………………….71
4.11 Volume fraction of fiber and the stress ratio…………………………….74
4.12 Summary of test results of specimens reinforced with Spectra fiber
(US-units)……………………………………………….. ……………….. 77
4.13 Summary of test results of specimens reinforced with Spectra fiber
(SI-units) ………………………………………………….………………. 78
xxiv

4.14 Identification of specimen reinforced Hooked fiber………………….... 80
4.15 Summary of test results of specimens reinforced with high strength
Hooked fiber (US-units) …………………………………………………. 86
4.16 Summary of test results of specimens reinforced with high strength
Hooked fiber (SI-units) …………………………………..……………… 87
4.17 Summary of test results of specimens reinforced with regular
strength Hooked steel fiber (US-units)…………………………………... 89
4.18 Summary of test results of specimens reinforced with regular strength
Hooked steel fiber (SI-units)………………………………………………. 90
4.19 Identification of specimen reinforced Torex fiber…………………….... 92
4.20 Summary of test results of specimen reinforced high strength
Torex fiber (US-units) ……………………………………………………. 98
4.21 Summary of test results of specimen reinforced high strength
Torex fiber (SI-units) …………………………………………………….. 99
4.22 Summary of test results of specimens reinforced regular strength
Torex fiber (US-units)………………………………………………….… 101
4.23 Summary of test results of specimens reinforced regular strength
Torex fiber (SI-units)……………………………………………..…..….. 102
5.1 Key results for notched specimens without fiber………………………. 116
5.2 Test series of notched specimens reinforced with PVA fiber………….. 116
5.3 Summary of test results for notched specimens reinforced with PVA
fiber (US-units)……………………………………………………………. 121
5.4 Summary of test results for notched specimens reinforced with PVA
fiber (SI-units)……..……………………………………………………... 121
5.5 Test series of notched specimens reinforced with Spectra fiber………. 125
5.6 Summary of test results for notched specimens reinforced with
Spectra fiber (US-units)…………………………………………………... 132
5.7 Summary of test results for notched specimens reinforced with
Spectra fiber (SI-units)……...……………………………………..……... 133
5.8 Test series of notched specimens reinforced with Hooked fiber……….. 134
xxv

5.9 Summary of test results for notched specimens reinforced with
Hooked fiber (US-units)…...……………………………………………... 140
5.10 Summary of test results for notched specimens reinforced with
Hooked fiber (SI-units)………………………………………………….... 141
5.11 Test series of notched specimen reinforced reinforced with Torex
fiber…………………………………………………………………..…… 142
5.12 Summary of test results for notched specimens reinforced with
Torex fiber (US-units) …………………………………………………… 149
5.13 Summary of test results for notched specimens reinforced with
Torex fiber (SI-units)…………………….……………………………….. 150
6.1 Average first cracking stress of tensile test series with PVA fiber ……. 158
6.2 Average first cracking stress of tensile test series with Spectra fiber ... 159
6.3 Average first cracking stress of tensile test series with Hooked fiber … 160
6.4 Average first cracking stress of tensile test series with Torex fiber ……161
6.5 Average post-cracking strength of tensile test series with PVA fiber…. 163
6.6 Average post-cracking strength of tensile test series with Spectra fiber 164
6.7 Average post-cracking strength of tensile test series with Hooked fiber 165
6.8 Average post-cracking strength of tensile test series with Torex fiber... 167
6.9 Series with Hooked, Average crack spacing, Average crack width and
predicted strain…………………………….………………………………172
6.10 Series with Torex, Average crack spacing, Average crack width and
predicted strain ……………………...………………………………...…. 176
6.11 Series with Spectra, Average crack spacing, Average crack width and
predicted strain ……………………………………………………….….. 179
6.12 Value of parameters K1 and K2 for (Eq. 6.27)…...……………………… 183
6.13 Surface energy and area under the curve obtained from tests
(US-units)………………………………………………………………..... 200
6.14 Surface energy and area under the curve obtained from tests
(SI-units) …………………………………………………………………. 201
6.15 Energy ratio and influence unit/length of crack-opening displacement
test…………………………………………………………………………. 201
xxvi

6.16 Computations of stresses and displacements for the example
specimen…………………………………………………………………… 204
6.17 Summary of computations for the stress-strain curves of HPFRCC
tensile specimens (a, b, c, d, e, f) ………………………………………… 209
7.1 Diagram for analysis of tensile histogram and normal probability
curve…………………………………………………………..…………... 218
7.2 Normality test results at 95% confidence level………………………… 224
7.3 Statistical parameters of HPFRCC specimens (US-units) ………….… 225
7.4 Statistical parameters of HPFRCC specimens (SI-units) …………….. 226
xxvii
ABSTRACT
Post-Cracking Characteristics of High Performance Fiber Reinforced Cementitious Composites
by
Supat W. Suwannakarn
Co-Chairs: Sherif El-Tawil and Antoine E. Naaman
The application of high performance fiber reinforced cement composites
(HPFRCC) in structural systems depends primarily on the material’s tensile response,
which is a direct function of fiber and matrix characteristics, the bond between them, and
the fiber content or volume fraction. The objective of this dissertation is to evaluate and
model the post-cracking behavior of HPFRCC. In particular, it focused on the influential
parameters controlling tensile behavior and the variability associated with them. The key
parameters considered include: the stress and strain at first cracking, the stress and strain
at maximum post-cracking, the shape of the stress-strain or stress-elongation response,
the multiple cracking process, the shape of the resistance curve after crack localization,
the energy associated with the multiple cracking process, and the stress versus crack
xxviii

opening response of a single crack. Both steel fibers and polymeric fibers, perceived to
have the greatest potential for current commercial applications, are considered. The main
variables covered include fiber type (Torex, Hooked, PVA, and Spectra) and fiber
volume fraction (ranging from 0.75% to 2.0%). An extensive experimental program is
carried out using direct tensile tests and stress-versus crack opening displacement tests on
notched tensile prisms. The key experimental results were analysed and modeled using
simple prediction equations which, combined with a composite mechanics approach,
allowed for predicting schematic simplified stress-strain and stress-displacement response
curves for use in structural modeling. The experimental data show that specimens
reinforced with Torex fibers performs best, follows by Hooked and Spectra fibers, then
PVA fibers. Significant variability in key parameters was observed througout suggesting
that variability must be studied further.. The new information obtained can be used as
input for material models for finite element analysis and can provide greater confidence
in using the HPFRC composites in structural applications. It also provides a good
foundation to integrate these composites in conventional structural analysis and design.
xxix

1
CHAPTER 1
INTRODUCTION
1.1 General
Cementitious materials, such as concrete and mortar, exhibit brittle tensile
behavior. However, their behavior can be significantly improved by adding discontinuous
fibers. Historically, Joseph Lambot’s (1849) fiber application reveals the idea of using
continuous fibers in mesh form to create new building materials, which led to the
development of ferrocement and reinforced concrete. Romualdi et al (1963) had proposed
using short randomly oriented fibers in order to improve the matrix’s brittle nature under
tensile loading. Today, several types of reinforcing fibers, in various shapes and sizes,
such as steel, polymer, glass, carbon, or natural fiber, are produced and used widely.
The main advantage of using discontinuous fibers in brittle matrices, such as a
cementitious matrix, is usually realized only after the matrix cracks. The fibers can
prevent a sudden loss in load-carrying capacity of the cracked composite by providing a
load transfer mechanism across the crack, resulting in a pseudo-ductile response.
When a load is applied to a fiber reinforced composite element, it is distributed to
both the matrix and the fibers. The transmission of forces between the fibers and the
matrix occurs through interfacial bond, defined as the bond shear stress at the interface
between the fiber and the surrounding matrix. The fibers contribute primarily to the post
cracking response of the composite by bridging the cracks and providing resistance to

2
crack opening.
According to Naaman and Reinhardt (1987, 1992, 1996), fiber reinforced cement
composites can be classified into the following two categories: conventional fiber
reinforced cementitious composite (FRCC) and high performance fiber reinforced
cementitious composite (HPFRCC), Fig. 1.1. More recently, however, and in order to
minimize confusion, Naaman and Reinhardt (2003) suggested the use of a broader
classification which apply to all fiber reinforced cement composites, namely: either
strain-softening or strain-hardening in tension after first cracking.
When the first crack occurs, FRCC response in tension softens, while in contrast,
HPFRCC response hardens. In other words, if the post cracking strength (σpc) is higher
than that at first cracking (σcc), then the composite is considered to be a high performance
material (or equivalently a strain-hardening material). An alternative classification based
on energy is possible when the energy needed to create a new crack is less than the
energy required to extend a former crack, the multiple cracking resulting from this
condition is considered characteristic of HPFRCC behavior.
Generally, the tensile stress-elongation response of HPFRCC can be classified
into three parts; the elastic stage, wherein the matrix is not cracked up to σcc, the multiple
cracking stage (σpc), and the damage localization stage, or crack opening stage (Fig. 1.2).
In the elastic stage, the composite exhibits linear behavior up to first cracking (σcc). After
first cracking, the multiple cracking stages lead to a strain hardening effect during with
the load still increases up to the ultimate strength (σpc). After the peak load, damage
localized failure occurs via a single critical crack opening. Thereafter, resistance
decreases with the opening of the critical crack; i.e. softening response take place
Fibers bridging a crack can absorb more or less energy depending on their bond
characteristics. The pull-out process involves first, a debonding action which provides an
alternative path for the crack to follow, and is preceded by the formation of a new surface
at the fiber matrix interface. Moreover, the fiber deformation and compliance during pull-
out contributes directly to the total deformation of the composite.
The behavior of FRC can be classified into three groups according to application,
fiber volume fraction and fiber effectiveness. Such classification leads to : 1) very low
volume fraction of fiber (<1%), which has been used for many years now such as for

3
early age plastic shrinkage control or pavement reinforcement, 2) moderate volume
fraction of fiber (1%-2%), such as used in both cast-in-place and structural members for
their improved modulus of rupture (MOR), fracture toughness, impact resistance and
other desirable mechanical properties, and 3) high volume fractions of fibers (more than
2%) for special applications such as impact and blast resistance structures; these include
SIFCON (Slurry Infiltrated Fiber Concrete), SIMCON (Slurry Infiltrated Fiber Mat). In
most applications fibers may act as secondary reinforcement used along with
conventional steel rebars or prestressing strands as main reinforcement. In the class of
high volume fraction of fiber, the materials have excellent mechanical properties and can
be used without other continuous reinforcement. However, these composites are often
suited for highly specialized applications due to limitations associated with processing
and cost.
1.2 Dissertation Objectives and Scope
The main objective of this study is to evaluate and accurately model the post-
cracking behavior of high performance fiber reinforced cementitious composites
(HPFRCCs). To achieve this objective, numerous sub-objectives are sought and include
identification uncovering the behavior of influential variables, namely: the stress and
strain at first cracking, the stress and strain at maximum post-cracking, the shape of the
stress-strain or stress-elongation response, the multiple cracking process, the shape of the
resistance curve after localization, the energy associated with the multiple cracking
process, the stress versus crack opening of a single crack, and the variability associated
with these parameters. This research will focus on both steel fibers and polymeric fibers,
which have the greatest potential with regard to current commercial application. The
objectives are accomplished through both an extensive experimental program and a
rational analytical program. Furthermore, a statistical regression analysis is performed to
provide information on the influence of important parameters. Figure 1.3 provides a
general flow chart of the research plan.

4
1.3 Research Significance
The significance of this research lies in the ability to predict with reasonable
accuracy the tensile stress-elongation response of fiber-reinforced cement composites and
their key properties, while understanding some of the mechanisms involved and the
variability associated with the resulting properties. The new information obtained will
lead to an improvement in modeling material properties for finite element analysis as
well as a greater confidence in using HPFRC composites in structural applications. The
overall research also provides a good foundation to integrate these composites in
conventional structural analysis and design.
1.4 Structure of the Dissertation
This dissertation is organized into nine chapters.
Chapter 2 provides a review of existing literature on the behavior of HPFRCC in
tension, namely: the first cracking point, the multiple cracking stage , the mechanism for
the maximum tensile strength, the localization stage, the impact of randomly distributed
fiber on tensile resistance, and crack opening and crack spacing when relevant.
Chapter 3 describes the experimental program for uncovering HPFRCCs behavior
under the direct tensile loading testing procedures followed, equipment setup used, and
parameters investigated.
Chapter 4 provides the details of the direct tensile test results using dogbone
shaped specimens. It includes discussions of the first cracking point, maximum stress
point, localization, crack spacing, and crack width. The direct tensile test results are also
analyzed in terms of their associated mechanisms.
Chapter 5 describes the tests related to the stress versus crack opening
displacement (σ-COD) using notched tensile prisms. Different fibers (PVA, Spectra,
Torex, and Hooked) and different volume fraction (0.5%, 0.75%, 1.0%, 1.5%, 2.0%,
SIFCON) are used. A model for the stress versus crack opening displacement relation
after localization is proposed. Extensive image analysis is carried out to shed light on

5
crack propagation and multiple cracking when present.
Chapter 6 describes the proposed model for the post-cracking behavior of
HPFRCC under tension and the influence of different types and volume fraction of fibers,
It covers first cracking stress, ultimate strength, and the computational method suggested
to predict the multiple cracking stage. Regression equations are given to predict total
crack length and crack spacing and width at crack saturation. Finally, the proposed post-
cracking model for direct tensile stress-strain relation is illustrated on a few examples.
Chapter 7 describes the statistical variation of results observed from the direct
tensile tests and the variability of each experimental variable. It also discusses how
variability affects the proposed tensile model.
Chapter 8 describes a newly proposed ring-tensile test, the results of a related
simulation based on a finite element analysis, and a parametric evaluation. The expected
advantages of this new test setup are discussed. Experimental results of a preliminary
investigation using the ring tensile test are provided and analyzed. Expansion or strain
measurements and a critique of the technique are described.
Chapter 9 presents a summary of overall research results and related conclusions.
A section on recommended future research is provided.

6
Figure 1.1: Stress-strain relation of typical tensile behavior of HPFRCC
Figure 1.2: Typical schematic tensile behavior of HPFRCC, i.e., strain hardening
behavior

7
Figure 1.3: Research plan and objectives

8
CHAPTER 2
LITERATURE REVIEW MODELING OF HPFRCC IN TENSION
2.1 Introduction
Figure 2.1: HPFRCC Stress-strain relation

9
Several attempts were made in the past to model the behavior of HPFRCC in
tension. Currently fiber reinforced material models can be classified into three categories,
composite mechanics approach, energy approach, and numerical approach. Each
approach represents HPFRCC behavior in a different way. Consequently, to model the
behavior of HPFRCCs, it is necessary to understand several important parameters. These
parameters relate in particular to the post-cracking response and the shape of the Stress-
Strain (or Stress-Displacement) relationship (see Fig. 2.1).
1. First cracking point (A) , (σcc, εcc)
2. Multiple cracking stage (A-B), (σcc, εcc to σpc, εpc)
3. Maximum tensile strength point (B), (σpc, εpc)
4. Localization and softening stage (B-C), (After σpc, εpc)
5. Crack-opening or crack width in HPFRCC
6. Crack spacing in HPFRCC
2.2 First cracking point (A), (σcc, εcc)
The first crack strength is defined as the applied tensile stress at which the crack
spreads throughout a cross-section. Naaman (1972, 1974, and 1987) introduced a
composite mechanics approach for modeling composites reinforced with short
discontinuous fibers. Each model treats the effect of discontinuity and randomness of
fiber orientation in a different way. Naaman (1974 and 1987) used the orientation effect
which was proposed by Romualdi and Mandel (1964).
In the model suggested by Naaman (1974), the fiber composite is modeled as a
chain link series which will break when the weakest link breaks. The fibers distribution in
the composite follows a Poisson distribution function. The cracking strength of one link
in the chain is given by the contribution of matrix and the contribution of fibers. The fiber
contribution depends on the fraction of bond mobilized at first crack and the coefficient
of fiber orientation in the uncracked state. The related equation (σcc = σmu (1-Vf) + α1 α2 τ
Vf L / d) is explained in Chapter 6.

10
Alwan and Naaman (1994) proposed two models for the elastic modulus of fiber
reinforced cement composites. The first model is based on the concept of interfacial bond
stress-slip, while the second model is a numerical scheme based on homogenization
theory. A good agreement between the analytical prediction and experiments was
observed.
Another model was proposed by Li and Lieung (1991) by using energy approach
and fracture mechanic. According to the principles of linear elastic fracture mechanics
(LEFM), stresses at the flaw tip are proportional to the stress intensity factor, KI, which
can be derived from basic principle of elasticity. In the model, the cracking stress was
derived based on fracture mechanics and micromechanics. The first crack state refers to
the first bend-over point and is assumed to be equal to the steady-state cracking stress σss.
In addition to this, the steady-state cracking stress is estimated from composite
crack bridging stress, which represents the apparent closing pressure due to fiber bridging
acting on the composite crack plane, and cracking stress level. Moreover, the cracking
stress level is defined as the stress level at which each of the multiple cracks propagates,
when each crack in a different part of the specimen has a different size.
2.3 Multiple Cracking Stage (A-B), (σcc, εcc to σpc, εpc)
For fiber reinforced composites, two possibilities exist after formation of the first
transverse crack: strain softening and localization characterized by continuous opening of
the major crack due to fiber pull-out (or fiber failure or both), and strain hardening
characterized by multiple cracking. For fiber reinforced cementitious composites,
multiple cracking is described as the stage when more cracks propagate along the
transverse direction parallel to the first transverse crack.
Generally, at the first cracking point (σcc, εcc), the specimen is assumed to have a
single crack. Consequently, the overall specimen stiffness will be reduced since the crack
is opened and elongated. Other parts of the specimen continue to be non-cracked
elements, representing the same stiffness as a typical elastic section. When the load is
increased, the crack will either open more, or new additional cracks develop. In the last
case, the numbers of cracks subsequently increases until the specimen reaches the

11
ultimate strength or saturation cracking.
For simplicity, it can be assumed that the multiple cracking stage (A-B) is a linear
relationship between the first cracking point (A) and the ultimate cracking point (B)
(Kanda, Lin and Li, 2002). However, the multiple cracking stage is not linear since when
the crack is formed, the stres versus crack-opening displacement (COD) is not linear and
the behavior also relates to several parameters including fracture toughness of the
composites, fiber pull-out behavior and fiber parameters (Yang and Fischer, 2005).
A major obstacle in tensile stress-strain modeling is the characterization of the
inelastic strain due to matrix cracking. This inelastic strain was originally investigated for
continuous aligned fiber-reinforced composites by Aveston et al. (1971), in which matrix
cracking stress was simply assumed uniform in each of the multiple cracks. Their results
were then extended for composites reinforced with randomly distributed long fibers
(Aveston and Kelly, 1973). Following these research studies, matrix cracking of
composites under tension has been extensively investigated in the field of ceramics.
Stress at cracking state was derived as a function of micromechanical parameters
representing the initial flaw size and the fiber’s crack bridging performance (Marshall et
al, 1985). Furthermore, cracking was statistically examined, and its stochastic aspects
were analytically clarified (Cho et al, 1992 Searing and Zok, 1993). Based on these
studies, inelastic strain due to matrix cracking was modeled in relation with crack
evolution. Also an analytical model for the stress-strain relation was then proposed for
ceramic composites, which applies to the case where fibers are aligned and continuous.
However, few attempts have yet been made to extend these theories for fiber-reinforced
composites with randomly oriented short fibers.
Tjiptobroto and Hansen (1993) proposed a tensile strain hardening and multiple
cracking models for HPFRCC based on the ACK theory (Continuous fiber reinforced
composites theory), energy concept and the shear-lag model. In their research, the
occurrence of multiple cracking in discontinuous fiber reinforced composite depends on
the energy. If the energy required to open an existing microcrack is larger than the energy
required to form a new micro crack, then a new crack will occurred. It is assumed that the
magnitude of the energy for every multiple crack is the same. The strain at the end of
multiple cracking represents the sum of both the elastic strain and the inelastic strain. The
12
researchers admitted that, in reality, it is expected that the energy required to create the
first crack is smaller than the energy required to create the following cracks due to the
random strength distribution of the matrix.
Kanda, Lin and Li (2000) proposed a tensile stress-strain model with emphasis on
fundamental micromechanics and experimental observations of multiple cracking. The
theory represents an extension of the approach adopted by Wu and Li (1995), in which
the multiple cracking sequences was treated statistically and the flaw size distribution
was simulated by a Monte Carlo technique (Wu and Li, 1995). However, their model
assumed the multiple cracking stages (σcc, εcc to σpc, εpc) to follow a simple linear
relationship between the first cracking state and the ultimate tensile state.
Akkaya, Shah and Ankenman (2001) studied HPFRCC characterization on PVA
fiber composites. The study investigated the effect of fiber dispersion on the sequential
multiple cracking of fiber-reinforced cement composites. The electronic speckle pattern
interferometry (SPI) technique was used to observe the multiple cracking of the material
and to evaluate the cracking stresses of the composite. They reported the success of the
technique to capture the highly accurate displacement measurement, which allowed
mapping of the crack propagation at the microscale, determining the number of cracks
and the location of the cracks precisely. They also concluded that the fiber dispersion
affected the toughness of the composite. An effective crack bridging and increase in the
toughness of the composite can be achieved if the fiber dispersion is better at the first
crack location. However, no multiple cracking prediction was suggested in their research.
Yang and Fischer (2005) investigated the fiber bridging stress-crack opening
relationship of fiber reinforced cementitious composites. The experimentally obtained
information on the fiber bridging stress-crack opening relationship is used to assess the
potential for multiple cracking and strain hardening behavior of HPFRCC in uniaxial
tension. They proposed a method to simulate the displacement-controlled uniaxial tensile
behavior of HPFRCC using information from its stress-crack opening relationship. The
multiple cracking phenomenons in the strain hardening stage is captured in the simulation
results and characteristics of multiple cracking such as crack width and spacing can be
obtained. The preliminary simulation results have shown promising results. However, the
researchers admitted that there is no verification between the simulation results and

13
experimental observation.
2.4 Maximum Post-Cracking Tensile Strength Point (B), (σpc, εpc)
The maximum post-cracking tensile strength point (σpc, εpc) is the point at which
maximum stress occurs prior to localization failure and softening of the response.
Generally, it is the state where the multiple cracking behavior stops (no occurrence of a
new crack) and the localization failure starts (the critical crack start opening while other
cracks unload).
Several attempts were made in the past to predict σpc and εpc. Naaman (1972,
1974, and 1987) proposed a prediction equation for the post-cracking strength as a
function of shear strength, volume fraction of fibers, fiber length and diameter of fiber.
Later Naaman expanded the post-cracking strength so the model can be generalized and
applied to high performance fiber reinforced cementitious composites for which the post
cracking strength can be greater in value than the first cracking strength; these include the
modification factor for the expected pull out length, the efficiency factor of orientation in
the cracked state, the group reduction factor associated with the number of fibers pulling-
out per unit area, the pulley effect, the factor for fiber at large angles, and matrix
damage. In short, the maximum post-cracking strength can be expressed as
dLV fpc λτσ = . (λ = λ1 λ2 λ3). (This equation is explained in Chapter 6)
Li and Lieung (1992) proposed a model to predict maximum stress (σpeak) as a
function of volume fraction of fiber, bond strength of fiber and matrix, the length of fiber
and also the diameter of fibers. Also they introduced the probability factor accounting for
fiber distribution and the snubbing effect in their model. However, their model has no
group effect of fibers, the interaction that occurs between two or more fibers, reducing
the performance of each individual fiber to resist the tensile load. Consequently, their
model seems to largely overestimate test results.
Later the model proposed by Kanda, Lin and Li (2000) to predict the strain at
maximum stress (εpc) in which the stress-strain relation is assumed to be a bilinear. This
approach requires theoretical modeling of the ultimate crack spacing theorydx . The specific

14
case of HPFRCC involving full saturation of multiple cracking has been studied (Kanda
and Li (1998)). The ultimate crack spacing with full crack saturation xd (saturated
ultimate crack spacing) depends on the transferred stress from bridging fibers at the crack
plane to the non cracked matrix. This stress transfer is achieved via the interfacial shear
stress between fibers and matrix. The saturated ultimate crack spacing xd can be estimated
as the minimum distance necessary for overcoming matrix cracking stress by transferred
stress. The theory was conducted under the hypothesis that the initial flaw size
distribution can be represented as a random process that governs crack evolution.
According to the crack spacing theory, it is assumed that unsaturated crack
spacing can be evaluated by employing the probability of a potentially propagating flaw
involved in a tensile specimen. Cracks are not to be generated with spacing less than xd,
as in the theory, the matrix stress cannot attain cracking stress level within length xd from
a crack plane.
The model employs a probabilistic description, in which the Weibull function is
adopted to represent flaw size distribution. Identifying the parameters in this function
requires at least one set of experimental data on crack spacing. In this study, the
researcher claimed that their study revealed that the flaw size distribution can be assumed
unique for similar composites (with identical matrix mix proportion, mixing process and
age) with different fiber length and fiber volume fraction and the ultimate crack spacing
is found to be consistent with the results predicted by means of the proposed crack
spacing theory
The proposed model can achieve the first step to solve the problem of ultimate
crack spacing ( theorydx ) and the strain at ultimate stress. However, based on many
experimental results of Spectra fiber, the accuracy of this estimation is not completely
satisfactory. Their model seems to be overestimated in both stress and strain at
maximum stress (σpc, εpc); the error is the result of complexity of formula accounting for
both fracture mechanics and energy method, which required numerous parameters
including matrix fracture toughness, slip-hardening parameters in pull-out test. Also the
model did not include the group effect of fiber, the interference of numerous fibers
confined in small area, which may explain the overestimation of results.

15
Another model was developed by Tjibtobroto and Hensen (1991,1993), which is
based on extending the energy-based ACK model (Aveston et al, 1971) of continuous
fibers and the shear-lag model of single fiber pull-out process to fit cement composites
reinforced with short discontinuous fibers. By comparing the energy required to form a
new crack with the energy required to open the first crack, the model can represent the
strain at maximum stress (εpc) as a function of elastic modulus of fiber, elastic modulus of
composite in multiple cracking stage, maximum elastic strain of the composite, or its first
cracking strain, debonding energy and constant frictional interfacial bond stress.
However, the verification of this model seems to be overestimated. The error may come
from the finding the elastic modulus of the composite in multiple cracking stage, which
can be obtained in several ways and is not constant during the multiple cracking stage.
Moreover, Tjibtobroto and Hensen (1991, 1993) verified their model by using
beam-flexural tests instead of direct tensile tests. The verification was performed with
very high volume fraction fiber-reinforced specimens (FR-DSP, Vf = 4% - 16%) with a
very fine matrix. There is no verification with low volume fraction fiber-reinforced
composites. Also the verification was conducted only on the flexural tests with small
strain gauges attached to the top and bottom part of the beam. Unfortunately, no
verification was carried out using a direct tensile test.
Kullaa et al (1998) proposed a model for maximum stress and strain at maximum
stress (σpc, εpc) based on several assumptions such as matrix cracks are planar and
perpendicular to the load, the fibers are separate, straight, smooth and fully flexible in
bending, the frictional shear stress is constant or decaying along the debonded length and
both the fibers and the bulk matrix behave in linear elastic fashion up to their tensile
strength. The maximum stress model is similar to the model proposed by Li et al (2000).
The strain model is an extension of the ACK theory by Aveston, Cooper and Kelly as it
can be used with discontinuous fibers with different distribution. However, the prediction
of strain at maximum stress (εpc) is the combination of elastic strain and plastic strain
where the plastic strain depends on matrix cracking which requires a parameter
accounting for the matrix spalling length. The researcher admitted that the spalled length
is still to be determined and the model is not fully developed. However, based on the
researcher verification, they admitted that the predicted maximum stress and strain at

16
maximum stress are relatively smaller than experimental observations.
2.5 Localization Stage (B-C), (After σpc, εpc)
Normally, the localization stage of the HPFRCC occurs after the peak (σpc, εpc).
At this stage, the tensile resistance significantly drops with increased displacement or
crack opening. No new cracking occurs, and the critical crack opens while other multiple
cracks are closing since the stress decreases causing strain-softening. The characteristics
of this stage depend on the pull-out behavior of the composite. In this process two
constitutive relations can be distinguished, the stress-strain curve and the stress-crack
opening curve. The former consists of the normalized sum of crack widths equal to all of
the closing cracks as well as the strain in the matrix. The latter consists of the critical
crack width of the localization crack. In analysis, these two constitutive relations should
be distinguished.
A comprehensive model for crack-opening behavior should cover the full possible
range between complete fiber pull-out and complete fiber rupture. The lower bound
model should come from the assumption that all fibers fail (no ductile behavior). The
upper bound model should come from the assumption that the fibers, virtually all aligned
in one direction, pull out perfectly and the crack opens perpendicular to the fiber
direction. It is also assumed that a certain proportion of the crack width is permanent. The
width of the opening crack is increased gradually while the others are closing. However,
complete crack closure cannot occur upon unloading due to a reversed frictional stress
which prevents fibers from slipping back into the matrix when the specimen are unloaded
(Wu et al., 1994)
The anticipated model for the localization stage was founded upon Visalvanich
and Naaman (1983) by proposing the post-cracking strength model. The f(δ) function is a
stress versus crack-opening function. By modifying the maximum post-cracking stress
and half the fiber length l/2 as the normalizing factors, respectively for the stress and
displacement axis, an analytical relationship representing the stress-crack opening law of
crack-opening composites was derived and representing as a behavior of tensile
responded after maximum stress.

17
In the model of stress versus crack-opening for tensile fracture in SFRC
conducted by Gopalaratnam and Shah (1987), an experimental program on notched
specimens of SFRC was performed. They concluded that after catastrophic debonding, a
constant frictional stress transfer ensures adequate post-cracking strength. Thereafter,
fiber slip resulting from the widening of the single matrix transverse crack yields a
composite stress-displacement relationship that is essentially linear with a negative slope.
Also the composite stresses can be obtained by superimposing solutions for individual
fiber pull-out with the solution for matrix softening after accounting for the randomness
in fiber length and orientation, and the compatibility of displacements at the crack.
Consequently, the model developed from experimental results and analytical model of
single fiber pullout seems to be realistically sensitive to important reinforcing parameters.
However, the researcher admitted that the effects of the plastic bending of fibers and of
the matrix crushing due to pull-out of inclined fibers were not considered.
2.6 Crack-Opening in HPFRCC
In addition to the post-cracking mechanism, the crack-opening displacement
model (COD) is vital to determine the overall strain behavior of HPFRCC in the multiple
cracking stage (A-B). The average strain in the composite is directly related to the crack-
opening displacement at every step of crack propagation.
Generally, for fiber reinforced cement based composites, the fiber bridging force
would not be constant but would depend on the opening and extent of the crack. It is
well accepted that crack propagation, in cementitious materials and in their composites, is
controlled by the formation of a crack-bridging zone behind the crack tip. This bridging
zone is often referred to as the fracture-process zone, in which microcracking and
inelastic deformations have occurred. Because of its dominant role, it is crucially
important to determine the law that governs the formation of the fracture-process zone
(i.e., the bridging-stress-crack-opening relationship).
Normally, the crack comprises three different zones. (Fig. 2.2)

18
Zone 1 represents the real crack in the composite along which the cracked
surfaces are under zero resisting stress because all the bridging fibers have either pulled
out or failed.
Zone II is defined as the pseudo plastic zone. It is a zone where the matrix has
cracked, but the bridging fiber still provides some resistance to pullout or tensile
stretching.
Zone III is a microcracking zone or a process zone of the composite. It is a zone
where elastic and inelastic deformations occur.
Naaman (1972) studied a statistical theory of strength for fiber reinforced
concrete using dogbone-shaped tensile specimen (i.e., with notch in the middle to control
the location of the crack position, which occurred during the test) and double cantilever
beams. He concluded that the setup can be used to measure some fracture properties of
fiber reinforced concrete and primarily estimate the size of a pseudo plastic zone
corresponding to an area where the matrix is cracked. In addition, he concluded that the
fibers are pulling out and the maximum crack tip opening is equal on average to half the
fiber length.
Later Visalvanich and Naaman (1983) extended the model for fiber reinforced
concrete by carrying out an extensive investigation dealing with modeling fracture in
fiber reinforced cementitious composites. They found that there is strong evidence that a
crack in a cementitious composite, subjected to a tensile stress field, starts propagating
when the crack-opening angle reaches a critical value, regardless of the crack length and
crack shape. The advancing of crack in a cementitious composite can be assumed to
maintain the same shape, provided the specimen size is sufficiently large and the crack is
not blunted. Also, they concluded that the post-cracking stress of steel fiber reinforced
mortar (with pullout behavior) gradually decreases from a maximum value to zero, while
the corresponding displacement or crack opening increases from that of the composite at
cracking to about half the fiber length. The post-cracking energy of the material is
substantially larger than its pre-cracking energy, which will control the fracture behavior
of the material.
Wecharatana and Shah (1983) studied the fracture resistance of fiber reinforced
concrete by using both double torsion specimens and notched beam specimens. The

19
classical linear elastic fracture mechanics analysis was modified to predict fracture
energy (R-Curves) for fiber-reinforced cement based composites. The predicted results
compared well with the experimental data from both types of tests. They introduced the
crack closing pressure model from the fracture energy and experimental observation.
They also concluded that the model is corresponding to the pull-out resistance of fibers.
However, their experimental observation and analytical model did not represent the
crack-opening displacement relation before the peak stress, only the stress after cracking
of the matrix.
Gopalaratnam and Shah (1987) reported the tensile failure of steel reinforced
mortar from notch testing (COD) to study the crack width of SFRC reinforced with
Hooked 0.5%, 1.0%, and 1.5% volume fractions of fiber. In their study, the crack
opening displacement was captured and compared with analytical predictions. They
conclude that the softening behavior of SFRC concrete, mortar, and paste seem primarily
related to the widening of a single crack. Measurements of optical crack widths, local
strains, and residual deformations all confirm the observation. An analytical model
proposed for both the fiber pull-out problem and tensile fracture of SFRC accounting for
all the major phenomenological processes of failure in such composites was suggested.
However, they concluded that the model is realistically sensitive to important reinforcing
parameters but should be improved for further study.
Li et al (1991) suggested that the composite bridging stress-COD curve can be
approximated by summing the contributions of the individual fibers bridging the matrix-
crack plane, by using the probability-density function of the orientation angle and
centroidal distance of fibers from the matrix plane.
Assuming a purely frictional fiber/matrix interface and complete fiber pullout,
Visalvanich and Naaman (1983) derived a semi-empirical model for the tension-softening
curve in discontinuous randomly distributed steel-fiber-reinforced mortar. With the same
assumptions, Li (1992) derived an analytical model taking into account an additional
frictional effect called the snubbing effect. The model provided a good prediction for the
post-cracking strength, the tension-softening curve, and composite fracture energy for a
number of composites in which the fibers did not rupture. However, discrepancies were
observed between the prediction of this model and some experimental measurements,

20
which suggest the occurrence of fiber rupture.
Maalej, Li, and Hashida (1994) developed a new technique to determine the
fracture process zone based on the J-integral analysis. The σ-δ relationships deduced
from the J-based technique have been compared with results of uniaxial-tensile tests.
Later Maalej, Li, and Hashida (1995) studied the effect of fiber on tensile
properties of short fiber composites by using notch-tensile specimens. In their studies, a
micromechanical model for the composite bridging stress-COD relationship that accounts
for fiber pull-out and tensile rupture was presented. The model accounts for a local
frictional effect and snubbing; however, the model does not account for fiber-bending
rupture and the possible effect of matrix spalling at the exit point of inclined fibers from
the matrix. The model assumes a fiber/matrix interface that is controlled by a constant
frictional bond stress. The post-peak curve predicted model is in good agreement with
the experimental result. However, the researcher admitted that if the fibers are brittle,
bending rupture will also need to be included in a composite model.
Nelson, Li, and Kamada (2002) studied the fracture toughness of Microfiber
reinforced cement composites. They attempted to quantify the reinforcing ability of
polypropylene (PP), polyvinylalcohol (PVA), and refined cellulose (RC) fibers in the
frontal process zone. They reported the successful experimental observation of the crack
by using an optical microscope, which was employed to visually monitor crack formation
during fracture toughness testing. The 50X magnification optical microwatcher lens was
focused on the notch tip. This allowed the visually observed frontal crack processes to be
correlated directly with the nominal tensile stress, and the crack mouth opening
displacement.
Yang and Fisher (2005) studied the fiber bridging stress-crack opening
relationship of fiber reinforced cementitious composites by investigating Engineered
Cementitious Composites (ECC) with PVA fibers (2%) by using double notch specimens.
They observed that the stress-crack opening curve becomes more consistent with
increasing the curing time of the specimen. The experimental results indicated a
relatively small variation in peak bridging strength over time. Furthermore, the
comparison of response at different curing times shows that the displacement, as well as
the total energy absorbed in the fiber bridging-crack opening process, decreases

21
significantly when curing time increases. They successfully applied the stress-crack
opening curve to simulate the multiple cracking and strain hardening behavior for ECC
under direct tension.
2.7 Crack Spacing in HPFRCC
The crack spacing in HPFRCC composite is the distance between two consecutive
cracks. Also the average crack spacing at saturation of cracking is a key parameter to
determine the equivalent strain at maximum post-cracking stress (εpc). From
experimental observation, the average crack spacing at the beginning of the multiple
cracking processes are relatively high. However, after the specimen elongation increases,
the number of cracks that occur increases. Consequently, the average crack spacing in
HPFRCC decreases until the composite reaches a saturation state generally at or before
the maximum stress (σpc). After this point, localization failure will occur and the average
crack spacing (excluding the localization crack) remains constant.
Yan, Wu and Zhang (2002), studied the cracking pattern in SIFCON. In their
research, the SIFCON volume fraction of fibers ranged from 4 % to 10 %. Digital image
analysis was conducted to capture the cracking pattern. They concluded that the higher
the volume fraction of fibers, the larger the amount of crack and the maller the crack
spacing.
Aveston et al. (1971) first proposed the conditions for multiple cracking in
continuous aligned fiber reinforced brittle matrix composites, notably known as the ACK
theory, and lay the foundation for subsequent research (Li et al, 1991-1992, Marshall et
al., 1985). In these models, uniform distribution of identical flaw size in the matrix is
implicitly assumed. Consequently, a deterministic composite strength during multiple
cracking is predicted, and usually does not agree well with experimental findings, as
observed for discontinuous random fiber reinforced cementitious composite (Wu and Li,
1995). This discrepancy is also found in a continuous aligned SiC reinforced calcium
aluminosilicate (Cho et al., 1992; Yang and Knowles, 1993). A rising load carrying
capacity beyond the first cracking strength during multiple cracking resembles strain
hardening of metals, often referred to as pseudo strain-hardening. Multiple cracks

22
develop over a wide range of load levels. Besides the difference in observed stress-strain
curves, the distribution of crack spacing also shows evidence against the assumption of
identical flaw size. A simple calculation was used to compute the crack spacing, x, on the
basis of force balance (Aveston et al., 1971; Wu and Li, 1992).
2
22 XLLLx ffftheory
d
πψ−−= (2.1) (Li et al, 1992)
Where
gπ
ψ 4= (2.2),
if
fmum
VdV
xτ
σ4
= (2.3)
where Lf is the fiber length, ω (=4/(πg)) is the correction factor for 3-D fiber
randomness, g is the snubbing factor.
Hence, after crack saturation, final crack spacing between x and 2x is expected.
However, from the comparison when applying to the SIFCON that was conducted
(section 3.9 step 2), largely underestimation is observed.
Kimber and Keer (1982) have calculated the average value of the crack spacing
for multiple matrix cracking when the matrix strength is a deterministic value, based on
analogy with minimum average spacing between cars of length x parked at random in an
infinite line. Their results yield an average spacing of 1.337x. However, experimental
observations of multiple crack spacing in steel/epoxy (Cooper and Sillwood, 1972), in
carbon/glass (Yang and Knowles, 1992), and in SiC/calcium alminosilicate (Cho et al.,
1992) do not support this prediction. Instead, better agreements between theory and
experiment are found when a statistical distribution of matrix cracking strength is
assumed (Cho et al., 1992; Cooper and Sillwood, 1972; Yang and Knowles, 1992).
In the ACK model, the energy balance at onset of cracking was used to predict the
elastic strain capacity of the composite reinforced with continuous fibers. Tjiptobroto and
Hansen (1991) modified the crack spacing model for discontinuous short fiber

23
composites by using the energy concept similarly to the model used in the ACK model.
The changes in the external work were assumed to be equal to the changes in internal
energy. The energy changes are obtained by evaluating the different energy terms before
and after the occurrence of a crack. The major difference between the ACK model and
Tjiptobroto and Hansen (1991) model for discontinuous fibers is in the combination of
the different energy terms associated with internal energy changes due to the occurrence
of a crack. This method will also be modified in this research to determine the ultimate
crack spacing from energy concept.
Regarding the nature of the distribution of crack spacing in composites, Wu and
Li (1992) proposed the hypothesis that the strength distribution may comes from a
distribution of matrix flaw sizes, interaction of matrix cracks and variation of fiber
reinforcement.
Later Wu and Li (1995) studied the stochastic process of multiple cracking in
fiber composites. In their research, the multiple cracking in discontinuous random fiber
reinforced brittle matrix composite is studied and simulated by a Monte Carlo simulation.
A good agreement of composite strength and average crack spacing between
experimental data and simulation results is found for a polyethylene fiber reinforced
cement paste (Vf = 2%). They suggested that the condition of crack propagation depend
on initial flaw size, external load, and fiber bridging effect. However, they found
differences between their prediction and experimental results and concluded that they
may come from the effects of crack interaction, which were not considered in their study.
Kanda, Lin and Li (2000) again proposed a model for crack spacing by modifying
the ACK theory (Aveston et al., 1971; Wu and Li, 1992) and using a statistical
distribution function to account for flaw size distribution, crack interaction, crack
characteristic and fiber volume fraction. However, many parameters are required from
experimental observations and need to be known to calibrate the model. They also
suggested that the actual crack spacing should be higher than the crack spacing obtained
from the modified ACK theory. In conclusion, they suggested that it is possible to predict
the crack spacing reasonably accurately.
In this research, the equivalent number of cracks in a typical specimen, the
average crack spacing and width at saturation cracking are addressed in Chapter 6.

24
Figure 2.2: Crack model for HPFRCCs showing (a) fracture zone and (b) possible stress
distribution (from Visalvanich and Naaman, 1983)

25
CHAPTER 3
EXPERIMENTAL PROGRAM FOR EVALUATING HPFRCC TENSILE BEHAVIOR
3.1 Introduction
As described in Chapter 2, considerable research has already been carried out to
evaluate the response of HPFRCCs in tension (Swamy and Mangat, 1974; Visalvanich
and Naaman, 1983; Naaman et al, 1987, 1992, 1996; Nammur, 1989; Li and Lieung
1991; Mishra 1995; Lin and Li, 1997; Kullaa et al, 1998; Kanda, Lin and Li, 2000;
Kabele, 2004; Tjiptobroto and Hansen, 1991, 1993; Alwan and Naaman, 1994;
Chandrangsu and Naaman, 2003). Based on these and other results, micro-scale models,
which involve a direct description of three phases of materials, i.e. fibers, matrix and
interfacial zone, have been introduced. However, an entire model for HPFRCCs behavior
in tension is not yet available (e.g., the linear-elastic stage, multiple cracking stage, and
the localization failure stage) and none of the existing models have the capability to
represent the effect of statistical variability and the accuracy of the predicted behavior.
Experimental studies (direct tensile test, crack-opening displacement test, ring
tensile test) were conducted to clarify the parameters for each stage of the response and
lead to the development of a complete model for HPFRCs. Data from the experimental
programs were processed in analytical works, and were utilized in the proposed model.

26
Figure 3.1: Flow chart of experimental program
3.2 Materials
3.2.1 Mortar
The cementitious composite used throughout this study is a regular mortar, having
an unconfined compressive strength of about 56 MPa (8.1 ksi). Cement utilized
throughout this research was commercially available Type III Portland cement
manufactured by Holcim Cement Company, which provides a rapid developing strength.
Evaluation of post-cracking tensile behavior of HPFRCCs
(σcc , εcc)
(σpc , εpc)
Multiple cracking
Direct tension
Ring tension
Implementation of prediction model and verification
Data collecting and characteristic Analysis
HPFRCC stress-strain relation
COD notch test

27
However, this type of cement generates an elevated hydration heat compared to other
types of Portland cement. Consequently, the stresses in the concrete at an early age could
be significant. A summary of the cement compositions and properties provided by the
manufacturer is presented in Table 3.1.
Table 3.1: Cement compositions and properties of Portland cement type III
The mixture ratio, based on weight of cement, sand, fly ash, and water is 1, 1, 0.15,
and 0.35, respectively. In addition to this, some admixtures, such as VMA, air entrapping
agent, and superplastizer, were applied to improve the behavior (mixing, compacting) of
HPFRCC mixtures.
Table 3.2: Mix proportion of matrix by weight
3.2.2 Fibers
Four types of fibers were investigated in this study, two polymeric fibers and two
steel fibers. Their properties cover a wide range of mechanical properties, as illustrated
in Table 3.3. A detailed description of each type of fiber is described in the following
section.

28
Figure 3.2: Fibers used in present research, (a) PVA, (b) Spectra, (c) Hooked, and (d)
Torex
Figure 3.3: Fibers used in present research: length comparison
(a) PVA (b) Spectra
(c) Hooked (d) Torex

29
Table 3.3: Fiber properties
3.2.2.1 Polyvinyl Alcohol (PVA)
Polyvinyl Alcohol (PVA) fibers have been used on a large scale in the
construction of thin products as a replacement for Asbestos fibers due to their good
mechanical properties and physical characteristics.
A monofilament PVA fiber was used in this study, possessing a tensile strength
about half to one third of that of Spectra fiber. Furthermore, the monofilament PVA fiber
costs approximately 1/8 of Spectra fiber. Generally, the fiber section is close to circular.
Its diameter was 0.19 mm and its length was 12 mm. High chemical bond strength, due to
the hydrophilic nature of PVA fiber, is a property characteristic of PVA. This high
chemical bond strength is due to a strong hydrogen intermolecular bond resulting in high
bond strength between PVA fiber and cementitious materials. However, the high bond
strength and relatively low tensile strength lead to a fiber rupture tendency during the
opening of a matrix crack, rather than a more desirable pull-out process. Therefore, an
oiling agent is usually applied onto the fiber surface during the production process to
reduce bond (Li et al., 2002). However, the long term effectiveness of such oiling agent
has not been demonstrated.

30
Figure 3.4: PVA fiber
Figure 3.5: PVA fiber in composites
3.2.2.2 Spectra
Spectra fiber (Trade name) is made from ultra-high molecular weight
polyethylene. It has outstanding strength and toughness, but a relatively weak bond
strength. Spectra fiber material is referred to as ultra high modulus PE (UHMPE), which
is produced with a very high molecular orientation by gel spinning, and subsequent
drawing which yields fibers having up to 85% crystalline structure with 95% parallel
orientation. The polymer chains of UHMPE are bound together at various points by
mechanical cross linking. This produces strong inter-chain forces in the resulting
filaments that can significantly increase the tensile strength. The filaments emerge with
an unusually high degree of orientation relative to each other, further enhancing strength.
Although the bond strength of Spectra fiber is relatively weak, it exhibits a slip-hardening
behavior during fiber pullout, which is caused in part by an abrasion effect. When a
Spectra fiber is pulled out from a cementitious matrix, the fiber surface is damaged and
stripped into small fibrils due to the abrasion effect. These small fibrils jam the tunnel
surrounding the fiber, which in turn prevents the fiber from being pulled out. This
mechanism significantly increases the frictional bond strength between the Spectra fiber
and cement matrix, which leads to a slip-hardening response. In conclusion, having a
tensile strength as high as steel fiber, but seven times lighter in weight, Spectra fiber is
one of the toughest and lightest polymetric fibers. In this study, a Spectra fiber having a
length of 38 mm and a diameter 0.038 mm diameter was investigated.
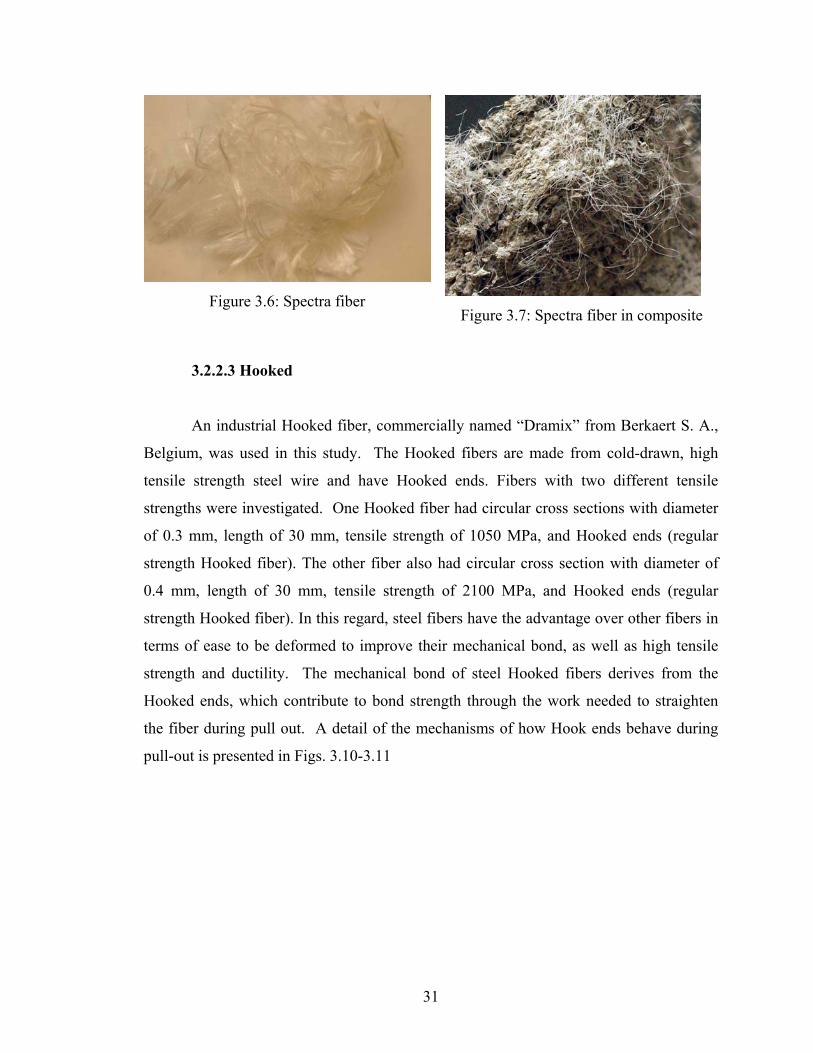
31
Figure 3.6: Spectra fiber
Figure 3.7: Spectra fiber in composite
3.2.2.3 Hooked
An industrial Hooked fiber, commercially named “Dramix” from Berkaert S. A.,
Belgium, was used in this study. The Hooked fibers are made from cold-drawn, high
tensile strength steel wire and have Hooked ends. Fibers with two different tensile
strengths were investigated. One Hooked fiber had circular cross sections with diameter
of 0.3 mm, length of 30 mm, tensile strength of 1050 MPa, and Hooked ends (regular
strength Hooked fiber). The other fiber also had circular cross section with diameter of
0.4 mm, length of 30 mm, tensile strength of 2100 MPa, and Hooked ends (regular
strength Hooked fiber). In this regard, steel fibers have the advantage over other fibers in
terms of ease to be deformed to improve their mechanical bond, as well as high tensile
strength and ductility. The mechanical bond of steel Hooked fibers derives from the
Hooked ends, which contribute to bond strength through the work needed to straighten
the fiber during pull out. A detail of the mechanisms of how Hook ends behave during
pull-out is presented in Figs. 3.10-3.11

32
Figure 3.8: Hooked steel fiber (before
mixing)
Figure 3.9: Hooked steel fiber in
composites
Figure 3.10: Pull-out mechanism in
Hooked steel fiber
Figure 3.11: Formation of two plastic
hinges for maximum resistance

33
3.2.2.4 Twisted Polygonal Steel Fibers (Torex)
A newly developed steel fiber of optimized geometry called “Torex” (Twisted
Polygonal Steel Fibers) was introduced by Naaman at the University of Michigan with a
subsequent U.S. patent No. 5989713 (1999).
Figure 3.12: Torex fiber geometry
A prototype machine developed especially for research was used to produce twisted
polygonal steel fibers for testing HPFRC composites. To make a twisted fiber, this
machine takes a round wire, shapes it, twists it and then cuts it in a continuous process.
The speed of each component of the machine can be controlled: thus, the fibers can be
made with different numbers of twists and lengths. Moreover, studies by Naaman and
Guerrero (1999), Naaman and Sujivorakul (2002), Kim and Naaman led to development
optimized geometry for various material parameters; moreover, Torex fibers offer a ratio
of lateral surface area to cross sectional area larger than that of round fibers. Torex fiber
is made of high strength steel wire with a polygonal cross section, and twisted along its
length. The fibers are characterized by the shape of their cross sections and the number of
twists or ribs per unit length.
The larger surface area of Torex fibers leads to a direct increase in the
contributions of the adhesive and frictional components of bond. Moreover, unlike a fiber
with a round section, a fiber of polygonal section can be twisted along its longitudinal
axis, developing ribs, creating a significant mechanical bond component. The outstanding
advantage of Torex fiber is in its pull out resistance, which increases with an increase in

34
slip while being pulled out from the matrix. Torex fibers can maintain a high level of
resistance up to slips representing 70% to 90% of embedded length. This unique bond-
slip behavior is due to the successive untwisting and locking of the fiber embedded
portion in the tunnel of the matrix during slip. Photos of Torex fibers used in this study
are shown in Figs. 3.13-3.14.
Figure 3.13: Torex steel fiber
Figure 3.14: Torex steel fiber in
composites
Two types of Torex fiber were utilized in this study, regular strength Torex fiber
(tensile strength of 1380 MPa), and high strength Torex fiber (tensile strength of 2760
MPa).
3.3 Specimen Preparation
All specimens of this research were prepared in Plexiglas molds. During the
mixing, care was taken to prevent clumping of the fibers. The molds were lightly oiled
before pouring of the HPFRCC materials. The dry components of the mortar mix were
first combined with approximately 25% of the total water required. The fibers, along with
the remaining 75% of the water, were intermittently added as the mixing process
progressed. The fibers were added slowly, while mixing continued, in a sprinkling
fashion in order to distribute the fibers thoroughly throughout the mix. Particular care
was paid while adding the Spectra fibers because it was observed that Spectra fibers
could potentially trap large amounts of air in comparison with the other fibers used in this
study. After casting, the specimens were kept under preventive cover while remaining in

35
the molds for 24 hours. After that, the specimens were removed from the molds and
placed to cure in a water tank for at least 14 days. Next, they were left to air dry for a
period of at least 48 hours prior to testing. After drying, thin poly-urethane spray was
applied to the surface of the specimens to aid in crack detection during and after testing.
It should be noted that HPFRCC reinforced PVA specimens did not use exactly the same
mixture as referred to in some ECC specification, (Engineered Cementitious
Composites), in order to provide a fair comparison with other fibers.
3.4 Direct Tensile Test (Dogbone Test)
To obtain increased understanding about HPFRCCs behavior program, under
monotonic direct-tensile load, a conventional dogbone shape specimen (Figs. 3.15, 3.16)
was selected to detect elongation occurring during the test. Two Linear Variable
Differential Transformers (LVDTs) were attached near the grips connected to the
specimen (Fig. 3.17). The top and bottom ends of the specimens were held by specially
designed grips attached to the MTS 810 machine. The average elongation was obtained
from the two LVDTs placed on opposite sides of the specimen at a predetermined gage
spacing (about 178 mm or 7.0 inches). The strain was calculated from the gauge length.
The tensile stress σt and tensile strain εt were calculated from the following equations:
AT
t =σ (3.1)
g
gt L
LΔ=ε (3.2)
where T is the tensile load obtained from the load cell, A is the cross sectional
area of the specimens, gLΔ is the elongation of the tensile specimen (average value from
the two LVDTs), and gL is the gauge length of the tensile specimens (178 mm or 7.0
inches).
Additionally in some series of tests, Optotrak sensors were placed on the
specimens’ surfaces to also measure deformation precisely at the surface (and ascertain
the values obtained from the LVDTs). Moreover, some specimens were monitored via
digital camera to observe closely the specimen cracking behavior. Furthermore, the

36
cracking patterns, crack spacing, and crack width were investigated.
Figure 3.15: Specimen dimension of tensile dogbone specimens (mm)
Figure 3.16: Specimen dimension of tensile dogbone specimens (inch)

37
(a) (b)
Figure 3.17: Tensile test setup, (a) Specimen ready for testing and (b) Instrumentation
Figure 3.18: Dogbone specimen
Figure 3.19: Mold for dogbone specimen and
added end reinforcement
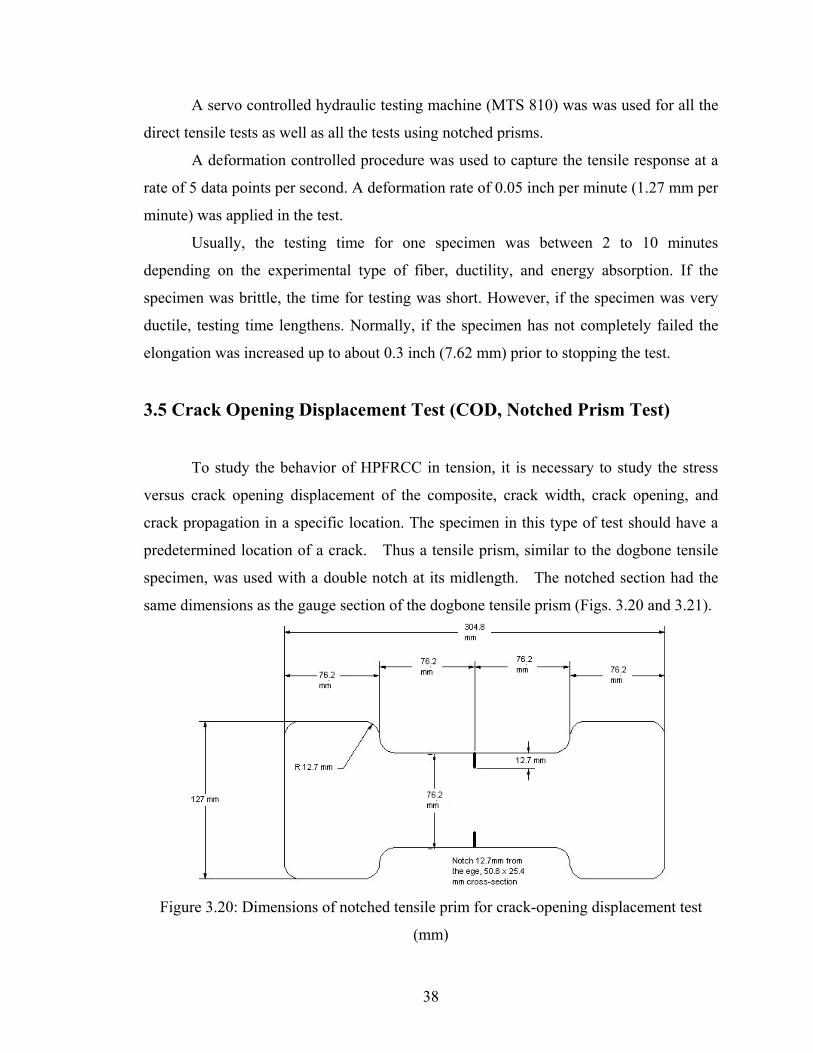
38
A servo controlled hydraulic testing machine (MTS 810) was was used for all the
direct tensile tests as well as all the tests using notched prisms.
A deformation controlled procedure was used to capture the tensile response at a
rate of 5 data points per second. A deformation rate of 0.05 inch per minute (1.27 mm per
minute) was applied in the test.
Usually, the testing time for one specimen was between 2 to 10 minutes
depending on the experimental type of fiber, ductility, and energy absorption. If the
specimen was brittle, the time for testing was short. However, if the specimen was very
ductile, testing time lengthens. Normally, if the specimen has not completely failed the
elongation was increased up to about 0.3 inch (7.62 mm) prior to stopping the test.
3.5 Crack Opening Displacement Test (COD, Notched Prism Test)
To study the behavior of HPFRCC in tension, it is necessary to study the stress
versus crack opening displacement of the composite, crack width, crack opening, and
crack propagation in a specific location. The specimen in this type of test should have a
predetermined location of a crack. Thus a tensile prism, similar to the dogbone tensile
specimen, was used with a double notch at its midlength. The notched section had the
same dimensions as the gauge section of the dogbone tensile prism (Figs. 3.20 and 3.21).
Figure 3.20: Dimensions of notched tensile prim for crack-opening displacement test
(mm)
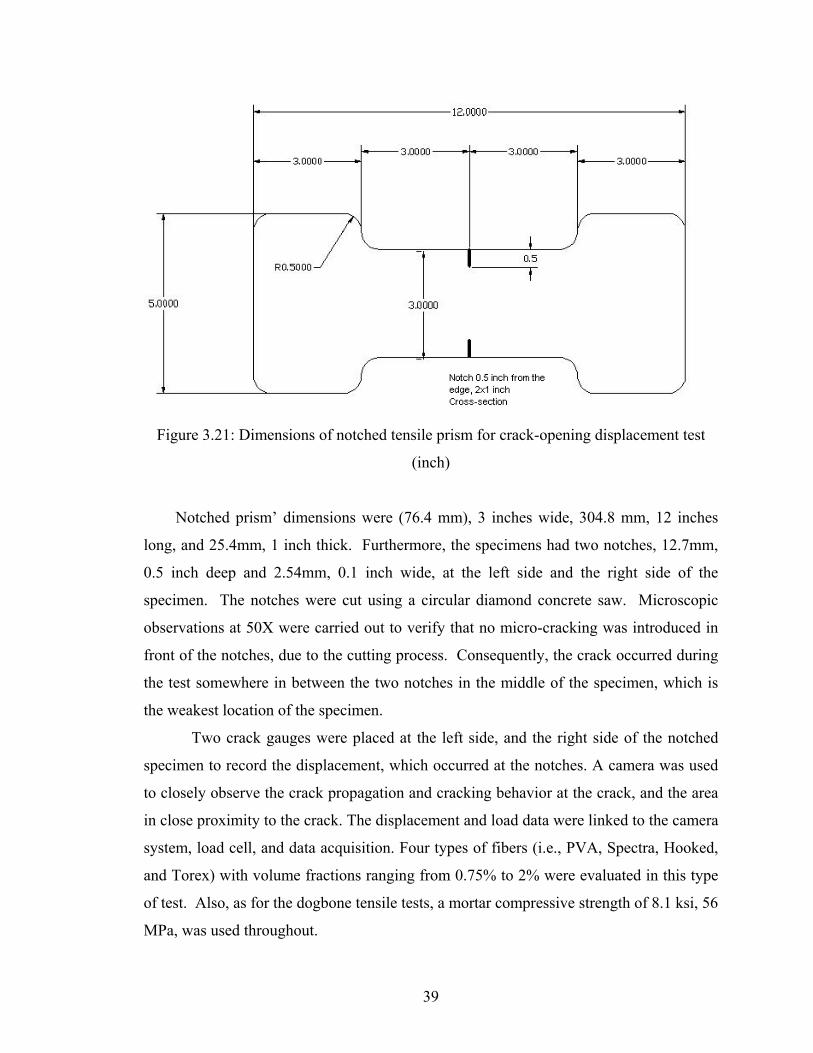
39
Figure 3.21: Dimensions of notched tensile prism for crack-opening displacement test
(inch)
Notched prism’ dimensions were (76.4 mm), 3 inches wide, 304.8 mm, 12 inches
long, and 25.4mm, 1 inch thick. Furthermore, the specimens had two notches, 12.7mm,
0.5 inch deep and 2.54mm, 0.1 inch wide, at the left side and the right side of the
specimen. The notches were cut using a circular diamond concrete saw. Microscopic
observations at 50X were carried out to verify that no micro-cracking was introduced in
front of the notches, due to the cutting process. Consequently, the crack occurred during
the test somewhere in between the two notches in the middle of the specimen, which is
the weakest location of the specimen.
Two crack gauges were placed at the left side, and the right side of the notched
specimen to record the displacement, which occurred at the notches. A camera was used
to closely observe the crack propagation and cracking behavior at the crack, and the area
in close proximity to the crack. The displacement and load data were linked to the camera
system, load cell, and data acquisition. Four types of fibers (i.e., PVA, Spectra, Hooked,
and Torex) with volume fractions ranging from 0.75% to 2% were evaluated in this type
of test. Also, as for the dogbone tensile tests, a mortar compressive strength of 8.1 ksi, 56
MPa, was used throughout.
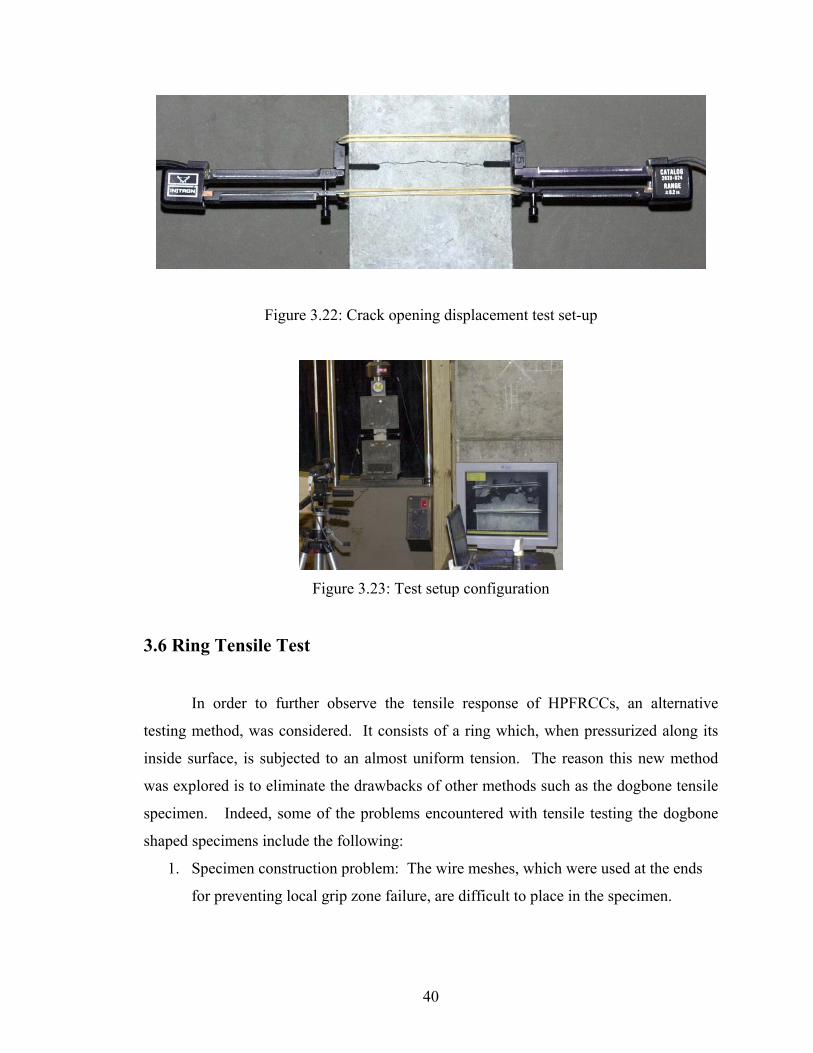
40
Figure 3.22: Crack opening displacement test set-up
Figure 3.23: Test setup configuration
3.6 Ring Tensile Test
In order to further observe the tensile response of HPFRCCs, an alternative
testing method, was considered. It consists of a ring which, when pressurized along its
inside surface, is subjected to an almost uniform tension. The reason this new method
was explored is to eliminate the drawbacks of other methods such as the dogbone tensile
specimen. Indeed, some of the problems encountered with tensile testing the dogbone
shaped specimens include the following:
1. Specimen construction problem: The wire meshes, which were used at the ends
for preventing local grip zone failure, are difficult to place in the specimen.

41
2. Bending problem: Eccentricity that occurs during loading due to crack formation
causes difficulties in analyzing the results.
3. Size problem: the gauge length where measurements can be made is small in
comparison to the total length of the specimen (in our case only 8/21 inches)
4. Testing problem: The direct tensile test is sensitive to many parameters, in
particular alignment and gripping conditions.
A ring-tensile test of concrete was then considered as an alternative testing
technique that would eliminate the above described problems.
The ring-setup was designed using thick steel plates as shown in Fig. 3.24. A
steel cone shaped wedge was manufactured that fits inside an inverse conical opening
formed by steel plates cut and assembled in the shape of pie slices. Driving the cone
inside the opening pushed the plates out, exercising pressure on the inside of the ring
specimen, thus creating the tensile stresses in the ring. The specimen tested was a
circular HPFRCC ring having an inside diameter equal to 304.8 mm, 12 inches and an
outside diameter equal to 406.4 mm, 16 inches. The specimen width was 50.8 mm, 2
inches, while the specimen’s depth was 76.2 mm, 3 inches.
Figure 3.24: Ring tensile test set-up
Figure 3.25: HPFRCC ring specimen
An Instron universal testing machine was used to apply the load vertically to the
conical prism drove in the wedge, which transformed the force horizontally to break the
specimen.

42
Figure 3.26: Ring HPFRCC specimen
Figure 3.27: Ring HPFRCC setup
A preliminary study was conducted to determine the most efficient number of
components needed to break the specimen. Three setups were considered; 2 pieces of
steel plates, 4 pieces of steel plates and 8 pieces of steel plates. Eight pieces were
subsequently selected to further study possible means for applying stress to the HPFRCC
specimen, using a finite element analysis. A cone wedge’s slope, θ = tan-1 (1.5/9) =
9.4623o was selected.
Figure 3.28: Interaction between steel plate and cone wedge setup
3.6.1 Result of Finite Element Analysis
Figure 3.29: Stress-contour of finite element analysis for two, four, and eight piece
steel-plate configurations

43
The result of the finite element analysis are illustrated in Fig. 3.29 where it is
clear that using the configuration with 8 steel plate pieces as a configuration leads to
minimal stress concentration when compared with the other two configurations. Thus the
8 steel plates configuration was selected.
The advantages of this test method are as follows:
1. The specimen does not require any internal specimen reinforcement.
2. Multiple cracking behavior is observable over a large specimen area, (i.e., the
entire specimen) compared to the gauge length test of the Dogbone specimen,
which can be seen only in the specimen’s middle portion.
3. The test remains very stable during loading, in comparison to a direct tensile
test.
Figure 3.30: Specimen setup Figure 3.31: Optotrak sensors

44
Figure 3.32: Testing machine and tensile
ring setup
Figure 3.33: Testing machine and tensile
ring setup
An Instron universal testing machine was employed in specimen testing. To begin
the process, monotonic loading was used on top of the cone wedge, which was inserted
into the steel plates exerting force upon the specimen. The force imposed upon the cone
wedge caused it to push through the hole inducing force on the steel plates, resulting in
expansion and specimen loading.
Three methods were utilized to measure the specimen’s displacement.
Figure 3.34: LVDT setup at specimen’s surface
Figure 3.35: LVDT setup at cone
wedge
The vertical displacement of the conical wedge was measured by an LVDT.
Furthermore, a spring type LVDT was connected by steel wire running along the outer
perimeter of the ring, to measure the total expansion.

45
A third method to measure displacement was used utilizing an Optotrak
instrument. The Optotrak camera system was placed on the table horizontally. Four
sensors were situated at the surface of the ring specimens to measure the surface level
displacement. The data was then used to estimate the total expansion of the ring under
load.
3.7 Data Acquisition System
Figure 3.36: Data collecting system for the direct tension tests
The experimental results from the direct tensile tests (dogbone test) and the crack
opening displacement tests (COD) are loads and related displacements. Testing data was
obtained from the experiment by using sensors (LVDTs etc.) connected to a National
Instrument DAC 6036E 16 Bits 16 channels 200/ms data acquisition card. The data was
subsequently stored in a laptop computer. The load versus displacement relationship was
then plotted using this data file. The Labview 7.1 data acquisition program was utilized to
preprocess the data. To achieve the highest accuracy level of the collecting data, the
sampling rate of data was set at 1000 points per second and the averaging process was
carried out by reducing the rate of sampling to 5 data per second. The AC/ LVDTs
sensors were attached to a Schaevitz signal conditioner to prepare the sensor’s signal for
appropriate voltage and response before processing the signal via the data acquisition
card. The load data and machine displacement position were also obtained from the

46
sensors in the MTS-810 universal testing machine and were linked to the data acquisition
card. By combining the load data from the load cell, and the displacement data from the
LVDTs, the load-displacement relation was presented in real-time and recorded during
the test.
Figure 3.37: Data acquisition system
Figure 3.38: View of real-time records of
stress-elongation response curves
A non-contact motion measuring instrument, called Optotrak was used in this
experimental program. Three infrared cameras from the Optotrak system were connected
to the computer running NDI software. Infrared sensors were attached to the specimen at
an observable predetermined gauge location. The displacements between two sensors
were recorded and used to compute strains. The movement of the infrared sensors
attached to the specimen was measured in the X, Y, and Z directions. The data of the
infrared sensors was linked to the data acquisition computer and was recorded at the same
time as the data from the machine load cell, machine displacement, and the two LVDTs
attached to the specimen. Thus, data derived from the four types of sensors were recorded
simultaneously.

47
3.8 Image Acquisition
Figure 3.39: Diagram for image acquisition system
A visualization system from National Instruments was used in this research. It
comprised an NI-1455 Compact Vision System with Labview RT 7.1 image processing
software. The image acquisition system was connected to a Sony XCD-710 digital
camera. The camera was equipped with a Nikkor 60mm f2.8 high definition macro lens.
The pictures taken from the digital camera were immediately linked to the experimental
data obtained from the load cell, machine displacement, and LVDT, and printed in the
images to show the status of testing at the time the pictures were taken. Consecutive
serial pictures of the test were kept and stored in the main memory of the NI-1455
Compact Vision System, and later on, exported to the main storage area in the data
acquisition computer. Synchronization of the data was performed in real-time and in an
effective manner. The data from the camera was reviewed and analyzed in depth. The
results from the analysis are described in Chapter 6.
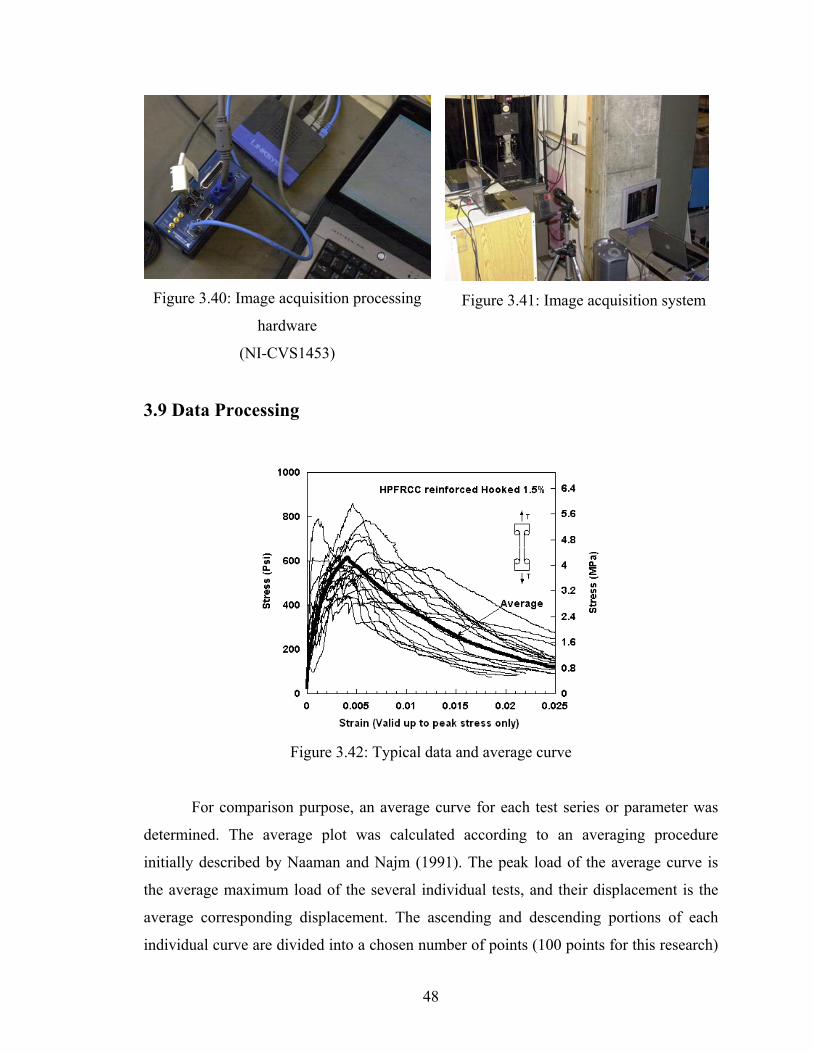
48
Figure 3.40: Image acquisition processing
hardware
(NI-CVS1453)
Figure 3.41: Image acquisition system
3.9 Data Processing
Figure 3.42: Typical data and average curve
For comparison purpose, an average curve for each test series or parameter was
determined. The average plot was calculated according to an averaging procedure
initially described by Naaman and Najm (1991). The peak load of the average curve is
the average maximum load of the several individual tests, and their displacement is the
average corresponding displacement. The ascending and descending portions of each
individual curve are divided into a chosen number of points (100 points for this research)

49
and their corresponding loads and displacements recorded. The coordinates of the n th
point (from 1 to 100) of each curve are then averaged at their same rank to obtain the
average curve.
3.10 Concluding Remarks
This chapter covered the material properties and test procedures used in this study
and included a detailed description of constituent material properties, mixture
composition, fiber properties, specimen preparation, environmental conditions, testing
configuration, data acquisition, and the main parameters of the testing program. The
objective was to evaluate the behavior of HPFRCCs over the entire post-cracking range.

50
Table 3.4: Summary of testing program
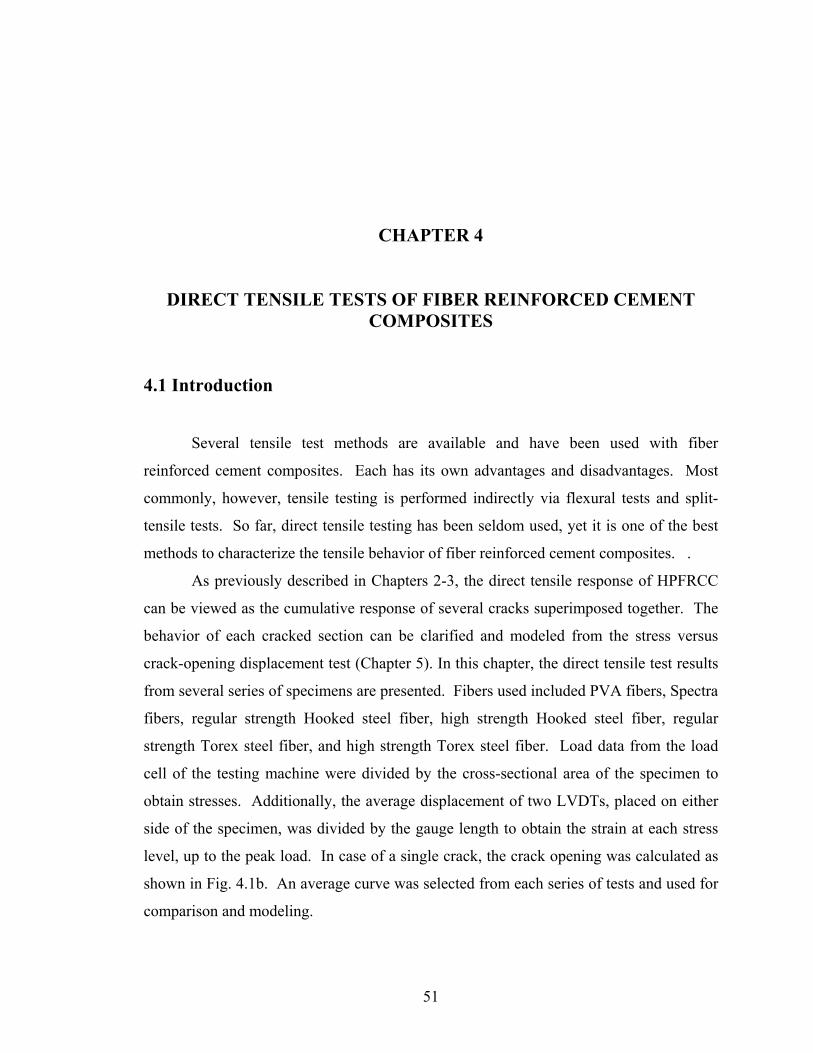
51
CHAPTER 4
DIRECT TENSILE TESTS OF FIBER REINFORCED CEMENT COMPOSITES
4.1 Introduction
Several tensile test methods are available and have been used with fiber
reinforced cement composites. Each has its own advantages and disadvantages. Most
commonly, however, tensile testing is performed indirectly via flexural tests and split-
tensile tests. So far, direct tensile testing has been seldom used, yet it is one of the best
methods to characterize the tensile behavior of fiber reinforced cement composites. .
As previously described in Chapters 2-3, the direct tensile response of HPFRCC
can be viewed as the cumulative response of several cracks superimposed together. The
behavior of each cracked section can be clarified and modeled from the stress versus
crack-opening displacement test (Chapter 5). In this chapter, the direct tensile test results
from several series of specimens are presented. Fibers used included PVA fibers, Spectra
fibers, regular strength Hooked steel fiber, high strength Hooked steel fiber, regular
strength Torex steel fiber, and high strength Torex steel fiber. Load data from the load
cell of the testing machine were divided by the cross-sectional area of the specimen to
obtain stresses. Additionally, the average displacement of two LVDTs, placed on either
side of the specimen, was divided by the gauge length to obtain the strain at each stress
level, up to the peak load. In case of a single crack, the crack opening was calculated as
shown in Fig. 4.1b. An average curve was selected from each series of tests and used for
comparison and modeling.

52
.
Strain hardening composite Strain softening composite
(a)
(b)
Figure 4.1: Typical tensile behavior of (a) strain hardening composite and (b) strain
softening composite
P
L
ΔL
Crack width: LAPLLw Δ≈−Δ=
P
L
ΔL
Strain: LLΔ
=ε

53
Figure 4.2: Typical behavior of HPFRCC
The tensile response of all fiber reinforced cement composites can be classified
into two categories: a strain hardening composite or a strain softening composite. If the
specimen exhibits strain hardening composite, the pseudo strain up to the peak laod can
be calculated from the elongation (ΔL) divided by the total gauge length (L). However, if
the specimen exhibits strain-softening behavior (e.g., FRC, or HPFRCC after the
specimen reaches the localization phase, or the crack opening phase), crack width can be
calculated from the elongation of the specimen. The behavior in the strain softening
stage results from the pull out behavior and/or rupture of fibers interacting with the
cementitious material. Typically, the strain softening behavior occurs after the specimen
reaches its maximum tensile resistance (Fig. 4.1).
Fiber pull-out
Fiber
failure
Possible
localization
range
Multiple
cracking stage Maximum post-cracking stress
A
B
C
Stress
Strain
(Displacement)

54
Figure 4.3: Strain at maximum stress and strain at the end of multiple cracking stages
Typically, the area under the stress-strain curve represents the energy absorbed by
the specimen during direct tensile testing, and the area under the curve after localization
represents the surface energy of the composite. In this chapter, the energy (area under the
curve) of the specimens up to first cracking stress, maximum post-cracking tensile stress,
and at the end of the multiple cracking stages, were analyzed and investigated. The point
representing the end of multiple cracking was introduced because in many tests some
additional cracks occurred after the peak load, and thus the strain or deformation at the
peak load did not fully represent the end of multiple cracking. Figure 4.3 illustrates a
typical such response.
4.2 Direct Tensile Behavior of Mortar without Fibers
Generally, the tensile strength of cement mortar (without fiber) is approximately
10% of its compressive strength. Table 4.1 illustrates the tensile strength of mortar as a
function of its compressive strength.

55
Table 4.1: Common mechanical properties of mortar
Common design value Property Observed range
U.S. units S.I. units
Direct
tensile
strength,
f’ct
'' 53 cc ftof −− ''
313 ccc forf γ−− '' 0069.025.0 ccc forf γ−−
Split
cylinder
tensile
strength
'' 76 cc ftof −− '' 6.06 ccc forf γ−−
'' 00138.050.0 ccc forf γ−−
Modulus
of
rupture fr
'' 125.7 cc ftof −−
'5.7 cf− '62.0 cf−
Poisson’
s ratio, υ 0.15 to 0.20 0.20 0.20
Table 4.2: Identification of mortar specimens and mortar composition
Identification
of specimen
Type of
specimen
Number
of
specimen
Type of
matrix
Type of
fibers
Volume
of fibers
Vf(%)
D-N-0 Dogbone 7 mortar NA NA
In order to provide a basis of comparison and for control, the direct tensile
strength of mortar was investigated. Seven mortar specimens, without fiber, were tested
using dogbone specimens with same dimensions as the fiber reinforced specimens and
same mortar composition (Table 4.2). They were identified as series D-N-O (Table 4.2),
Results of the experimental tests are summarized in Table 4.3 and 4.4, and include
the maximum stress (or first cracking stress), the corresponding strain, and the elastic

56
modulus of the material. The stress-strain curves recorded are plotted in Fig. 4.4; photos
of a typical specimen during testing are shown in Fig. 4.5, and photos of specimens after
testing are shown in Figs. 4.6 and 4.7.
Theoretically, the tensile response of mortar should exhibit linear elasticity up to
the first cracking point, then fail by the opening of the first crack. However, from the
experimental observations (Fig. 4.5), the stress-strain behavior of the mortar specimens
did not show perfect linear elastic behavior. Indeed beyond about 70% of the maximum
load, the response shows an inelastic behavior with a decreasing slope. This may be
attributed to the slow progress of the critical crack along the critical section prior to
localization, thus leading to a reduction in cross-sectional area and stiffness. In Fig. 4.5b,
the initiation of the critical crack can be observed on the right lower side of the specimen.
Until this crack reaches the other side, a reduction in stiffness observed until brittle
failure occurs.
The elastic modulus measured at (10% to 50% of fc) ranged between 1132 ksi to
3875 ksi, (7804 to 26717 MPa) with an average of 2014 ksi, (13886 MPa). Note as
expected, the mortar appears to have significantly less stiffness than regular concrete with
same compressive strength (3500-4500 ksi, 24131-31026 MPa). The lower stiffness
results from a lack of coarse aggregates in the mortar composition.
Note that the cracking strength observed ranged from 103.3 psi to 281.6 psi,
(0.712 to 1.941 MPa) with an average of 181.52 psi (1.25 MPa). However, the variability
was also high. The coefficient of variation is approximately 50.08% for the maximum
stress, and 53.48% for the modulus of elasticity. This large variability is due to
sensitivity of direct tensile testing of brittle materials like mortar (weakest link effect), the
gripping conditions, and the variation due to mixing and curing. The approximate direct
tensile strength from this test is around '2 cf psi, which is lower than typically found in
a standard ASTM mortar test utilizing a briquette )53( '' psiftof cc − . The average
observed strain at failure was at 0.000196, and its coefficient of variation was higher than
found in maximum stress and the modulus of elasticity (68.41%).
All specimens failed in a brittle manner. Only a single crack was observed in
each specimen. With most specimens, the failure crack occurred in the middle portion of

57
the specimens, that is, within the gauge length.
Table 4.3: Direct tensile test of mortar (US-units)
Identification of
specimen Cast date Test date
Maximum
stress (psi)
Modulus of
elasticity (ksi) Strain at failure
D-N-O-1 6/21/2006 9/12/2006 132.75 1610 0.00011
D-N-O-2 6/21/2006 9/13/2006 224.12 1987 0.00025
D-N-O-3 6/21/2006 9/12/2006 103.33 2045 0.0001
D-N-O-4 6/18/2006 9/13/2006 130.94 1759 0.00025
D-N-O-5 6/18/2006 9/13/2006 127.38 1694 0.00015
D-N-O-6 6/18/2006 9/12/2006 270.50 1132 0.00045
D-N-O-7 3/12/2006 2/16/2007 281.60 3875 0.00006
Average 181.52 2014.57 0.000196
Standard deviation 94.54 1077.35 0.000134
Coefficient of variation (COV) (%) 52.08 53.48 68.41
Table 4.4: Direct tensile test of mortar (SI-units)
Identification of
specimen Cast date Test date
Maximum
stress (MPa)
Modulus of
elasticity
(MPa)
Strain at failure
D-N-O-1 6/21/2006 9/12/2006 0.915 11101 0.00011
D-N-O-2 6/21/2006 9/13/2006 1.545 13700 0.00025
D-N-O-3 6/21/2006 9/12/2006 0.712 14100 0.0001
D-N-O-4 6/18/2006 9/13/2006 0.903 12128 0.00025
D-N-O-5 6/18/2006 9/13/2006 0.878 11680 0.00015
D-N-O-6 6/18/2006 9/12/2006 1.865 7805 0.00045
D-N-O-7 3/12/2006 2/16/2007 1.942 26717 0.00006
Average 1.252 13890 0.000196
Standard Deviation 0.652 7428 0.000134
Coefficient of Variation (COV) (%) 52.08 53.48 68.41

58
Figure 4.4: Testing results of specimen without fiber (control specimen)

59
(a) Initial status
Stress = 29.75 psi
(0.205 MPa) No observable crack.
(b) Maximum stress status
Stress = 280.243 psi
(1.932 MPa)
Small visible crack at the
lower part of specimen.
(c) Failure
Stress = 0 psi, (0 MPa)
Completed crack.
Brittle failure.
Figure 4.5: Testing of typical specimen without fiber (D-N-O-7), (a) initial status, (b)
maximum stress status, and (c) failure
Figure 4.6: Dogbone specimen without fibers (specimen 1, 2, 3)
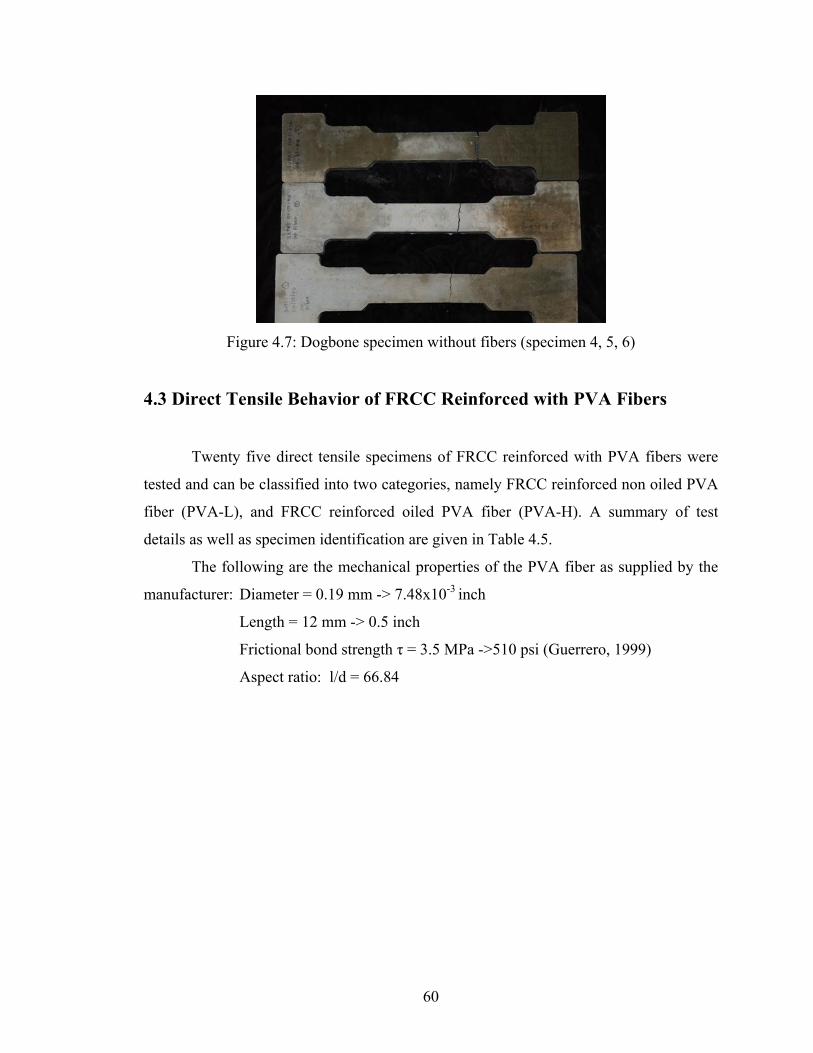
60
Figure 4.7: Dogbone specimen without fibers (specimen 4, 5, 6)
4.3 Direct Tensile Behavior of FRCC Reinforced with PVA Fibers
Twenty five direct tensile specimens of FRCC reinforced with PVA fibers were
tested and can be classified into two categories, namely FRCC reinforced non oiled PVA
fiber (PVA-L), and FRCC reinforced oiled PVA fiber (PVA-H). A summary of test
details as well as specimen identification are given in Table 4.5.
The following are the mechanical properties of the PVA fiber as supplied by the
manufacturer: Diameter = 0.19 mm -> 7.48x10⁻³ inch
Length = 12 mm -> 0.5 inch
Frictional bond strength τ = 3.5 MPa ->510 psi (Guerrero, 1999)
Aspect ratio: l/d = 66.84
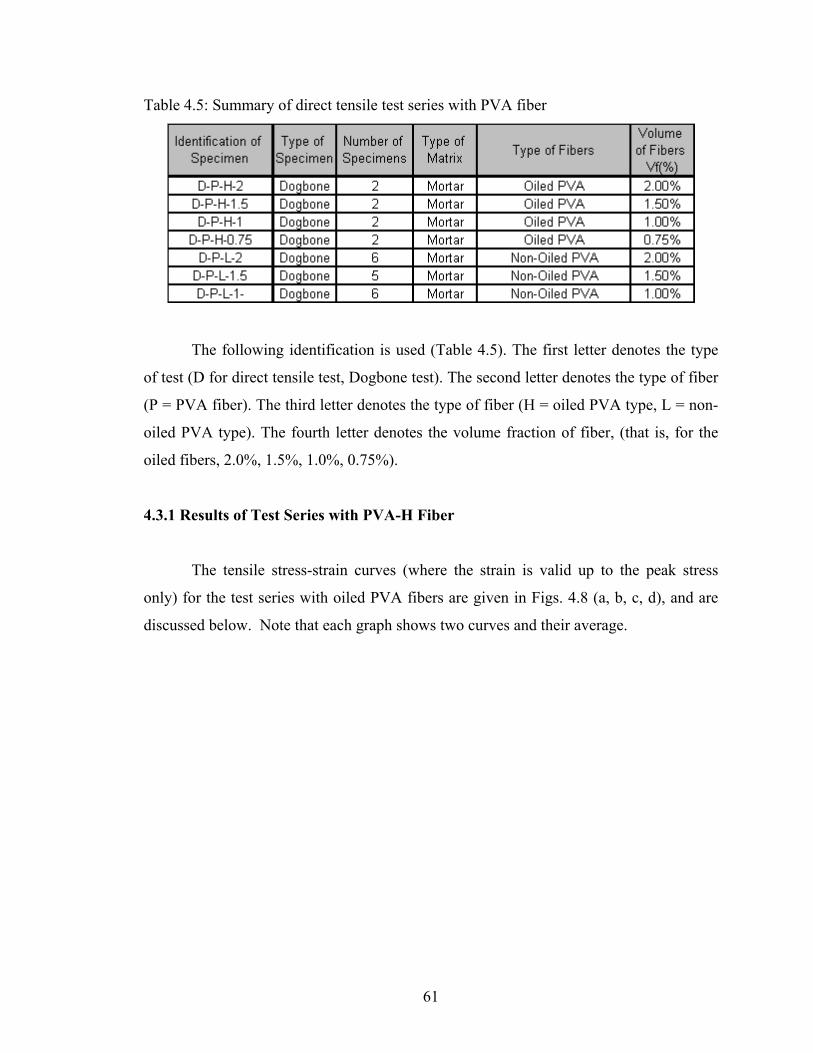
61
Table 4.5: Summary of direct tensile test series with PVA fiber
The following identification is used (Table 4.5). The first letter denotes the type
of test (D for direct tensile test, Dogbone test). The second letter denotes the type of fiber
(P = PVA fiber). The third letter denotes the type of fiber (H = oiled PVA type, L = non-
oiled PVA type). The fourth letter denotes the volume fraction of fiber, (that is, for the
oiled fibers, 2.0%, 1.5%, 1.0%, 0.75%).
4.3.1 Results of Test Series with PVA-H Fiber
The tensile stress-strain curves (where the strain is valid up to the peak stress
only) for the test series with oiled PVA fibers are given in Figs. 4.8 (a, b, c, d), and are
discussed below. Note that each graph shows two curves and their average.

62
(a) (b)
(c) (d)
Figure 4.8: Stress-strain curves of specimens reinforced with PVA-H (D-P-H),
(a) Vf = 0.75%, (b) Vf = 1.0%, (c) Vf = 1.5%, and (d) Vf = 2.0%
All specimens were initially pre-loaded to around 100 lbs (50 psi, 0.34 MPa) to
eliminate possible errors from grip adjustment and settlement of support. The loading
rate was 0.02 inch / minute (0.508 mm / minute); then the load increased with increased
displacement.
It can be observed that the initial portion of the curves is almost linearly elastic up
to the first cracking, which occurred at approximately 400-500 psi, (2.75-3.45 MPa).
This value of the first cracking stress is nearly 2.5 times higher than the cracking stress of
specimens without fiber (181.52 psi, 1.25 MPa); this indicates the benefits of PVA fiber
in improving the cracking resistance. The strain (0.00016) at the elastic limit is almost the
same as for the specimens without fiber.

63
Some inelastic behavior of specimens with PVA fibers could be observed as the
first crack initiated from one side of the specimen and propagated slowly to the other
side. After first cracking, the stress dropped, and the specimen changed stiffness. Some
specimens experienced strain hardening behavior, due to some fiber pullout along the
critical crack. However, some specimens exhibited some ductility (say up to a strain of
0.008) before tensile softening (PVA 2.0%).
Figure 4.9: Crack in direct tensile
specimen reinforced with PVA fiber
Only a single crack was observed in each
specimen. All specimens showed clear, full,
non-jagged cracks. A slight damage in the
specimen’s matrix at the crack due to fiber pull
out was observed from analyzing the cracked
surfaces. Most of the fibers broke almost
uniformly at a crack opening of about 0.1 inch
(2.54 mm). Figure 4.9 illustrates a typical
failure crack.
Figure 4.10: Comparison of average curves for specimens reinforced with PVA-H fiber
with different volume fractions

64
Figure 4.10 compares the average curves for all the test series with PVA oiled
fibers. It can be observed that an increase in fiber volume fraction from 0.75% to 1.5%
leads to an increase in maximum stress, but no increase in strain at maximum stress. For
2% fiber content, the maximum stress is lower than for 1.5% indicating possible effect of
difficulties due to mixing. The strain at maximum stress was highest for the series with
2% fibers and close to 1/1000.
Figure 4.11 (a to d) illustrate the variation of various test results with the fiber
volume fraction. No strong trend could be detected except that the energy at first
cracking can vary widely, indeed due to the nature of first cracking.
(a)
(b)
(c)
(d)
Figure 4.11: Comparison of different properties of test series with oiled PVA fibers at
different fiber volume fractions, (a) first cracking stress, (b) energy at first cracking
stress, (c) maximum stress, and (d) energy at post cracking stress

65
Table 4.6 Test results of direct tensile specimens reinforced with PVA-H fiber (US-units)
Table 4.7 Test results of direct tensile specimens reinforced with PVA-H fiber (SI-units)

66
Figure 4.12: Specimens reinforced with PVA-H after testing (D-P-H)
4.3.2 Results of Test Series with PVA-L Fiber
Seventeen specimens reinforced with PVA-L fiber (non-oiled type PVA) were
tested (Table 4.5, D-P-L), having a fiber volume fraction of 1.0%, 1.5%, and 2.0%. For
each volume fraction, 5 to 6 specimens were tested. Average stress-strain curves, where
strain is valid up to peak stress only, are given in Fig. 4.13.
Figure 4.13: Comparison of tensile response of specimens with PVA-L fiber at different
fiber volume fraction

67
Three key observations can be made: 1) the maximum stress (from about 150 psi
to 200 psi) in all these series is significantly smaller than for the series with oiled PVA
fibers; 2) an increase in fiber volume fraction leads to a decrease in maximum stress; and
3) the strain at maximum stress is approximately 0.2% for the specimens with oiled
fibers. These results are difficult to explain and can be attributed in part to the increased
difficulty to mix higher volume fractions of fibers without changing the mix proportions
and composition, thus leading to deterioration in properties. Even the first observation
where the cracking strength with non-oiled fibers is smaller than that with oiled fiber
does not follow logic.
(a) (b)
Figure 4.14: Typical failure sections of specimens reinforced with (a) non-oiled PVA-L
fibers and (b) oiled PVA-H fibers
To further understand the above results, typical cross-sectional areas of cracked
sections were analyzed. An example is shown in Fig. 4.14. It was observed that the
specimens with non-oiled fibers had lumps or groups of fibers stuck together while the
specimens with oiled fibers had a more uniform distribution of fibers. This difference
may very well explain the above unexpected observations.
If one ignores the above analysis, then it can be said that the use of oiled fibers
leads to a better tensile resistance and a better energy absorption capacity than the use of
non-oiled fibers.

68
Table 4.8: Summary of test results of specimens reinforced PVA-L fiber (US-units)

69
Table 4.9: Summary of test results of specimens reinforced with PVA-L fiber (SI-units)
4.3.3 Concluding Remarks
1. No clear multiple cracking behaviors were observed in specimen reinforced with
PVA fiber, whether the fibers were oiled or not. By and large, one crack was
observed in all tests. This may seem in conflict with findings from other
investigators, but could be attributed to the fact that they used different methods
of tensile testing and smaller size specimens.
2. The presence of PVA fiber effectively improves the cracking stress, and the
cracking strain of the matrix. However, comparing improvement with other types
of fiber, such as Spectra, Hooked and Torex, the effectiveness of PVA fiber was
the lowest.

70
3. Increasing the volume fraction of oiled PVA fibers up to 1.5% by volume, led to a
marked improvement in the post-cracking strength, ductility, and energy
absorption capacity of the composite.
4. Given the specimen preparation and testing procedure used, the optimum volume
fraction of fiber was close to 1.5%. The highest direct tensile stress observed from
specimens reinforced with PVA fibers was 482 psi (3.323 MPa) at 1.5% volume
fraction.
5. Because of the difficulty encountered in mixing non-oiled PVA fibers, no
particular logical conclusion could be drawn from the related tests.
4.4 Direct Tensile Behavior of HPFRCC Reinforced with Spectra Fibers
Forty two direct tensile specimens of HPFRCC reinforced with Spectra fibers
were tested. A summary of test details as well as specimen identification are given in
Table 4.10.
The following are the mechanical properties of the PVA fiber as supplied by the
manufacturer:
An identification was given to each series where the first letter denotes the type of
test (D for direct tensile test, dogbone test), the second letter denotes the type of fiber (S
= Spectra fiber), and the third letter denotes the volume fraction of fiber, (2.0%, 1.5%,
1.0%, or 0.75%). Followings are the mechanical properties of the Spectra fiber as
supplied by the manufacturer and from prior tests:
Diameter = 0.038 mm -> 1.49x10⁻³ inch
Length = 37 mm -> 1.5 inch
Frictional bond strength τ = 0.62 MPa ->89.923 psi (Li and Lieung, 1991)
Aspect ratio: l/d = 1000

71
Table 4.10: Summary of HPFRCC reinforced Spectra test
Identification
of Specimen
Type of
Specimen
Number of
Specimens
Type of
Matrix
Type of
Fibers
Volume
of
Fibers
Vf (%)
D-S-2 Dogbone 17 Mortar Spectra 2.00%
D-S-1.5 Dogbone 13 Mortar Spectra 1.50%
D-S-1 Dogbone 11 Mortar Spectra 1.00%
D-S-0.75 Dogbone 1 Mortar Spectra 0.75%
(a)
(b)
(c)
(d)
Figure 4.15: Stress-strain curves of specimens reinforced with Spectra (D-S) fiber at
volume fractions of: (a) 0.75%, (b) 1%, (c) 1.5%, and (d) 2%
Average

72
The actual and average stress strain curves, where strain is valid up to peak stress
only, are shown in Fig. 4.15 for the four volume fractions of fiber used. It can be
observed that all specimens behaved linearly up to first cracking with an elastic modulus
of the same order about 2000 ksi or13890 MPa. The first cracking stress was around 300
psi (2.068 MPa). The large number of tests carried out at 1%, 1.5% and 2% illustrates
the large variability that can be observed in this type of tensile testing. Variability will be
discussed later in Chapter 7.
Figure 4.16: Comparison of average curves for specimen reinforced with Spectra fiber at
different fiber volume fractions
Figure 4.16 compares the average stress strain curves from the tests. The first
cracking stress is nearly comparable for every volume fraction of fiber, and
approximately equal to 300 psi, (2.068 MPa). In all cases, following first cracking,
multiple cracking and strain hardening was observed. Overall, increasing the volume
fraction of fibers leads to an increase post-cracking tensile strength, ductility and energy
absorption capacity.
Note that the ductility in tension of specimens with Spectra fibers was
exceptionally good when a comparison is made with PVA fibers (compare the x axis
scale). Beyond the peak stress, the softening portion is gradual and exhibits mostly fibers
pulling out from the matrix and breaking of the matrix.

73
Figures 4.17, 4.18, and 4.19 show the variation of test results related to first
cracking in terms of the volume fraction of fibers. While the average first cracking stress
ranged from 262 psi (1.806 MPa) to 328 psi (2.261 MPa), it can be said from Fig. 4.17
that the volume fraction has little influence on the cracking strength. Similarly, no clear
trend could be observed for the strain and the energy absorption capacity at cracking
(Figs. 4.18, 4.19). Moreover, the first cracking strength with Spectra fibers was
consistently higher than that of specimens without fiber (i.e., 44% to 81% higher).
The strain at first cracking stress ranged from 0.00082-0.00176, that is,
significantly higher than that of specimens without fibers (Strain average = 0.000196.)
Figure 4.17: First cracking stress versus
volume fraction
Figure 4.18: Strain at first cracking stress
versus volume fraction
Figure 4.19: Energy at first cracking stress versus volume fraction
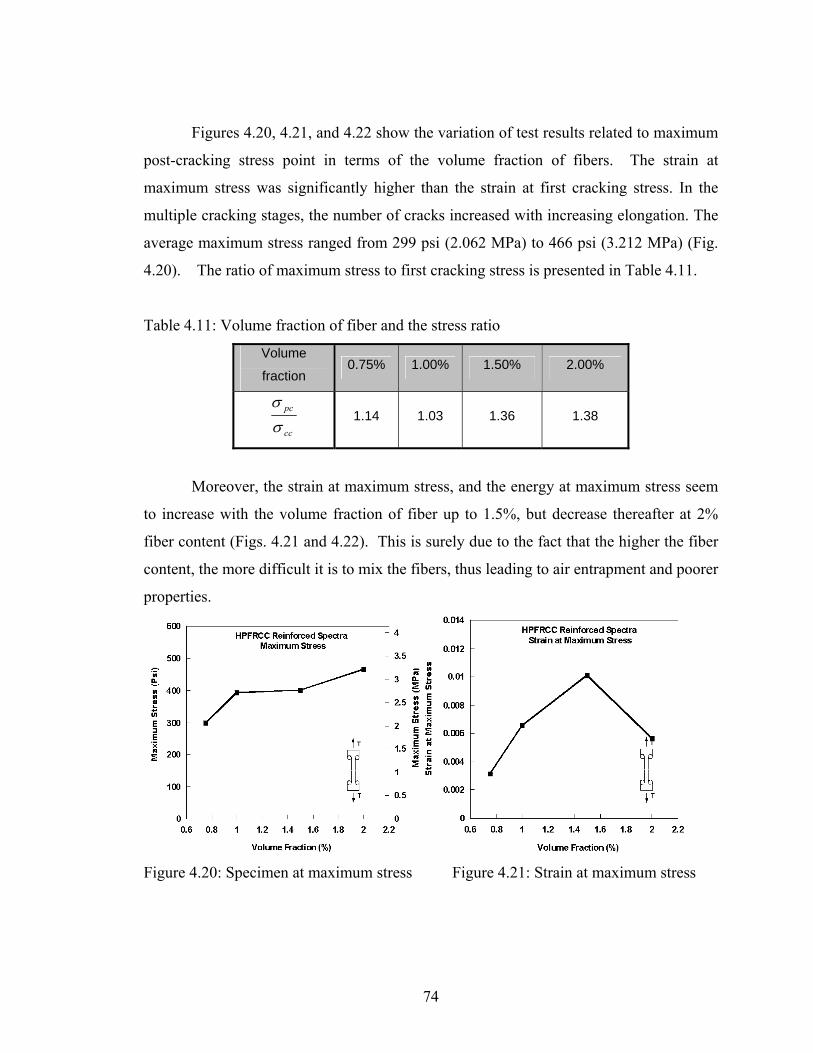
74
Figures 4.20, 4.21, and 4.22 show the variation of test results related to maximum
post-cracking stress point in terms of the volume fraction of fibers. The strain at
maximum stress was significantly higher than the strain at first cracking stress. In the
multiple cracking stages, the number of cracks increased with increasing elongation. The
average maximum stress ranged from 299 psi (2.062 MPa) to 466 psi (3.212 MPa) (Fig.
4.20). The ratio of maximum stress to first cracking stress is presented in Table 4.11.
Table 4.11: Volume fraction of fiber and the stress ratio
Volume
fraction 0.75% 1.00% 1.50% 2.00%
cc
pc
σσ
1.14 1.03 1.36 1.38
Moreover, the strain at maximum stress, and the energy at maximum stress seem
to increase with the volume fraction of fiber up to 1.5%, but decrease thereafter at 2%
fiber content (Figs. 4.21 and 4.22). This is surely due to the fact that the higher the fiber
content, the more difficult it is to mix the fibers, thus leading to air entrapment and poorer
properties.
Figure 4.20: Specimen at maximum stress Figure 4.21: Strain at maximum stress

75
Figure 4.22: Specimens’ energy at maximum stress
Since the peak point did not represent in all cases the end of multiple cracking,
another point defined as the end of multiple cracking points was also identified. It
generally occurred at about 80% of the maximum load on the softening branch of the
curve. Related results are described in Figs. 4.23 and 4.24. These figures show an
increase of strain and energy absorption capacity with volume fraction of fibers, but up to
a certain level where deterioration may follow.
Figure 4.23: Variation of strain at the
end of multiple cracking
Figure 4.24: Variation of energy at the end of
multiple cracking

76
4.4.1 Concluding Remarks
1. The use of Spectra fibers lead to a marked improvement in specimen ductility,
energy absorption capacity, strain hardening response and the extent of multiple
cracking. Increasing the volume fraction of fibers up to 1.5% generally led to
improvement in properties. However, at 2% fiber content, properties started
deteriorating due to difficulties in mixing and related air entrapment.
2. Increasing the volume fraction of Spectra fibers up to 1.5% by volume led to an
increase in number of cracks and a decrease in crack width and spacing.
3. A consistent correlation could be established between the volume fraction of
fiber and the first cracking stress (approximately 300 psi, 2 MPa), the strain at
first cracking, and the corresponding energy absorption capacity.
4. Increasing volume fraction of fiber showed overall improvement in the maximum
post-cracking stress, the strain at maximum stress, and related energy at the end of
multiple cracking or crack saturation.
5. Everything else being equal and given the parameters of this study and the
Spectra fiber used (length and diameter) the optimum volume fraction of Spectra
fiber seems to be around 1.5%.

77
Table 4.12: Summary of test results for specimens reinforced with Spectra fiber
(US-units)

78
Table 4.13: Summary of test results for specimens reinforced with Spectra fiber (SI-units)

79
4.5 Direct Tensile Behavior of HPFRCC Reinforced with Hooked Steel
Fiber
In all sixty three specimens were tested; the test series were given an
identification name, and classified into two categories, one dealing with high strength
steel Hooked fiber (D-H-H) and the other with regular strength steel hooked fiber (D-H-
L). Table 4.14 describes the various test series and their identification. The first letter
denotes the type of test (D for direct tensile test, Dogbone test). The second letter denotes
the type of fiber (H = Hooked fiber), and the third letter denotes the type of Hooked fiber
(H = High strength Hooked type, L = Regular strength Hooked type). Furthermore, the
fourth letter denotes the volume fraction of fiber, (2.0%, 1.5%, 1.0%, or 0.75%).
Following are the main properties of the fibers used:
Hooked - High Strength
Diameter = 0.4 mm -> 0.0157 inches
Tensile strength -> 2100 MPa
Length = 30 mm -> 1.181 inch
Equivalent bond strength τ = 5.1 MPa ->740 psi (Guerrero, 1998) Aspect
ratio l/d = 75
Color = gold
Hooked - Regular Strength
Diameter = 0.3 mm -> 0.0118 inches
Tensile strength -> 1050 MPa
Length = 30 mm -> 1.181 inch
Equivalent bond strength τ = 5.1 MPa ->740 psi (Guerrero, 1998)
Aspect l/d = 100
Color = silver

80
4.5.1 Result of Test Series with High Strength Hooked Steel Fiber
Forty-six specimens reinforced with high strength Hooked fiber were tested. Four
volume fractions were used (0.75%, 1.0%, 1.50%, and 2.0%).
Table 4.14 Identification of specimen reinforced Hooked fiber
Figures 4.25a to 4.25d give the stress-strain curves (where strain is valid up to
peak stress only) for each series of specimens, and the series average curve, at the four
volume fractions of fiber used. A great variability is generally observed and is further
discussed in Chapter 7.

81
(a) (b)
(c)
(d)
Figure 4.25: Stress strain curves of HPFRCC reinforced with high strength Hooked steel
fiber at different volume fractions of fiber and average curves, (a) Vf = 0.75%,
(b) Vf = 1.0%, (c) Vf = 1.5%, and (d) Vf = 2.0%

82
Figure 4.26: Average stress strain curves of HPFRCC reinforced with high strength
Hooked steel fiber
Figure 4.26 provides a comparison of the average curves at the four volume
fractions of fiber tested. The main test results are summarized in Tables 4.15 and 4.16. It
can be generally observed that an increase in fiber volume fraction leads to an
improvement in the stress-strain response.
Variation of stress, strain and related energy at the first cracking point are
illustrated in Figs. 4.27 to 4.29. They do not show a consistent trend; indeed if the data
for Vf= 0.75% is ignored, one can conclude that the stress at first cracking does not
change much for Vf = 1%, 1.5% and 2%. Related increases in strain, thus energy, may be
attributed in part to the nonlinearity of the curves prior to the first through-specimen
crack and in part to variation in the measurements as observed from the large variability
encountered (Fig. 4.25). Initially, the specimen exhibits linear elastic behavior up to the
first cracking stress. Several events occurred at this point such as matrix breaking, crack
propagation, and fiber shape alteration. The average first cracking stress ranged from 158
psi (1.089 MPa) to 290 psi (2 MPa).

83
Figure 4.27: Stress at the first cracking
versus fiber volume fraction
Figure 4.28: Strain at the first cracking
versus fiber volume fraction
Figure 4.29: Energy at first cracking versus fiber volume fraction
After the first cracking, most specimens exhibited tensile hardening behavior with
multiple cracking up to maximum stress. . At localization just after maximum stress,
there is evidence of pull-out and damage with in the critical section.
Variation of stress, strain and related energy at the maximum post-cracking point
are illustrated in Figs. 4.30 to 4.32. They show that the maximum stress and the energy at
maximum stress increase significantly with an increase in fiber volume fraction, while
the strain at maximum stress remains almost the same and of the order of 0.4%. The
maximum tensile resistance in HPFRCC reinforced Hooked steel fiber is considerably
better than that obtained from HPFRCC reinforced polymetric fibers (PVA and Spectra).

84
However, the strain at maximum stress, while much larger than for specimens with PVA
fiber, is smaller than for specimens with Spectra fiber.
Figure 4.30: Maximum stress versus fiber
volume fraction
Figure 4.31: Strain at maximum stress
versus fiber volume fraction
Figure 4.32: Energy at maximum stress point versus fiber volume fraction
Because some multiple cracking continued beyond the maximum stress point, an
additional point defined as the end of multiple cracking on the softening branch following
the maximum stress point, was analyzed. Figures 4.33 and 4.34 illustrate the
characteristics of this point versus the fiber volume fraction. It can be observed that the
strain at the end of multiple cracking point remains about constant at 0.6% when the
volume fraction of fibers increases from 0.75% to 2%, while the related energy increases
since the corresponding stress also increases.

85
Figure 4.33: Strain at the end of multiple
cracking versus fiber volume fraction
Figure 4.34: Energy at the end of multiple
cracking versus fiber volume fraction

86
Table 4.15 Summary of test results for specimens reinforced with high strength Hooked
steel fiber (US-units)

87
Table 4.16: Summary of test results for specimens reinforced with high strength Hooked
steel fiber (SI-units)

88
4.5.2 Result of Test Series with Regular Strength Hooked Steel Fiber
Seventeen specimens reinforced with regular strength Hooked steel fiber were
tested at three volume fractions of fiber (1.0%, 1.5% and 2.0%). Their average stress-
strain curves (where strain is valid up to peak stress only) are compared in Fig. 4.35. A
summary of the test results is given in Tables 4.17 and 4.18.
Figure 4.35: Average stress strain curves of HPFRCC reinforced with regular strength
Hooked steel fiber at different fiber volume fractions
The results plotted in Fig. 4.35 seem to confirm the same trends observed when
using high strength hooked steel fiber: that is an increase in maximum stress and related
energy with an increase in volume fraction of fibers, while the strain at maximum stress
remains almost the same. In all tests, localization occurred while the hooked fibers
pulled out from the critical crack with no evidence of fiber failure. In comparing Figs.
4.35 and 4.32, it can be observed that both the stress and strain at peak load for the

89
regular strength hooked fiber were almost half those of the high strength hooked fiber.
In particular, the strain at maximum stress was of the order of 0.2% for the test series
with regular strength hooked fiber.
Table 4.17: Summary of test results for specimens reinforced with regular strength
Hooked steel fiber (US-units)

90
Table 4.18: Summary of test results for specimens reinforced with regular strength
Hooked steel fiber (SI-units)
4.5.3 Concluding Remarks
Two types of hooked fiber were used, one made with high strength steel wire (of
tensile strength 2100 MPa) and the other with conventional steel wire (of tensile strength
1050 MPa).
1. The use of high strength versus regular strength Hooked steel fiber clearly
improved the strain hardening and multiple cracking behavior, toughness, and
energy absorption capacity. Most specimens achieved strain hardening response
even at 0.75% fiber content by volume.

91
2. Increasing the fiber volume fraction led to improvement in all properties except
for the stress and strain at first cracking, and the strain at maximum post-cracking
which did not clearly follow the trend.
3. Overall the higher strength fiber let to a better performance; for instance the
maximum tensile stress with the high strength fiber was 1.5 to 2.5 times that with
low strength fiber, at Vf of 1% to 2%.
4.6 Direct Tensile Behavior of HPFRCC Reinforced with Torex Twisted
Steel Fiber
The test series in this part of the program comprised 84 specimens and are
classified into two categories, namely specimens reinforced with high strength Torex
steel fiber (D-T-H), and specimens reinforced low strength Torex steel fiber (D-T-L).
Table 4.19 gives a summary of the test series and their identification. The first letter in
the identification denotes the type of test (D for direct tensile test, Dogbone test). The
second letter denotes the type of fiber (T = Torex fiber), and the third letter denotes the
type of Torex fiber (H = High strength steel Torex, L = regular strength steel Torex). The
fourth letter denotes the volume fraction of fiber, (2.0%, 1.5%, 1.0%, or 0.75%).
Following is a summary of the fiber properties after twisting
Torex - High Strength
Diameter = 0.3 mm -> 7.62 inches
Length = 30 mm -> 1.181 inch
Equivalent bond strength τ = 6.84 MPa ->992.28 psi (Sujivorakul,2002)
l/d = 100, Tensile strength = 2760 MPa
Color = gold
Torex- Regular Strength
Diameter = 0.3 mm -> 7.62 inches
Length = 30 mm -> 1.181 inch
Equivalent bond strength τ = 6.84 MPa ->992.28 psi (Sujivorakul,2002)
l/d = 100, Tensile strength = 1380 MPa
Color = silver

92
Table 4.19: Identification of specimen reinforced Torex fiber
4.6.1 Result of Test Series with High Strength Torex Steel Fiber
In this category (D-T-H), sixty-seven specimens reinforced with high strength
Torex steel fiber were tested. Each series used 5 to 28 specimens. Test results are plotted
in Figs. 4.35 to 4.40 and summarized in Tables 4.20 and 4.21.
Figures 4.36a to 4.36d show the stress strain curves observed from the tests
(where strain is valid up to peak stress only) and their average at each volume fraction of
fiber tested. Since the axis scales are different, a comparison of average curves is given
in Fig. 4.37. Similarly to the direct tensile tests with other fibers, a great variability was
observed (Fig. 4.36) and is further discussed in Chapter 7.
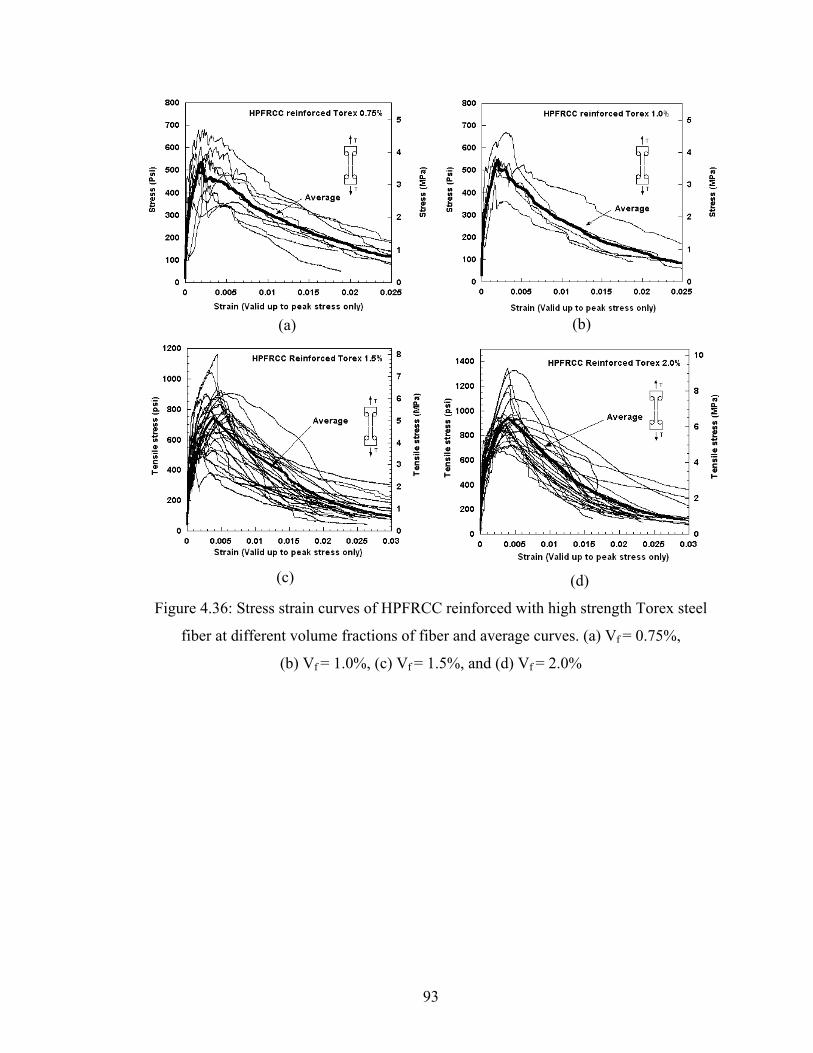
93
(a) (b)
(c) (d)
Figure 4.36: Stress strain curves of HPFRCC reinforced with high strength Torex steel
fiber at different volume fractions of fiber and average curves. (a) Vf = 0.75%,
(b) Vf = 1.0%, (c) Vf = 1.5%, and (d) Vf = 2.0%

94
Figure 4.37: Average stress strain curves of HPFRCC reinforced with high strength
Torex steel fiber at different fiber volume fractions
From the average curves in Fig. 4.37, it can be stated that the greater the fiber
volume fraction, the better the performance of the specimen in terms of stress, ductility,
and energy absorption occurring. Differences between results at 0.75% and 1% fiber
content were very small and attributable to normal variability.
Figures 4.38 to 4.40 describe the variation stress, strain and corresponding for the
point at first cracking. Generally, they all increase with an increase in volume fraction of
fiber, showing a slightly different trend than the case with Hooked fiber. The average
first cracking stress ranged from 251 psi to 357 psi, (1.731 to 2.461 MPa) (and the strain
at first cracking point ranged from 0.00012 to 0.000268.

95
Figure 4.38: First cracking stress versus
fiber volume fraction
Figure 4.39: Strain at first cracking stress
versus fiber volume fraction
Figure 4.40: Energy at first cracking stress versus fiber volume fraction
All HPFRCC reinforced with Torex fiber exhibited good multiple cracking with
very well distributed cracks along the specimen length. Figures 4.41 to 4.43 describe the
variation of properties at the maximum post-cracking stress versus the volume fraction of
fiber. It can be generally concluded from the figures that the maximum stress, the strain
at maximum stress and the corresponding energy all increase with an increase if fiber
volume fraction.
The maximum tensile resistance of HPFRCC reinforced with high strength Torex
steel fiber ranged from 533 psi to 939 psi (3.675 to 6.474 MPa) while the strain at
maximum stress range from 0.2% to 0.4%. This strain was smaller than expected and as

96
observed in other investigations, but is believed due to the twisting ratio of the fiber
which was not optimized for the matrix used.
Figure 4.41: Maximum stress versus fiber
volume fraction
Figure 4.42: Strain at maximum stress
versus fiber volume fraction
Figure 4.43: Energy at maximum stress versus fiber volume fraction
Since multiple cracking continued beyond the peak stress, a point indicating the
end of multiple cracking was selected. Figs. 4.44 and 4.45 describe the variation of strain
and energy absorption capacity at this point versus the fiber volume fraction. Now the
strain increases up to about 0.5% suggesting significant ductility.

97
Figure 4.44: Strain at the end of multiple
cracking stage versus fiber volume
fraction
Figure 4.45: Energy at the end of multiple
cracking stage versus fiber volume fraction
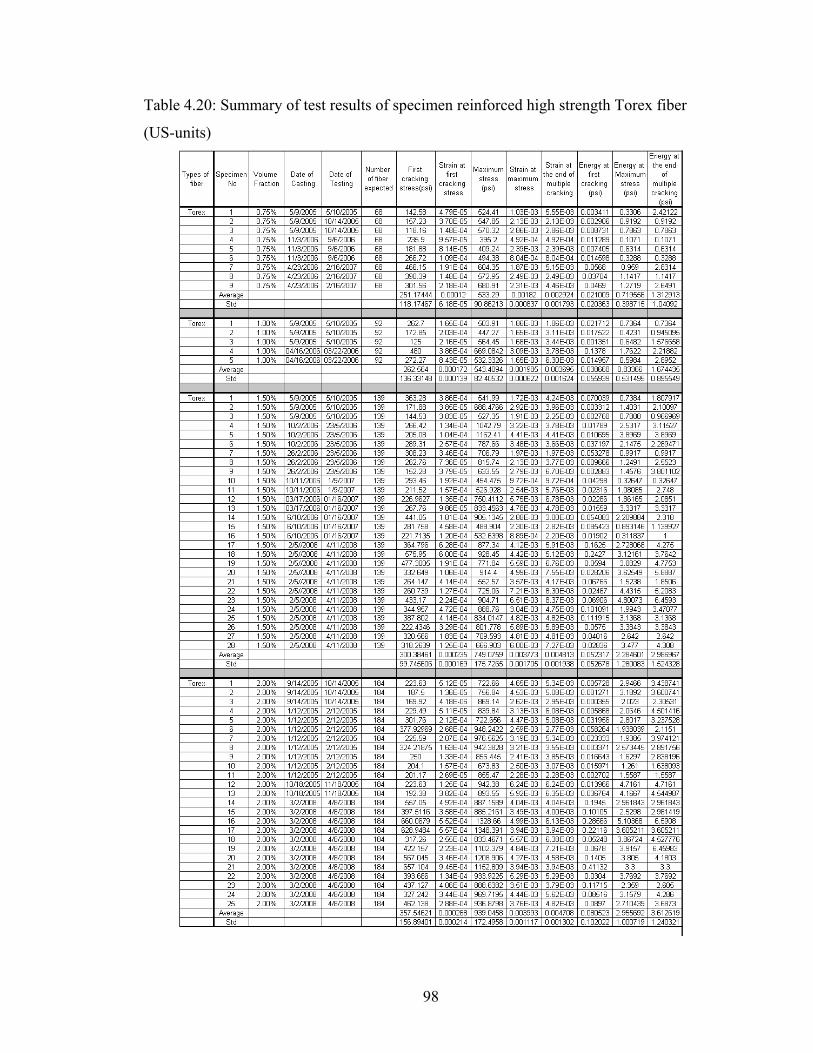
98
Table 4.20: Summary of test results of specimen reinforced high strength Torex fiber
(US-units)

99
Table 4.21: Summary of test results of specimen reinforced high strength Torex fiber
(SI-units)

100
4.6.2 Result of Test Series with Regular Strength Torex Steel Fiber
Seventeen specimens reinforced with regular strength Torex steel fiber were
tested at three different fiber contents (1.0%, 1.5%, and 2.0%). It should be noted that
these fibers encountered many flaws during fabrication which included a non-uniform
shape, unequal twists and larger distance between ribs. These flaws were uncovered
during examination under a light microscope. The test results are shown below for
interest, but should not be considered typical since the fibers were faulty and should have
been rejected. The average stress-strain curves are plotted in Fig. 4.46 and a summary of
test results is given in Table 4.22 and 4.23. They are self-explanatory and, unfortunately,
cannot be used to draw meaningful conclusions except that, overall, they show a
performance lower than the series with high strength Torex fiber. During testing the
fibers pulled out from the critical section after localization and no fiber failure was
observed.
Figure 4.46: Average stress strain curves of HPFRCC reinforced with regular strength
Torex steel fiber at different fiber volume fractions

101
Table 4.22: Summary of test results of specimens reinforced regular strength Torex fiber
(US-units)

102
Table 4.23: Summary of test results of specimens reinforced regular strength Torex fiber
(SI-units)
4.6.3 Concluding Remarks
1. The use of high strength Torex steel fiber consistently improved the strain
hardening and multiple cracking behavior, the maximum post-cracking stress, the
strain and energy at maximum stress, and related energy absorption capacity. The
higher the volume content of fibers, the higher the improvements observed in the
tensile behavior.
2. The number of cracks observed generally increased with the volume fraction of
fiber, leading to a decrease in crack spacing and width. Specimens with high
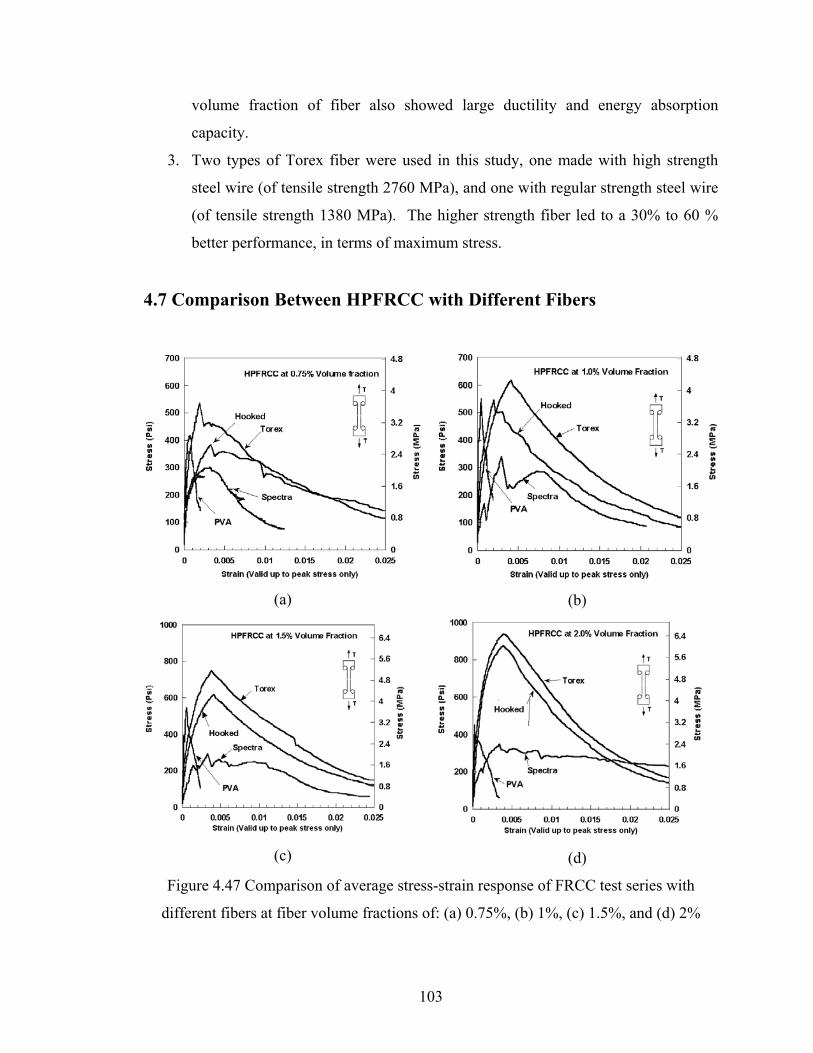
103
volume fraction of fiber also showed large ductility and energy absorption
capacity.
3. Two types of Torex fiber were used in this study, one made with high strength
steel wire (of tensile strength 2760 MPa), and one with regular strength steel wire
(of tensile strength 1380 MPa). The higher strength fiber led to a 30% to 60 %
better performance, in terms of maximum stress.
4.7 Comparison Between HPFRCC with Different Fibers
(a) (b)
(c)
(d)
Figure 4.47 Comparison of average stress-strain response of FRCC test series with
different fibers at fiber volume fractions of: (a) 0.75%, (b) 1%, (c) 1.5%, and (d) 2%

104
Figures 4.47 (a, b, c, d) compare the response of test series with different types of fiber at
the four values of fiber content used. It is clear from the figures that, everything else
being equal, the use of PVA fibers leads to the lowest performance at every volume
fraction in comparison to specimens reinforced with Spectra, Hooked or Torex fibers.
Also, specimens with Torex fibers lead to the highest post cracking strength while
specimens with Spectra fibers lead to the highest strain at maximum stress. At 2% fiber
content, specimens with Spectra fiber showed high ductility with a post-cracking tensile
strain of up to 2%, almost three to four times the strains observed with Hooked and Torex
fibers. However, this came at a much lower tensile stress. At 2% fiber content,
specimens with either high strength Hooked or Torex fibers lead to post-cracking tensile
strengths at least twice those observed for Spectra and PVA fibers. If the overall
performance of the four fibers is ranked, then the order would be Torex, Hooked, Spectra
and PVA, from highest to lowest.
4.8 Concluding Remarks on the Direct Tensile Tests of FRC Composites
with Different Fibers
This chapter addressed the direct tensile testing results of HPFRCC. A detailed
description of material properties was given and experimental results reported. Based on
the results obtained the following conclusions can be drawn:
1. Generally, the first cracking stress of the composite is significantly improved due
to the presence of fiber in the matrix. However, no consistent correlation could be
established between an increase in volume fraction of fiber and an increase in first
cracking stress. Given the parameters of this study, for Hooked and Torex fiber,
the stress at first cracking increased with the volume fraction, while it remained
almost same for PVA and Spectra fibers
2. Comparing between types of fiber, for the same volume fraction of fibers,
specimens with Torex, high strength Hooked, and Spectra fibers showed better
overall behavior than specimens with PVA fibers. Moreover, their post-cracking
strength reached 1.5 to 3 times their strength at first cracking, while for specimens

105
with PVA fibers, the post-cracking strength was only 10% to 50% higher than the
cracking strength at up to 2% fiber content.
3. The tensile response of specimens without fibers is very brittle and shows large
variability in tensile strength. Fibers, whether leading to strain softening or strain
hardening response, reduce the variability while improving ductility and
toughness.
4. Immediately following localization, specimens reinforced with PVA fiber fail
suddenly due to tensile failure of the fibers. For specimens reinforced with
Spectra fiber, the failure is gradual and controlled by the pulling out of the fibers
accompanied by matrix spalling around the critical crack. Also, for specimens
reinforced with steel fiber, whether Hooked or Twisted, the fibers gradually pull
out up to complete separation; during pull out, twisted fibers untwist leading to
additional matrix cracking. No steel fiber failure was observed for the variables
of this study.
5. For the same volume fraction, and type of steel fiber, the strength of fiber is
important for determining the composite tensile behavior. Specimen reinforced
with high strength steel fiber usually outperform specimen reinforced with regular
strength steel fiber.
6. Changing surface properties of the fiber has important implications. For instance,
specimens reinforced with oiled PVA fibers performed better than specimens
reinforced with non-oiled ones.
7. Variability of properties obtained from direct tensile testing is large and a fact that
cannot be ignored. Both fiber distributions within the specimen and fiber
orientation at any section play a significant role in influencing observed
properties. The more uniform the distribution of fiber is, the less variable the
tensile behavior is.

106
CHAPTER 5
STRESS VERSUS CRACK OPENING DISPLACEMENT TESTS
5.1 Introduction
The post-cracking behavior of high performance fiber reinforced cementitious
composites (HPFRCC) primarily depends on how a typical crack propagates and
responds to stresses. Such information can be clarified by stress versus crack opening
displacement tests (σ-COD). The (σ-COD) test presents vital information on the response
of a crack and allows eventually understanding overall strain behavior of HPFRCC in the
multiple cracking stages, and modeling it. The (σ-COD) test information can be directly
related to the strain at every loading.
Experiments to study (σ-COD) behavior of HPFRCC notched specimens
reinforced with PVA, Spectra, Hooked, and Torex fibers were carried out. Nintety
specimens were tested. The specimens were short Dogbone shaped tensile
specimens,with symmetrical notches at their mid-section. Dimensions are: width = 76.2
mm (3 inches), length = 304.8 mm (12 inches), and depth or thickness = 25.4 mm (1
inch). Additionally, after hardening, notches 12.7 mm (0.5 inch) deep and about 2.54 mm
(0.1 inch) wide were cut at mid-length. The cross-sectional area of a typical specimen, at
the double-notched points, is 1290.32 mm2 (2 in2). The geometric details are shown in
Chapter 3 (Figs. 3.20 and 3.21). The notches were cut using a circular diamond concrete
saw. Four types of fibers, two of which are polymeric (i.e., Spectra and oiled PVA) and
two of which are steel fibers (i.e., High strength Torex fiber and High strength Hooked

107
fiber) are selected in four different volume fractions (i.e., 0.75%, 1.0%, 1.5%, and 2.0%)
to match the direct tension tests described in Chapter 4.
Two crack gauges were placed one on the left and the other on the right, spanning
each notch to measure the displacement (Fig. 5.1). The gauge length was 1 in or 25 mm.
The tests were carried out in the same way as the direct tensile tests, using the same
equipment and the same end grips. Typical test results are presented below.
Figure 5.1: Typical behavior of notch HPFRCCs test
5.1.1 Typical Overall (σ-COD) Response
As the specimen is subjected to the tensile load, the first crack appears, mostly at one
end near or at the notch, at a tensile stress ranging from 180 to 450 psi, (1.241 to 3.102
MPa), depending on the type of fiber and the fiber volume fraction. After initiation the
crack grows in different ways depending on the material (strain hardening, material
transition, or strain softening material). The area where cracking occurred is mostly the
area between the two notches, and can be viewed as a smeared zone of cracking, or
influence zone. When the tensile load and displacement increased, more cracks were
observed as seen in Figs. 5.2a, and 5.2b. Note that often, the first crack did not
necessarily propagate all the way through the section, prior to the formation of other
cracks. In some cases it did, and in others it did not.

108
(a)
(b)
Figure 5.2: Typical behavior of notched specimen, (a) with one crack and (b) with
several cracks
Figure 5.3: Zone of cracking influence in notch specimen
Non-cracked
Non-cracked
Influenced cracking A
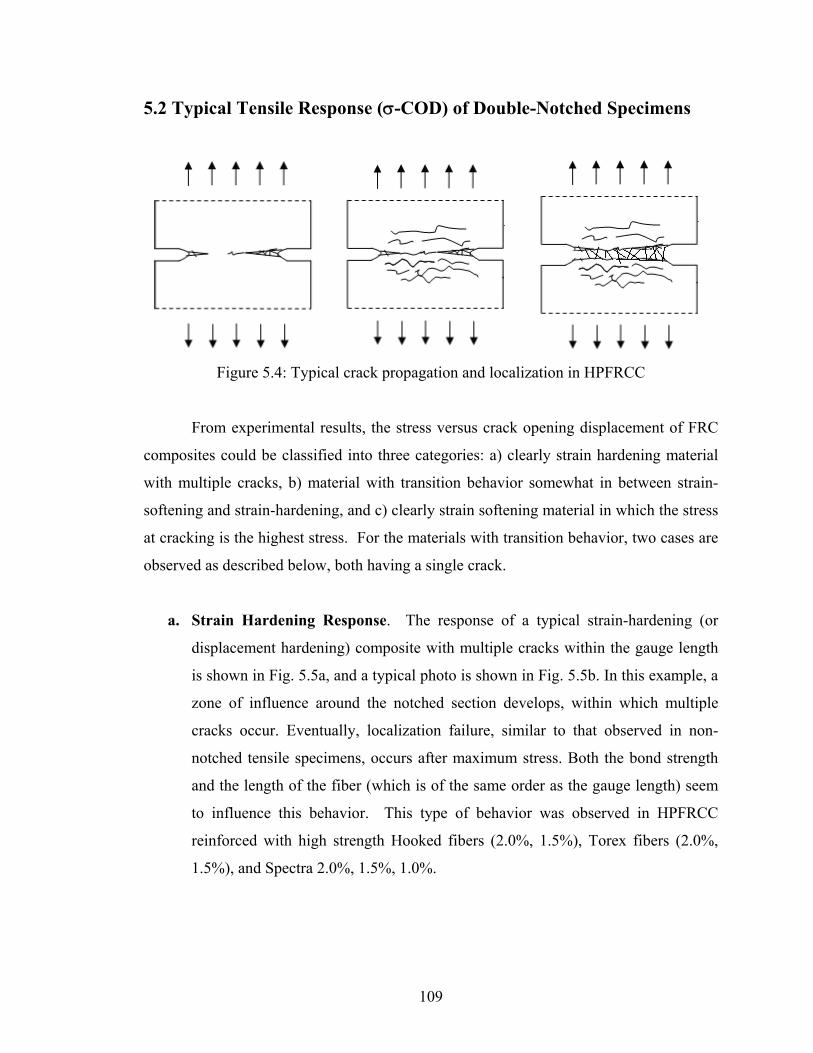
109
5.2 Typical Tensile Response (σ-COD) of Double-Notched Specimens
Figure 5.4: Typical crack propagation and localization in HPFRCC
From experimental results, the stress versus crack opening displacement of FRC
composites could be classified into three categories: a) clearly strain hardening material
with multiple cracks, b) material with transition behavior somewhat in between strain-
softening and strain-hardening, and c) clearly strain softening material in which the stress
at cracking is the highest stress. For the materials with transition behavior, two cases are
observed as described below, both having a single crack.
a. Strain Hardening Response. The response of a typical strain-hardening (or
displacement hardening) composite with multiple cracks within the gauge length
is shown in Fig. 5.5a, and a typical photo is shown in Fig. 5.5b. In this example, a
zone of influence around the notched section develops, within which multiple
cracks occur. Eventually, localization failure, similar to that observed in non-
notched tensile specimens, occurs after maximum stress. Both the bond strength
and the length of the fiber (which is of the same order as the gauge length) seem
to influence this behavior. This type of behavior was observed in HPFRCC
reinforced with high strength Hooked fibers (2.0%, 1.5%), Torex fibers (2.0%,
1.5%), and Spectra 2.0%, 1.5%, 1.0%.

110
Figure 5.5 (a): Strain hardening material with
multiple cracks
Figure 5.5(b): Corresponding specimen
b. Transition Behavior. Here two cases are considered. In the first example, the
response of what looks like a strain hardening material with a single major
crack is illustrated in Fig. 5.6a and Fig. 5.6b. After the first cracking point, the
load dropped by about 5% to 30%, then the specimen showed increased load
resistance. The hardening stage was the result of only one single crack. During
the pulling-out process that followed, some additional cracks were seen around
the localization area, while the matrix was spalling out under large
displacement. This type of behavior was observed in HPFRCC reinforced with
Hooked fibers (1.0%, 0.75%), Torex fibers (1.0%, 0.75%), and Spectra fibers
(0.75%).

111
Figure 5.6 (a): Strain hardening material
with single major crack
Figure 5.6 (b): Corresponding specimen
In the second example of transition behavior, a strain softening material
response is observed with a post-cracking stress that first drops after first
cracking, then picks up again but remains smaller than the cracking strength. A
typical response is shown in Fig. 5.7a and a typical photo is shown in Fig. 5.7b.
The specimen’s response is linear elastic up to the first cracking stress. No
multiple cracking is observed. The maximum post-cracking stress is smaller than
the cracking strength but occurs after some displacement or crack opening. After
the maximum post cracking stress, localization is confirmed and the specimen
fails in a tensile softening manner due primarily to fiber pull-out. Only one single
crack was observed in this type of specimen. This type of response was observed
in HPFRCC specimens reinforced with Hooked fibers (0.75%), and PVA fibers
(1.5%, 1.0% and 0.75%).

112
Figure 5.7 (a): Strain softening material
with a post cracking stress that picks up
after a first dip
Figure 5.7 (b): Corresponding specimen
c. Strain Softening Response. The typical stress versus COD response of a
strain softening composite, where the post-cracking resistance keeps steadily
decreasing after first cracking, is shown in Fig. 5.8a with a corresponding
photo in Fig. 5.8b. The specimen’s behavior is linearly elastic up to the first
cracking point, which also becomes the maximum tensile resistance point, and
the point at which localization starts. After this point, the load drops
significantly. The failure crack opens widely and the load drops either due to
sudden failure of the fibers (PVA), or direct tensile softening manner by partial
fiber pull-out or both. This type of response was observed in FRC specimens
reinforced with PVA fibers (1.5%, 1.0%, and 0.75%)

113
Figure 5.8 (a): Strain softening material
Figure 5.8 (b): Corresponding specimen
Figure 5.9 provides a comparison of the four different types of observed behavior
using the same scale for stress and crack opening displacement. The magnified scale of
the x axis allows to better see the ascending portion of the stress-COD curve.
.
Figure 5.9: Typical stress-crack opening displacement curves
For comparison purpose, an average curve for each test series or parameter was
determined. The average plot was calculated according to an averaging procedure

114
initially described by Naaman and Najm (1991). The peak load of the average curve is
the average maximum load of the several individual tests, and their displacement is the
average corresponding displacement. The ascending and descending portions of each
individual curve are divided into a chosen number of points (200 points for this research)
and their corresponding loads and averaged. That load is then used as the load of the
average curve for the displacement having the same rank.
Figure 5.10 illustrates the average curve obtained from a series of five specimens
using 2% Spectra fibers by volume. It can be observed that the average curve has a good
similarity with the shape of the individual curves obtained and does provide an intuitively
reasonable average..
Figure 5.10: Stress-displacement curves of notched specimens with 2% Spectra fiber and
average curve
5.3 Notched Mortar Specimens without Fiber
Two notched plain mortar specimens without fibers were tested as control and for
comparison purposes. A typical (σ-COD) response curve is shown in Fig. 5.11.

115
Figure 5.11: Stress-displacement curve of plain mortar matrix without fiber
For specimen-1 and specimen-2 the maximum stress was 238 psi (1.641 MPa)
and 205 psi, (1.413 MPa), respectively, leading to an average of 222.13 psi, 1.531 MPa,
and a displacement at maximum stress of 0.000315 and 0.0002 inch. The energy under
the curves of specimen-1 and specimen-2 is (proportional to) 0.000374 psi and 0.0266 psi
(2.58E-6 to 1.83E-4 MPa). The energy absorption capacity of these specimens is very
low with no ductile behavior.. The non-linear response shown in Fig. 5.11 correspond to
the slow propagation of the crack from one side of the specimen to the other side under
very slow loading rate.
In comparing the maximum stress for the notched series without fiber and the
overall average cracking stress observed from the direct tensile test series (Dogbone
tests), it can be observed that the stress in the notched specimens was about 21.3%
higher. The overall average from the direct tensile tests was 183 psi (1.261 MPa). The
reason could be that in the direct tensile test, the weakest section fails first, while in the
notched tensile test, the section to crack first is pre-selected at the notch location.

116
Table 5.1: Key results for notched specimens without fiber
5.4 Tensile Response (σ-COD) of Double-Notched Specimens with PVA
Fiber
Twelve specimens were tested in this series. Specimen identification and other
details are in Table 5.2. The first letter denotes the type of test (N = Notch tensile test).
The second letter denotes the type of fiber (P = PVA-H fiber). Note that the PVA-H fiber
is the oiled fiber described in Chapter 4. The third letter denotes the volume fraction of
fiber, (2.0%, 1.5%, 1.0%, and 0.75%). Each series used 3 specimens. The stress-
displacement curves are described in Figs. 5.12-5.15, and discussed next.
Table 5.2: Test series of notched specimens reinforced with PVA fiber
Identification
of Specimen
Type of
Specimen
Number of
Specimens
Type of
Matrix
Type of
Fibers
Volume
of
Fibers
(Vf(%)
N-P-2 Notch 3 Mortar Oiled-PVA 2.00%
N-P-1.5 Notch 3 Mortar Oiled-PVA 1.50%
N-P-1 Notch 3 Mortar Oiled-PVA 1.00%
N-P-0.75 Notch 3 Mortar Oiled-PVA 0.75%

117
Figure 5.12 (a): (σ-COD) curves of
specimens reinforced with 0.75% PVA
fiber
Figure 5.12 (b): Photo of tested specimens
reinforced with 0.75% PVA fiber
Figure 5.13 (a): (σ-COD) curves of
specimens reinforced with 1% PVA fiber
Figure 5.13 (b): Photo of tested specimens
reinforced with 1% PVA fiber

118
Figure 5.14 (a): (σ-COD) curves of
specimens reinforced with 1.5% PVA fiber
Figure 5.14 (b): Photo of tested specimens
reinforced with 1.5% PVA fiber Notch
FRC-PVA 1.5%
Figure 5.15 (a): (σ-COD) curves of
specimens reinforced with 2% PVA fiber
Figure 5.15 (b): Photo of tested specimens
reinforced with 2% PVA fiber

119
Figure 5.16: Comparison of average (σ-COD) curves with PVA fiber
Testing results show an elastic response up to the first cracking, with an average
cracking stress of 314.57 psi (2.168 MPa). However, the response was rather brittle. The
maximum crack opening displacement was small (i.e., approximately ten times smaller
than observed from similar specimens reinforced with Spectra, Hooked, and Torex fiber).
Although strain hardening behavior is evident (i.e., the stress increases after the specimen
cracks), there is no observable multiple cracking behavior. The strain hardening and
nonlinearity may have resulted from the slow propagation of the crack from one side to
the other side of the specimen. Because of the test procedure where the end grips are
hinged, any crack could create some bending leading to a non linear response. Regarding
the effectiveness of fiber, the highest improvement in tensile resistance is found at a fiber
volume fraction of 1.5%, with an average maximum tensile resistance of 566.52 psi
(3.906 MPa). Ductility and energy absorption capacity were low in comparison to the
other fibers tested in this study.
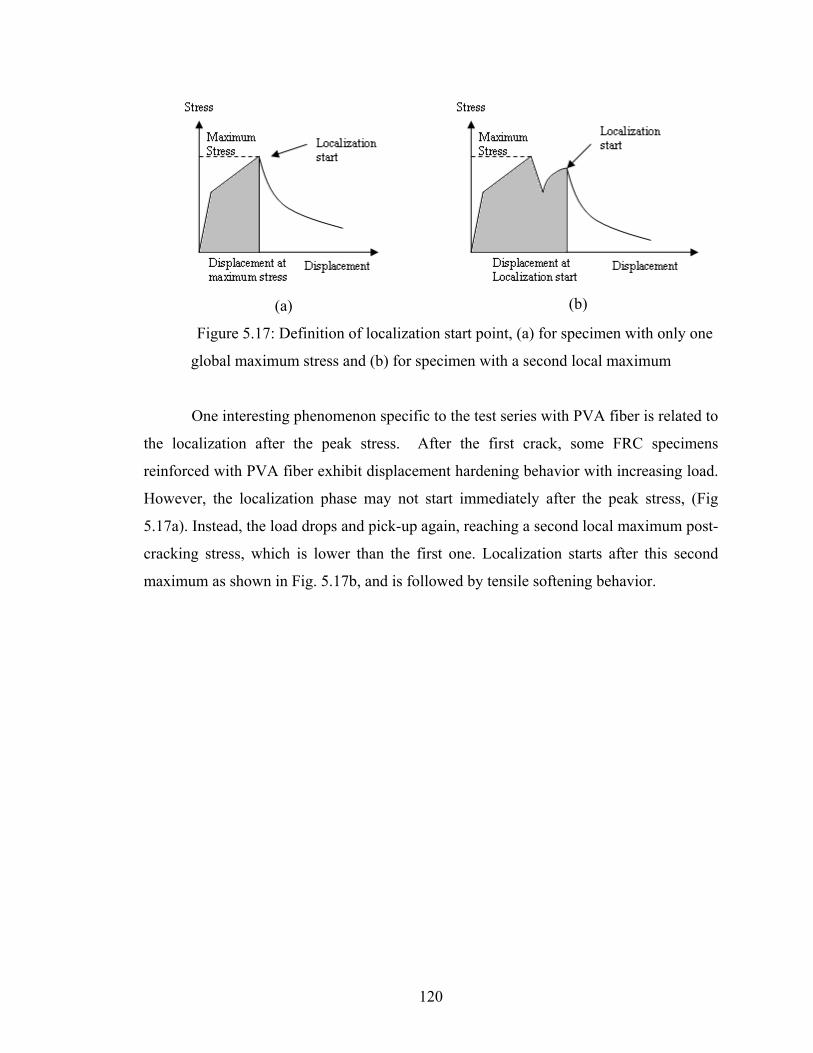
120
(a)
(b)
Figure 5.17: Definition of localization start point, (a) for specimen with only one
global maximum stress and (b) for specimen with a second local maximum
One interesting phenomenon specific to the test series with PVA fiber is related to
the localization after the peak stress. After the first crack, some FRC specimens
reinforced with PVA fiber exhibit displacement hardening behavior with increasing load.
However, the localization phase may not start immediately after the peak stress, (Fig
5.17a). Instead, the load drops and pick-up again, reaching a second local maximum post-
cracking stress, which is lower than the first one. Localization starts after this second
maximum as shown in Fig. 5.17b, and is followed by tensile softening behavior.

121
Table 5.3: Summary of test results for notched specimens reinforced with PVA fiber
(US-units)
Table 5.4: Summary of test results for notched specimens reinforced with PVA fiber
(SI-units)

122
Figure 5.18: First cracking stress
Figure 5.19: Displacement at first cracking
stress
Figure 5.20: Energy at first cracking stress
A summary of tests results for all notched specimens reinforced with PVA fiber is
given in Tables 5.3 and 5.4. The stress at first cracking, the corresponding displacement
and energy are plotted in Figs. 5.18 to 5.20 versus the volume fraction of fiber. It can be
observed that both the cracking stress and corresponding displacement vary little with Vf.
The first cracking stress is on average about 315 psi (2.17 MPa) (Fig. 5.18). Here it is
smaller than that observed in the direct tensile test specimens which were around 434 psi
(2.99 MPa).

123
Figure 5.21: Maximum stress
Figure 5.22: Displacement at maximum
stress
Figure 5.23: Energy at maximum stress
Figures 5.21 to 5.23 describe the variation of maximum stress, the corresponding
displacement, and the energy versus volume fraction of fiber. No particular trend could
be detected. It is sufficient to say that the maximum stress ranged from 377 to 566 psi
(2.599 to 3,902 MPa) with the maximum occurring at 1.5% fiber content by volume, and
the displacement was smaller than 0.16 mm in all cases. The energy at maximum stress
ranged from about 0.5 to 2 psi-in. (0.088 to 0.35 MPa-mm) (Fig. 5.23)

124
Figure 5.24: Displacement at localization
start
Figure 5.25: Energy at localization start
The observed displacement at localization start ranged from 0.0028 to 0.00625
inch (0.0713 to 0.159 mm), with an average of about 0.00423 inch (0.00107 mm) (Fig.
5.24). The corresponding energy at localization start ranged from 0.874 to 2.16 psi-in.
(0.153 to 0.378 MPa-mm) with an average of 1.447 psi-in (0.253 MPa-mm), as shown in
Fig. 5.25.
Although specimens reinforced with PVA had several characteristics different
from those with the other fibers tested in this study, there seems to be some correlation
between the (σ-COD) test results and the test results observed from the direct tensile test
series described in Chapter 4, particularly the failure mode and the lack of multiple
cracking.
Concluding Remarks (PVA Fiber)
1. No multiple cracking was observed near the main crack in the notched tensile
specimens at all volume fractions tested. However, strain hardening behavior was
observed in specimens with high volume fractions of PVA fiber. Such behavior
could be attributed to the slow propagation of a single crack from one end of the
section to its other end.
2. Only single cracks were observed in these tests. Each crack was fine and well
defined with no large damage zone around it .
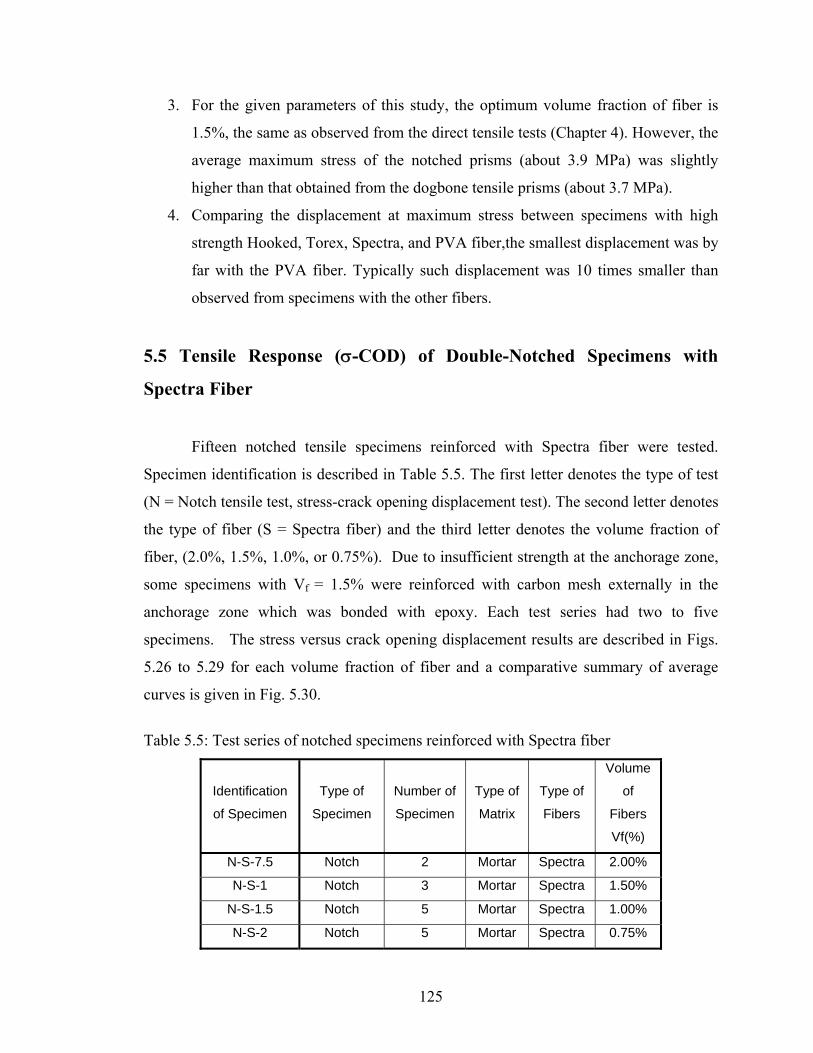
125
3. For the given parameters of this study, the optimum volume fraction of fiber is
1.5%, the same as observed from the direct tensile tests (Chapter 4). However, the
average maximum stress of the notched prisms (about 3.9 MPa) was slightly
higher than that obtained from the dogbone tensile prisms (about 3.7 MPa).
4. Comparing the displacement at maximum stress between specimens with high
strength Hooked, Torex, Spectra, and PVA fiber,the smallest displacement was by
far with the PVA fiber. Typically such displacement was 10 times smaller than
observed from specimens with the other fibers.
5.5 Tensile Response (σ-COD) of Double-Notched Specimens with
Spectra Fiber
Fifteen notched tensile specimens reinforced with Spectra fiber were tested.
Specimen identification is described in Table 5.5. The first letter denotes the type of test
(N = Notch tensile test, stress-crack opening displacement test). The second letter denotes
the type of fiber (S = Spectra fiber) and the third letter denotes the volume fraction of
fiber, (2.0%, 1.5%, 1.0%, or 0.75%). Due to insufficient strength at the anchorage zone,
some specimens with Vf = 1.5% were reinforced with carbon mesh externally in the
anchorage zone which was bonded with epoxy. Each test series had two to five
specimens. The stress versus crack opening displacement results are described in Figs.
5.26 to 5.29 for each volume fraction of fiber and a comparative summary of average
curves is given in Fig. 5.30.
Table 5.5: Test series of notched specimens reinforced with Spectra fiber
Identification
of Specimen
Type of
Specimen
Number of
Specimen
Type of
Matrix
Type of
Fibers
Volume
of
Fibers
Vf(%)
N-S-7.5 Notch 2 Mortar Spectra 2.00%
N-S-1 Notch 3 Mortar Spectra 1.50%
N-S-1.5 Notch 5 Mortar Spectra 1.00%
N-S-2 Notch 5 Mortar Spectra 0.75%
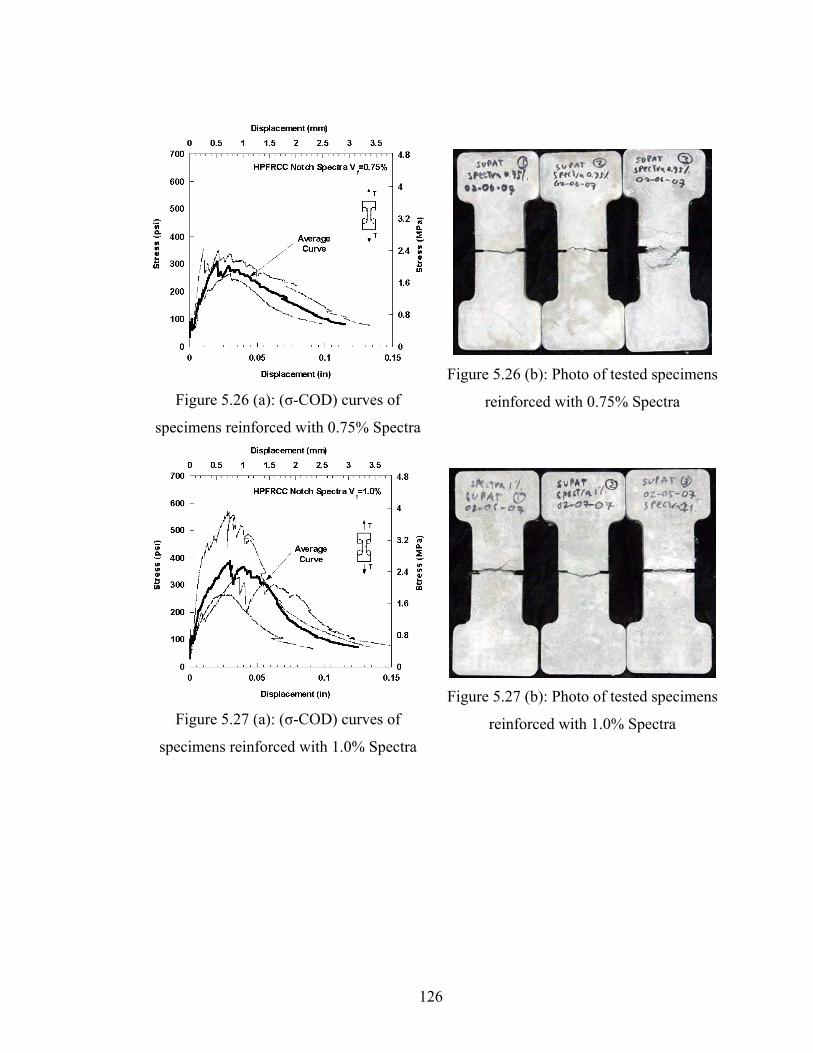
126
Figure 5.26 (a): (σ-COD) curves of
specimens reinforced with 0.75% Spectra
Figure 5.26 (b): Photo of tested specimens
reinforced with 0.75% Spectra
Figure 5.27 (a): (σ-COD) curves of
specimens reinforced with 1.0% Spectra
Figure 5.27 (b): Photo of tested specimens
reinforced with 1.0% Spectra

127
Figure 5.28 (a): (σ-COD) curves of
specimens reinforced with 1.5% Spectra
Figure 5.28 (b): Photo of tested specimens
reinforced with 1.5% Spectra
Figure 5.29 (a): (σ-COD) curves of
specimens reinforced with 2.0% Spectra
Figure 5.29 (b): Photo of tested specimens
reinforced with 2.0% Spectra

128
Figure 5.30: Comparison of average (σ-COD) curves with Spectra fiber
Overall the specimens showed ductile behavior following an initial elastic
response. The average stress at first cracking was about 200 psi (1.38 MPa). The
maximum tensile resistance was 419 psi, or 2.89 MPa at a fiber volume fraction of 1.5%.
This stress level is comparable to the maximum stress observed with the direct tensile
tests using Dogbone specimens (Chapter 4). An increase in volume fraction of fiber leads
to an increase in ductility, energy absorption capacity and additional multiple cracks in
the zone of influence around the notched section. Multiple cracking was observed even
for some specimens with the lowest fiber content of 0.75% by volume. At the higher
volume fraction of fiber, the cracking zone extended a distance about the same as the
length of the fiber.

129
Figure 5.31: First cracking stress
Figure 5.32: Displacement at first cracking
stress
Figure 5.33: Energy at first cracking stress
Note that the first cracking stress of 200 psi, (1.38 MPa) was slightly lower than
that of the notched specimens without fiber, (Fig. 5.11 and Fig. 5.31). This may be the
result of a large amount air bubbles entrapped within a specimen due to mixing
difficulties with long fibers, resulting in non-uniform specimen composition.

130
Figure 5.34: Maximum stress
Figure 5.35: Displacement at maximum
stress
Figure 5.36: Energy at maximum stress
Figures 5.33 to 5.35 show that an increase in volume fraction of fibers leads to an
increase in maximum stress, displacement at maximum stress, and related energy
absorption capacity, up to a volume fraction of fiber of 1.5%, after which the trend tapers
off. The maximum stress for Vf = 1.5% awas 566 psi (3.9MPa). When the volume
fraction of fiber increases from 1.5% to 2%, the energy at maximum stress drops by
about 11%.
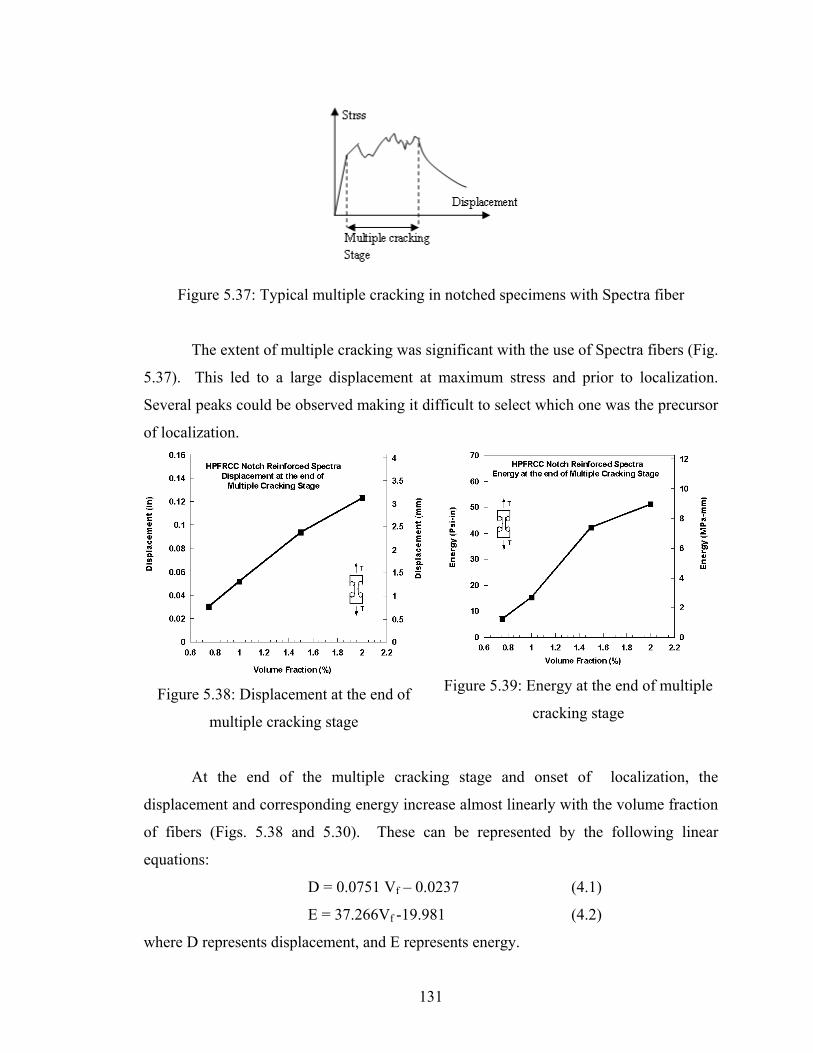
131
Figure 5.37: Typical multiple cracking in notched specimens with Spectra fiber
The extent of multiple cracking was significant with the use of Spectra fibers (Fig.
5.37). This led to a large displacement at maximum stress and prior to localization.
Several peaks could be observed making it difficult to select which one was the precursor
of localization.
Figure 5.38: Displacement at the end of
multiple cracking stage
Figure 5.39: Energy at the end of multiple
cracking stage
At the end of the multiple cracking stage and onset of localization, the
displacement and corresponding energy increase almost linearly with the volume fraction
of fibers (Figs. 5.38 and 5.30). These can be represented by the following linear
equations:
D = 0.0751 Vf – 0.0237 (4.1)
E = 37.266Vf -19.981 (4.2)
where D represents displacement, and E represents energy.

132
Table 5.6: Summary of test results for notched specimens reinforced with Spectra fiber
(US-units)

133
Table 5.7: Summary of test results for notched specimens reinforced with Spectra fiber
(SI-units)
Concluding Remarks (Spectra Fiber)
1. Multiple cracking behaviors around the notched section (equivalent to smeared
cracking) were clearly observed. Such behavior encourages strain hardening (or
high performance) response in direct tension as indeed observed in the direct
tensile tests.
2. The cracking zone on either side of the notch area (area between two notches) is
significant, containing several cracks. Its extent increased with an increase in
volume fraction of fibers. Specimens containing high volume fraction of fibers
usually outperformed those containing low volume fraction of fibers.
3. No consistent correlation could be established between the fiber content and the
first cracking stress, the strain at first cracking stress, and the energy at first
cracking stress. These variables seemed independent of the volume fraction of
fibers for the range of fiber content tested. However, the maximum stress, strain

134
at maximum stress, and energy at the end of multiple cracking stage all increased
with an increase in volume fraction of fiber.
4. Keeping in mind mixing difficulty and air entrapment, the best performance was
obtained at a volume fraction of 1.5% (not 2%) and is consistent with the results
from the direct tensile (dogbone) tests.
5.6 Tensile Response (σ-COD) of Double-Notched Specimens with High
Strength Hooked Fiber
Twenty-seven notched specimens reinforced with Hooked fibers were tested. The
test series are denoted as series N-H, having four volume fractions of fiber selected
(0.75%, 1.0%, 1.5%, and 2.0%). They are described in Table 5.8. In order to better
evaluate variability of the results, the number of specimens tested at fiber volume
fractions of 1.5% and 2.0%, was 12 and 9, respectively.
Figures 5.41 to 5.44 give the stress versus crack opening displacement curves at
the four fiber volume fractions tested. Figure 5.45 provides a comparison of the average
curves obtained for each volume fraction.
Table 5.8 Test series of notched specimens reinforced with Hooked fiber
Identification
of Specimen
Type of
Specimen
Number of
Specimens
Type of
Matrix
Type of
Fibers
Volume
of
Fibers
(Vf) (%)
N-H-2 Notch 9 Mortar Hooked 2.00%
N-H-1.5 Notch 12 Mortar Hooked 1.50%
N-H-1 Notch 3 Mortar Hooked 1.00%
N-H-0.75 Notch 3 Mortar Hooked 0.75%

135
Figure 5.40 (a): (σ-COD) curves of
specimens reinforced with 0.75% Hooked
fiber
Figure 5.40 (b): Photo of tested specimens
reinforced with 0.75% Hooked fiber
Figure 5.41 (a): (σ-COD) curves of
specimens reinforced with 1.0% Hooked
fiber
Figure 5.41(b): Photo of tested specimens
reinforced with 1.0% Hooked fiber

136
Figure 5.42: (σ-COD) curves of specimens
reinforced with 1.5% Hooked fiber
Figure 5.43: (σ-COD) curves of specimens
reinforced with 2.0% Hooked fiber
Figure 5.44: Comparison of average (σ-COD) curves with Hooked fiber
Testing results, especially Figs. 5.42 and 5.43, revealed large variations in
response for the same volume fraction of fibers. For example, in Fig. 5.42, for specimens
reinforced with 1.5% Hooked fiber by volume, the maximum stress ranged from 560 psi
to 1193 psi. (3.86 to 8.23 MPa). The overall specimens’ behavior was relatively ductile.
An elastic response was observed up to the first cracking with an average cracking stress
of 332 psi (2.289 MPa). However, on average, the higher the volume fraction of fiber the
higher the stress at first cracking and the maximum stress (Fig. 5.44).

137
Figures 5.45 to 5.47 describe the variation of the peak point properties with the
volume fraction of fiber. It can be observed that from Vf = 0.75% to Vf = 1.5% there is
an increase in the the first cracking stress, the displacement at first cracking stress, and
the corresponding energy. However, these taper off between 1.5% and 2.0% volume
fractions of fiber. Also the damage in the failure zone around the notched section
increases when increasing the volume fraction of fiber.
When comparing variability, it seems from the limited tests that the greater the
volume fraction of fiber the greater the variability. Indeed specimens containing 2.0%
volume fraction of fiber have a standard deviation of 294 psi (2.03 MPa) for the
maximum stress versus 231 psi, (1.59 MPa ) for the specimens with 1.5% fiber volume
fraction. More tests are needed to ascertain this result.
Figure 5.45: First cracking stress
Figure 5.46: Displacement at first cracking
stress
Figure 5.47: Energy at first cracking stress

138
Figure 5.48: Maximum stress
Figure 5.49: Displacement at maximum
stress
Figure 5.50: Energy at maximum stress
Figures 5.48 to 5.50 relate to the properties of the peak point. The maximum
stress clearly increases when the volume fraction of fiber increases and tapers off
between 1.5% and 2%. However, the displacement at maximum stress does not follow a
consistent trend but can be assumed to slightly decrease, and the energy absorption
capacity remains almost constant.

139
Figure 5.51: Displacement at the end of
multiple cracking stage
Figure 5.52: Energy at the end of multiple
cracking stage
The displacement at the end of the multiple cracking and the corresponding
energy appear not to be affected by the volume fraction of fiber, as illustrated in Figs.
5.51 and 5.52. Additional tests may be needed to better understand and ascertain this
observation.

140
Table 5.9: Summary of test results for notched specimens reinforced with Hooked fiber
(US-units)

141
Table 5.10: Summary of test results for notched specimens reinforced with Hooked fiber
(SI-units)
Concluding Remarks (Hooked Fiber)
1. Numerous multiple cracks clearly occurred around the notched section.
Displacement (strain) hardening behavior was observed within the 1 in (25 mm)
guage length. The higher the volume fraction of fibers the more extended was
the cracked region. Specimens with 2.0% and 1.5% volume fractions were
observed as having a larger number of cracks. (about 5 equivalent cracks)
2. Generally the higher the volume fraction of fibers the better the post-cracking
strength. However, the displacement at maximum stress and the energy at
maximum stress were almost independent of the fiber volume fraction.

142
3. The stress at first cracking, the corresponding displacement and related energy
increased slightly with the volume fraction of fibers. A high variability in test
results was clearly observed and will be further addressed (Chapter 7).
5.7 Tensile Response (σ-COD) of Double-Notched Specimens with Torex
Fiber
Seventeen notched sepciemens reinforced with Torex fiber were tested. The test
series are identified as series N-T; four volume fractions of fiber were used (0.75%,
1.0%, 1.5%, and 2.0%). Table 5.11 describes the series identification and the number of
specimens tested for each series. The first letter denotes the type of test (N for notch
tensile test/stress–crack opening displacement test). The second letter denotes the type of
fiber (T = Torex fiber). The third letter denotes the volume fraction of fiber, (2.0%, 1.5%,
1.0%, or 0.75%). The Torex fiber was high strength steel as described in Chapter 4.
The stress versus crack opening displacement curves are plotted in Figs. 5.54 to 5.57 and
a comparison of average curves are given in Fig. 5.58. Test results are summarized in
Tables 5.12 and 5.13.
Table 5.11: Test series of notched specimens reinforced with Torex fiber
Identification
of Specimen
Type of
Specimen
Number of
Specimens
Type
of
Matrix
Type
of
Fibers
Volume
of
Fibers
(Vf(%)
N-T-2 Notch 6 Mortar Torex 2.00%
N-T-1.5 Notch 5 Mortar Torex 1.50%
N-T-1 Notch 3 Mortar Torex 1.00%
N-T-0.75 Notch 3 Mortar Torex 0.75%

143
Figure 5.53 (a): (σ-COD) curves of
specimens reinforced with 0.75% Torex fiber
Figure 5.53 (b): Photo of tested
specimens reinforced with 0.75% Torex
fiber
Figure 5.54 (a): (σ-COD) curves of
specimens reinforced with 1.0% Torex fiber
Figure 5.54 (b): Photo of tested
specimens reinforced with 1.0% Torex
fiber

144
Figure 5.55 (a): (σ-COD) curves of
specimens reinforced with 1.5% Torex fiber
Figure 5.55(b): Photo of tested
specimens reinforced with 1.5% Torex
fiber
Figure 5.56 (a): (σ-COD) curves of
specimens reinforced with 2.0% Torex fiber
Figure 5.56 (b): Photo of tested
specimens reinforced with 2.0% Torex
fiber

145
Figure 5.57: Comparison of average (σ-COD) curves with Torex fiber
Overall the response of the notched specimens with Torex fibers was excellent.
As the load increased, the displacement increased and some multiple fine cracking
developed in the zone around the notched section. Displacement hardening (or strain
hardening) occurred even at the low fiber volume content of 0.75%. For the fiber volume
content of 0.75% and 1%, the results within series were consistent and with low
variability (Figs. 5.53 and 5.54). A higher variability was observed with the series at
1.5% and 2%. This was for two reasons: first, at the higher fiber volume content, some
critical cracks occurred outside the notched section (Fig. 5.56b), and second, due to the
high tensile stresses failure occurred at the gripps in preliminary tests, so the specimen
had to be reinforced at the gripps with epoxy bonded carbon mesh. Overall the higher the
fiber volume fraction, the better the response is. While the maximum tensile stress
observed was significantly higher than with Spectra fibers, the zone of influence for
multiple cracks around the notched section was small and extended only about half an
inch (13 mm). Maximum tensile stresses were higher than for the series of tests using
dogbone specimens (Chapter 4).
All curves showed an initial elastic response up to the first cracking and the
average cracking stress was about 400 psi (2.75 MPa). Figures 5.58 to 5.60 describes the
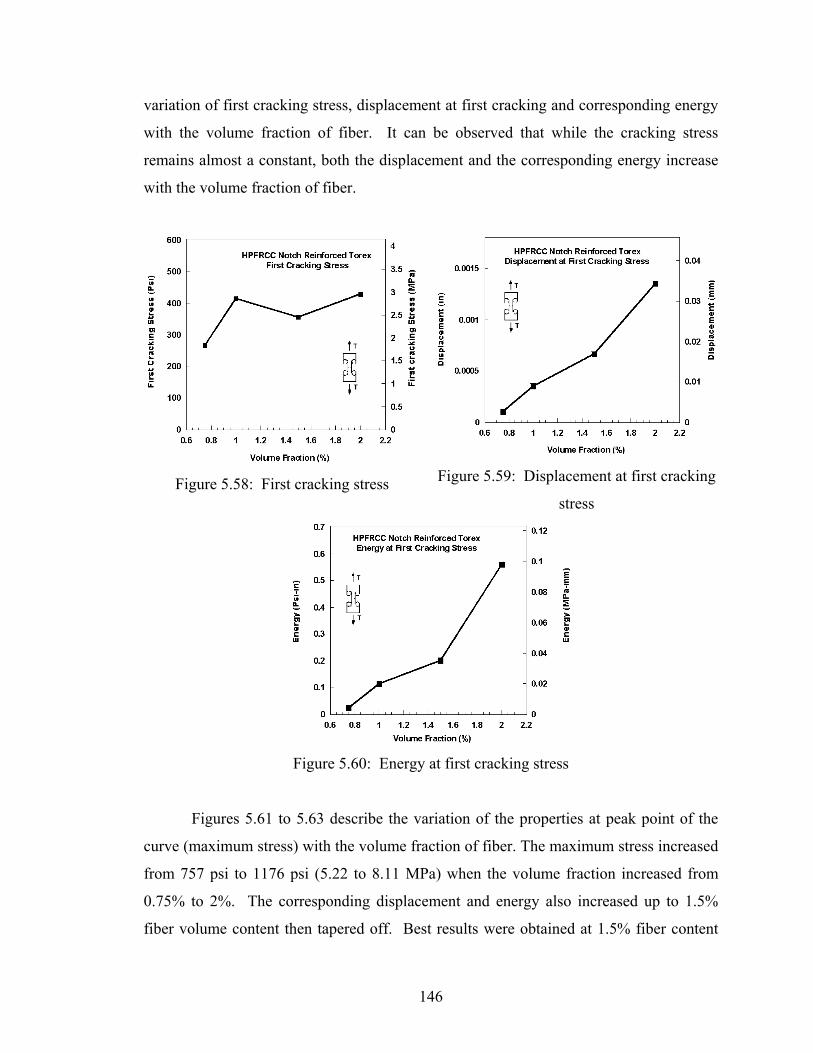
146
variation of first cracking stress, displacement at first cracking and corresponding energy
with the volume fraction of fiber. It can be observed that while the cracking stress
remains almost a constant, both the displacement and the corresponding energy increase
with the volume fraction of fiber.
Figure 5.58: First cracking stress Figure 5.59: Displacement at first cracking
stress
Figure 5.60: Energy at first cracking stress
Figures 5.61 to 5.63 describe the variation of the properties at peak point of the
curve (maximum stress) with the volume fraction of fiber. The maximum stress increased
from 757 psi to 1176 psi (5.22 to 8.11 MPa) when the volume fraction increased from
0.75% to 2%. The corresponding displacement and energy also increased up to 1.5%
fiber volume content then tapered off. Best results were obtained at 1.5% fiber content
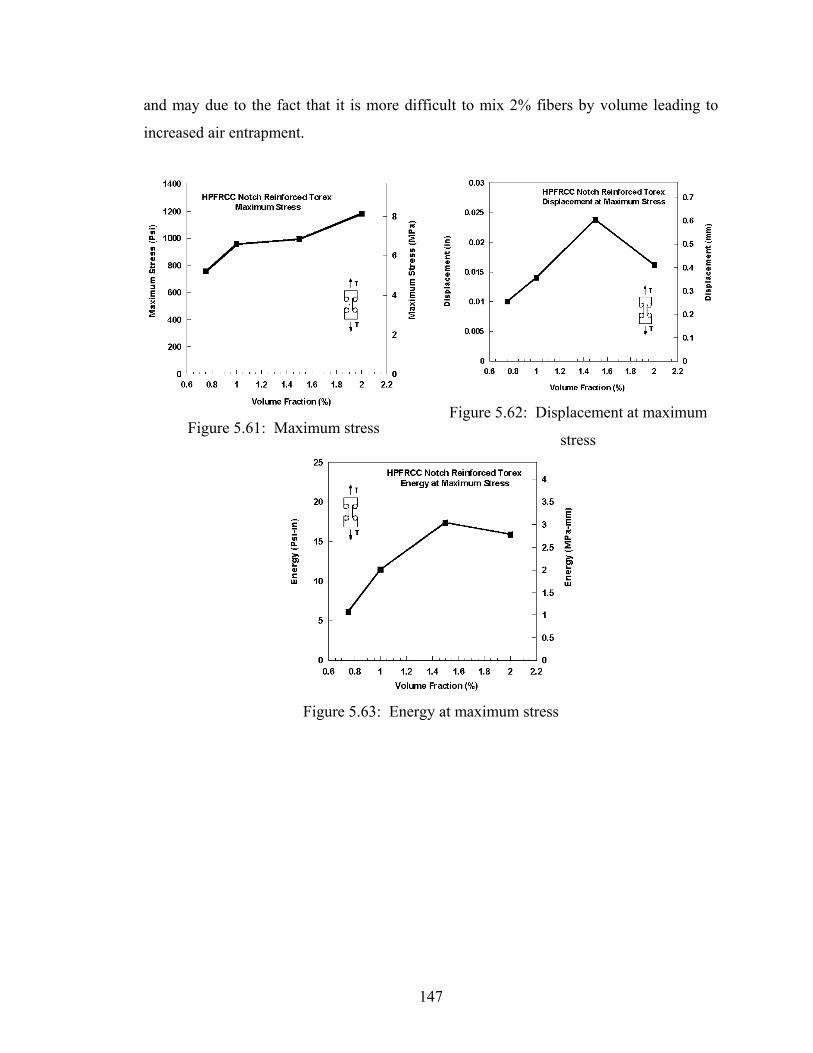
147
and may due to the fact that it is more difficult to mix 2% fibers by volume leading to
increased air entrapment.
Figure 5.61: Maximum stress
Figure 5.62: Displacement at maximum
stress
Figure 5.63: Energy at maximum stress
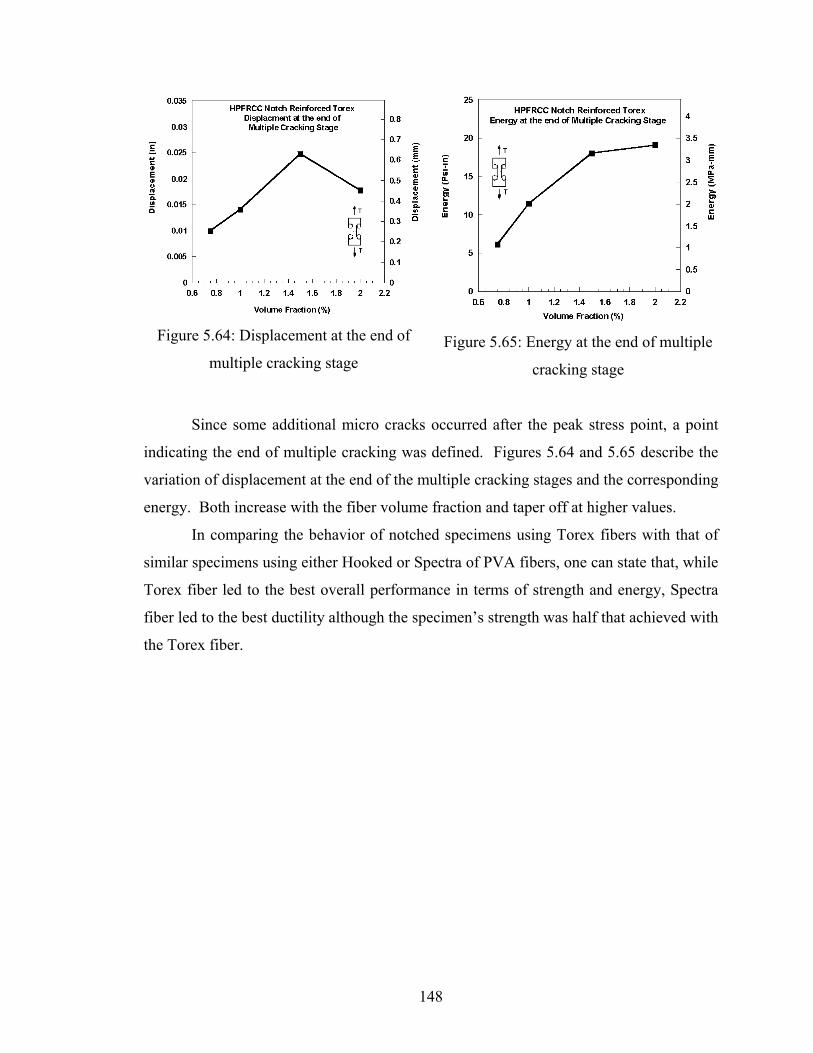
148
Figure 5.64: Displacement at the end of
multiple cracking stage
Figure 5.65: Energy at the end of multiple
cracking stage
Since some additional micro cracks occurred after the peak stress point, a point
indicating the end of multiple cracking was defined. Figures 5.64 and 5.65 describe the
variation of displacement at the end of the multiple cracking stages and the corresponding
energy. Both increase with the fiber volume fraction and taper off at higher values.
In comparing the behavior of notched specimens using Torex fibers with that of
similar specimens using either Hooked or Spectra of PVA fibers, one can state that, while
Torex fiber led to the best overall performance in terms of strength and energy, Spectra
fiber led to the best ductility although the specimen’s strength was half that achieved with
the Torex fiber.

149
Table 5.12: Summary of test results for notched specimens reinforced with Torex fiber
(US-units)
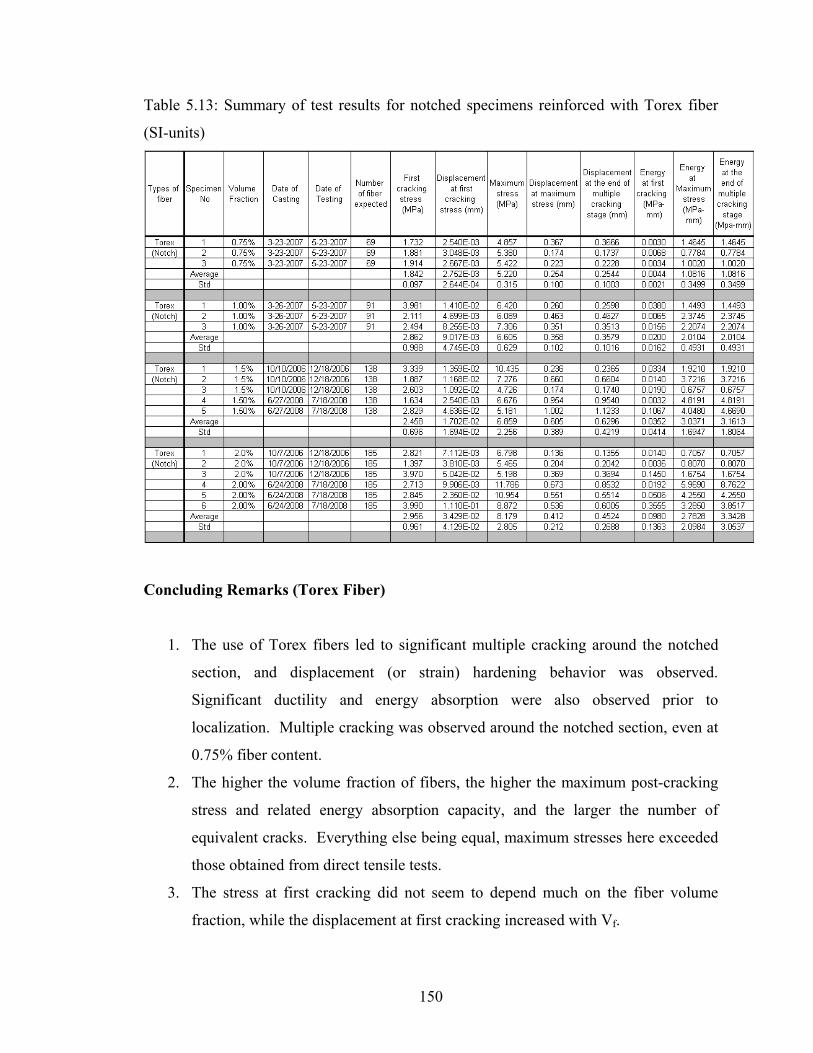
150
Table 5.13: Summary of test results for notched specimens reinforced with Torex fiber
(SI-units)
Concluding Remarks (Torex Fiber)
1. The use of Torex fibers led to significant multiple cracking around the notched
section, and displacement (or strain) hardening behavior was observed.
Significant ductility and energy absorption were also observed prior to
localization. Multiple cracking was observed around the notched section, even at
0.75% fiber content.
2. The higher the volume fraction of fibers, the higher the maximum post-cracking
stress and related energy absorption capacity, and the larger the number of
equivalent cracks. Everything else being equal, maximum stresses here exceeded
those obtained from direct tensile tests.
3. The stress at first cracking did not seem to depend much on the fiber volume
fraction, while the displacement at first cracking increased with Vf.

151
4. The damaged area around the notched section was usually smaller than that using
Spectra fibers. This could be attributed to the fact that the Spectra fibers used
were 38 mm in length compared to the 30 mm Torex fibers.
5. The variability in test results obtained with Torex fibers was smaller than that
with Spectra and Hooked fibers.
5.8 Comparison of Test Series Reinforced with Different Fibers
(a)
(b)
(c)
(d)
Figure 5.66: Comparison of stress-crack opening displacement for the four fibers
used at (a) Vf=0.75%, (b) Vf=1.0%, (c) Vf=1.5%, and (d) Vf=2.0%,

152
Figures 5.66a to 5.66d show average stress versus COD curves for the four fibers
tested, each at four different volume fractions. The scales for each fiber are different in
order to better clarify the ascending portion of each curve, or to accommodate the
increase in maximum stress. In every case, it can generally be said that increasing the
fiber volume fraction improves the overall response (σ-COD) of the composite, not only
in terms of stress or resistance, but also in terms of ductility and energy absorption
capacity. This trend may taper off at higher volume fractions; this may be due to the
increasing difficulty to mix fibers in larger volumes and the increased porosity of the
mix, which can nullify the potential benefits of additional fibers. It may also be due to
group effect, where the efficiency of one fiber is reduced when a large number of fibers is
pulling out simultaneously from the same area. In the examples of this study, the
difference in stress-COD between using 1.5% and 2% fibers by volume may not justify
the increase in cost due to the fibers added. In comparing the effectiveness of different
fibers, it can be said that consistently the Torex fiber led to better overall performance
than the other fibers tested. It was followed by high strength Hooked, Spectra then PVA
fiber. At 1% fiber content, the maximum stress achieved with the Torex fiber is almost
40% higher than that with Hooked fiber, and more than twice that with Spectra and PVA
fibers. At 2% fiber content, the maximum stress achieved with Torex fiber is 20%
higher than that with the Hooked fiber, but almost three times that achieved with the
Spectra and PVA fiber.
5.9 Concluding Remarks
The following conclusions can be drawn from this study:
1. The stress versus crack opening displacement (COD) of FRC composites can be
classified into four types: clearly displacement (or strain) hardening with multiple
cracks; clearly displacement (or strain) softening with a single localized crack ;
and two cases in between, a displacement (or strain) hardening material with a
single major crack ; a displacement (or strain) softening material with post
cracking strength, able to pick up almost up to the cracking stress.

153
2. For the same volume fraction of fibers, specimens with Torex and High strength
Hooked fibers showed better overall behavior than specimens with Spectra and
PVA fibers. Moreover, their post-cracking strength was 1.5 to 3 times the strength
at first cracking, while for specimens with PVA fibers, the post-cracking strength
was only 10% to 50% higher than the cracking strength.
3. For the same type of fiber, increasing the volume fraction leads to a marked
improvement in post-cracking strength, ductility, and energy absorption capacity
of the composites.
4. The crack opening in specimens with Torex, high strength Hooked and Spectra
are the result of fiber-pulling out. However, the damage in specimens with PVA
fibers was due to fiber breaking.
In this study only one mortar matrix composition and strength was used. It is
likely that the results would be different with different strength matrices. However, it
also likely that the typical observations for the shape of the stress versus COD curves
will be similar to what is observed in this study.

154
CHAPTER 6
PROPOSED MODEL FOR POST-CRACKING BEHAVIOR OF HPFRCC UNDER TENSION
6.1 Introduction
Figure 6.1: Proposed diagram of HPFRCC model
It is generally believed that from the micromechanical properties, it is possible to
derive a model of a single fiber bridging a crack and use that to predict the overall
behavior of the composite at the material’s level and even the structure. However, the
result of a single-fiber is not sufficient to design a fiber-reinforced structural element. The
main reason is, when the macro-mechanical properties are investigated, the randomly
oriented discontinuous fibers introduce additional parameters, such as the uncertainty of
the number of fibers bridging the crack, the pulley effect, and matrix spilling, which

155
considerably affect the overall macro-mechanical behavior. Therefore, a more realistic
model in tension is required to account for these effects.
Generally, the stress-strain response of HPFRCCs in tension exhibits linearly
elastic behavior up to the first cracking. Beyond the elastic limit (first structural
cracking), the crack is assumed to extend over the composite cross-section. Hence, the
crack is resisted only by the bridging fibers. The first crack strength is defined as the
applied tensile stress at which the crack percolates throughout a cross-section. After first
cracking, the multiple cracking stage takes place, and the tensile member can be viewed
as divided into numerous segments in series, like a chain (Fig. 6.2). The width of each
crack depends on the stress transferred from the fibers to the matrix. After the multiple
cracking processes are completed, no further cracks form. Then, under further loading or
straining, localization takes place as a result of the opening of the main critical crack and
failure follows by reduction of the tensile resistance.
Figure 6.2: Typical tensile response of HPFRCC and chain model
In this Chapter, a model to predict the post-cracking stress-strain response of
HPFRCC in tension is explained. Details are given in seven sections. First cracking
stress, Strain at first cracking stress, and maximum post-cracking stress or Ultimate
cracking strength are explained in Sections 6.2, 6.3 and 6.4. Multiple cracking behavior
and strain at maximum stress or at Ultimate are discussed in Section 6.5. Localization of
the critical crack and the descending branch of the curve (Fig. 6.2) are discussed in
Section 6.6. The correlation between direct tensile tests and stress versus crack opening

156
displacement tests is addressed in Section 6.7. A flowchart of the proposed stress-strain
model and the computational steps are demonstrated in Section 6.8. Finally, a preliminary
verification and calculation to illustrate the application of the proposed model is
presented in Section 6.9.
6.2 First Cracking Stress
An equation to predict the first cracking stress is obtained from earlier research
conducted by Naaman (1972, 1974, and 1987) as
σcc = σmu (1-Vf) + α1 α2 τ Vf L / d (6.1)
where Vf = Volume fraction of fiber
L = Fiber length
d = Fiber diameter
L/d = Fiber aspect ratio
σmu = Tensile strength of the matrix
τ = Average bond strength at the fiber matrix interface
α1 = Coefficient to describe the fraction of bond mobilized at first crack
α2 = Coefficient of fiber orientation in the uncracked state
The product of coefficients α1 α2 was obtained from the experimental data on the
direct tensile tests described in Chapter 4. Details are given next. The following fiber
properties were used for all calculations in this chapter:
PVA Fiber (oiled as described in Chapter 4)
Diameter = 0.19 mm = 7.48x10⁻³ inch
Length = 12 mm = 0.5 inch
Equivalent bond strength τ = 3.5 Mpa = 510 psi (Guerrero, 1999)
l/d = 67
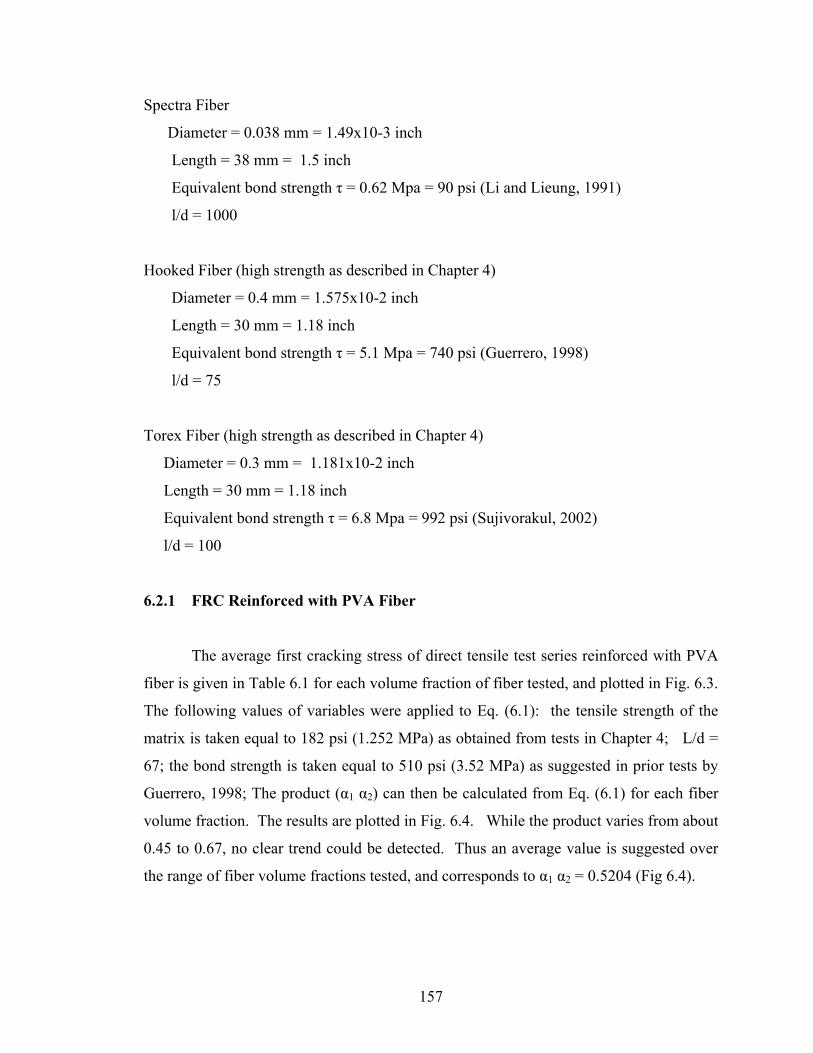
157
Spectra Fiber
Diameter = 0.038 mm = 1.49x10⁻³ inch
Length = 38 mm = 1.5 inch
Equivalent bond strength τ = 0.62 Mpa = 90 psi (Li and Lieung, 1991)
l/d = 1000
Hooked Fiber (high strength as described in Chapter 4)
Diameter = 0.4 mm = 1.575x10⁻² inch
Length = 30 mm = 1.18 inch
Equivalent bond strength τ = 5.1 Mpa = 740 psi (Guerrero, 1998)
l/d = 75
Torex Fiber (high strength as described in Chapter 4)
Diameter = 0.3 mm = 1.181x10⁻² inch
Length = 30 mm = 1.18 inch
Equivalent bond strength τ = 6.8 Mpa = 992 psi (Sujivorakul, 2002)
l/d = 100
6.2.1 FRC Reinforced with PVA Fiber
The average first cracking stress of direct tensile test series reinforced with PVA
fiber is given in Table 6.1 for each volume fraction of fiber tested, and plotted in Fig. 6.3.
The following values of variables were applied to Eq. (6.1): the tensile strength of the
matrix is taken equal to 182 psi (1.252 MPa) as obtained from tests in Chapter 4; L/d =
67; the bond strength is taken equal to 510 psi (3.52 MPa) as suggested in prior tests by
Guerrero, 1998; The product (α1 α2) can then be calculated from Eq. (6.1) for each fiber
volume fraction. The results are plotted in Fig. 6.4. While the product varies from about
0.45 to 0.67, no clear trend could be detected. Thus an average value is suggested over
the range of fiber volume fractions tested, and corresponds to α1 α2 = 0.5204 (Fig 6.4).

158
Table 6.1: Average first cracking stress of tensile test series with PVA fiber
Figure 6.3: Variation of first cracking stress
for test series with PVA fiber
Figure 6.4: Product α1α2 versus Vf
6.2.2 HPFRCC Reinforced with Spectra Fiber
The average first cracking stress of direct tensile test series reinforced with
Spectra fiber is given in Table 6.2 for each volume fraction of fiber tested, and plotted in
Fig. 6.5. The following values of variables were applied to Eq. (6.1): the tensile
strength of the matrix is taken equal to 182psi (1.252 MPa); L/d = 1000; the bond
strength is taken equal to 89.923 psi (0.62 MPa) as suggested in prior tests (Li and
Lieung, 1991). The product (α1 α2) can then be calculated from Eq. (6.1) for each fiber
volume fraction. The results are plotted in Fig. 6.6. The corresponding value for Vf =
0.75% was disgarded since it is too much out of range. The remaining values α1 α2 for Vf
ranging from 1% to 2% led to an average product α1 α2 = 0.0424.
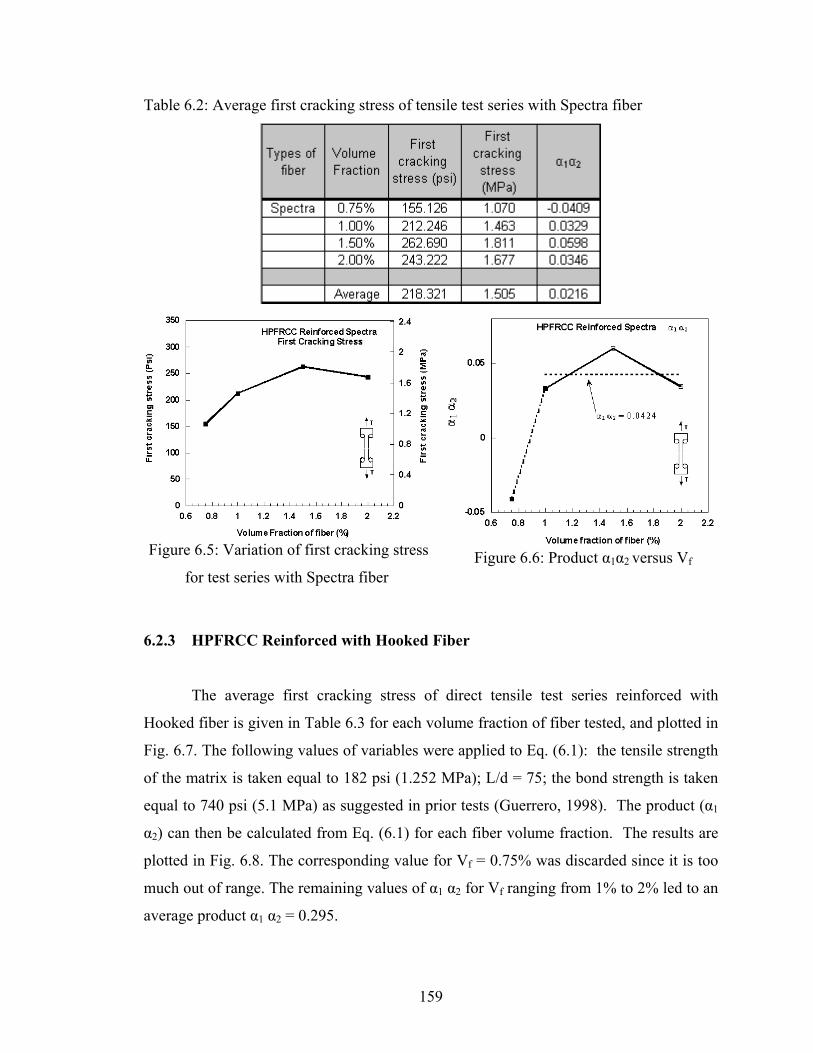
159
Table 6.2: Average first cracking stress of tensile test series with Spectra fiber
Figure 6.5: Variation of first cracking stress
for test series with Spectra fiber Figure 6.6: Product α1α2 versus Vf
6.2.3 HPFRCC Reinforced with Hooked Fiber
The average first cracking stress of direct tensile test series reinforced with
Hooked fiber is given in Table 6.3 for each volume fraction of fiber tested, and plotted in
Fig. 6.7. The following values of variables were applied to Eq. (6.1): the tensile strength
of the matrix is taken equal to 182 psi (1.252 MPa); L/d = 75; the bond strength is taken
equal to 740 psi (5.1 MPa) as suggested in prior tests (Guerrero, 1998). The product (α1
α2) can then be calculated from Eq. (6.1) for each fiber volume fraction. The results are
plotted in Fig. 6.8. The corresponding value for Vf = 0.75% was discarded since it is too
much out of range. The remaining values of α1 α2 for Vf ranging from 1% to 2% led to an
average product α1 α2 = 0.295.

160
Table 6.3: Average first cracking stress of tensile test series with Hooked fiber
Figure 6.7: Variation of first cracking stress for
test series with Hooked fiber
Figure 6.8: Product α1α2 versus Vf
6.2.4 HPFRCC Reinforced with Torex Fiber
The average first cracking stress of direct tensile test series reinforced with Torex
fiber is given in Table 6.4 for each volume fraction of fiber tested, and plotted in Fig. 6.9.
The following values of variables were applied to Eq. (6.1): the tensile strength of the
matrix is taken equal to 182 psi (1.252 MPa); L/d = 100; the bond strength is taken
equal to 992.28 psi (6.8 MPa) as suggested in prior tests [Sujivorakul, 2002]. The
product (α1 α2) can then be calculated from Eq. (6.1) for each fiber volume fraction. The
results are plotted in Fig. 6.10. The product α1 α2 remained almost constant for Vf ranging
from 0.75% to 2% with an average α1 α2 = 0.094.

161
Table 6.4: Average first cracking stress of tensile test series with Torex fiber
Figure 6.9:Variation of first cracking stress
for test series with Torex fiber
Figure 6.10: Product α1α2 versus Vf
6.3 Strain at First Cracking Stress
The average strain at first cracking stress of HPFRCC specimens reinforced with
PVA fiber is around 0.000172, which is 3 times smaller than observed from the
cementitious material without fiber (0.0005). Clearly the presence of fiber in the
composite increases the strain at first cracking stress. This may also be due to the slow
growth of the crack from one side of the specimen to the other side leading to
nonlinearity and strain increment.
Also, the average first cracking strain of HPFRCC specimens reinforced with
Spectra fiber is 0.000985, twice as high as that observed from the cementitious material
without fiber (0.0005). The increase in strain at first cracking may also be explained in a

162
similar manner as for PVA fiber.
The average strain at first cracking stress of HPFRCC specimens reinforced with
Hooked fiber is 0.000287. This number is lower than observed from the control
specimens without reinforcement (0.000517 by almost 45%).
The average strain at first cracking stress of HPFRCC reinforced with Torex fiber
specimens is 0.000224. This number is lower than expected from specimens without
reinforcement (0.000517) by 43% and similar to the strain observed with Hooked fiber.
6.4 Maximum Post-Cracking Stress or Ultimate Stress
The ultimate strength or maximum post-cracking stress (σpc) can be modeled by
the following equation [Naaman, 1972, 1987, 2003]:
σpc = λpc τ Vf L/d (6.2)
where:
λpc = λ1 λ2 λ3
λ1 = Expected pull out length ratio
λ2 = Efficiency factor of orientation in the cracked state
λ3 =Group reduction factor associated with the number of fibers pulling-out per
unit area (or density of fiber crossing the composites)
λ2 = 4 α2 λ4 λ5
λ4 =Pulley effect; Fiber pulls at an angle creating a pulley effect for flexural fibers
plastification or matrix damage for each fiber
λ5 = General reduction in pull-out response when fibers are oriented at greater
than 60o; they become ineffective due to damage around crack and matrix
spelling
In this study, it was decided to simply focus on the global coefficient λpc and estimated it
for the test results.

163
6.4.1 FRC Reinforced with PVA Fiber
The average value of maximum post-cracking stress (or ultimate strength) of direct
tensile test series reinforced with PVA fiber is given in Table 6.5 for each volume
fraction of fiber tested, and plotted in Fig. 6.11. The following values of variables were
applied to Eq. (6.2): L/d = 67; bond strength = 510 psi (3.52 MPa) as described in
Section 6.2. The coefficient λpc can then be calculated from Eq. (6.2) for each fiber
volume fraction. The results are plotted in Fig. 6.12. An almost linear response is
observed. The corresponding line is given by the following equation: λpc = - 0.707 Vf +
2.093. Such a response is not surprising since group effect is important and leads to a
reduction in fiber efficiency when the number of fibers increases.
Table 6.5: Average post-cracking strength of tensile test series with PVA fiber
Figure 6.11: Variation of maximum stress
for test series with PVA fiber
Figure 6.12: Cefficient λpc versus Vf

164
6.4.2 HPFRCC Reinforced with Spectra Fiber
The average value of maximum post-cracking stress (or ultimate strength) of direct
tensile test series reinforced with Spectra fiber is given in Table 6.6 for each volume
fraction of fiber tested, and plotted in Fig. 6.13. The following values of variables were
applied to Eq. (6.2): L/d = 1000; bond strength = 89.923 psi (0.62 MPa) as described in
Section 6.2. The coefficient λpc can then be calculated from Eq. (6.2) for each fiber
volume fraction. The results are plotted in Fig. 6.14. An almost linear response is
observed similarly to the case with PVA fiber, and can be explained by the reduction in
fiber efficiency when the number of fibers increases.
Table 6.6: Average post-cracking strength of tensile test series with Spectra fiber
Figure 6.13: Variation of maximum stress
for test series with Spectra fiber
Figure 6.14: Coefficient λpc versus Vf

165
The linear relation described in Fig. 6.14 is given by:
λpc = -20.8Vf + 0.63 (6.3)
6.4.3 HPFRCC Reinforced with Hooked Fiber
The average value of maximum post-cracking stress (or ultimate strength) of direct
tensile test series reinforced with Hooked fiber is given in Table 6.7 for each volume
fraction of fiber tested, and plotted in Fig. 6.15. The following values of variables were
applied to Eq. (6.2): L/d = 30; bond strength = 740 psi (5.1 MPa) as described in Section
6.2. The coefficient λpc can then be calculated from Eq. (6.2) for each fiber volume
fraction. The results are plotted in Fig. 6.16. Ignoring the value at Vf = 0.75%, an almost
linear response is observed similarly to the case with PVA and Spectra fiber, and can be
explained by the reduction in fiber efficiency when the number of fibers increases.
Table 6.7: Average post-cracking strength of tensile test series with Hooked fiber

166
Figure 6.15: Variation of maximum stress
for test series with Hooked fiber
Figure 6.16: Coefficient λpc versus Vf
The linear relation described in Fig. 6.16 is given by:
λpc = -55.6Vf + 2.58 (6.4)
6.4.4 HPFRCC Reinforced with Torex Fiber
The average value of maximum post-cracking stress (or ultimate strength) of direct
tensile test series reinforced with Torex fiber is given in Table 6.8 for each volume
fraction of fiber tested, and plotted in Fig. 6.17. The following values of variables were
applied to Eq. (6.2): L/d = 100; bond strength =992.28 psi (6.8 MPa) as described in
Section 6.2. The coefficient λpc can then be calculated from Eq. (6.2) for each fiber
volume fraction. The results are plotted in Fig. 6.18. Here also, an almost linear
response is observed similarly to the case with PVA, Spectra, and Hooked fibers, and can
be explained by the reduction in fiber efficiency when the number of fibers increases.
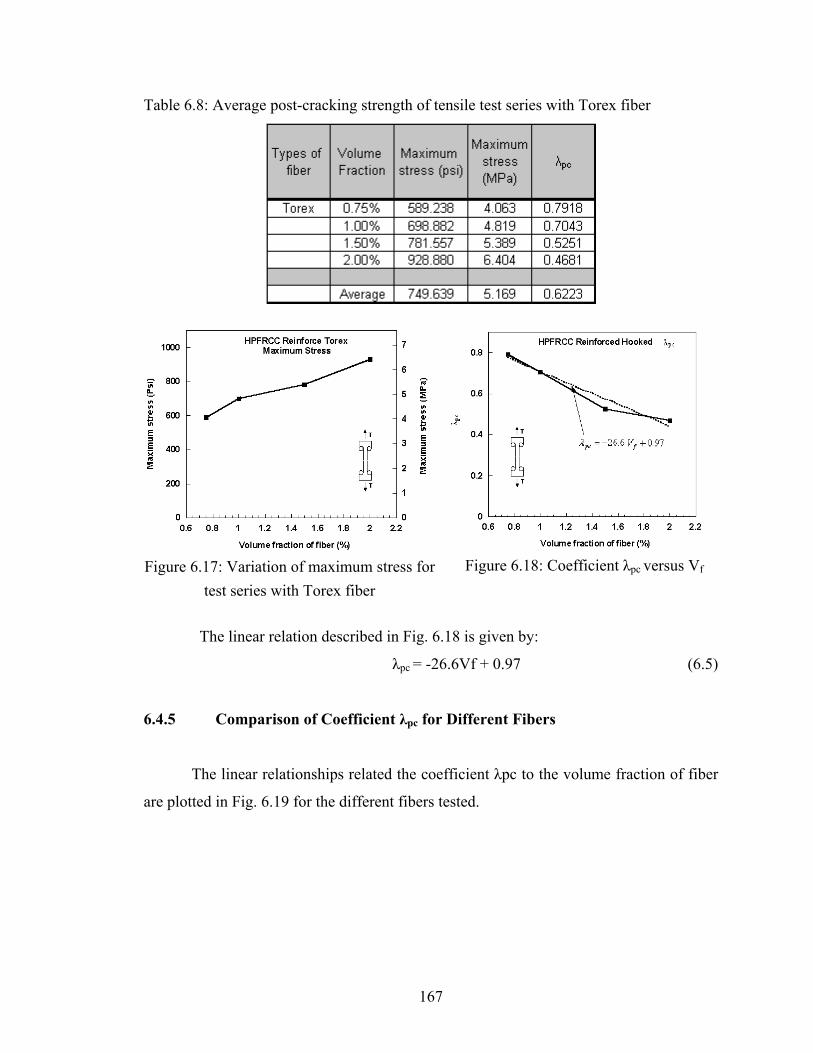
167
Table 6.8: Average post-cracking strength of tensile test series with Torex fiber
Figure 6.17: Variation of maximum stress for
test series with Torex fiber
Figure 6.18: Coefficient λpc versus Vf
The linear relation described in Fig. 6.18 is given by:
λpc = -26.6Vf + 0.97 (6.5)
6.4.5 Comparison of Coefficient λpc for Different Fibers
The linear relationships related the coefficient λpc to the volume fraction of fiber
are plotted in Fig. 6.19 for the different fibers tested.

168
Figure 6.19: λpc of HPFRCC and Vf
6.5 Multiple Cracking Behavior and Strain at Maximum Stress
Generally, the number of cracks in strain-hardening FRC composites increases
with the volume fraction of fiber, up to a value corresponding to crack saturation. Crack
saturation may occur prior to the maximum stress, and in some instances was observed to
continue after the maximum stress. The variation of average crack spacing and widths
are described in the following sections for the tensile test series with Hooked, Spectra and
Torex fiber. No multiple cracking was observed in this study (Chapter 4) for the test
series with PVA fiber and thus they are not discussed further.

169
6.5.1 Test Series with Hooked Fiber
Figure 6.20: Typical increase in number of cracks with fiber volume fraction
Figure 20 illustrates the increase in number of cracks at saturation for the test
series described in Chapter 4 for Hooked fiber. The extension to Sifcon is taken from
another investigation [See appendix]. Figure 6.21 shows photographs of a typical crack
development with increasing load for a test specimen with Hooked fiber.
Figure 6.21: Crack formation under increasing load in test series reinforced with 1.5%
Hooked steel fiber
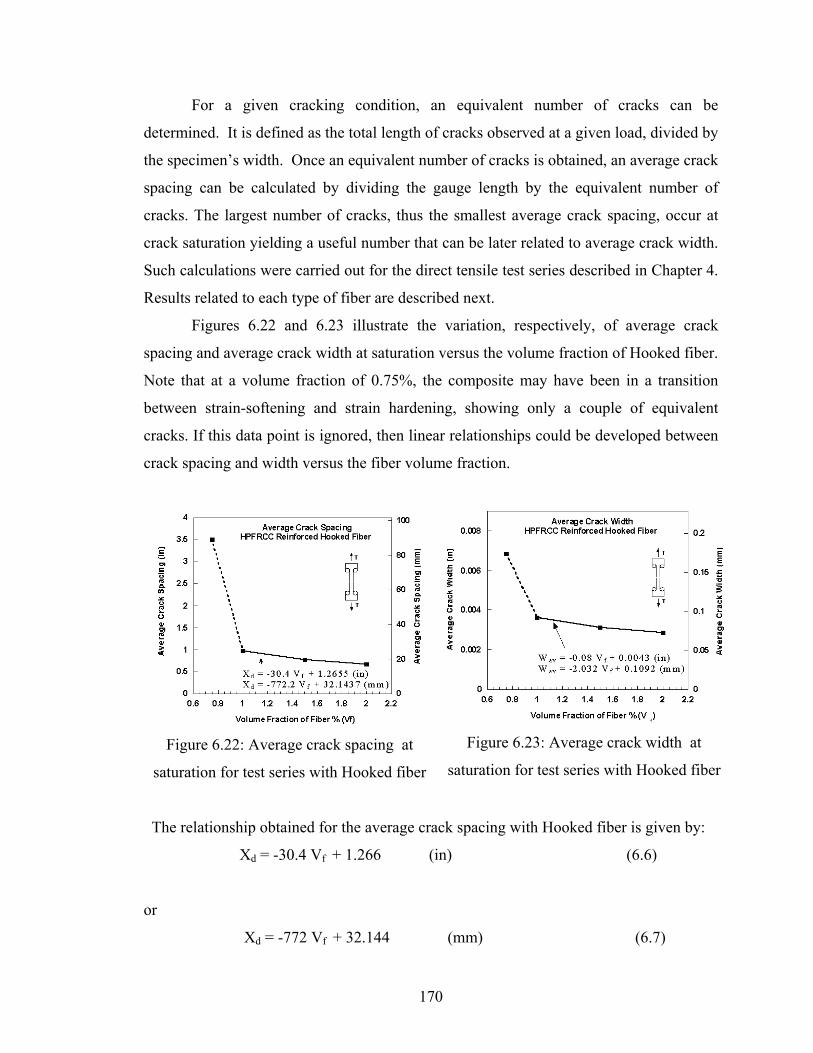
170
For a given cracking condition, an equivalent number of cracks can be
determined. It is defined as the total length of cracks observed at a given load, divided by
the specimen’s width. Once an equivalent number of cracks is obtained, an average crack
spacing can be calculated by dividing the gauge length by the equivalent number of
cracks. The largest number of cracks, thus the smallest average crack spacing, occur at
crack saturation yielding a useful number that can be later related to average crack width.
Such calculations were carried out for the direct tensile test series described in Chapter 4.
Results related to each type of fiber are described next.
Figures 6.22 and 6.23 illustrate the variation, respectively, of average crack
spacing and average crack width at saturation versus the volume fraction of Hooked fiber.
Note that at a volume fraction of 0.75%, the composite may have been in a transition
between strain-softening and strain hardening, showing only a couple of equivalent
cracks. If this data point is ignored, then linear relationships could be developed between
crack spacing and width versus the fiber volume fraction.
Figure 6.22: Average crack spacing at
saturation for test series with Hooked fiber
Figure 6.23: Average crack width at
saturation for test series with Hooked fiber
The relationship obtained for the average crack spacing with Hooked fiber is given by:
Xd = -30.4 Vf + 1.266 (in) (6.6)
or
Xd = -772 Vf + 32.144 (mm) (6.7)
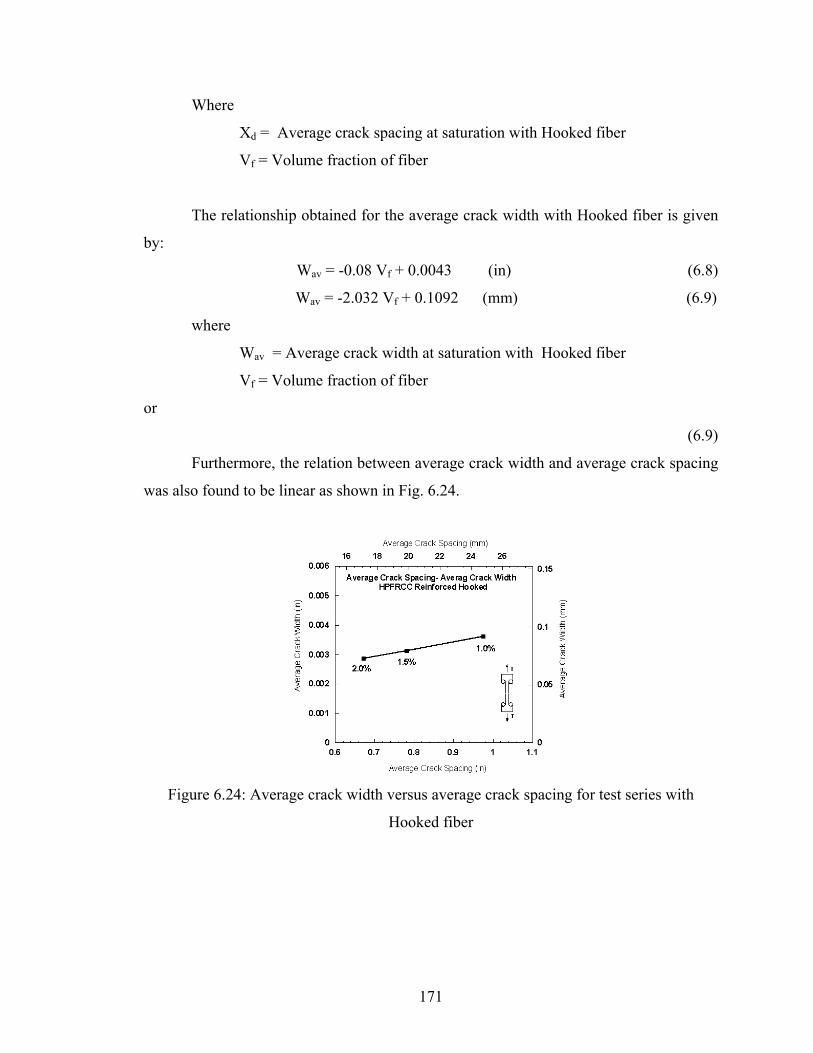
171
Where
Xd = Average crack spacing at saturation with Hooked fiber
Vf = Volume fraction of fiber
The relationship obtained for the average crack width with Hooked fiber is given
by:
Wav = -0.08 Vf + 0.0043 (in) (6.8)
Wav = -2.032 Vf + 0.1092 (mm) (6.9)
where
Wav = Average crack width at saturation with Hooked fiber
Vf = Volume fraction of fiber
or
(6.9)
Furthermore, the relation between average crack width and average crack spacing
was also found to be linear as shown in Fig. 6.24.
Figure 6.24: Average crack width versus average crack spacing for test series with
Hooked fiber
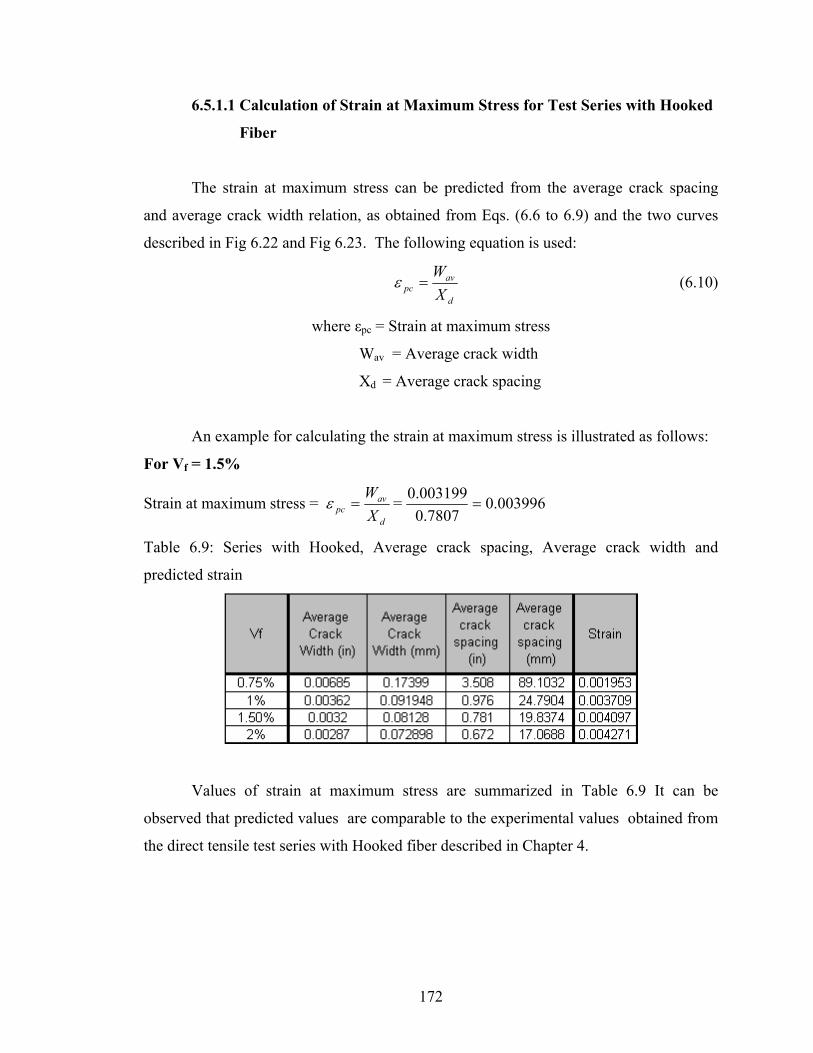
172
6.5.1.1 Calculation of Strain at Maximum Stress for Test Series with Hooked
Fiber
The strain at maximum stress can be predicted from the average crack spacing
and average crack width relation, as obtained from Eqs. (6.6 to 6.9) and the two curves
described in Fig 6.22 and Fig 6.23. The following equation is used:
d
avpc X
W=ε (6.10)
where εpc = Strain at maximum stress
Wav = Average crack width
Xd = Average crack spacing
An example for calculating the strain at maximum stress is illustrated as follows:
For Vf = 1.5%
Strain at maximum stress = d
avpc X
W=ε = 003996.0
7807.0003199.0
=
Table 6.9: Series with Hooked, Average crack spacing, Average crack width and
predicted strain
Values of strain at maximum stress are summarized in Table 6.9 It can be
observed that predicted values are comparable to the experimental values obtained from
the direct tensile test series with Hooked fiber described in Chapter 4.

173
6.5.2 Test Series with Torex Fiber
Multiple cracking in specimens with Torex fibers was extensive and the number
of cracks increased with the volume fraction of fiber as expected.
Figure 6.25: Crack formation under increasing load in test series reinforced with 1.5%
Torex steel fiber
Figure 6.25 illustrates the formation of cracks with increasing load up to
localization in a typical tensile specimen with Torex fiber.
Figures 6.26 and 6.27 illustrate the variation, respectively, of average crack
spacing and average crack width at saturation versus the volume fraction of Torex fiber.
These were obtained in a manner similar to that described above for the Hooked fiber.
Almost linear relationships are observed. Therefore linear equations were developed.

174
Figure 6.26: Average crack spacing at
saturation for test series with Torex fiber
Figure 6.27: Average crack width at
saturation for test series with Torex fiber
The relationship obtained for the average crack spacing with Torex fiber is given by:
Xd = -65.63 Vf + 1.61 (in) (6.11)
or
Xd = -1667 Vf + 40.87 (mm) (6.12)
where
Xd = Average crack spacing in test series reinforced with Torex fiber
Vf = Volume fraction of fiber
The relationship obtained for the average crack width with Torex fiber is given by:
Wav = -0.12 Vf + 0.0043 (in) (6.13)
where
or
Wav = -3.048 Vf + 0.1092 (mm) (6.14)
where
Wav = Average crack width in test series reinforced with Torex fiber
Vf = Volume fraction of fiber
Furthermore, the relation between average crack spacing and average crack width
is illustrated in Fig. 6.28.

175
Figure 6.28: Average crack width versus average crack spacing at saturation in tensile
test series with Torex fiber
6.5.2.1 Calculation of Strain at Maximum Stress for Test Series with Torex
Fiber
The strain at maximum stress can be predicted from the average crack spacing
and average crack width relation, as obtained from Eqs. (6.11 to 6.14) and the two curves
described in Fig. 6.26 and Fig. 6.27. The following equation is used:
d
avpc X
W=ε (6.15)
where εpc = Strain at maximum stress
Wav = Average crack width
Xd = Average crack spacing
An example for calculating the strain at maximum stress is illustrated as follows:
For Vf = 1.5%
Strain at maximum stress = d
avpc X
W=ε = 005417.0
4966.000269.0
=

176
Table 6.10: Series with Torex, Average crack spacing, Average crack width and
predicted strain
Values of strain at maximum stress are summarized in Table 6.10. It can be
observed that predicted values are comparable to the experimental values obtained from
the direct tensile test series with Torex fiber described in Chapter 4.
6.5.3 Test Series with Spectra Fiber
Figures 6.29 and 6.30 illustrate the variation, respectively, of average crack
spacing and average crack width at saturation versus the volume fraction of Spectra fiber.
These were obtained in a manner similar to that described above for the Hooked fiber.
Almost linear relationships are observed. Therefore linear equations were developed.
Figure 6.29: Average crack spacing at
saturation for test series with Spectra fiber
Figure 6.30: Average crack width at
saturation for test series with Spectra fiber

177
The relationship obtained for the average crack spacing with Spectra fiber is given by:
Xd = -30.5 Vf + 1.1 (in) (6.16)
or
Xd = -775 Vf + 27.9 (mm) (6.17)
where
Xd = Average crack spacing in test series reinforced with Spectra fiber
Vf = Volume fraction of fiber
The relationship obtained for the average crack width with Spectra fiber is given
by:
Wav = 0.52Vf + 0.0026 (in) (6.18)
or
Wav = 12.7432 Vf + 0.06604 (mm) (6.19)
where
Wav = Average crack width in test series reinforced with Spectra fiber
Vf = Volume fraction of fiber
Furthermore, the relation between average crack spacing and average crack width
is linear as illustrated in Fig. 6.31.
Figure 6.31: Average crack width versus average crack spacing at saturation in tensile
test series with Spectra fiber

178
6.5.3.1 Calculation of Strain at Maximum Stress for Test Series with Spectra
Fiber
Figure 6.32: Typical tensile specimens reinforced with Spectra fiber at the end of test
The strain at maximum stress can be predicted from the average crack spacing
and average crack width relation, as obtained from Eqs. (6.16 to 6.19) and the two curves
described in Fig. 6.29 and Fig. 6.30. The following equation is used:
d
avpc X
W=ε (6.20)
where εpc = Strain at maximum stress
Wav = Average crack width
Xd = Average crack spacing
An example for calculating the strain at maximum stress is illustrated as follows:
For Vf = 1.5%
Strain at maximum stress = d
avpc X
W=ε = 01597.0
6262.001.0
=

179
Table 6.11: Series with Spectra, Average crack spacing, Average crack width and
predicted strain
Values of strain at maximum stress are summarized in Table 6.11. It can be
observed that predicted values are comparable to the experimental values obtained from
the direct tensile test series with Torex fiber described in Chapter 4.
6.6 Modeling the Softening Response after Localization
The softening stage after localization requires special consideration. In this stage,
the elongation of a tensile specimen under load cannot be translated into a strain since it
represents the elongation of a single crack, the critical crack at localization. Therefore, a
relation between tensile stress and displacement (mainly due a single crack opening) is
applied.
Figure 6.33: Stress-displacement relation after localization

180
The post-localization stage involves the possible combination of fiber pulling out
of the matrix, fiber breaking, damage in the matrix around the critical zone, and reduction
of specimen cross-sectional area. In the experimental tests carried out in Chapters 4 and
5, the use of PVA fiber led to a very poor post-localization response. Fibers failed after a
relatively small crack opening. All the other fibers tested namely Hooked, Torex and
Spectra fibers pulled out from the critical section inducing various degrees of damage.
No fiber failure could be observed.
For a fiber pulling out from the matrix, the stress in the fiber can be computed
from the following equation assuming a circular fiber:
For a single aligned fiber:
)(4
00 uuL
d ef
−+=τ
σ (6.21)
For a randomly oriented fiber in space:
∫ ∫=
=1
2
1
0
)(cos)(),()(φ
φ
φφφφδδσeL
eef
f ddLpgLPAV
(6.22)
Figure 6.34: Localization-failure in test
series with PVA fiber
Figure 6.35: Fibers assumed to pull-out for
specimens with Hooked, Torex, and
Spectra fibers
Experimental studies on fiber reinforced cementitious composite have shown that

181
the post-peak displacement is essentially the result of the propagation-opening of the
localized crack along the notched section. The stress-displacement relationship in the
post peak region can then be evaluated as equivalent to the stress versus crack width,
assuming a single equivalent crack, with all fibers in a state of pull-out. The condition to
model is illustrated in Fig. 6.35, except that fibers are randomly oriented instead of being
aligned as shown. For specimens with a single crack having a width x, the load T at the
crack width x can be formulated as follows:
f
f
L
xL
DNLNDUT
2)2
( −==τπ
π (6.23)
where:
2
)2
( xL
L
f −= (6.24)
)
2(
)2
(
f
f
L
xL
NN
−= (6.25)
Where D = fiber diameter (assuming round fibers)
τ = average value of bond strength
T = load at the crack width x
L = average embedded length of the fibers at the crack width x
N = number of fibers having some embedded length at the crack width x
N = number of fibers located where crack width is zero
Lf = length of the fiber
From Eq. 6.23, 6.24, and 6.25 lead to the development of simplify equation,
(Kosa and Naaman, 1990). The relationship between the stress in the composite cracked
section and displacement (or crack opening) can be calculated as
2
max
)5.0
1(fL
x−=
σσ (6.26)

182
Equation (6.26) indicates that the stress becomes zero at a crack opening equal to
half the fiber length. This is theoretically correct, provided the bond remains constant
and no other deterioration occurs during pull-out. Otherwise, the stress may reach a zero
value as a crack opening smaller than half the fiber length. Kosa used a modifier K1 to
account for that effect, when his specimens were exposed to corrosion and the fibers
failed prior to complete pull-out.
Figure 6.36: Embedded length of aligned fibers bridging a crack
After extensive evaluation of Eq. (6.26) with the modifier K1using the test results
of this study, it was found that K1 was not sufficient to allow a full representation of the
stress versus displacement response; an additional parameter was needed to allow
modification of the curvature of the curve between the maximum stress and zero. After
several trials, an exponential term was added as a multiplier using a modifier K2. This
led to the development of the following equation:
xK
f
eLK
x22
1max
)5.0
1( −−=σσ (6.27)
where σ = stress at the crack width x
σmax = peak-stress
x = crack width
Lf = length of the fiber
K1 = modifier previously described with a value ranging from 0 to 1
K2 = modifier previously described.

183
With the parameters K1 and K2 Eq. (6.27) can account for several effects such as
partial fiber failure, bond decay, matrix damage, etc.
Using Eq. (6.27) to fit the average stress versus COD for the different test series
(Chapter 5) of this study leads to the best values of K1 and K2 given in Table 6.12.
Table 6.12: Value of parameters K1 and K2 for (Eq. 6.27)
Fiber
type PVA Spectra Hooked Torex
Vf K1 K2 K1 K2 K1 K2 K1 K2
0.75% 0.111 0 1 11.787 1 4.165 1 6.958
1.00% 0.085 0 1 10.354 1 2.791 1 3.413
1.50% 0.103 0 1 1.9 1 15.156 1 7.291
2.00% 0.131 0 1 1.774 1 15.839 1 5.45
Average 0.1075 0 1 6.45375 1 9.48775 1 5.778
K1Lf/2 represents the maximum displacement at which the load is equal to zero.
K2 allows to vary the slope of the normalized curves. It was analyzed from regression
analysis using an exponential function. Figure 6.36 shows the typical case for the series
with 2% Torex fibers. The three normalized curves are shown as well as the fitting curve
with K1 = 1 and K2 = 5.45; for comparison the fitting curve for K2 = 1 is also shown.
Usually, in test series reinforced with Torex, Spectra and Hooked fiber, no fiber
failure is observed and fibers pull-out to complete separation. K1 can thus be taken equal
to 1. However, for the test series with PVA fibers, fiber pull-out was not observed, and
extensive fiber failure occurred leading to a K1 value of 0.11 (Table 6.12). Then there
was no need to use K2 as the fit excellent. These two cases illustrate how flexible Eq.
(6.27) can be.
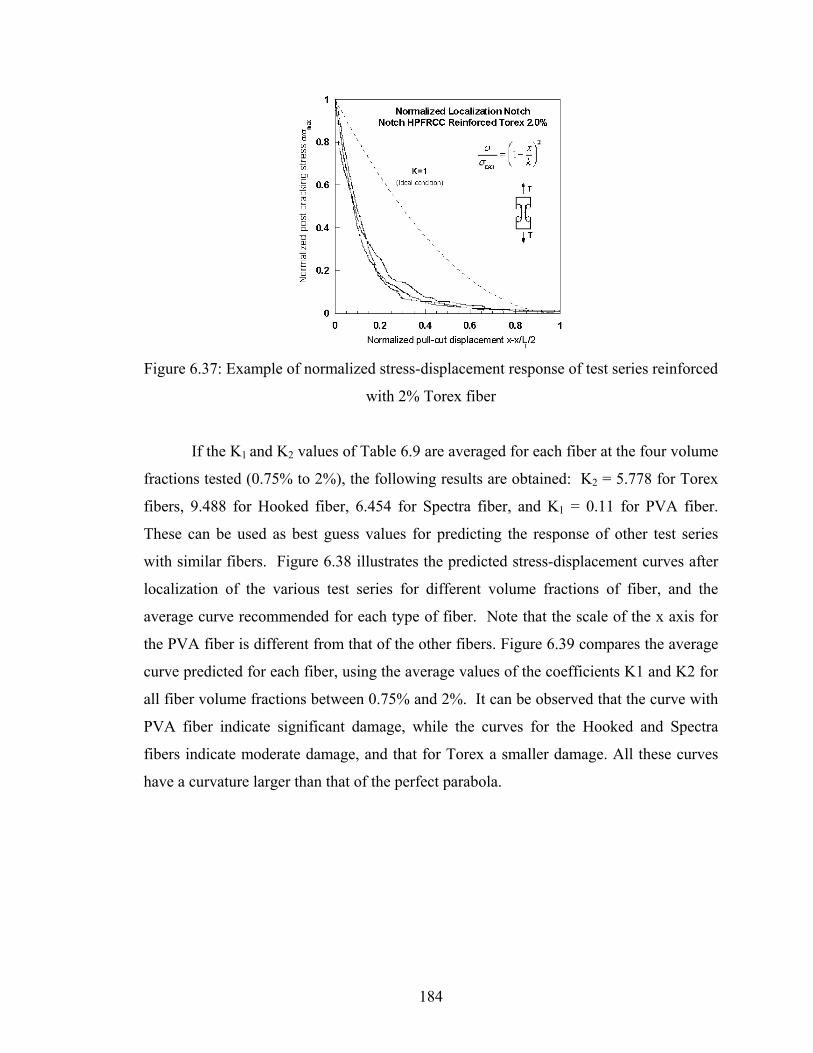
184
Figure 6.37: Example of normalized stress-displacement response of test series reinforced
with 2% Torex fiber
If the K1 and K2 values of Table 6.9 are averaged for each fiber at the four volume
fractions tested (0.75% to 2%), the following results are obtained: K2 = 5.778 for Torex
fibers, 9.488 for Hooked fiber, 6.454 for Spectra fiber, and K1 = 0.11 for PVA fiber.
These can be used as best guess values for predicting the response of other test series
with similar fibers. Figure 6.38 illustrates the predicted stress-displacement curves after
localization of the various test series for different volume fractions of fiber, and the
average curve recommended for each type of fiber. Note that the scale of the x axis for
the PVA fiber is different from that of the other fibers. Figure 6.39 compares the average
curve predicted for each fiber, using the average values of the coefficients K1 and K2 for
all fiber volume fractions between 0.75% and 2%. It can be observed that the curve with
PVA fiber indicate significant damage, while the curves for the Hooked and Spectra
fibers indicate moderate damage, and that for Torex a smaller damage. All these curves
have a curvature larger than that of the perfect parabola.

185
(a) (b)
(c)
(d)
Figure 6.38: Normalized curves after localization and their average for the test series
with: (a) PVA fiber, (b) Spectra fiber, (c) Hooked fiber, and (d) Torex fiber

186
Figure 6.39: Predicted average stress-displacement curves after localization for all test
series with notched specimens
6.7 Correlation between Direct Tensile Tests and Stress versus Crack
Opening Displacement Tests
Figure 6.40: Correlation between strain and maximum stress from a direct tensile test and
displacement at maximum stress from a notched prism test
The purpose of this section is to show that it is possible to correlate the strain at
maximum stress from a direct tensile test and the displacement a maximum stress from a
notched tensile prism test. This is achieved by estimating the equivalent number of

187
cracks that makes the composite look like a chain with a number of links (Fig. 6.40). An
energy approach will be used to estimate the number of cracks. The assumptions for
estimating the number of cracks, thus the average crack spacing are as follows.
Figure 6.41: Zone of cracking influence around
main crack
1. Any crack can become a
localized crack.
2. The energy consumed by the
crack, in the crack-opening
displacement experiment, is
the same as that consumed by
a crack in the tensile prism.
Figure 6.42: Correlation between “zone of cracking” from a stress-crack opening
displacement test and a direct tensile test (Dogbone test)
Let’s define Ene as the energy required to create a group of cracks in the notched
specimen around the influence zone up to crack saturation. This energy is assumed to
creat a group of craks as a cluster in a HPFRCC strain hardening material.
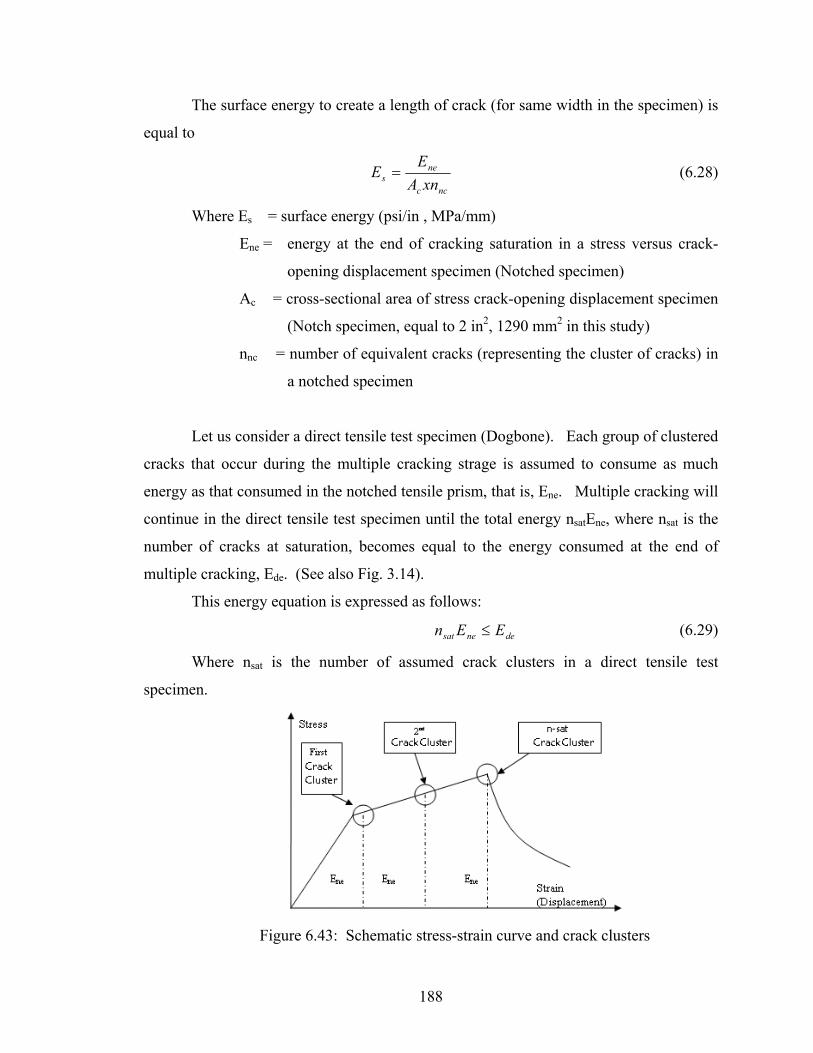
188
The surface energy to create a length of crack (for same width in the specimen) is
equal to
ncc
nes xnA
EE = (6.28)
Where Es = surface energy (psi/in , MPa/mm)
Ene = energy at the end of cracking saturation in a stress versus crack-
opening displacement specimen (Notched specimen)
Ac = cross-sectional area of stress crack-opening displacement specimen
(Notch specimen, equal to 2 in2, 1290 mm2 in this study)
nnc = number of equivalent cracks (representing the cluster of cracks) in
a notched specimen
Let us consider a direct tensile test specimen (Dogbone). Each group of clustered
cracks that occur during the multiple cracking strage is assumed to consume as much
energy as that consumed in the notched tensile prism, that is, Ene. Multiple cracking will
continue in the direct tensile test specimen until the total energy nsatEne, where nsat is the
number of cracks at saturation, becomes equal to the energy consumed at the end of
multiple cracking, Ede. (See also Fig. 3.14).
This energy equation is expressed as follows:
denesat EEn ≤ (6.29)
Where nsat is the number of assumed crack clusters in a direct tensile test
specimen.
Figure 6.43: Schematic stress-strain curve and crack clusters

189
Localization will occur when the energy required to open the critical crack is
smaller than the total energy required to create a new crack. So nsatEne cannot be higher
than Ede, thus
ne
desat E
En = (6.30)
If we assume that G is the gauge length of a given tensile prism (equal to 7 inches,
178 mm as used in the direct tensile tests described in Chapter 4), nnc = the number of
equivalent cracks in a notched specimen, then number of cracks in direct tensile specimen
(Dogbone specimen) at the saturated state, can be calculated by
Number of cracks ne
denc
EGEn
= (6.31)
(a) (b)
Figure 6.44: Definition of Ede ,Ene, Dde, and Dne
Results from direct tensile tests (Dogbone) and from the notched prism tests were
analyzed and correlated. A relation between the number of cracks, energy at the end of
the multiple cracking stage from the Direct tensile test (Ede), and energy at the end of the
cluster cracking stage of the Notched tensile test (Ene) was established.
Additionally, as a crack has two opposing surfaces, the stress versus crack

190
opening energy can be considered equal to twice the surface energy of out of the
composite, γc. Thus:
Ene= 2γc (6.32)
Where γc is the surface energy of the composite.
The surface energy of the composite γc can be taken equal to the sum of the pull-
out energy γp consumed by the fibers during pull-out, and the surface energy of the
matrix γm, that is:
γc = γp+ γm (6.33)
As the surface energy due to fiber pull-out is substantially larger than the surface
energy of the matrix, γm can be neglected and the value of γp can be used as a first
approximation to estimate the surface or fracture energy of the composite. Note that this
approach is justified since in all notched test series, except when PVA fibers were used,
general fiber pull-out was observed.
6.7.1 FRC Reinforced with PVA Fiber
Figure 6.45: Typical failure crack in a
tensile specimen reinforced with PVA
fiber
Figure 6.46: Cracking in a notched prism
with PVA fiber

191
If we take the energy absorption of the Direct tensile test series (Ede) and the
energy absorption of the Notched prism series (Ene) up to the maximum tensile stress
(area under the stress-strain orstress-displacement curve), and compare them together,
they are almost equal (Ede = Ene, Ede / Ene = 1). Figure 6.47 summarizes the results. They
suggest that only one single crack could be occurred. This is indeed what was observed as
shown in Figs. 6.45 and 6.46.
Vf PVA
(Ede/Ene)
0.75 0.8948
1 1.000735
1.5 0.999193
2 0.99551
PVA (Ede/Ene)
0.89481.0007 0.9992 0.9955
0
0.2
0.4
0.6
0.8
1
1.2
1.4
0.75 1 1.5 2Fiber volume fraction (%)
Ede /E
ne
Figure 6.47: Ede / Ene for test series with PVA fiber

192
6.7.2 HPFRCC Reinforced with Spectra Fiber
Figure 6.48: Typical failure crack in a
tensile specimen reinforced with Spectra
fiber test
Figure 6.49: Cracking in a notched prism
with Spectra fiber
Figures 6.48 and 6.49 show typical cracking in a direct tensile test specimen and
in a notched tensile prism, respectively. The length of total cracking in a notched prism
is calculated from photographic records and divided by the specimen’s width (2 in or
50.8 mm) to arrive at an equivalent number of cracks. This is called here a crack cluster
for the notched prism. Typical results, that is the equivalent number of cracks for a crack
cluster in a notched prism, are plotted in Fig. 6.50 for the different fiber volume fractions
tested. It can be observed, that the number of crack clusters ranged from 2.6 to 6.7
cracks, essentially increasing with the volume fraction of fiber up to 1.5% then tapering
off. Also, unlike notched specimens with a plain matrix where only one crack equivalent
is observed, the number of equivalent cracks here is significant. Note that in comparison,
only one crack equivalent was observed with PVA fiber.
The energy absorption of the Direct tensile test series (Ede) and the energy
absorption of the Notched prism series (Ene) up to the maximum tensile stress (area under

193
the stress-strain or stress-displacement curve), are calculated for the different volume
fractions of fibers. Figure 6.51 illustrates the variation of the ratio Ede/Ene for the different
volume fractions of fiber used. It can be observed that the ratio does not show any
particular trend and could be considered to remain about the same.
Vf
Number
of
Cracks
0.75 2.7 1 3.2
1.5 6.8 2 6.2
Number of Cracks in Notch HPFRCC reinforced Spectra
2.73.2
6.86.2
0
1
2
3
4
5
6
7
8
0.75 1 1.5 2Fiber volume fraction (%)
Num
ber o
f Cra
cks
Figure 6.50: Number of equivalent cracks in a cluster in notched test series with
Spectra fiber
Vf Spectra
(Ede/Ene)
0.75 2.916
1 3.449
1.5 2.711
2 2.860
Series of Spectra (Ede/Ene)
2.9163.449
2.711 2.860
00.5
11.5
22.5
33.5
44.5
5
0.75 1 1.5 2Fiber volume fraction (%)
Ede /E
ne
Figure 6.51: Ede / Ene for test series with Spectra fiber

194
By multiplying the number of equivalent cracks found in the Notch specimen for
a crack cluster by the energy ratio Ede / Ene, the number of cracks in the Direct tensile test
specimen can be determined. Predicted values are shown in Fig. 6.52 for the different
volume fractions of fiber tested and compared to experimental observations from
photographic records. As seen in Fig. 6.52, good agreement is observed.
Vf
Number
of Cracks
Predicted
0.75 7.8 1 10.9 1.5 18.3 2 17.8
HPFRCC Reinforced SpectraNumber of Cracks in Direct Tensile Specimen
7.1
10.9 11.213.3
7.8
11.0
18.3 17.8
0
5
10
15
20
0.75 1 1.5 2Volume Fraction of Fiber (%)
Experiment
Predict
Figure 6.52: Comparison of the number of cracks in direct tensile test series with
Spectra fiber (Dogbone test) obtained experimentally and estimated from the energy
method
6.7.3 HPFRCC Reinforced with Hooked Fiber
Figures 6.53 and 6.54 show typical cracking in a direct tensile test specimen and
in a notched tensile prism, respectively. The length of total cracking in a notched prism
is calculated from photographic records and divided by the specimen’s width (2 in or
50.8 mm) to arrive at an equivalent number of cracks. This is called here a crack cluster
for the notched prism. Typical results, that is the equivalent number of cracks for a crack
cluster in a notched prism, are plotted in Fig. 6.55 for the different fiber volume fractions
tested. It can be observed, that the number of crack clusters ranged from 2.7 to 6.2
cracks, essentially increasing with the volume fraction of fiber up to 1% then tapering off.
Here also, unlike notched specimens with a plain matrix where only one crack equivalent
is observed, the number of equivalent cracks is significant. Note that in comparison, only
one crack equivalent was observed with PVA fiber.

195
Figure 6.53: Typical failure crack in a
tensile specimen reinforced with Hooked
fiber
Figure 6.54: Cracking in a notched prism
with Hooked fiber

196
Vf
Number
of
Cracks
0.75 2.7 1 5.2
1.5 5.0 2 4.2
Number of Cracks in Notch HPFRCC reinforced Hooked
2.7
5.2 5.04.2
0
1
2
3
4
5
6
7
0.75 1 1.5 2Fiber volume fraction (%)
Num
ber o
f Cra
cks
Figure 6.55: Number of equivalent cracks in a cluster in notched test series with
Hooked fiber
The energy absorption of the Direct tensile test series (Ede) and the energy
absorption of the Notched prism series (Ene) up to the maximum tensile stress (area under
the stress-strain or stress-displacement curve), are calculated for the different volume
fractions of fibers. Figure 6.56 illustrates the variation of the ratio Ede/Ene for the different
volume fractions of fiber used. It can be observed that the ratio can be considered to
increase with the volume fraction of fiber.

197
Series of Hooked (Ede/Ene)
0.615
1.7231.472
2.189
0
0.5
1
1.5
2
2.5
3
0.75 1 1.5 2Fiber volume fraction (%)
Ede /E
neFigure 6.56: Ede / Ene for test series with Hooked fiber
By multiplying the number of equivalent cracks found in the Notch specimen for
a crack cluster by the energy ratio Ede / Ene, the number of cracks in the Direct tensile test
specimen can be determined. Predicted values are shown in Fig. 6.57 for the different
volume frations of fiber tested and compared to experimental observations from
photographic records. As seen in Fig. 6.57, very good agreement is observed.
Vf Hooked
0.75 1.7
1 8.9
1.5 7.3
2 9.2
HPFRCC Reinforced HookedNumber of Cracks in Direct Tensile Specimen
2.0
7.2
9.0
10.4
1.7
8.9
7.3
9.2
0
2
4
6
8
10
12
0.75 1 1.5 2Volume Fraction of Fiber (%)
Experiment
Predict
Figure 6.57: Comparison of the number of cracks in direct tensile test series with
Hooked fiber (Dogbone test) obtained experimentally and estimated from the energy
method

198
6.7.4 HPFRCC Reinforced with Torex Fiber
Figures 6.58 and 6.59 show typical cracking in a direct tensile test specimen and
in a notched tensile prism, respectively. The length of total cracking in a notched prism
is calculated from photographic records and divided by the specimen’s width (2 in or
50.8 mm) to arrive at an equivalent number of cracks. This is called here a crack cluster
for the notched prism. Typical results, that is, the equivalent number of cracks for a
crack cluster in a notched prism, are plotted in Fig. 6.60 for the different fiber volume
fractions tested. It can be observed, that the number of crack clusters was consistently
high at all values of Vf with an average of 5 cracks.
Figure 6.58: Typical failure crack in a
tensile specimen reinforced with Torex fiber
Figure 6.59: Cracking in a notched prism
with Torex fiber

199
Vf
Number
of
Cracks
0.75 5.9 1 5.0
1.5 5.8 2 4.1
Number of Cracks in Notch HPFRCC reinforced Torex
5.9
5.05.8
4.1
0
1
2
3
4
5
6
7
0.75 1 1.5 2Fiber volume fraction (%)
Num
ber o
f Cra
cks
Figure 6.60: Number of equivalent cracks in a cluster in notched test series with Torex
fiber
The energy absorption of the Direct tensile test series (Ede) and the energy
absorption of the Notched prism series (Ene) up to the maximum tensile stress (area under
the stress-strain or stress-displacement curve), are calculated for the different volume
fractions of fibers. Figure 6.61 illustrates the variation of the ratio Ede/Ene for the different
volume fractions of fiber used. It can be observed that the ratio can be considered to
increase with the volume fraction of fiber.
Series of Torex (Ede/Ene)
1.099 0.864
3.908
4.833
0
1
2
3
4
5
6
0.75 1 1.5 2Fiber volume fraction (%)
Ede /E
ne
Figure 6.61: Ede / Ene for test series with Torex fiber

200
By multiplying the number of equivalent cracks found in the Notch specimen for
a crack cluster by the energy ratio Ede / Ene, the number of cracks in the Direct tensile test
specimen can be determined. Predicted values are shown in Fig. 6.62 for the different
volume fractions of fiber tested and compared to experimental observations from
photographic records. Reasonably good agreement is observed.
Vf Torex
0.75 6.5 1 4.3
1.5 22.7 2 19.8
HPFRCC Reinforced TorexNumber of Cracks in Direct Tensile Specimen
6.3 6.9
14.1
19.4
6.54.3
22.719.8
0
5
10
15
20
25
0.75 1 1.5 2Volume Fraction of Fiber (%)
Experiment
Predict
Figure 6.62: Comparison of the number of cracks in direct tensile test series with Torex
fiber (Dogbone test) obtained experimentally and estimated from the energy method
Table 6.13: Surface energy and area under the curve obtained from tests (US-units)

201
Table 6.14: Surface energy and area under the curve obtained from tests (SI-units)
Table 6.15: Energy ratio and influence unit /length of crack-opening displacement test
6.8 Outline of Stress-Strain Computations
The proposed stress-strain and stress-displacement computational method is
presented in four steps (Fig. 6.63). The first step is to find the main three unknown
parameters (ultimate strain, first cracking stress and ultimate stress). The second step is to
calculate the crack spacing and crack spacing at saturation. The third step is to obtain the
crack opening from COD (Notched prism test).
Finally, the forth step illustrates by example a method to calculate the strain at
post cracking (εp) and the strain at maximum stress (εpc) as well as the displacement at the
localization stage based on the linking assumption.
An example of verification of the proposed model using a composite reinforced
with 1.5% Torex 1.5% is presented in Section 6.9.

202
Figure 6.63: Flowchart of proposed post-cracking model

203
6.9 Verification of the Model 6.9.1 Tensile Specimen with Torex Fiber
The purpose of this section is to apply the tensile stress-strain model using
information obtained from this research. For this a typical composite reinforced with
1.5% Torex fiber is considered.
Material properties: σmu = 1.252 MPa, τ = 6.84 MPa, L/d = 100 , Vf = 1.5%, Ec =
13890 MPa
From Fig. 6.10: α1 α2 = 0.0937
Thus:
σcc = σmu (1-Vf) + α1 α2 τ Vf L / d
= 1.252 x (1-0.015) + 0.0937 x 6.84 x 0.015 x 100
= 1.233 + 0.961
= 2.194 MPa
εcc = c
cc
Eσ
= 410579.113890
194.2 −= x
From Eq. (6.6): 971.0601.26 +−= fpc Vλ
λpc = -26.601 x 0.015 + 0.971
= 0.572
σpc = λpc τ Vf L/d
= 0.5724 x 6.84 x 0.015 x 100
= 5.872 MPa

204
Find εpc: Xd = -1667 Vf + 40.873 (6.12)
= -1667 x 0.015 +40.873
= 15.86 mm
Wav = -3.05 Vf + 0.1092 (6.14)
= -3.05 x 0.015 +0.1092
= 0.0635 mm
d
avpc X
W=ε (6.10)
869.15
0635.0=
= 0.004 Response curve after localization
xK
f
eLK
x22
1max
)5.0
1( −−=σσ (6.27)
From Table 6.12, K1 = 1, K2 = 5.778 (Average)
Gauge length = 7 inches, 177.8 mm, Fiber length = 30 mm, σmax = 5.873 MPa Table 6.16: Computations of stresses and displacements for the example specimen

205
Figure 6.64: Comparison of predicted versus experimental stress-strain curve
6.9.2 Other Model Predictions
The above developed model was systematically applied to the different tensile test
series experimentally tested in this research. The predicted tensile stress-strain response
was simplified to getting the first cracking point, the maximum post-cracking or ultimate
point, and the softening branch after localization. The numerical results obtained are
summarized in Table 6.17. The results are plotted in Figs. 6.65 to 6.71 and are self
explanatory. They could be compared to the experimental curves described in Chapters 4
and 5. Note that a range of values is shown for the ultimate point (maximum stress point)
to illustrate the influence of the volume fraction of fiber from 0.75% to 2%.

206
Figure 6.65: Schematic stress-strain response of FRC reinforced with PVA fiber (Direct tensile test)
Figure 6.66: Schematic stress-displacement response of FRC reinforced with PVA fiber
(Notch tensile test)

207
Figure 6.67: Schematic stress-strain response of FRC reinforced with Spectra fiber
(Direct tensile test)
Figure 6.68: Schematic stress-strain response of FRC reinforced with Hooked fiber
(Direct tensile test)

208
Figure 6.69: Schematic stress-displacement response of FRC reinforced with Hooked
fiber (Notch tensile test)
Figure 6.70: Schematic stress-strain response of FRC reinforced with Torex fiber
(Direct tensile test)

209
Figure 6.71: Schematic stress-displacement response of FRC reinforced with Torex fiber (Notch tensile test)
Table 6.17: Summary of computations for the stress-strain curves of HPFRCC tensile specimens (a, b, c, d, e, f) First Cracking Stress σcc = σmu (1-Vf) + α1 α2 τ Vf L / d (6.1) (a) Fiber First Cracking Stress PVA α1 α2 = 0.5204 :Ranged 0.75%-2.0%
Spectra α1 α2 = 0.0.0424 :Ranged 1.0% - 2.0%
Hooked α1 α2 = 0.2947 :Ranged 1.0% - 2.0%
Torex 0937.021 =αα :Ranged 1.0%% - 2.0%

210
Maximum Stress σpc = λpc τ Vf L/d (6.2) (b) Fiber Maximum Stress PVA 0933.27074.0 +−= fpc Vλ :Ranged 0.75%-2.0% (6.34)
Spectra 6271.0799.20 +−= fpc Vλ :Ranged 0.75%-2.0% (6.3)
Hooked 5836.2554.55 +−= fpc Vλ :Ranged 1.0%-2.0% (6.4)
Torex 9714.0601.26 +−= fpc Vλ :Ranged 0.75%-2.0% (6.5)
Crack spacing (US-units, in) (c) Fiber Average Crack Spacing Spectra Xd = -30.504 Vf + 1.0972 :Ranged 0.75% - 2.0% (6.16)
Hooked Xd = -30.4 Vf + 1.2655 :Ranged 1.0% - 2.0% (6.6)
Torex Xd = -65.63 Vf + 1.6092 :Ranged 0.75% - 2.0% (6.11)

211
Crack spacing (SI-units, mm) (d) Fiber Average Crack Spacing Spectra Xd = -774.802 Vf + 27.8689 :Ranged 0.75% - 2.0% (6.17)
Hooked Xd = -772.2 Vf + 32.1437 :Ranged 1.0% - 2.0% (6.7)
Torex Xd = -1667 Vf + 40.8737 :Ranged 0.75% - 2.0% (6.12)
Crack Width (US-units, in) (e) Fiber Average Crack Width Spectra Wav = 0.5017 Vf + 0.0026 :Ranged 0.75%-2.0% (6.18)
Hooked Wav = -0.08 Vf + 0.0043 :Ranged 1.0%-2.0% (6.8)
Torex Wav = -0.12 Vf + 0.0043 :Ranged 0.75%-2.0% (6.13)
Crack Width (SI-units, mm) (f) Fiber Average Crack Width Spectra Wav = 12.7432 Vf + 0.06604 :Ranged 0.75%-2.0% (6.19)
Hooked Wav = -2.032 Vf + 0.1092 :Ranged 1.0%-2.0% (6.9)
Torex Wav = -3.05 Vf + 0.1092 :Ranged 0.75%-2.0% (6.14)

212
6.10 Concluding Remarks
A model based on a combination of composite mechanics and experimental
observations to predict the stress-strain response of fiber reinforced cement composites in
the post-cracking state, and particularly the multiple cracking stage was developed. The
influence of various parameters was investigated. Good agreement was found between
the model predictions for stress-strain relation and experimental results. The following
conclusions are drawn.
1. Predictive equation derived from mechanics of composites was used for the stress
at first cracking and the maximum post-cracking stress. From the experimental
results obtained, prediction equations were suggested for the coefficients in these
equations
2. Predictions equations for average crack spacing and average crack width for
HPFRCC tensile specimens reinforced with Spectra, Hooked, and Torex fibers
were derived based on experimental observations.
3. A method to predict the strain at maximum stress, from crack width and crack
spacing is suggested. A analytical equation was developed to predict the response
of the composite in tension after localization. The equation depends on two
parameters only, and allows to simulate damage as well as variable curvature in
the shape of the curve. The model produced good approximation of the
localization behavior obtained experimentally.
4. A correlation between the direct tensile test (Dogbone test) and stress-crack
opening displacement test (Notch test) was established. The proposed method was
found to have a good agreement between prediction and experiment.

213
Initial stage Stress = 0 psi Displacement = 0 in Initiation of first crack Stress = 295.97 psi Displacement = 0.000533 in Expanding of first crack Stress = 661.038 psi Displacement = 0.002135 in Maximum stress Stress = 781.7 psi Displacement = 0.00979 in Localization Stress = 688.265 psi Displacmen = 0.0196 in
Figure 6.72: Crack formation under increasing load in test series reinforced with 0.75% Torex steel fiber (Notch test)

214
CHAPTER 7
TENSILE VARIABILITY OF FIBER REINFORCED CEMENTITOUS MATERIALS
7.1 Introduction
The design of structures composed of fiber reinforced material should be based on
the statistical consideration of FRCC properties. This chapter is therefore dedicated to a
discussion of the observed statistical variability in HPFRCC response. The parameters
considered include toughness, tensile strength (σpc), energy, ductility, and strain at
maximum stress (εpc).
Generally, the variability of HPFRCC response is strongly influenced by the
fabrication process, sampling, and testing. Geometry of the fiber in relation to the mould
size causes preferred orientation of the fibers near the surface of the mould, which is
different from that in the body of the composite. The orientations within the mass of the
composite depend on many factors such as the method of placing, flow characteristics of
the mortar and fiber, and the type and degree of compaction. There are other factors that
tend to increase the statistical variations in the properties of fiber-reinforced cement
composites. These factors include
1. variations in the concentration of fibers at different locations inside the matrix;
2. variability in the interfacial bond properties;
3. relatively low workability (compatibility) of fibrous composites in some mixes,
which may leave a system of entrapped air with different local concentrations
inside the mix.

215
Swamy and Stavirdes reported the results of a study on statistical variations in the
flexural toughness of steel fiber reinforced concrete. This study was based on limited test
results and indicated relatively large variations in toughness. They noticed that flexural
toughness could not be correlated to flexural strength. In their test results, the relatively
large variations in flexural toughness were attributed to high variability in the fiber
debonding process in steel fiber reinforced concrete (which determines toughness
characteristics).
In the test results reported in this chapter, the coefficient of variation for steel
fiber concrete within a batch and between batches was well below the 5% confidence
level and of the same order as those obtained for plain concrete. It was therefore possible
to conclude that in steel fiber reinforced concrete, where good quality control is exercised
throughout fabrication, the number of test specimens for obtaining a reliable average
need to be no more than that required for plain concrete. Additionally, it was indicated by
Swamy and Stavirdes that the slight increase observed in compressive strength in the
presence of steel fibers is insignificant in light of the random variations in test results.
Statistical Parameters
The normal distribution, also known as the Gaussian distribution, has a
probability density function given by
⎥⎥⎦
⎤
⎢⎢⎣
⎡⎟⎠⎞
⎜⎝⎛ −
−=2
21exp
21)(
σμ
πσxxf x ∞<<∞− x (7.1)
where μ and σ are the parameters of the distribution, which are also the mean and
standard deviation, respectively, of the distribution. Figure 7.1 and 7.2 show the effects of
μ and σ on the probability density function and cumulative distribution function.

216
Figure 7.1: Probability density function
with different μ and σ Figure 7.2: Cumulative distribution
function
The coefficient of variation (COV) is a normalized measure of dispersion of a
probability distribution. It is defined as the ratio of the standard deviation to the mean.
σμ
=COV (7.2)
The confidence interval is an interval estimate of a sample parameter. Instead of
estimating the parameter by a single value, an interval likely includes the parameter as
stated. How likely the interval is to contain the parameter is determined by the confidence
level. Increasing the confidence level will widen the confidence interval. In contrast,
decreasing the confidence level will narrow the confidence interval.
Figure 7.3: 95% Confidence interval in normal distribution
The goodness of fit of a statistical model describes how well it fits a set of
observations. Measures of goodness-of-fit typically summarize the discrepancy between
observed values and the values expected under the model in question. Such measures can
be used in statistical hypothesis testing, e.g. to test for normality of residuals. In this
work, three fitting test were used, Cramer-von Mises test, Watson, and Anderson-Darling
test.

217
Six series were considered in this study, including specimens reinforced Spectra
2.0%, 1.5%, specimen reinforced Hooked 2.0%, 1.5%, and specimen reinforced Torex
2.0%, 1.5%. The number of specimens per series ranged from 13 to 28 specimens. A total
of 120 samples were employed in this analysis. The significant parameters considered are
maximum stress, strain at maximum stress, strain at the end of multiple cracking stage,
energy at maximum stress, and energy at the end of multiple cracking stage. A summary
of the statistical analysis conducted is displayed in Table 7.1. The toughness parameter
(ductility) is defined as the area under the curves, up to localization as displayed in Fig.
7.4. Since, in the case of HPFRCC reinforced Spectra, the influence of the multiple
cracking area is large and dominates the localization behave ior, the energy at the end of
multiple cracking stage was used as a representation for toughness.
Figure 7.4: Energy at localization start: area under the curve, toughness
Figure 7.5: Multiple cracking stage in notch HPFRCC reinforced Spectra fiber

218
Table 7.1: Diagram for analysis of tensile histogram and normal probability curve
7.2 Confidence Interval (CI)
The CI can be used to describe how reliable HPFRCC tensile results are. For a set
of test results, the outcome of the maximum tensile stress might be 95% of maximum
stress in a certain direct tensile test in each series. A 95% confidence interval implies that
the results have a probability of occurrence ranging 2.5% to 97.5%. All other things
being equal, a survey result with a small CI is more reliable than a result with a large CI.
(a) (b)
Figure 7.6: (a) Direct tensile curve of HPFRCC reinforced Torex 1.5% and (b) its
corresponding confidence interval

219
(a) (b)
Figure 7.7: (a) Direct tensile curve of HPFRCC reinforced Torex 2.0% and (b) its
corresponding confidence interval
(a) (b)
Figure 7.8: (a) Direct tensile curve of HPFRCC reinforced Hooked 1.5% and (b) its
corresponding confidence interval

220
(a) (b)
Figure 7.9: (a) Direct tensile curve of HPFRCC reinforced Hooked 2.0% and (b) its
corresponding confidence interval
The confidence interval curves for 95 percent are displayed in Fig. 7.6 to Fig. 7.9
for HPFRCC reinforced Hooked and Torex, at Vf of 1.5% and 2.0%. More variation
represents a large area of variability in any testing range. The widest range of confidence
interval is for maximum stress, for 2.0% specimen reinforced Hooked. In this case, the
upper bound is 1276 psi (8.798 MPa), while the lower bound is 372 psi (2.565 MPa). The
difference between both bounds is 343 percent of the lower bound.
7.3 Coefficient of Variation (COV) Analysis
This section discusses the COV in the statistical data. Specimen reinforced with
PVA and Spectra at volume fraction of 0.75% were not included in this analysis since the
number of specimen is insufficient.

221
Figure 7.10: Coefficient of variation, maximum stress
Figure 7.10 presents the coefficient of variation for maximum stress. From the
graph, the coefficient of variation increases with increase in volume fraction of fiber,
except in the case of HPFRCC Reinforced Torex, where COV appear to be about
constant. Overall, the coefficient of variation ranged from 11.32% in HPFRCC reinforced
Hooked 0.75% to 32.48% in HPFRCC reinforced Hooked 2.0%. The average COV of
HPFRCC reinforced Spectra, is 20.48%, COV of HPFRCC reinforced Hooked is 19.62%,
and HPFRCC reinforced Torex is 18.51%
Figure 7.11: Coefficient of variation, energy at maximum stress

222
Figure 7.11 presents the coefficient of variation of toughness (energy at maximum
stress). The value ranges from 33.86% in HPFRCC reinforced Torex 2.0% to 78.96% in
HPFRCC reinforced Hooked 1.0%. In HPFRCC reinforced Hooked, when volume
fraction of fiber increase, the coefficient of variation increase. However, in HPFRCC
reinforced Torex, increasing the volume fraction of fiber leads to decrease in coefficient
of variation. Spectra fiber does not see much change in terms of variability, is in the
range of 60 percent. The average COV of HPFRCC reinforced Spectra, is 58%, COV of
HPFRCC reinforced Hooked is 63%, and HPFRCC reinforced Torex is 52%
Figure 7.12: Coefficient of variation, strain at maximum stress
The observed coefficient of variation for the strain at maximum stress is presented
in Fig 7.12. From this figure, it can be seen that the coefficient of variation ranged from
28% for HPFRCC reinforced Torex 2.0% to 85% in HPFRCC reinforced Hooked 1.0%.
It is clear that the coefficient of variation of strain at maximum stress is not dependent on
the volume fraction of fiber. The average COV of HPFRCC reinforced Spectra is 45%,
The average COV of HPFRCC reinforced Hooked is 60%, and also the average
coefficient of Torex is 38%.

223
Coefficient of Variation (COV)
20.5
58.8
44.5
19.6
63.060.1
18.5
52.3
37.6
52.08
68.41
00
10
20
30
40
50
60
70
80
1 2 3
Spectra
HookedTorex
Mortar (No fiber)
COV (%)
Maximum Stress Strain at Maximum stress Toughness
Figure 7.13: Comparison of coefficient of variation with different fiber types
Figure 7.13, compares the COV for the maximum stress, strain at maximum
stress, and toughness for all series. Clearly the variation in maximum stress is least
(average less than 20%) of the 3 parameter considered. It is also evident that adding fiber
increased the variability in maximum stress of the mortar, which is higher than that for
the HPFRCC specimens (52% versus and average of 20% for unreinforced specimens).
The strain of maximum stress has a high COV, while the COV for the toughness is
moderate. In addition to this, comparing by type of fiber (Spectra, Hooked and Torex),
the HPFRCC reinforced Torex, the coefficient of variation is lowest, while HPFRCC
reinforced Spectra and Hooked, the results are higher.
7.4 Goodness-of-Fit
Table 7.2 illustrates the goodness-to-fit test of normal probability of the data
considered in this thesis. In the results, a majority of the investigated parameters can pass
95% level of confidence for the normality test. Table 7.3 and 7.4 present a list of the
average tensile test results for HPFRCC specimens. In some cases, the number of

224
specimens is too low to be investigated. In order to analyze statistical parameters, at least
13 specimens are required, therefore the specimen in series of Spectra 1.5% and 2.0%,
Hooked 1.5% and 2.0%, Torex 1.5% and 2.0% were examined.
Table 7.2: Normality test results at 95% confidence level
Maximum stress, strain at maximum stress, energy at maximum stress (Torex and
Hooked), and energy at the end of multiple cracking stage (Spectra) are mechanical
properties of HPFRCC that were statistically analyzed in this investigation. The
distribution of all the sets of results is represented graphically by using a histogram.
Figure 7.16 to 7.33 shows the distribution of the maximum tensile stress, strain at the end
of multiple cracking stage, strain at maximum stress, energy at the end of multiple
cracking stage (Spectra), and energy at maximum stress (Torex and Hooked) of tensile
experiments. The histograms give an idea of the scatter of the results; whereas the
cumulative diagrams give the probability of results being below any given value.

225
The normal probability curves (Gaussian distribution curves) superimposed on all
the histograms were obtained by using the means and standard deviations for all the sets
of results. The height of the frequency distribution curve was computed by Statistica
software, adjusted to fit the conditions of each set of results. The normal probability
curves have also been drawn on normal probability paper as shown in this chapter in
which they appear as straight lines. In some series, departures from normal distribution
were detected. Following is a detailed discussion of the statistical data for the parameters
of interest.
Table 7.3: Statistical parameters of HPFRCC specimens (US-units)

226
Table 7.4: Statistical parameters of HPFRCC specimens (SI-units)

227
Maximum Tensile Strength – HPFRCC Reinforced Spectra 1.5%
(a) (b)
(c)
Figure 7.14: (a) Distribution of maximum stress, (b) cumulative histogram, and (c)
normal probability plot for HPFRCC reinforced Spectra 1.5%
The sample mean of these measurements is 402 psi (2.77 MPa), the standard
deviation is 89.18 psi (0.615 MPa), and the coefficient of variation is 22 percent. The 95
percent Confidence Interval regarding the mean is 227 psi (1.57 MPa) to 576 psi (3.97
MPa). The goodness-to-fit tests confirmed the normality of the sample distribution for
tensile strength test results at a 95 percent Confidence Interval. The distribution of the
results is shown in Fig. 7.14 and the normal curve overlapping the histogram presents an

228
indication of the normality of sample distribution. Figure 7.14-c shows the normal
probability plot of the tensile strength test results. This figure indicates that about 70
percent of the results are above 450 psi (3.103 MPa), and above 90 percent are above 550
psi (3.792 MPa). The cumulative distribution of the measurements is close to a straight
line, which further supports the conclusion that maximum tensile strength test results are
normally distributed.
(a) (b)
(c)
Figure 7.15: (a) Distribution of energy at the end of multiple cracking stage,
(b) cumulative histogram, and (c) normal probability plot for HPFRCC reinforced
Spectra 1.5%

229
Tensile Toughness – HPFRCC Reinforced Spectra 1.5%
The sample means of tensile toughness (energy at the end of multiple cracking
stage), was 5.96 psi, (0.041 MPa) and the corresponding standard deviations were 4.05
psi (0.028 MPa). The coefficient of variation was 68.03 percent and the 95 percent
Confidence Interval was certainly not greater than 13.9 psi (0.096 MPa). The normal
probability plot shown in figure 7.15-c shows that the test data does not fit a straight line,
indicating a deviation from normal distribution.
Strain at the End of Multiple Cracking Stage – HPFRCC Reinforced Spectra 1.5%
(a)
(b)
(c)
Figure 7.16: (a) Distribution of strain at the end of multiple cracking stage,
(b) cumulative histogram, and (c) normal probability plot for HPFRCC reinforced
Spectra 1.5%
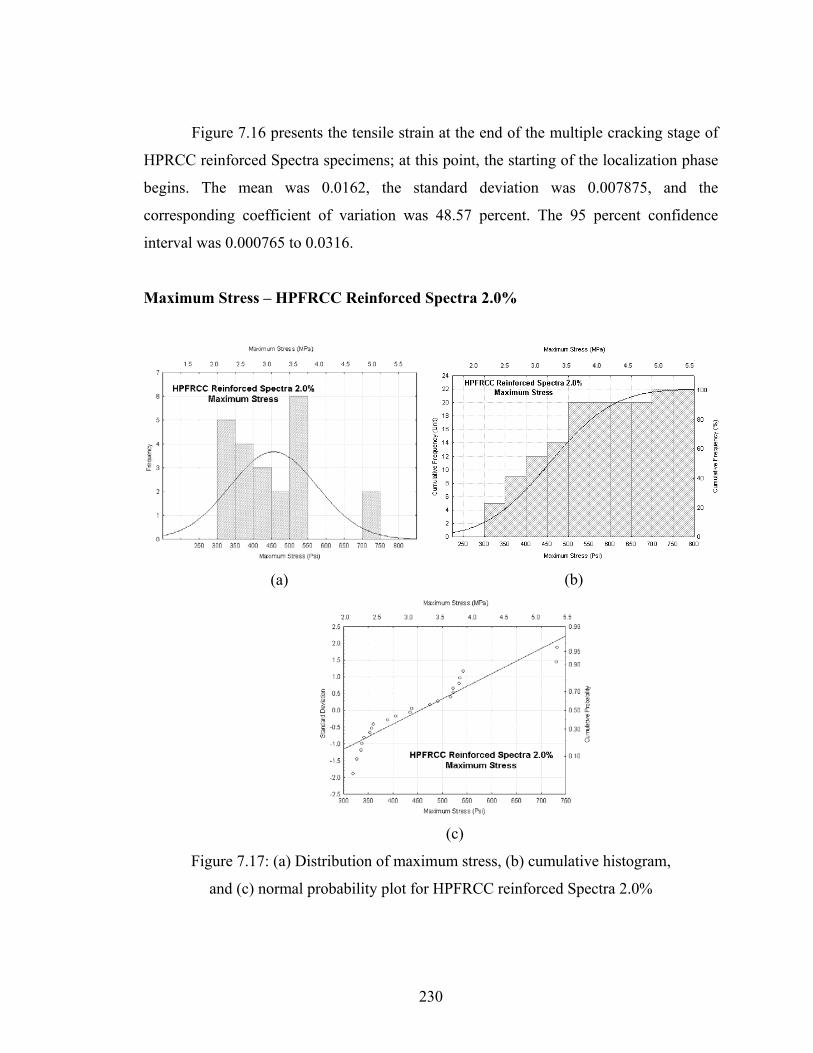
230
Figure 7.16 presents the tensile strain at the end of the multiple cracking stage of
HPRCC reinforced Spectra specimens; at this point, the starting of the localization phase
begins. The mean was 0.0162, the standard deviation was 0.007875, and the
corresponding coefficient of variation was 48.57 percent. The 95 percent confidence
interval was 0.000765 to 0.0316.
Maximum Stress – HPFRCC Reinforced Spectra 2.0%
(a) (b)
(c)
Figure 7.17: (a) Distribution of maximum stress, (b) cumulative histogram,
and (c) normal probability plot for HPFRCC reinforced Spectra 2.0%

231
The sample mean of these measurements is 466.13 psi (3.214 MPa), the standard
deviation is 123.93 psi (0.854 MPa), and the coefficient of variation is 26.59 percent. The
95 percent confidence interval with respect to the mean is 223 psi (1.538 MPa) to 709 psi
(4.888 MPa).
The normal probability plot shown in figure 7.17-c, shows that the test data do not
fit a straight line, indicating a deviation from normal distribution. The goodness-to fit
tests confirmed at a 95 percent confidence interval, the distribution is not normal.
Tensile Toughness – HPFRCC Reinforced Spectra 2.0%
(a)
(b)
(c)
Figure 7.18: (a) Distribution of energy at the end of multiple cracking stage,
(b) cumulative histogram, and (c) normal probability plot for HPFRCC reinforced
Spectra 2.0%

232
The sample means was 5.97 psi (0.041 MPa), and the corresponding standard
deviation was 3.37 psi (0.023 MPa). The coefficient of variation was 56.51 percent, while
the 95 percent confidence interval was not more than 12.58 psi (0.087 MPa). The normal
probability plot shown in figure 7.18-c, shows that the test data does not fit a straight line,
indicating a deviation from normal distribution.
Strain at Maximum Stress – HPFRCC Reinforced Spectra 2.0%
(a) (b)
(c)
Figure 7.19: (a) Distribution of strain at the end of multiple cracking stage,
(b) cumulative histogram, and (c) normal probability plot for HPFRCC reinforced
Spectra 2.0%

233
Figure 7.19 presents the tensile strain at the end of the multiple cracking stage of
HPRCC reinforced Spectra specimens, starting at the localization phase. The mean was
0.0143 and the corresponding coefficient of variation was 40.35 percent. The standard
variation was 0.004171, while the 95 percent confidence interval was 0.006125 to
0.02248
Maximum Tensile Strength – HPFRCC Reinforced Hooked 1.5%
(a) (b)
(c)
Figure 7.20: (a) Distribution of maximum stress, (b) cumulative histogram,
and (c) normal probability plot for HPFRCC reinforced Hooked 1.5%
The sample mean of these measurements is 607.24 psi (4.187 MPa), the standard
deviation is 118.69 psi (0.818 MPa), and the coefficient of variation is 19.55 percent. The
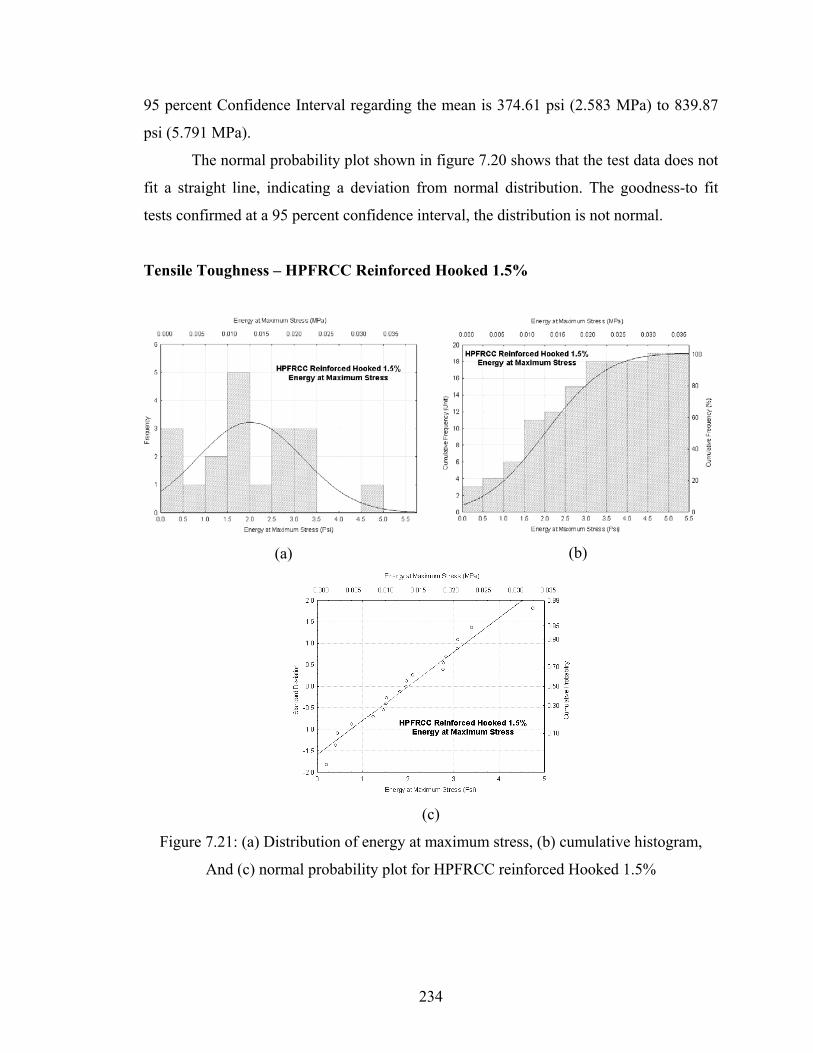
234
95 percent Confidence Interval regarding the mean is 374.61 psi (2.583 MPa) to 839.87
psi (5.791 MPa).
The normal probability plot shown in figure 7.20 shows that the test data does not
fit a straight line, indicating a deviation from normal distribution. The goodness-to fit
tests confirmed at a 95 percent confidence interval, the distribution is not normal.
Tensile Toughness – HPFRCC Reinforced Hooked 1.5%
(a)
(b)
(c)
Figure 7.21: (a) Distribution of energy at maximum stress, (b) cumulative histogram,
And (c) normal probability plot for HPFRCC reinforced Hooked 1.5%

235
The sample mean was 2.0 psi (0.014 MPa), and the corresponding standard
deviation was 1.17 psi (0.008 MPa). The coefficient of variation was 58.81 percent and
the 95 percent confidence interval was no more than 4.29 psi (0.03 MPa).
Strain at Maximum Stress – HPFRCC Reinforced Hooked 1.5%
(a) (b)
(c)
Figure 7.22: (a) Distribution of strain at maximum stress, (b) cumulative histogram, and
(c) normal probability plot for HPFRCC reinforced Hooked 1.5%
Figure 7.22 presents the tensile strain at maximum stress of HPRCC reinforced
Hooked specimens, starting at the localization phase. The mean was 0.004232 and the
corresponding coefficient of variation was 54.03 percent. The standard deviation was
0.002287, while the 95 percent confidence interval was certainly no more than 0.008715.

236
Maximum Tensile Strength – HPFRCC Reinforced Hooked 2.0%
(a) (b)
(c)
Figure 7.23: (a) Distribution of maximum stress, (b) cumulative histogram,
and (c) normal probability plot for HPFRCC reinforced Hooked 2.0%
The sample mean of these measurements is 838 psi (5.778 MPa), the standard
deviation is 272.19 psi (1.877 MPa), and the coefficient of variation is 32.48 percent. The
95 percent confidence interval about the mean is 304.51 (2.1 MPa) to 1371.5 psi (9.456
MPa).
The goodness-to-fit tests confirmed the normality of the sample distribution for
tensile strength test results at 95 percent confidence interval. The distribution of the
results is shown in Fig. 7.23 and the normal curve overlapping the histogram presents an
indication of the normality of sample distribution.

237
Tensile Toughness – HPFRCC Reinforced Hooked 2.0%
(a) (b)
(c)
Figure 7.24: (a) Distribution of energy at maximum stress, (b) cumulative histogram, and
(c) normal probability plot for HPFRCC reinforced Hooked 2.0%
The sample means were 2.77 psi (0.019 MPa), and the corresponding standard
deviations were 1.88 psi (0.013 MPa). The coefficient of variation was 68.14 percent.
The 95 percent confidence interval was not more than 6.45 psi (0.044 MPa). The normal
probability plot shown in Fig. 7.24 shows that the test data does not fit a straight line,
indicating a deviation from normal distribution.

238
Strain at Maximum Stress – HPFRCC Reinforced Hooked 2.0%
(a) (b)
(c)
Figure 7.25: (a) Distribution of strain at maximum stress, (b) cumulative histogram, and
(c) normal probability plot for HPFRCC reinforced Hooked 2.0%
Figure 7.25 presents the tensile strain at maximum stress of HPRCC reinforced
Hooked specimen, starting of the localization phase. The means were 0.00416, the
corresponding coefficient of variation were 55.37 percent. The standard deviation was
0.002303. The 95 percent confidence interval was no more than 0.008674

239
Maximum Tensile Strength – HPFRCC Reinforced Torex 1.5%
(a) (b)
(c)
Figure 7.26: (a) Distribution of maximum stress, (b) cumulative histogram,
and (c) normal probability plot for HPFRCC reinforced Torex 1.5%
The sample mean of these measurements is 749.07 psi (5.165 MPa), the standard
deviation is 175.73 psi (1.212 MPa), and the coefficient of variation is 23.46 percent. The
95 percent confidence interval about the mean is 404 psi (2.785 MPa) to 1093 psi (7.536
MPa).
The goodness-to-fit tests confirmed the normality of the sample distribution for
tensile strength test results at 95 percent confidence interval. The distribution of the

240
results is shown in Fig. 7.26 and the normal curve overlapping the histogram presents an
indication of the normality of sample distribution.
Tensile Toughness – HPFRCC Reinforced Torex 1.5%
(a)
(b)
(c)
Figure 7.27: (a) Distribution of energy at maximum stress, (b) cumulative histogram, and
(c) normal probability plot for HPFRCC reinforced Torex 1.5%
The sample means were 2.98 psi (0.021 MPa), and the corresponding standard
deviations were 1.52 psi (0.01 MPa). The coefficient of variation was 51.03 percent. The
95 percent confidence interval was 0.0008 psi to 5.96 psi (0.041 MPa). The normal
probability plot shown in Fig. 7.27 shows that the test data does not fit a straight line,
indicating a deviation from normal distribution.

241
Strain at Maximum Stress – HPFRCC Reinforced Torex 1.5%
(a) (b)
(c)
Figure 7.28: (a) Distribution of strain at maximum stress, (b) cumulative histogram, and
(c) normal probability plot for HPFRCC reinforced Torex 1.5%
Figure 7.28 presents the tensile strain at maximum stress of HPRCC reinforced
Torex specimen, starting of the localization phase. The means were 0.003773, the
corresponding coefficient of variation was 45.2 percent. The standard deviation was
0.001705. The 95 percent confidence interval was 0.000431 to 0.007115.

242
Maximum Tensile Strength – HPFRCC Reinforced Torex 2.0%
(a) (b)
(c)
Figure 7.29: (a) Distribution of maximum stress, (b) cumulative histogram,
and (c) normal probability plot for HPFRCC reinforced Torex 2.0%
The sample mean of these measurements is 939.05 psi (6.475 MPa), the standard
deviation is 172.5 psi (1.189 MPa), and the coefficient of variation is 18.37 percent. The
95 percent confidence interval about the mean is 600.95 psi (4.143 MPa) to 1277.15 psi
(8.806 MPa).
The normal probability plot shown in Fig. 7.29 shows that the test data does not
fit a straight line, indicating a deviation from normal distribution. The goodness-to fit
tests confirmed at a 95 percent confidence interval, the distribution is not normal.

243
Tensile Toughness – HPFRCC Reinforced Torex 2.0%
(a)
(b)
(c)
Figure 7.30: (a) Distribution of energy at maximum stress, (b) cumulative histogram, and
(c) normal probability plot for HPFRCC reinforced Torex 2.0%
The sample means were 3.61 psi (0.025 MPa), and the corresponding standard
deviations were 1.24 psi (0.009 MPa). The coefficient of variation was 34.33 percent.
The 95 percent confidence interval was 1.18 psi (0.008 MPa) to 6.04 psi (0.042 MPa).
The normal probability plot shown in Fig. 7.30 shows that the test data does not fit a
straight line, indicating a deviation from normal distribution.

244
Strain at the End of Multiple Cracking Stage – HPFRCC Reinforced Torex 2.0%
(a)
(b)
(c)
Figure 7.31: (a) Distribution of strain at maximum stress, (b) cumulative histogram, and
(c) normal probability plot for HPFRCC reinforced Torex 2.0%
Figure 7.31 presents the tensile strain at the end of multiple cracking stage of
HPRCC reinforced Spectra specimen, starting of the localization phase. The means were
0.003993, the corresponding coefficient of variation was 27.98 percent. The standard
deviation was 0.001117. The 95 percent confidence interval was 0.001804 to 0.006182.

245
7.5 Variability Graph
The high variability in strength, strain at maximum stress, and toughness, are
evident in Fig. 7.32 to Fig. 7.34, both of which show the ranges and averages of the
collected data. The upper boundary of each shaded part represents the maximum recorded
strengths, while the lower boundary represents the lowest recorded strengths. The solid
line running through the middle of each shaded region is the average line. The circles at
each Vf represent individual test results at that Vf and the distribution of points again
gives an idea of the large statistical spread in the data.
(a)
(b)
(c)
(d)
Figure 7.32: First cracking stress range and average

246
(a)
(b)
(c)
(d)
Figure 7.33: Maximum stress range and average

247
(a)
(b)
(c)
Figure 7.34: Strain at maximum stress range and average

248
(a)
(b) (c)
Figure 7.35: Energy at maximum stress range and average
7.6 Concluding Remarks
The following conclusions are drawn from this study.
1. Generally, a normal distribution curve at 95 percent confidence level is valid for
most tests. However, some tests such as for the maximum stress after cracking
showed varying degrees of departure from normal distribution. This could have
resulted from the relatively large variation in the data.
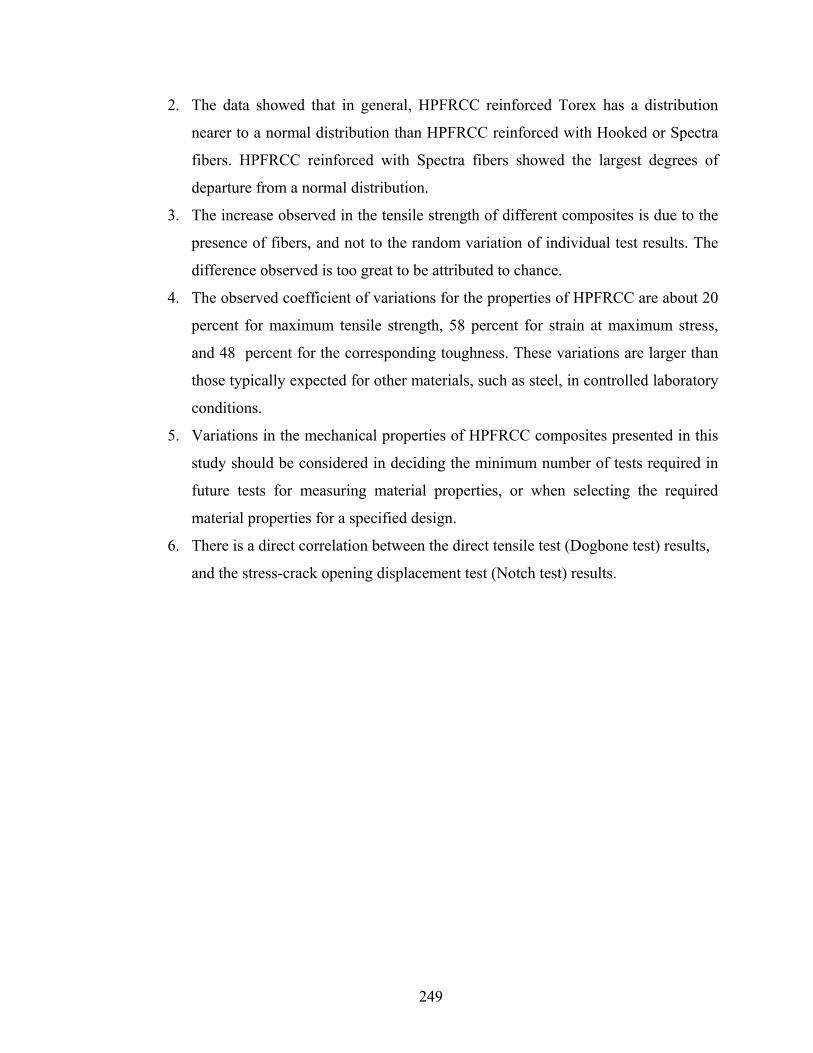
249
2. The data showed that in general, HPFRCC reinforced Torex has a distribution
nearer to a normal distribution than HPFRCC reinforced with Hooked or Spectra
fibers. HPFRCC reinforced with Spectra fibers showed the largest degrees of
departure from a normal distribution.
3. The increase observed in the tensile strength of different composites is due to the
presence of fibers, and not to the random variation of individual test results. The
difference observed is too great to be attributed to chance.
4. The observed coefficient of variations for the properties of HPFRCC are about 20
percent for maximum tensile strength, 58 percent for strain at maximum stress,
and 48 percent for the corresponding toughness. These variations are larger than
those typically expected for other materials, such as steel, in controlled laboratory
conditions.
5. Variations in the mechanical properties of HPFRCC composites presented in this
study should be considered in deciding the minimum number of tests required in
future tests for measuring material properties, or when selecting the required
material properties for a specified design.
6. There is a direct correlation between the direct tensile test (Dogbone test) results,
and the stress-crack opening displacement test (Notch test) results.

250
CHAPTER 8
RING-TENSILE TEST
8.1 Introduction
A new testing method, the direct ring tensile test, was proposed and discussed in
Chapter 3 as an alternative for the direct tensile test. The advantages of the new test are:
1. More stable compared to the direct tensile test
2. Increased cracking zone. The ring tensile specimen cracking area is significantly
larger than that of the direct tensile test. (Dogbone test) (Fig. 8.1)
3. Ability to scale up specimen size (i.e., easier to increase the dimension in
comparison to Dogbone shaped specimens)
A pilot study was conducted to investigate the appropriate of the method. Four
specimens were employed; ring composites reinforced Hooked 2.0% (Specimen 1 and
Specimen 2), Hooked 1.0%, and specimen reinforced PVA 2.0%.

251
Figure 8.1: Comparison of specimens between ring-tensile and Dogbone shaped
8.2 Measurement Comparisons
(a) (b) (c)
Figure 8.2: Illustrates the displacement obtained (a) from the Optotrak, (b) the LVDT is
on the perimeter of the specimen’s surface, and (c) at the tip of the cone wedge
The test setup is shown in Fig. 8.2 where force is applied to the top of the
specimen’s setup, the cone wedge moves down it pushes out the steel plates. This will
create horizontal force to expand the specimen ring, breaking the specimen. Three types
of sensors were utilized to measure the expansion of the specimen’s perimeter, described
as follows:

252
1. Optotrak system placed on the specimen’s surface (Fig. 8.3)
2. LVDT at the specimen’s perimeter
3. LVDT at the cone wedge tip (bottom part of cone wedge).
A comparison of stress-strain curves obtained from each type of specimen
measurement system is displayed in Fig. 8.4. It is clear from Fig. 8.4 that method 2
measures less displacement at the same stress level than the other 2 systems. Results
showed that the displacement at the cone wedge tip presents the highest error along the
specimen, while displacement measuring by wire at the specimen’s perimeter represents
lower error. Optotrak measurement produces the lowest error along the specimen
measurement.
Figure 8.3: An Optotrak displacement sensor location
(Localization is captured in only half of the specimen)

253
Figure 8.4: Ring-tensile test results of Hooked 2.0% specimen 2 composites with varying
measurements
The localization can be practically captured only from method 3. Optotrak
measurement is pertinent for only half of the specimen. (Fig. 8.3) In the setup, six sensors
were attached, leading to an inaccuracy in measuring the specimen’s perimeter. The other
half is out-of-range and is unable to capture the displacement (Fig. 8.3). If the
localization area is out-of the Optotrak sensors’ range, capturing complete crack-opening
behavior correctly is not possible by this method.

254
Figure 8.5: Ring-tensile test results of Hooked 1.0% composites with various types of
measurements
Figure 8.5 shows a comparison of the three methods for Hooked 1.0% specimens.
From Optotrak sensors, the major localization failure occurs out of Optotrak scopee, but
the internal localization failure occurs in the cracking zone, leads to inability to capture
the displacement after the peak stress. It can be seen clearly that the specimen permanent
deformation is clearly high. Unloading process is clearly visible.
The measurement at perimeter of the specimen is smaller than observed.
However, the measurement at perimeter of the specimen is the smallest. At the cone
wedge displacement, it is too small. The Optotrak sensor is not clearly too small.
Leading to inability of measuring the strain at maximum stress.
When comparing three types of measurements, after calibrating the specimen’s
displacement and calculating the specimen’s strain, method 2 fails to represent the initial
stress-strain data well (i.e., The spring type LVDT is not adequate for the initial stage.)
However, method 1 and 3 provide acceptable data.

255
The localization is very interesting, exhibiting crack formations predominately at
four locations on the specimen’s surface, (e.g., 90 degrees from each other, Fig. 8.13),
and propagated largely when the cone wedge was deeply inserted. After the specimen
reached the rupture point, one of the four of localization zones completely failed (i.e.,
sudden failure; fibers broke).
Figure 8.6: Localization crack of PVA specimen
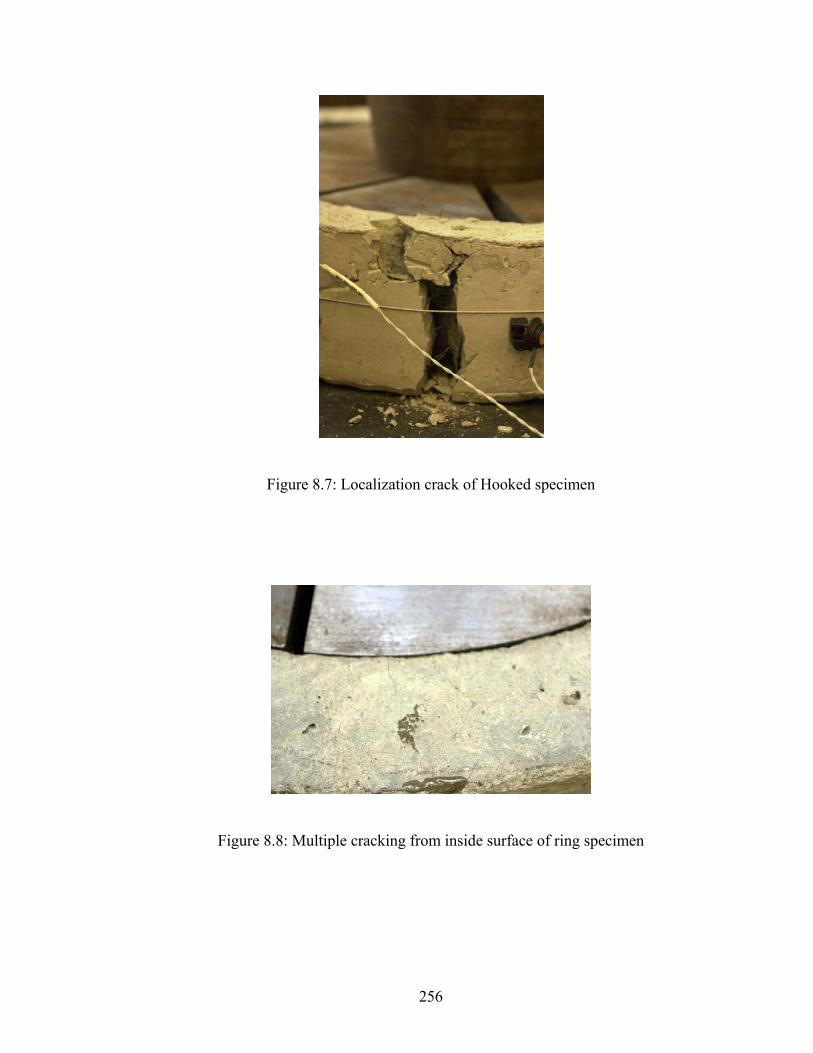
256
Figure 8.7: Localization crack of Hooked specimen
Figure 8.8: Multiple cracking from inside surface of ring specimen

257
Figure 8.9- One of the four minor localization cracks
Figure 8.10: Multiple cracking for both inside and outside surface of specimens
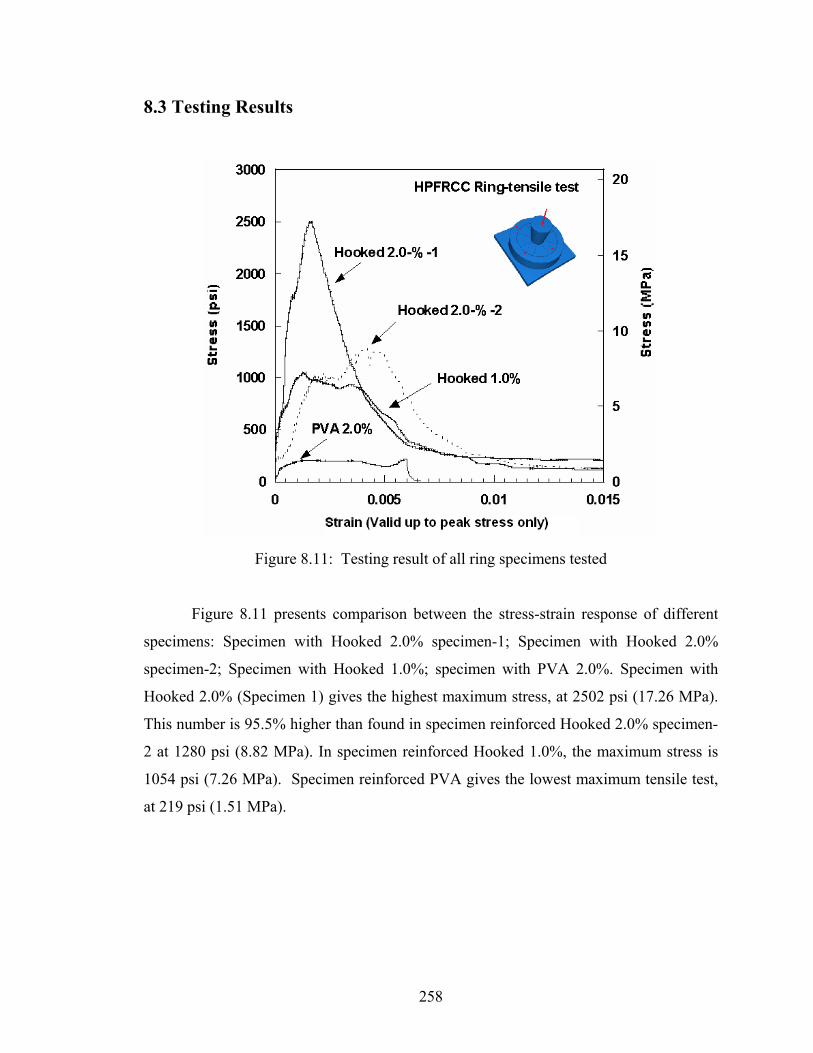
258
8.3 Testing Results
Figure 8.11: Testing result of all ring specimens tested
Figure 8.11 presents comparison between the stress-strain response of different
specimens: Specimen with Hooked 2.0% specimen-1; Specimen with Hooked 2.0%
specimen-2; Specimen with Hooked 1.0%; specimen with PVA 2.0%. Specimen with
Hooked 2.0% (Specimen 1) gives the highest maximum stress, at 2502 psi (17.26 MPa).
This number is 95.5% higher than found in specimen reinforced Hooked 2.0% specimen-
2 at 1280 psi (8.82 MPa). In specimen reinforced Hooked 1.0%, the maximum stress is
1054 psi (7.26 MPa). Specimen reinforced PVA gives the lowest maximum tensile test,
at 219 psi (1.51 MPa).

259
Figure 8.12: Comparison of maximum stress of all ring-tensile specimens tested
HPFRCC Ring-Tensile testMaximum Stress
2502.6
1279.7
1053.6
218.8
0
500
1000
1500
2000
2500
3000
Hooked 2.0% -1 Hooked 2.0% -2 Hooked 1.0% PVA 2.0%
Max
imum
Str
ess
(ps

260
Specimen’s Cracking Behavior
(a)
Elastic stage - No crack.
(b)
Multiple cracking and minor localization stage. Small cracks were visible. But four minor localization cracks occurred at specimen’s 90 degree corners, satisfying the deflection demand induced from the cone wedge.
(c)
One of the four minor localization cracks became the major localization crack (Largely damaged). The failure was significant and became unstable.
Figure 8.13: Cracking steps in ring-tensile specimen (a) elastic stage, (b) multiple
cracking stage, and (c) localization

261
Comparison Between Ring-Tensile Test and Direct Tensile Test
Test results reveal the difference between the direct tensile test and ring-tensile
test. Overall, it appears that the ring-tensile test gives a higher strength than the direct
tensile test. For example, the maximum resulting from Hooked 2.0% specimen-1, (2502
psi, 17.26 MPa) and Hooked 2.0% specimen-2 (1271 psi, 7.26 MPa) are obtained from
the ring test. However, the result obtained from the direct tensile test of Hooked 2.0% is
only 838 psi (5.78 MPa), and is 1054 psi (7.26 MPa) for the Hooked 1.0% specimen. In
contrast, the average result obtained from the Hooked 1.0% direct tensile is only 535 psi
(3.69 MPa), which is significantly larger.
In addition to strength, the displacement result (such as strain at maximum stress)
differs from the ring-tensile test, generally significantly lower than observations from the
ring-tensile test.
Friction Effect
Almost all specimens, in the study’s pilot simulation process, suffered from
friction. The results from finite element model suggested the value of friction is around
0.3 to 0.5. However, the friction determined from simulation is not effectively applicable
to the testing, due to some inconsistency in the friction coefficient originating from the
manufacturing process of the setup and specimen surface.

262
Figure 8.14: Stress-strain result of PVA 2% specimen with error in strain hardening and
multiple cracking behavior
Testing results reveal the error of stiffness measurement, from Figure 8.14
8.4 Concluding Remarks
1. The ring-tensile test system offers for the same volume of material a much larger
area (outer perimeter) than the direct tensile test for observation of cracking,
multiple cracking, and localization. It is also a more stable test than the direct
tensile test.
2. In practice, the Ring tensile test needs further tuning to eliminate or account for
the effect of friction between the cone and steel hedges. Therefore it is not yet
recommended as a replacement for the Direct tensile test.
3. Because of the effect of friction, three to four regions of the tensile ring had
multiple cracking and localization within each region.

263
4. Among the various methods used to measure the circumferential displacement
and thus the strain, the fixture using a thin steel wire attached to an LVDT led to
the most consistent results.
5. The average maximum post-cracking stress observed from the of ring specimens
was higher than that observed from stress-crack opening displacement test.

264
CHAPTER 9
CONCLUSIONS
9.1 Summary
This investigation has provided new insights into the understanding of the
mechanisms for the tensile stress-strain behavior of high-performance discontinuous-fiber
cement-based composites (HPFRCC). Experimental and analytical investigations were
carried out which resulted in quantitative data on the basic properties of fiber reinforced
cementitious composites and models for predicting the post cracking behavior and the
occurrences of multiple cracking in HPFRCC. The experimental data obtained were
maximum stress, strain at maximum stress, energy at maximum stress, energy at the end
of multiple cracking stage, toughness, crack width, crack spacing, strain data, and crack
observations. Predictive models were derived using composite mechanic and energy
principles. The parameters included in the analysis are frictional shear stress, volume
fraction of fiber, matrix cracking stress fiber length, fiber types, as well as fiber diameter.
Analytical models were developed to predict the tensile stress-strain response of fiber
reinforced cement based composites including the elastic stage, multiple cracking stage,
and localization. The study also addressed the variability observed in the tests.
The study consisted of three main phases. The first phase included an extensive
experimental evaluation of the effectiveness of randomly distributed fibers in controlling
tensile behavior of dogbone shaped specimens (direct tensile test). Four types of fibers;
PVA, Spectra, Hooked and Torex, were investigated at volume fractions ranging from

265
0.75% to 2.0%. The second phase studied the influence of randomly distributed fibers on
the responses of notch shaped specimen. The third phase focused on evaluating the
statistical variations in the experimental results. The following conclusions can be drawn
based on the results obtained from the experimental and analytical investigations.
9.2 Conclusions Drawn From Direct Tensile Test (Dogbone) Test of
HPFRCC
9.2.1 PVA Fiber
Testing was carried with two types of otherwise identical fibers: PVA fibers with
oiled surface and PVA fibers with non-oiled surface.
1. Comparing between HPFRCC reinforced with oiled PVA and non-oiled PVA
fibers, the post-cracking strength of specimen with oiled PVA was up to 2 to 3
times that of specimens with non-oiled PVA. Thus the use of oiled PVA fibers
showed significant improvement in tensile behavior, over the short term, as tested
in this study.
2. No clear multiple cracking behavior was observed in specimen reinforced with
PVA fiber regardless of, whether the fibers were oiled or not. By and large, one
crack was observed in all tests. This may seem in conflict with findings from
other investigators, but could be attributed to the fact that they used different
methods of tensile testings and smaller size specimens.
3. The presence of PVA fiber effectively improves the cracking stress, and the
cracking strain. However, comparing improvement with other types of fiber, such
as Spectra, Hooked and Torex, the effectiveness of PVA fiber was the lowest.
4. Increasing the volume fraction of PVA fibers up to 1.5% by volume, leads to a
marked improvement in the post-cracking strength, ductility, and energy
absorption capacity of the composite.
5. Given the specimen preparation and testing procedure used, the optimum volume
fraction of fiber was close to 1.5%. The highest direct tensile stress observed from

266
specimens reinforced with PVA fibers was 482 psi (3.323 MPa) at 1.5% volume
fraction.
9.2.2 Spectra Fiber
1. The use of Spectra fibers led to a marked improvement in specimen ductility,
energy absorption capacity, strain hardening response and the extent of multiple
cracking. Increasing the volume fraction of fibers up to 1.5% generally led to
improvement in properties. However, at 2% fiber content, properties started
deteriorating due to difficulties in mixing and related air entrapment.
2. Increasing the volume fraction of Spectra fibers up to 1.5% by volume led to an
increase in number of cracks and a decrease in crack width and spacing.
3. A consistent correlation could not be established between the volume fraction of
fiber and the first cracking stress (approximately 300 psi, 2 MPa), the strain at
first cracking, and the corresponding energy absorption capacity.
4. Increasing volume fraction of fiber showed overall improvement in the maximum
post-cracking stress, the strain at maximum stress, and related energy at the end of
multiple cracking or crack saturation.
5. Everything else being equal and given the parameters of this study and the
Spectra fiber used (length and diameter) the optimum volume fraction of Spectra
fiber seems to be around 1.5%.
9.2.3 Hooked Steel Fiber
1. The use of high strength Hooked steel fiber clearly improved the strain hardening
and multiple cracking behavior, toughness, and energy absorption capacity
compared to plain mortar or PVA fiber reinforced specimen. Most specimen
achieved strain hardening response.
2. Increasing the fiber volume fraction clearly led to improvement in all properties
except for the stress and strain at first cracking which did not necessarily follow
the trend.
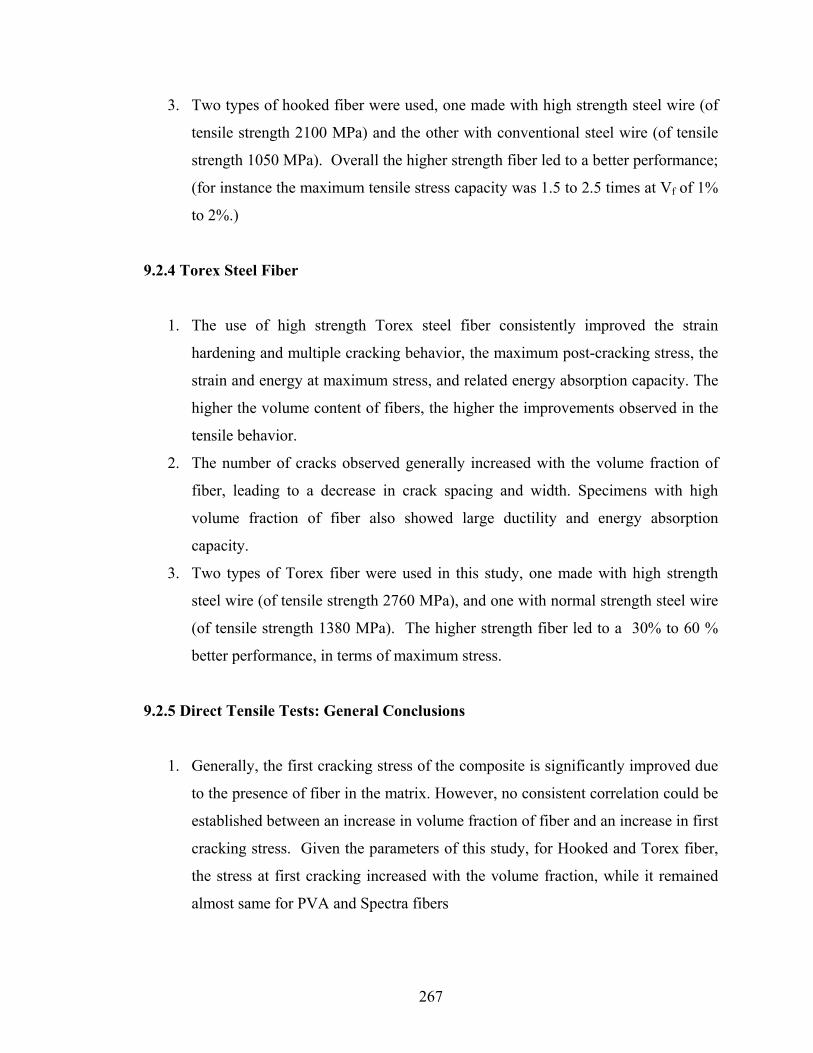
267
3. Two types of hooked fiber were used, one made with high strength steel wire (of
tensile strength 2100 MPa) and the other with conventional steel wire (of tensile
strength 1050 MPa). Overall the higher strength fiber led to a better performance;
(for instance the maximum tensile stress capacity was 1.5 to 2.5 times at Vf of 1%
to 2%.)
9.2.4 Torex Steel Fiber
1. The use of high strength Torex steel fiber consistently improved the strain
hardening and multiple cracking behavior, the maximum post-cracking stress, the
strain and energy at maximum stress, and related energy absorption capacity. The
higher the volume content of fibers, the higher the improvements observed in the
tensile behavior.
2. The number of cracks observed generally increased with the volume fraction of
fiber, leading to a decrease in crack spacing and width. Specimens with high
volume fraction of fiber also showed large ductility and energy absorption
capacity.
3. Two types of Torex fiber were used in this study, one made with high strength
steel wire (of tensile strength 2760 MPa), and one with normal strength steel wire
(of tensile strength 1380 MPa). The higher strength fiber led to a 30% to 60 %
better performance, in terms of maximum stress.
9.2.5 Direct Tensile Tests: General Conclusions
1. Generally, the first cracking stress of the composite is significantly improved due
to the presence of fiber in the matrix. However, no consistent correlation could be
established between an increase in volume fraction of fiber and an increase in first
cracking stress. Given the parameters of this study, for Hooked and Torex fiber,
the stress at first cracking increased with the volume fraction, while it remained
almost same for PVA and Spectra fibers

268
2. Comparing between types of fiber, for the same volume fraction of fibers,
specimens with Torex, high strength Hooked, and Spectra fibers showed better
overall behavior than specimens with PVA fibers. Moreover, their post-cracking
strength reached 1.5 to 3 times their strength at first cracking, while for specimens
with PVA fibers, the post-cracking strength was only 10% to 50% higher than the
cracking strength at up to 2% fiber content.
3. The tensile response of specimens without fibers is very brittle and shows large
variability in tensile strength. Fibers, whether leading to strain softening or strain
hardening response, reduce the variability while improving ductility and
toughness.
4. Immediately following localization, specimens reinforced with PVA fiber fail
suddenly due to tensile failure of the fibers. For specimens reinforced with
Spectra fiber, the failure is gradual and controlled by the pulling out of the fibers
accompanied by matrix spalling around the critical crack. Also, for specimens
reinforced with steel fiber, whether Hooked or Twisted, the fibers gradually pull
out up to complete separation; during pull out, twisted fibers untwist leading to
additional matrix cracking. No steel fiber failure was observed for the variables
of this study.
5. For the same volume fraction, and type of steel fiber, the strength of fiber is
important for determining the composite tensile behavior. Specimen reinforced
with high strength steel fiber usually outperform specimen reinforced with regular
strength steel fiber.
6. Changing surface properties of the fiber has important implications. For instance,
specimens reinforced with oiled PVA fibers performed better than specimens
reinforced with non-oiled ones.
7. Variability of properties obtained from direct tensile testing is large and a fact that
cannot be ignored. Both fiber distribution within the specimen and fiber
orientation at any section play a significant role in influencing observed
properties. The more uniform is the distribution of fiber, the less variable the
tensile behavior is.

269
9.3 Conclusions Drawn from the Stress-Crack Opening Displacement
(COD) Tests on Notched Tensile Prisms
9.3.1 PVA Fiber
1 No multiple cracking was observed in these specimens at all volume fractions
tested. However, strain hardening behavior was observed in specimens with high
volume fractions of PVA fiber. Such behavior could be attributed to the slow
propagation of a single crack from one end of the section to its other end.
2. Only single cracks were observed in these tests. Each crack was fine and well
defined with no large damage zone around it .
3. For the given parameters of this study, the optimum volume fraction of fiber is
1.5%, the same as observed from the direct tensile tests. However, the average
maximum stress of the notched prisms (about 3.9 MPa) was higher than that
obtained from the dogbone tensile prisms (about 3.7 MPa).
4. Comparing the displacement at maximum stress between specimens with high
strength Hooked, Torex, Spectra, and PVA fiber, the smallest displacement was
by far with the PVA fiber. Typically such displacement was 10 times smaller than
observed from specimens with the other fibers.
9.3.2 Spectra Fiber
1. Multiple cracking behavior around the notched section (equivalent to smeared
cracking) was clearly observed. Such behavior encourages strain hardening (or
high performance) response in direct tension as indeed observed in the direct
tensile tests.
2. The cracking zone on either side of the notch area (area between two notches) is
significant, containing several cracks. Its extent increased with an increase in
volume fraction of fibers. Specimens containing high volume fraction of fibers
usually outperformed those containing low volume fraction of fibers.

270
3. No consistent correlation could be established between the fiber content and the
first cracking stress, the strain at first cracking stress, and the energy at first
cracking stress. These variables seemed independent of the volume fraction of
fibers for the range of fiber content tested. However, the maximum stress, strain
at maximum stress, and energy at the end of multiple cracking stage all increased
with an increase in volume fraction of fiber.
4. Keeping in mind mixing difficulty and air entrapment, the best performance was
obtained at a volume fraction of 1.5% (not 2%) and is consistent with the results
from the direct tensile (dogbone) tests.
9.3.3 Hooked Steel Fiber
1. Numerous multiple cracks clearly occurred around the notched section.
Displacement (strain) hardening behavior was observed. The higher the volume
fraction of fibers, the more extended was the cracked region. Specimens with
2.0% and 1.5% volume fractions were observed as having a larger number of
crack (about 5 equivalent cracks).
2. Generally, the higher the volume fraction of fibers the better the post-cracking
strength and ductility. However, the displacement at maximum stress was almost
independent of the fiber volume fraction.
3. The stress at first cracking and related energy increased slightly with the volume
fraction of fibers. However, the strain at first cracking stress remained almost
constant.
4. A high variability in test results was clearly observed.
9.3.4 Torex Steel Fiber
1. The use of Torex fibers led to significant multiple cracking around the notched
section, and displacement (or strain) hardening behavior was observed.
Specimens reinforced with Torex fiber achieve high performance behavior. The

271
strain hardening and multiple cracking behavior, with significant ductility and
energy absorption, are clearly observed.
2. Multiple cracking was observed even at 0.75% fiber content. The higher the
volume fraction of fibers, the higher the maximum post-cracking stress and
related energy absorption capacity, and the larger the number of equivalent
cracks. Everything else being equal, maximum stresses here exceeded those
obtained from direct tensile tests.
3. The stress at first cracking and related strain did not seem to depend on the fiber
volume fraction.
4. The damaged area around the notched section was usually smaller than that using
Spectra fibers. This could be attributed to the fact that the Spectra fibers used
were 38 mm in length compared to the 30 mm Torex fibers.
5. The variability in test results obtained with Torex fibers was smaller than that
with Spectra and Hooked fibers.
9.3.5 Stress Crack Opening Displacement (COD) Tests: General Conclusions
In this study only one mortar matrix composition and strength was used. It is likely
that results would be different with different strength matrices. However, it is also likely
that typical observation, for the shape of the stress versus COD curves, will be similar to
what has been observed in this study.
The following conclusions can be drawn from this study:
1. The stress versus crack opening displacement (COD) of FRC composites can be
classified into four types : clearly strain hardening with multiple cracks ; clearly
strain softening with a single localized crack ; and two cases in between, a strain
hardening material with a single major crack ; a strain softening material with
post cracking strength, able to pick up almost up to the cracking stress.
2. For the same volume fraction of fibers, specimens with Torex and High strength
Hooked fibers showed better overall behavior than specimens with Spectra and
PVA fibers. Moreover, their post-cracking strength was 1.5 to 3 times the strength

272
at first cracking, while for specimens with PVA fibers, the post-cracking strength
was only 10% to 50% higher than the cracking strength.
3. For the same type of fiber, increasing the volume fraction led to a marked
improvement in post-cracking strength, ductility, and energy absorption capacity
of the composites.
4. The crack opening in specimens with Torex, high strength Hooked and Spectra
are the result of fiber-pulling out. However, the damage in specimens with PVA
fibers was due to fiber breaking.
9.4 Conclusions from the Study on Modeling Tensile Stress-Strain
Response
A model based on composite mechanics and experimental observations, to explain the
occurrence of multiple cracking in discontinuous fiber composites, (HPFRCC) was
developed. The influence of various parameters was investigated. Good agreement was
found between the model predictions for stress-strain relation and experimental results.
The following specific conclusions are drawn.
1. Predictive equations derived from mechanics of composites were used for the
stress at first cracking and the maximum post-cracking stress. From the
experimental results obtained, prediction equations were suggested for the
coefficients in these equations,
2. Predictions equations for average crack spacing and average crack width for
HPFRCC tensile specimens reinforced with Spectra, Hooked, and Torex fibers
were derived based on experimental observations.
3. A method to predict the strain at maximum stress, from crack width and crack
spacing is suggested. Good agreement between predicted and experimental results
was observed.
4. A analytical equation was developed to predict the response of the composite in
tension after localization. The equation depends on two parameters only, and
allows to simulate damage as well as variable curvature in the shape of the curve.

273
The model produced good approximation of the localization behavior obtained
experimentally.
5. A correlation between the direct tensile test (Dogbone test) and stress-crack
opening displacement test (Notch test) was established. The proposed method was
found to have a good agreement between prediction and experiment.
9.5 Conclusions from the Statistical Analysis and Variability of Results
1. Generally, a normal distribution curve at 95 percent confidence level is valid for
most test results. However, some tests such as for the maximum stress after
cracking showed varying degrees of departure from normal distribution. This
could have resulted from the relatively large variation in the data.
2. The data showed, generally, HPFRCC reinforced Torex has a distribution nearer
to the theoretical normal distribution, better when compared to HPFRCC
reinforced with Hooked and Spectra fibers. HPFRCC reinforced with Spectra
fibers showed the largest degrees of departure from normal distribution.
3. The increase observed in the tensile strength results of different composites is due
to the presence of fibers, and not to the random variation of the individual test
results. The difference observed is too great to be attributed to chance.
4. The observed coefficient of variation for the properties of all HPFRCC testes,
were about 20 percent for maximum tensile strength, 58 percent for strain at
maximum stress, and 48 percent for the corresponding toughness. These
variations are larger than those typically expected for other materials, such as
steel, in controlled laboratory conditions.
5. Variations in the mechanical properties of HPFRCC composites presented in this
study should be considered in deciding the minimum number of tests required in
future tests for measuring material properties, or when selecting the required
material properties for a specified design.
6. There is a direct correlation between the direct tensile test (Dogbone test) results,
and the stress-crack opening displacement test (Notch test) results.

274
9.6 Conclusions for the Ring Tensile Test Study
The following conclusions are drawn from this part of the study.
1. The principle, the ring-tensile test system offers for the same volume of material a
much larger area (outer perimeter) than the direct tensile test for observation of
cracking, multiple cracking, and localization. It is also a more stable test than the
direct tensile test
2. In practice, the Ring tensile test needs further tuning to eliminate the effect of
friction between the cone and steel ring during testing. Therefore it is not yet
recommended as a replacement for the Direct tensile test.
3. Because of friction, three to four regions of the tensile ring had multiple cracking
and localization within each region.
4. Among the various methods used to measure the circumferential displacement
and thus the strain, the fixture using a thin steel wire attached to an LVDT led to
the most consistent results.
5. The average maximum post-cracking stress observed from the of ring specimens
was higher than that observed from stress-crack opening displacement test.
9.7 Main Conclusions
1. The first cracking stress of the composite is significantly improved due to the
presence of fibers in the matrix. However, the correlation between volume
fraction and first cracking stress, in some cases, depends on volume fraction of
fibers (such as for Hooked and Torex fibers) and in other cases seems
independent of the volume fraction of fibers (such as for PVA and Spectra fibers.)
2. Immediately following localization, specimens with PVA fiber failed by failure of
the fiber. For the other fibers used (Spectra, Hooked and Torex) failure occurred
by fibers primarily pulling out of the matrix. With Spectra fibers, significant
spalling of the matrix occurs during the softening response.
275
3. Comparing tensile performance of the composites at the same fiber volume
fraction, Torex fibers perform the best, Hooked and Spectra fibers are next, and
PVA fibers give the lowest tensile performance of all fibers tested.
4. For the same type of fiber, increasing the volume fraction generally leads to a
marked improvement in the post-cracking strength, ductility, and energy
absorption capacity of the composites.
5. The stress versus crack opening displacement (COD) of FRC composites can be
classified into four types : clearly strain (or displacement) hardening with multiple
cracks ; clearly strain (or displacement) softening with a single localized crack ;
and two cases in between, a strain hardening material with a single major crack ;
and a strain softening material with post cracking strength, able to pick up almost
up to the cracking stress.
6. Unlike what could be anticipated, stress versus crack opening displacement tests,
using notched tensile prims, generate multiple cracks or a cluster of cracks in the
zone of influence surrounding the notched section. Such behavior was observed
in all specimens reinforced with Hooked, Spectra and Torex fibers. Therefore the
notion of observing only one crack such as in the case of PVA fiber should be
carefully revised and accommodated in any modeling.
7. The strain at maximum post-cracking stress seems to be independent of fiber
volume fraction for hooked fibers, but increases slightly with the fiber volume
fraction for Torex fibers.
8. The experimental results combined with a simple composite mechanics approach
allowed for a rational prediction of the key properties of HPFRCC in tension
leading to simple prediction equations of these properties. This allowed for
predicting schematic simplified stress-strain and stress-displacement response
curves for use in structural modeling.
9. A large variability should be expected from the tensile properties of fiber
reinforced cement composites, and this should be accounted for in design. Some
effort should be expanded in the future to study the causes of such variability and
attempt to reduce it.

276
9.8 Recommendations for Future Work
An extensive experimental program has been carried out in this research to
understand the response of HPFRCC post cracking characteristic. However, the following
research works are recommended.
1. Measurement of elastic bond strength, frictional bond strength, and debonding
energy will provide exact information on interface properties which will be
needed for the application of the model. Different bonding condition can be
simulated by using fiber with different coating materials.
2. Significant additional research is needed to evaluate size effect on tensile
properties of HPFRCCs, particularly the strain at maximum post-cracking
stress and the multiple cracking process.
3. Additional work is needed to fine tune the ring test and eliminate the effect of
friction between the moving cone and the ring.
4. Additional experimental tests are needed on the the notched tensile prisms
used for the stress versus crack opening displacement, particularly to make
sure that cracking remains within the notched section (such as by using larger
notches).
5. Only the tensile response of composites was investigated in this research.
More experimental work is needed to evaluate the composite response in other
types of loading such as biaxial loading (tension-tension or tension
compression), shear, cyclic loading, etc.

277
APPENDICES

278
APPENDIX A
DIRECT TENSILE TESTS USING SIFCON
Five SIFCON (Slurry Infiltrated Fiber Concrete) Dogbone specimens reinforced
with high strength Torex steel fiber and high strength Hooked steel fiber were tested to
study the behavior of composites at very high volume fraction, (5% for the series with
Hooked fiber and 4% for the series with Torex fiber). The results are illustrated in Fig. A-
1 and Fig. A-2. Note that the volume fraction of fiber is obtained from the difference in
the weight of the molds before and after placing the fibers.
Figure A-1: Stress-Strain curves of
specimens reinforced with Hooked fiber Figure A-2: Stress-Strain curves of
specimens reinforced with Torex fiber

279
Figure A-3: Comparison of Average stress-strain curves
From the results it can be observed that SIFCON specimens, not only achieve
much higher strength, but also larger ductility and energy absorption (area under the
curves at the end of multiple crack stage (15.0 psi for series with Torex and 7.4 psi for
series with Hooked) than observed from the series with 2% volume fraction of fiber (3.6
psi for series with Torex and 2.92 psi for series with Hooked). Further, their strain at
maximum stress is much higher They also developed a extensive multiple cracking with
very fine crack width and small crack spacing.

280
Figure A-4: Preparation of SIFCON specimens (mold and
fibers)
Figure A-5: SIFCON surface with large number of fiber in the
specimens. (Torex)
Figure A-6: SIFCON
specimen after testing.

281
Table A-1: Summary of test results of SIFCON (US-units)
Table A-2: Summary of test results of SIFCON (US-units)

282
APPENDIX B
DEFINITION OF FIRST CRACKING, MAXIMUM STRESS POINT, AND LOCALIZATION STARTING POINT
(a)
(b)
Figure B-1: Definition of first cracking point, maximum stress point, and localization
starting point at (a) strain (displacement) up to 0.02 and (b) strain (displacement) up to
0.006
First cracking point: The first cracking point refer to the point where the elastic
stiffness is significantly changed. It is also the point where multiple cracking starts.
Maximum stress point: The maximum stress point refer to the point at which the
specimen reached maximum stress
Localization starting point: The localization starting point is the end of multiple
cracking point. It can be defined as the point at which the descending stiffness
undergoes a significant drop. Usually at this point, the stress level is about between the
maximum stress and 75% of the maximum stress. 75% to 100% of maximum stress.

283
Figure B-2: Definition of maximum stress point, and localization starting point for a
specimen with Spectra fiber
Figure B-2 shows the stress-strain
response of HPFRCC reinforced with 2%
Spectra fiber. Here, clearly the maximum
stress point and localization starting point
are not the same. The maximum stress
point occurs at around 0.005 strain, but the
localization starting point occurs at around
0.02 strain. Therefore, the localization
starting point is not the maximum stress
point.
Figure B1-a and B1-b and Fig. B2 illustrates various examples of these points.

284
APPENDIX C
VARIBILITY OBSERVED IN SAME TEST SERIES USING 12 SPECIMENS PREPARED ON THE SAME DAY AND TESTED ON
THE SAME DAY
Figure C-1: Stress-strain curves of Series
with Torex 1.5%
Figure C-2: Stress-strain curves of Series
with Torex 2.0%
Twenty four tensile specimens (Dogbone) were tested in direct tension similarly
as described in Chapter 4. Twelve specimens contained 1.5% Torex fiber by volume and
the other twelve contained 2% Torex fibers by volume. These two series were cast on the
same day and tested on the same day. Thus their variability should be representative for
such conditions. The stress-strain curves are plotted in Figs. C1 and C2 and presents
significantly low variability than observed from the series presented in Chapter 4 where
up to 29 specimens prepared and tested at different time were analysed. Table C-1
summarizes the main results. . It can be observed that the coefficients of variation of the
the maximum stress, maximum strain, and corresponding toughness are significantly
smaller than reported in Chapter 4.

285
Table C-1: Summary of comparison of coefficient of variation ,COV (%)
COV (%) Torex
Volume fraction
Series comparison Maximum Stress
Strain at Maximum
Stress
Toughness (Energy)
Mixed and tested at different time. 23.59 51.36 51.38 1.50% Mixed the same time, Tested the same date 11.96 24.89 35.02
Mixed and tested at different time. 18.39 27.97 34.33 2.00%
Mixed the same time, Tested the same date 17.48 15.93 31.3
Table C-2: Summary of test results of series reinforced Torex 1.5%(US-units)
Table C-3: Summary of test results of series reinforced Torex 1.5%(SI-units)

286
Table C-4: Summary of test results of series reinforced Torex 2.0%(US-units)
Table C-5: Summary of test results of series reinforced Torex 2.0%(SI-units)

287
APPENDIX D
COMPARISON OF α1α2, α1α2τ, λpc AND λpcτ
In order to estimate the coefficients α1α2 and λpc
(Chapter 6) the bond strength τ
was assumed for each type of fiber. Since the value of bond strength can be subjective,
another way can be to consider τ unknown, and estimate from the data the values of α1α2τ
and λpcτ. The results are summarized in Table D1. It can be observed that the fiber
contribution to the postcracking strength, λpcτ, generally decreases with an increase in the
volume fraction of fibers. For the contribution at onset of cracking, the product α1α2τ
does not show any clear trend; however, given the variability observed in the results, it
can ba assumed constant for a fiber type.

288
Figure D-1: Comparison of α1α2 and α1α2τ
Figure D-2: Comparison of λpc and λpcτ

289
BIBLIOGRAPHY

290
BIBLIOGRAPHY
1. Abrishami, H.H., and Mitchell, D., 1996, “Influence of Splitting Cracks on
Tension Stiffening,” ACI Structural Journal, V. 93, No. 6, Nov-Dec,. pp.703-710.
2. Abrishami, H. H., and Mitchell, D., 1997, “Influence of steel fibers on Tension
Stiffening,” ACI Structural Journal, V. 94 No. 6, Nov-Dec., pp. 769-776
3. ACI Committee 224, 1992, “Cracking of Concrete Members in Direct Tension
(ACI 224.2R-92),” American Concrete Institute, Famington Hills, Mich., 12pp,
4. Akkaya, Shah and Ankenman., 2001, “Effect of Fiber Dispersion on Multiple
cracking of Cement Composites,” Journal of Engineering Mechanics, April
2001,”
5. Alwan, Jamil M. (1994) “Modeling of the mechanical behavior of fiber reinforced
cement based composites under tensile loads” Ph.D. Dissertation, University of
Michigan, Ann Arbor
6. A.N. Lambrechts, “The variation of steel fiber concrete characteristic. Study on
toughness results 2002-2003”, N.V. Bekart S.A., Belgium, Fiber Reinforced
Concrete From Theory to Practice, International Workshop on Advances in Fiber
Reinforced Concrete, Bergamo, Italy, September 24-25, 2004
7. Aveston et al. (1971) “ Single and multiple fracture In: The properties of fiber
composites” Conference Proc. National Physical Laboratory, IPC Science and
Technology Press Ltd., 15-24
8. ASTM C1018-94b, “Standard Test Method for Flexural Toughness and First-
Crack Strength of FRC, ASTM Committee on Standards, Philadelphia, 1994.
9. Balaguru, P.N, Shah, S.P, “Fiber-Reinforced Cement Composites”, McGraw-Hill
International Editions, 1992
10. Chandrangsu, K and A.E. Naaman, Comparison of Tensile and Bending response

291
of three high performance fiber reinforced cement composites, HPFRCC4
Workshop, Ann Arbor, USA, 2003
11. Chandrangsu, K, “Innovative Bridge Deck with Reduced Reinforcedment and
Strain-Hardening Fiber Reinforced Cementitious Composites,” Ph.D. thesis,
University of Michigan, Ann Arbor, 2003
12. Cook, Robert, D; David S. Malkus; Michael E. Plesha and Robert J. Witt,
“Concepts and Applications of Finite Element analysis”, Fourth Edition; Wiley
13. Cooper G.A. and J.M. Sillworrd. 1972, “Multiple fracture in a Steel Reinforced
Epoxy Resin Composite.” J of American Ceramic Society 75(2) pp 316:324
14. Dare, P.M., Hanley, H.B., Fraser, C.S., Riedel, B. & Niemeier, W. (2002), “An
Operational Application of Automatic Feature Extraction: The Measurement of
Cracks in Concrete Structures”, Photogrammetric Record, 17, 1999, pp 453-464
15. Dhanada K. Mishra (1995), “Design of Pseudo Strain-Hardening Cementitious
Composites for a Ductile Plastic Hinge”, Ph.D. Dissertation, University of
Michigan, Ann Arbor.
16. Fischer, Gregor and Li, Victor C., 2002, “Influence of Matrix Ductility on
Tension-Stiffening Behavior of Steel Reinforced Engineered Cementitous
Composites (ECC),” ACI Structural Journal, Jan-Feb , pp104-111
17. Guedes, J.M., “Nonlinear Computational Models For Composite Materials Using
Homogenization”, Ph.D. Thesis, Department of Applied Mechanics, University of
Michigan, 1990
18. Guerrero Z. (1999) ‘Bond stress-slip mechanisms in high performance fiber
reinforced cement composites” Ph.D. Dissertation, University of Michigan, Ann
Arbor.
19. Hansen, W., “Tensile Strain Hardening in Fiber Reinforced Cement Composites”,
Proc. Of the International RILEM/ACI Workshop, High Performance Fiber
Reinforced Cement Composites, June 1991 pp 419-428
20. Hauwaert, A.V. ; Delannay, F and Thimus, J-F, “Cracking behavior of Steel Fiber
Reinforced Concrete Revealed by Mans of Acoustic Emission and Ultrasonic
Wave Propagation”, ACI Materials Journal, May-June 1999, pp291-296

292
21. Hong-Gyoo Sohn, Yun Mook Lim, Kong-Hyun Yun & Gi-Hong Kim,
Monitoring Crack Changes in Concrete Structures, Computer-Aided Civil and
Infrastructure Engineering 20 (2005) pp52-61
22. Homrich and Naaman, (1987) “Stress-Strain Properties of SIFCON in Uniaxial
Compression and Tension”, Department of Civil Engineering, Unpublished.
23. Kabele (2004) “Linking scales in modeling of fracture in high performance fiber
reinforced cementitious composites” Fracture Mechanics of Concrete Structures,
Ia-FraMCos, 71-80
24. Kanda, T and Li, V.C., “New Micromechanics Design Theory for Pseudostrain
Hardening cementitious Composite”, Journal of Engineering Mechanics, April
1999, pp 373-381
25. Kanda, T.; Lin, Z.; Li, V.C., “Tensile Stress-Strain Modeling of Pseudostrain
Hardening Cementitious Composites”, Journal of Materials in Civil Engineering,
May 2000, pp 147-156
26. Karihaloo B.L. and Wang, J, “Mechanics of Fiber-reinforced Cementitious
Composites”, Computer & Structures, 76, 2000 (19-34)
27. Kimber, A.C. and J.G. Keer. 1982. “On the Theoretic Average Crack Spacing in
Brittle Matrix Composites Containing Continuous Aligned Fibers,” J of Material
Science letter., 1:353:354
28. Kosa, Kenji and A.E. Naaman, “Corrosion of Steel Fiber Reinforced Concrete”,
ACI materials Journal, V.2, No.1, January – February 1990, pp.27-37
29. Kullaa, J ,”Micromechanics of multiple cracking Part II Statistical tensile
behavior”, Journal of Materials Science 33 (1998)
30. Leonhardt, F., “Crack Control in Concrete Structures,” IABSE Surveys No. S-
4/77, International Association for Bridge and Structural Engineering, Zurich,
1977, 26pp
31. Leung and Li (1991) “New strength based model for the debonding of
discontinuous fibers in an elastic matrix” Journal of Material Science, 26, 5996-
6010

293
32. Li, V.C., Wu, H. C., and Chan, Y.W. (1996), “Effect of plasma treatment of
polyethylene fibers on interface and cementitious composite properties”, J. Am.
Ceramics Soc., 79(3), 700-704
33. Li, V.C., Lin, Z. and Matsumoto, T., “Influence of Fiber Bridging on Structural
Size-Effect”, Int Solids Structures, Vol 35 No 31 1998, pp 4223-4238
34. Li, V.C.; Wang, S and Wu, C, “Tensile Strain-Hardening Behavior of Polyvinyl
Alcohol Engineered Cementitious Composite (PVA-ECC), ACI Material Journal,
November-December 2001, pp 483-492
35. Li, V.C.; Wu, Hwai-Chung.; Maalej, M and Mishra, D. K., “Tensile Behavior of
Cement-Based Composites with Random Discontinuous Steel Fibers”, Journal of
the American Ceramic Society, January 1996, pp 74-78
36. Li, V.C.; “From Micromechanics to Structural Engineering, The Design of
Cementitious Composites for Civil Engineering Applications”, Structural
Engineering/ Earthquake Engineering Vol 10, no 2 July 1993, pp 37-48
37. Lin, Zhong and Li, V.C., “Crack Bridging in Fiber Reinforced Cementitious
Composites with Slip-Hardening Interfaces”, Journal of Mec and Phys Solids,
1997, pp763-787
38. Matthews, F.L. and Rawlings, R.D., “Composite Materials: Engineering and
Science”, Woodhead Publishing, CRC Press, 470 pages.
39. Mitchell, Denis and Collins, Michael, P, “Prestressed Concrete Structures”,
Prentice Hall,1990
40. Mitchell, Denis: Hosseini, Homayoun and Mindess, Sidney, “The Effect of Steel
Fibers and Epoxy-Coated Reinforcement on Tension Stiffening and Cracking of
Reinforced Concrete”, ACI Materials Journal, January-February 1996, pp.61-67
41. Mobasher, B, “Recent Advances in Modeling fiber Reinforced Concrete”, Fiber
Reinforced Concrete From Theory to Practice, International Workshop on
Advances in Fiber Reinforced Concrete, Bergamo, Italy, September 24-25, 2004.
42. Murugappan, K., Paramasivan, P., and Tan, K. H., “Shear Response of
Reinforced Fibrous Concrete Beams Using Finite-Element Method”, Fiber
Reinforced Cement and Concrete, RILEM, 1992, pp 447-463
43. Naaman, A.E, “Ferrocement & Laminated Cementitious Composites,” Techno

294
Press 3000, Ann Arbor, 2000, 372 Pages.
44. Naaman, A.E.; Moavenzadeh, F and McGarry, F., “Probabilistic Analysis of Fiber
Reinforced Concerete, “Journal of Engineering Mechanics Division, ASCE, V.
100, No. EM2, Apr. 1974, pp.397-413
45. Naaman, A.E. and Reinhardt, H.W., “Characterization of High Performance Fiber
Reinforced Cement Composites,” Proceedings of 2nd International Workshop on
HPFRCC, Chapter 41, in High Performance Fiber Reinforced Cement
Composites: HPFRCC 2, RILEM, No 31, 1996, pp. 1-24.
46. Naaman, A.E. and H.W. Reinhardt, ,”Setting the Stage: Toward performance
based classification of FRC Composites,” High Performance Fiber Reinforced
Cement Composites (HPFRCC4), Workshop, Ann Arbor, USA 2003
47. Naaman, A.E., Moavenzadeh, F and McGarry, F.J., “Probabilistic Analysis of
Fiber-Reinforced Concrete”, ASCE Engineering Mechanics Division, April 1974
48. Naaman, A.E., and Homrich, J.R., “Tensile Stress-Strain Properties of SIFCON”,
ACI Materials Journal, May-June 1989, pp 244-251
49. Naaman, A.E., Otter D., and Najm H. (1991), “Elastic Modulus of SIFCON in
Tension and Compression., “ACI Materials Journal, Vol. 88, No.6, pp.603-612
50. Naaman, A.E. and Shah, S.P., “Fracture and Multiple Cracking of Cementitious
Composites”, Fracture Mechanics Applied To Brittle Materials, J.W. Freiman,
ed., ASTM, 1979, pp 183-201
51. Najm, H., and Naaman, A.E., “Prediction Model for the Elastic Modulus of High
Performance Fiber Reinforced Cement Based Composites, “ACI Material Journal,
May-June 1995, pp 304-314
52. Nammur, G.G., “Characterization of Bond in Steel Fiber Reinforced Cementitious
Composites under Tensile Loads”, The University of Michigan, 1989
53. Nelson, P, K; Li, V.C. and Kamada, T, “Fracture Toughness of Microfiber
Reinforced Cement Composites”, Journal of Materials in Civil Engineering,
September-October 2002, pp 384-391
54. Ortlepp, Regine; Hampel, Uwe and Curbach, Manfred;, “A New Approach for
Evaluating Bond Capacity of TRC Strengthening, Dresden University of
Technology, Department of Civil Engineering, 2005, Unpublished.
295
55. Peled, Alva and Mobasher, Barzin, “Pultruded Fabric-Cement Composites”, ACI
Materials Journal, January-February 2005, pp15-23
56. Romualdi, J.P., and Mandel, J.A., “Tensile Strength of Concrete Affected by
Uniformly Distributed and Closely Spaced Short Lengths of Wire
Reinforcement”, ACI Journal, Proceedings, vol 61, no.6. June 1964, pp 657-670
57. Rossi, Pierre, “Steel Fiber Reinforced Concretes (SFRC): An Example of French
Research”, ACI Material Journal, May-June 1994, pp273-279
58. Rossi, P. and Richer, S., “Numerical Modelling of Concrete Cracking Based on a
Stochastic Approach”, Materials and Structures”, 1987, pp 334-337
59. Rossi, P., and Wu, X., “Dimensioning and Numerical modeling of Metal Fiber
Reinfroced Concrete (MFRC) Structures”, Cement and Concrete Composites,
1992, pp. 195-198
60. Schutter, G., “Advanced Monitoring of Cracked Structures Using Video
Microscope and Automated Image Analysis”, NDT&E International, 35(4), 2002,
pp 209-212
61. Sirijaroonchai, Kittinun, “Modeling of High Performance Fiber-Reinforced
Cement Composite Structures, Ph-D Proposal, University of Michgian, 2005,
Unpublished.
62. Sujiravorakul, C., “Development of High Performance Fiber Reinforced Cement
Composites Using Twisted Polygonal Steel Fibers,” Ph.D. thesis, University of
Michigan, Ann Arbor, February 2001
63. Suwannakarn, S., Zhu, Z. and Brilakis, I. (2007) "Automated Air Pockets
Detection for Architectural Concrete Inspection", ASCE Construction Research
Congress, 6-8 May 2007, Freeport, Bahamas
64. Suwannakarn, S., El-Tawil, S., and Naaman, AE., “Experimental Observations on
the Tensile Response of Fiber Reinforced Cement Composites with Different
Fibers”, High Performance Fiber Reinforced Cement Composites (HPFRCC5)
Mainz, Germany – July 10-13, 2007 pp39-47
65. Suwannakarn, Naaman, AE., and El-Tawil, S., “ Stress Versus Crack Opening
Displacement Response of FRC Composites with Different Fibers”, Seventh Intnl.
In RILEM Proceedings PRO 60, "Fiber Reinforced Concrete: Design and

296
Applications,", Edited by Ravindra Gettu, Rilem Publications, France, 2008, pp.
1039-1054.
66. Swamy, R.N., Mangat, P.S., and Rao, C.V.S.K., “The Mechanics of Fiber
Reinforcement of Cement Matrices”, An International Symposium: Fiber
Reinforced Concrete, Publication SP-44, ACI, 1974, pp 1-28
67. Vecchio, F.J., and Collins, M.P., “Modified Compression Field Theory for
Reinforced Concrete Elements Subjected to Shear,” ACI Structural Journal, V.83,
No.2 Mar-Apr 1986, pp 219-231
68. Vellore S. Goapalaratnam and Surendra P. Shah, “Tensile Failure of Steel Fiber-
Reinforced Mortar”, Journal of Engineering Mechanics, No 5, May 1987
69. Visalvanich, K and A.E. Naaman, “Fracture Model for Fiber Reinforced
Concrete”, ACI Journal, March-April 1983
70. Vellore S. Goapalaratnam and Surendra P. Shah, “Tensile Failure of Steel Fiber-
Reinforced Mortar”, Journal of Engineering Mechanics, No 5, May 1987
71. Tjiptobroto, Prijatmadi, “Tensile Strain-hardening of High Performance Fiber
Reinforced Cement-Based Composites”, Ph-D thesis, University of Michigan,
Ann Arbor, 1991
72. Tjiptobroto, Prijatmadi and Hansen, Will, “Tensile Strain-hardening and Multiple
Cracking in High-Performance Cement-Based Composites Containing
Discontinuous Fibers”, ACI Materials Journal, January-February 1993.
73. Tung, P. C., Hwang, Y.R. & Wu, M.C., “The Development of a Mobile
Manipulator Imaging System for Bridge Crack Inspection”, Automation in
Construction, 11(6), 2002, pp 717-729
74. Wongtanasitcharoen, Thanasak, “A Study of The use of Fibers to Control Plastic
Shrinkage Cracking of Concrete”, Ph-D Proposal, University of Michgian, 2002,
Unpublished.
75. Wongtanasitcharoen, Thanasak, “Effect of Randomly Distributed Fibers on
Plastic Shrinkage Cracking of Cement Composites”, Ph-D thesis, University of
Michigan, Ann Arbor, 2005
76. Wu, H..,C, T. Matsumoto and V.C.Li. 1994, “Buckling of Bridging Fibers in
Compsotes.” , J. Materials Science Letters, Vol. 13, pp. 1800-1803, 1994.

297
77. Yan, Wu and Zhang, “A quantitative study on the surface crack pattern of
concrete with high content of steel fiber”, Cement and concrete research, 21
(2002).
78. Yang and Fisher, “Investigation of the Fiber Bridging Stress-Crack Opening
Relationship of Fiber Reinforced Cementitious Composites”, HPFRCC
Conference 5, 2006
79. Yang X.F. and K.M. Knowles. 1992. “The One Dimensional Car Parking
Problem and its Application to the Distribution of Spacing between Matrix Cracks
in Unidirectional Fiber-Reinforced Brittle Materials.” Journal of American
Ceramic 75 pp 141-147
80. Zeng W., Kwan, A.K.H. and Lee, P.K.K., “Direct Tension Test of Concrete”, ACI
Materials Journal, January-February 2001 (63-71)