Greening the Internet with Nano Data Centers - acm...
12
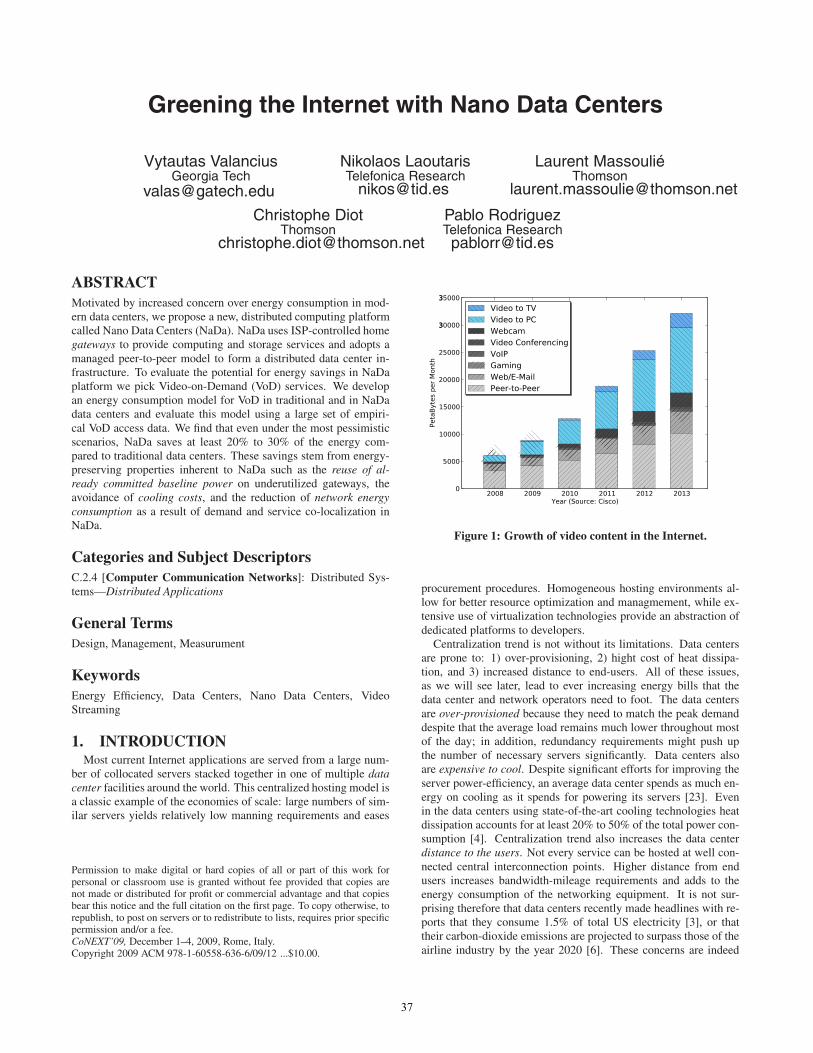
Greening the Internet with Nano Data Centers Vytautas Valancius Georgia Tech [email protected] Nikolaos Laoutaris Telefonica Research [email protected] Laurent Massoulié Thomson [email protected] Christophe Diot Thomson [email protected] Pablo Rodriguez Telefonica Research [email protected] ABSTRACT Motivated by increased concern over energy consumption in mod- ern data centers, we propose a new, distributed computing platform called Nano Data Centers (NaDa). NaDa uses ISP-controlled home gateways to provide computing and storage services and adopts a managed peer-to-peer model to form a distributed data center in- frastructure. To evaluate the potential for energy savings in NaDa platform we pick Video-on-Demand (VoD) services. We develop an energy consumption model for VoD in traditional and in NaDa data centers and evaluate this model using a large set of empiri- cal VoD access data. We find that even under the most pessimistic scenarios, NaDa saves at least 20% to 30% of the energy com- pared to traditional data centers. These savings stem from energy- preserving properties inherent to NaDa such as the reuse of al- ready committed baseline power on underutilized gateways, the avoidance of cooling costs, and the reduction of network energy consumption as a result of demand and service co-localization in NaDa. Categories and Subject Descriptors C.2.4 [Computer Communication Networks]: Distributed Sys- tems—Distributed Applications General Terms Design, Management, Measurument Keywords Energy Efficiency, Data Centers, Nano Data Centers, Video Streaming 1. INTRODUCTION Most current Internet applications are served from a large num- ber of collocated servers stacked together in one of multiple data center facilities around the world. This centralized hosting model is a classic example of the economies of scale: large numbers of sim- ilar servers yields relatively low manning requirements and eases Permission to make digital or hard copies of all or part of this work for personal or classroom use is granted without fee provided that copies are not made or distributed for profit or commercial advantage and that copies bear this notice and the full citation on the first page. To copy otherwise, to republish, to post on servers or to redistribute to lists, requires prior specific permission and/or a fee. CoNEXT’09, December 1–4, 2009, Rome, Italy. Copyright 2009 ACM 978-1-60558-636-6/09/12 ...$10.00. Figure 1: Growth of video content in the Internet. procurement procedures. Homogeneous hosting environments al- low for better resource optimization and managmement, while ex- tensive use of virtualization technologies provide an abstraction of dedicated platforms to developers. Centralization trend is not without its limitations. Data centers are prone to: 1) over-provisioning, 2) hight cost of heat dissipa- tion, and 3) increased distance to end-users. All of these issues, as we will see later, lead to ever increasing energy bills that the data center and network operators need to foot. The data centers are over-provisioned because they need to match the peak demand despite that the average load remains much lower throughout most of the day; in addition, redundancy requirements might push up the number of necessary servers significantly. Data centers also are expensive to cool. Despite significant efforts for improving the server power-efficiency, an average data center spends as much en- ergy on cooling as it spends for powering its servers [23]. Even in the data centers using state-of-the-art cooling technologies heat dissipation accounts for at least 20% to 50% of the total power con- sumption [4]. Centralization trend also increases the data center distance to the users. Not every service can be hosted at well con- nected central interconnection points. Higher distance from end users increases bandwidth-mileage requirements and adds to the energy consumption of the networking equipment. It is not sur- prising therefore that data centers recently made headlines with re- ports that they consume 1.5% of total US electricity [3], or that their carbon-dioxide emissions are projected to surpass those of the airline industry by the year 2020 [6]. These concerns are indeed 37
Transcript of Greening the Internet with Nano Data Centers - acm...
Greening the Internet with Nano Data Centers
Vytautas ValanciusGeorgia Tech
Nikolaos LaoutarisTelefonica Research
Laurent MassouliéThomson
Christophe DiotThomson
Pablo RodriguezTelefonica [email protected]
ABSTRACTMotivated by increased concern over energy consumption in mod-ern data centers, we propose a new, distributed computing platformcalled Nano Data Centers (NaDa). NaDa uses ISP-controlled homegateways to provide computing and storage services and adopts amanaged peer-to-peer model to form a distributed data center in-frastructure. To evaluate the potential for energy savings in NaDaplatform we pick Video-on-Demand (VoD) services. We developan energy consumption model for VoD in traditional and in NaDadata centers and evaluate this model using a large set of empiri-cal VoD access data. We find that even under the most pessimisticscenarios, NaDa saves at least 20% to 30% of the energy com-pared to traditional data centers. These savings stem from energy-preserving properties inherent to NaDa such as the reuse of al-ready committed baseline power on underutilized gateways, theavoidance of cooling costs, and the reduction of network energyconsumption as a result of demand and service co-localization inNaDa.
Categories and Subject DescriptorsC.2.4 [Computer Communication Networks]: Distributed Sys-tems—Distributed Applications
General TermsDesign, Management, Measurument
KeywordsEnergy Efficiency, Data Centers, Nano Data Centers, VideoStreaming
1. INTRODUCTIONMost current Internet applications are served from a large num-
ber of collocated servers stacked together in one of multiple datacenter facilities around the world. This centralized hosting model isa classic example of the economies of scale: large numbers of sim-ilar servers yields relatively low manning requirements and eases
Permission to make digital or hard copies of all or part of this work forpersonal or classroom use is granted without fee provided that copies arenot made or distributed for profit or commercial advantage and that copiesbear this notice and the full citation on the first page. To copy otherwise, torepublish, to post on servers or to redistribute to lists, requires prior specificpermission and/or a fee.CoNEXT’09, December 1–4, 2009, Rome, Italy.Copyright 2009 ACM 978-1-60558-636-6/09/12 ...$10.00.
2008 2009 2010 2011 2012 2013Year (Source: Cisco)
0
000
10000
1 000
20000
2 000
30000
3 000
PetaBytesperMonth
Video to TV
Video to PC
Webcam
Video Conferencing
VoIP
Gaming
Web/E-Mail
Peer-to-Peer
Figure 1: Growth of video content in the Internet.
procurement procedures. Homogeneous hosting environments al-low for better resource optimization and managmement, while ex-tensive use of virtualization technologies provide an abstraction ofdedicated platforms to developers.
Centralization trend is not without its limitations. Data centersare prone to: 1) over-provisioning, 2) hight cost of heat dissipa-tion, and 3) increased distance to end-users. All of these issues,as we will see later, lead to ever increasing energy bills that thedata center and network operators need to foot. The data centersare over-provisioned because they need to match the peak demanddespite that the average load remains much lower throughout mostof the day; in addition, redundancy requirements might push upthe number of necessary servers significantly. Data centers alsoare expensive to cool. Despite significant efforts for improving theserver power-efficiency, an average data center spends as much en-ergy on cooling as it spends for powering its servers [23]. Evenin the data centers using state-of-the-art cooling technologies heatdissipation accounts for at least 20% to 50% of the total power con-sumption [4]. Centralization trend also increases the data centerdistance to the users. Not every service can be hosted at well con-nected central interconnection points. Higher distance from endusers increases bandwidth-mileage requirements and adds to theenergy consumption of the networking equipment. It is not sur-prising therefore that data centers recently made headlines with re-ports that they consume 1.5% of total US electricity [3], or thattheir carbon-dioxide emissions are projected to surpass those of theairline industry by the year 2020 [6]. These concerns are indeed
37
expected to amplify in view of growth projections of data center-hosted applications like video distribution [13] (Figure 1).
While data centers are an example of centralization trend, an-other, opposite trend manifests though Peer-to-Peer (P2P) systems.The decentralized P2P systems free-ride on end-user computersand, being spatially distributed, incur little or no heat dissipationcosts. In addition, some P2P systems can exploit locality and re-duce the redundancy requirements, because each P2P user oftenis P2P server at the same time. Unfortunately, conventional P2Psystem performance typically suffers from free-riding, node churn,and lack of awareness of underlying network conditions.
Motivated by the problem of energy consumption, in this paperwe propose a new way to deliver Internet services based on ourNano Data Center (NaDa) platform. The key idea behind NaDais to create a distributed service platform based on tiny managed“servers” located at the edges of the network. In NaDa, both thenano servers and access bandwidth to those servers are controlledand managed by a single entity (typically an ISP) similarly to whatis suggested in [20, 27]. Significant opportunities already exist forhosting such tiny servers on ISP owned devices like Triple-Playgateways and DSL/cable modems that sit behind standard broad-band accesses. Such gateways form the core of the NaDa platformand, in theory, can host many of the Internet services currentlyhosted in the data centers. In this paper, however, we will focuson video streaming services, which, as shown in Figure 1, exhib-ited large growth in past few years. In addition, video streamingservices allow for easier energy usage modeling and simulation.Figure 2 shows a high level architecture of such streaming archi-tecture using home gateways as nano servers.
NaDa follows a P2P philosophy, but contrary to typical P2P,NaDa is coordinated and managed by an ISP that installs and runsthe gateways that act as nano servers, as well as the network thatinterconnects them. Due to it’s managed nature, NaDa avoids mostof the shortcomings of classic unmanaged P2P. ISPs can easily im-plement NaDa by providing new customers with slightly over di-mensioned gateways, whose extra storage and bandwidth resourceswould be used by NaDa to implement services like video hosting,all of which will be totally isolated from the end-user via virtual-ization technologies. Thus, with a rather small investment in highercapacity devices, ISPs can go beyond their traditional role as com-munication carriers, and enter the potentially highly profitable ser-vice and content hosting market.
Obviously designing a system like NaDa spans a magnitude ofissues that cannot all be covered here and thus in this paper wemainly focus on energy efficiency which, as discussed earlier, isprobably the Achilles heel of monolithic data centers. As we willdemonstrate in coming sections, NaDa can reduce the energy costsof offering Internet services, particularly content distribution. Thesavings come in three ways. First, through improved heat dissi-pation stemming from the distributed nature of NaDa which min-imizes the need for cooling. Second, through traffic localizationresulting from the co-location between NaDa and end users. Fi-nally, NaDa performs efficient energy use by running on gatewaysthat are already powered up and utilized for content access or otherservices. NaDa avoids wasting the high baseline power alreadypaid for in an online gateway. We elaborate further on these energysaving aspects in Section 2.
Our main contributions are the following. We develop a modelto evaluate the energy needed to provide services in both central-ized data centers and distributed NaDa. This model relies on a largecollection of empirical data from various sources, including powermeasurements of operational content distribution servers and end-user devices (Section 3). We then apply this model in the evalua-
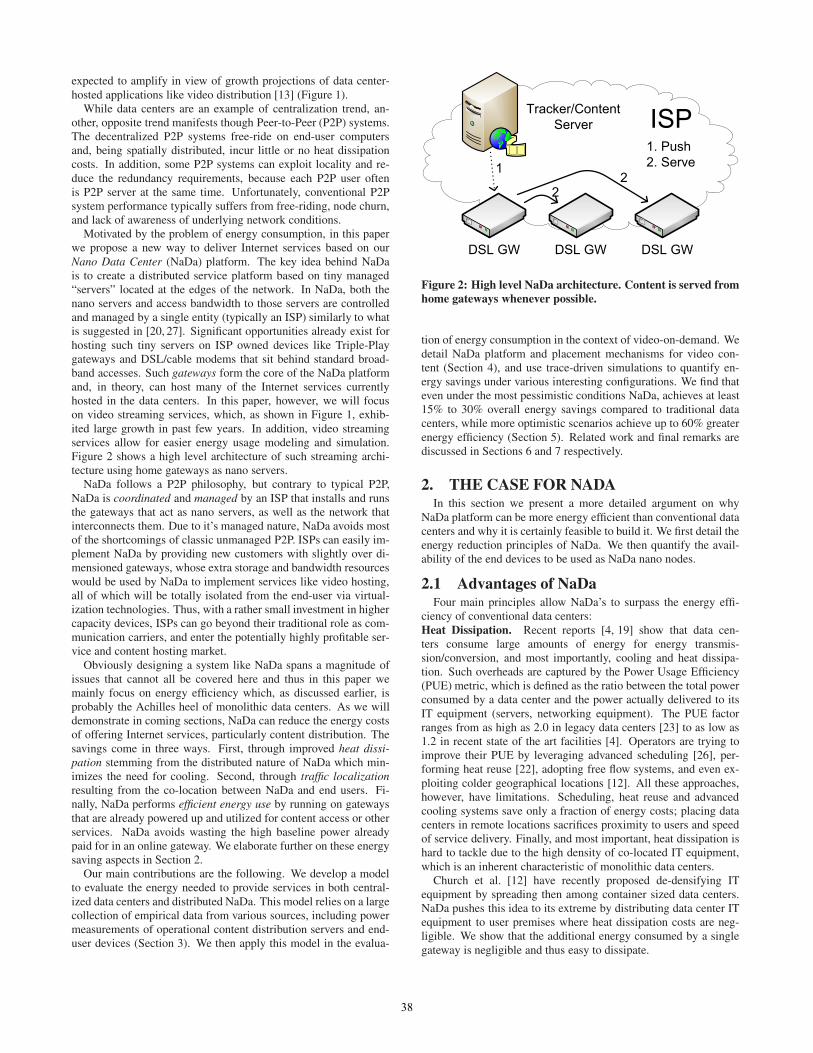
Tracker/ContentServer
DSL GW DSL GW DSL GW
1
22
1. Push2. Serve
Figure 2: High level NaDa architecture. Content is served fromhome gateways whenever possible.
tion of energy consumption in the context of video-on-demand. Wedetail NaDa platform and placement mechanisms for video con-tent (Section 4), and use trace-driven simulations to quantify en-ergy savings under various interesting configurations. We find thateven under the most pessimistic conditions NaDa, achieves at least15% to 30% overall energy savings compared to traditional datacenters, while more optimistic scenarios achieve up to 60% greaterenergy efficiency (Section 5). Related work and final remarks arediscussed in Sections 6 and 7 respectively.
2. THE CASE FOR NADAIn this section we present a more detailed argument on why
NaDa platform can be more energy efficient than conventional datacenters and why it is certainly feasible to build it. We first detail theenergy reduction principles of NaDa. We then quantify the avail-ability of the end devices to be used as NaDa nano nodes.
2.1 Advantages of NaDaFour main principles allow NaDa’s to surpass the energy effi-
ciency of conventional data centers:Heat Dissipation. Recent reports [4, 19] show that data cen-ters consume large amounts of energy for energy transmis-sion/conversion, and most importantly, cooling and heat dissipa-tion. Such overheads are captured by the Power Usage Efficiency(PUE) metric, which is defined as the ratio between the total powerconsumed by a data center and the power actually delivered to itsIT equipment (servers, networking equipment). The PUE factorranges from as high as 2.0 in legacy data centers [23] to as low as1.2 in recent state of the art facilities [4]. Operators are trying toimprove their PUE by leveraging advanced scheduling [26], per-forming heat reuse [22], adopting free flow systems, and even ex-ploiting colder geographical locations [12]. All these approaches,however, have limitations. Scheduling, heat reuse and advancedcooling systems save only a fraction of energy costs; placing datacenters in remote locations sacrifices proximity to users and speedof service delivery. Finally, and most important, heat dissipation ishard to tackle due to the high density of co-located IT equipment,which is an inherent characteristic of monolithic data centers.
Church et al. [12] have recently proposed de-densifying ITequipment by spreading then among container sized data centers.NaDa pushes this idea to its extreme by distributing data center ITequipment to user premises where heat dissipation costs are neg-ligible. We show that the additional energy consumed by a singlegateway is negligible and thus easy to dissipate.
38
Service Proximity. Content providers build data centers in mul-tiple locations to reduce service delays/communication costs andimprove fault tolerance. Because of high construction costs, only asmall number of data centers are built. They then have to be placedat major network interconnection points which are often subject tohigh real estate costs. Even at such locations, classic data centersare relatively far from end users in comparison to servers of con-tent distribution networks, and a fortiori of NaDa, whose PoPs areinside user residences. Apart from reducing delays, service prox-imity reduces the distance that information has to travel and thusalso the energy in powering and cooling the networking equipmentthat has to carry it.Self-scalability. Conventional data centers and the networks sup-porting them are provisioned for peak load, which leads to ratherlow average utilization [23]. Utilization is worsen further by thefact that backup equipment needs to be powered and keep runningso as to be able to receive immediately any load resulting fromother failing equipment. Unlike conventional data centers, NaDais largely self adaptive. As the user population grows, so does thenumber of available gateways to NaDa. Thus, NaDa reduces over-provisioning while providing built-in redundancy.Energy efficiency. Today’s routers and servers spend most of theirenergy on the baseline activities such as running the fans, spinningthe disks, powering the backplane, and powering the memory. Evenin an idle state, modern systems can be consuming anything from50% to 80% of the power consumed under maximum load [7, 10].Therefore, operators constantly try to maximize the utilization oftheir servers, but this becomes increasingly complicated due to thedaily variations of load, as illustrated in the following subsection.Even though operators have perfected service load balancing, idleservers are not necessarily switched off due to the need to keepspare capacity readily available. The problem is even more promi-nent in networks, where it is hard to shut off a router at off-peaktimes [24]. In contrast, no baseline powering is paid by NaDa, as itruns on gateways that are already on for servicing another purpose(basic connectivity).
2.2 Gateway availabilityRe-using the already committed base-line power of DSL gate-
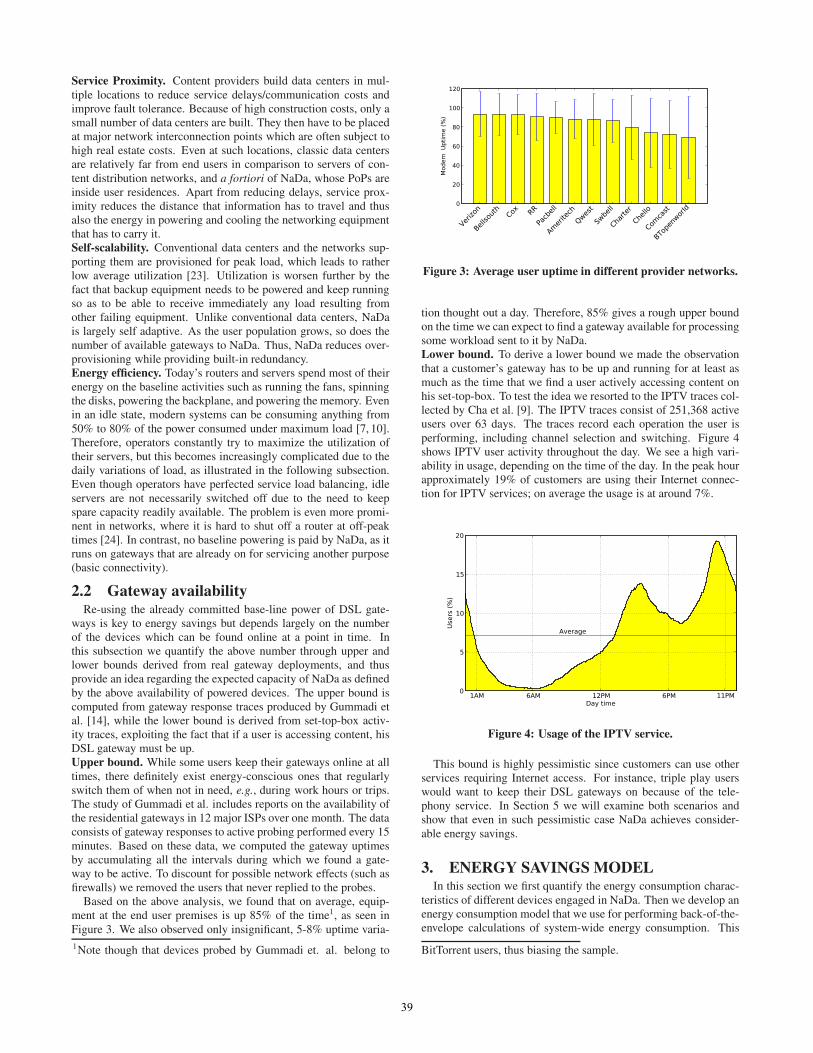
ways is key to energy savings but depends largely on the numberof the devices which can be found online at a point in time. Inthis subsection we quantify the above number through upper andlower bounds derived from real gateway deployments, and thusprovide an idea regarding the expected capacity of NaDa as definedby the above availability of powered devices. The upper bound iscomputed from gateway response traces produced by Gummadi etal. [14], while the lower bound is derived from set-top-box activ-ity traces, exploiting the fact that if a user is accessing content, hisDSL gateway must be up.Upper bound. While some users keep their gateways online at alltimes, there definitely exist energy-conscious ones that regularlyswitch them of when not in need, e.g., during work hours or trips.The study of Gummadi et al. includes reports on the availability ofthe residential gateways in 12 major ISPs over one month. The dataconsists of gateway responses to active probing performed every 15minutes. Based on these data, we computed the gateway uptimesby accumulating all the intervals during which we found a gate-way to be active. To discount for possible network effects (such asfirewalls) we removed the users that never replied to the probes.
Based on the above analysis, we found that on average, equip-ment at the end user premises is up 85% of the time1, as seen inFigure 3. We also observed only insignificant, 5-8% uptime varia-1Note though that devices probed by Gummadi et. al. belong to
Verizon
Bellsouth
Cox R
R
Pacbell
Ameritech
Qwest
Swbell
Charter
Chello
Comcast
BTopenworld
0
20
40
60
80
100
120
Modem
Uptime(%
)
Figure 3: Average user uptime in different provider networks.
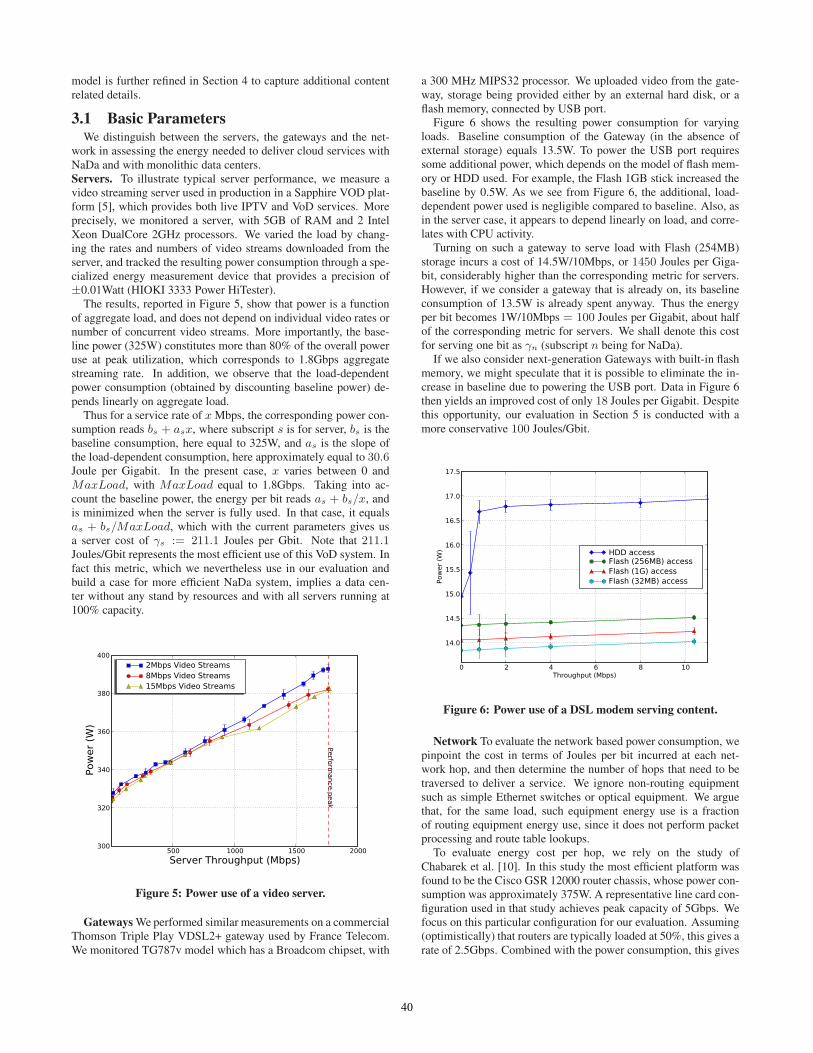
tion thought out a day. Therefore, 85% gives a rough upper boundon the time we can expect to find a gateway available for processingsome workload sent to it by NaDa.Lower bound. To derive a lower bound we made the observationthat a customer’s gateway has to be up and running for at least asmuch as the time that we find a user actively accessing content onhis set-top-box. To test the idea we resorted to the IPTV traces col-lected by Cha et al. [9]. The IPTV traces consist of 251,368 activeusers over 63 days. The traces record each operation the user isperforming, including channel selection and switching. Figure 4shows IPTV user activity throughout the day. We see a high vari-ability in usage, depending on the time of the day. In the peak hourapproximately 19% of customers are using their Internet connec-tion for IPTV services; on average the usage is at around 7%.
1AM 6AM 12PM 6PM 11PMDay time
0
5
10
15
20
Users
(%)
Average
Figure 4: Usage of the IPTV service.
This bound is highly pessimistic since customers can use otherservices requiring Internet access. For instance, triple play userswould want to keep their DSL gateways on because of the tele-phony service. In Section 5 we will examine both scenarios andshow that even in such pessimistic case NaDa achieves consider-able energy savings.
3. ENERGY SAVINGS MODELIn this section we first quantify the energy consumption charac-
teristics of different devices engaged in NaDa. Then we develop anenergy consumption model that we use for performing back-of-the-envelope calculations of system-wide energy consumption. This
BitTorrent users, thus biasing the sample.
39
model is further refined in Section 4 to capture additional contentrelated details.
3.1 Basic ParametersWe distinguish between the servers, the gateways and the net-
work in assessing the energy needed to deliver cloud services withNaDa and with monolithic data centers.Servers. To illustrate typical server performance, we measure avideo streaming server used in production in a Sapphire VOD plat-form [5], which provides both live IPTV and VoD services. Moreprecisely, we monitored a server, with 5GB of RAM and 2 IntelXeon DualCore 2GHz processors. We varied the load by chang-ing the rates and numbers of video streams downloaded from theserver, and tracked the resulting power consumption through a spe-cialized energy measurement device that provides a precision of±0.01Watt (HIOKI 3333 Power HiTester).
The results, reported in Figure 5, show that power is a functionof aggregate load, and does not depend on individual video rates ornumber of concurrent video streams. More importantly, the base-line power (325W) constitutes more than 80% of the overall poweruse at peak utilization, which corresponds to 1.8Gbps aggregatestreaming rate. In addition, we observe that the load-dependentpower consumption (obtained by discounting baseline power) de-pends linearly on aggregate load.
Thus for a service rate of x Mbps, the corresponding power con-sumption reads bs + asx, where subscript s is for server, bs is thebaseline consumption, here equal to 325W, and as is the slope ofthe load-dependent consumption, here approximately equal to 30.6Joule per Gigabit. In the present case, x varies between 0 andMaxLoad, with MaxLoad equal to 1.8Gbps. Taking into ac-count the baseline power, the energy per bit reads as + bs/x, andis minimized when the server is fully used. In that case, it equalsas + bs/MaxLoad, which with the current parameters gives usa server cost of γs := 211.1 Joules per Gbit. Note that 211.1Joules/Gbit represents the most efficient use of this VoD system. Infact this metric, which we nevertheless use in our evaluation andbuild a case for more efficient NaDa system, implies a data cen-ter without any stand by resources and with all servers running at100% capacity.
500 1000 1500 2000
Server Throughput (Mbps)
300
320
340
360
380
400
Power(W
)
Perfo
rmancepeak
2Mbps Video Streams
8Mbps Video Streams
15Mbps Video Streams
Figure 5: Power use of a video server.
Gateways We performed similar measurements on a commercialThomson Triple Play VDSL2+ gateway used by France Telecom.We monitored TG787v model which has a Broadcom chipset, with
a 300 MHz MIPS32 processor. We uploaded video from the gate-way, storage being provided either by an external hard disk, or aflash memory, connected by USB port.
Figure 6 shows the resulting power consumption for varyingloads. Baseline consumption of the Gateway (in the absence ofexternal storage) equals 13.5W. To power the USB port requiressome additional power, which depends on the model of flash mem-ory or HDD used. For example, the Flash 1GB stick increased thebaseline by 0.5W. As we see from Figure 6, the additional, load-dependent power used is negligible compared to baseline. Also, asin the server case, it appears to depend linearly on load, and corre-lates with CPU activity.
Turning on such a gateway to serve load with Flash (254MB)storage incurs a cost of 14.5W/10Mbps, or 1450 Joules per Giga-bit, considerably higher than the corresponding metric for servers.However, if we consider a gateway that is already on, its baselineconsumption of 13.5W is already spent anyway. Thus the energyper bit becomes 1W/10Mbps = 100 Joules per Gigabit, about halfof the corresponding metric for servers. We shall denote this costfor serving one bit as γn (subscript n being for NaDa).
If we also consider next-generation Gateways with built-in flashmemory, we might speculate that it is possible to eliminate the in-crease in baseline due to powering the USB port. Data in Figure 6then yields an improved cost of only 18 Joules per Gigabit. Despitethis opportunity, our evaluation in Section 5 is conducted with amore conservative 100 Joules/Gbit.
0 2 4 6 8 10Throughput (Mbps)
14.0
14.5
15.0
15.5
16.0
16.5
17.0
17.5
Power(W
) HDD accessFlash (256MB) access
Flash (1G) access
Flash (32MB) access
Figure 6: Power use of a DSL modem serving content.
Network To evaluate the network based power consumption, wepinpoint the cost in terms of Joules per bit incurred at each net-work hop, and then determine the number of hops that need to betraversed to deliver a service. We ignore non-routing equipmentsuch as simple Ethernet switches or optical equipment. We arguethat, for the same load, such equipment energy use is a fractionof routing equipment energy use, since it does not perform packetprocessing and route table lookups.
To evaluate energy cost per hop, we rely on the study ofChabarek et al. [10]. In this study the most efficient platform wasfound to be the Cisco GSR 12000 router chassis, whose power con-sumption was approximately 375W. A representative line card con-figuration used in that study achieves peak capacity of 5Gbps. Wefocus on this particular configuration for our evaluation. Assuming(optimistically) that routers are typically loaded at 50%, this gives arate of 2.5Gbps. Combined with the power consumption, this gives
40
a ratio of 375W/2.5Gbps=150 Joules per Gigabit. We shall denotethis cost per bit as γr (subscript r being for router).
We now evaluate the typical number of hops involved in datatransfers. We envision two distinct scenarios: 1) NaDa used acrossthe wide-area Internet, and 2) NaDa used within an ISP. To findout distances to servers and between clients on the Internet we em-ployed the DipZoom measurement [28]. DipZoom has about 300measurement nodes; the clients provided by DipZoom are fromNorth America, Europe and Asia. We grouped these clients basedon the country, city or autonomous system they belong to. Table 1shows the resulting data. The “Same DSLAM” line is not fromDipZoom, and gives the hop count between two Gateways underthe same DSLAM, assuming the DSLAM has routing capability.
The same Table 1 shows the typical distance between clients inthe ISP in the same metropolitan area and distance from clients toVoD servers. We obtained these metrics from private communi-cation with several large service providers. We recognize that itis hard to find both meaningful router efficiency metrics and per-fect distance measurements that would satisfy all network scenar-ios. Therefore, in our evaluation section we provide NaDa multipleefficiency results for differing assumptions about the underlyingnetwork properties.
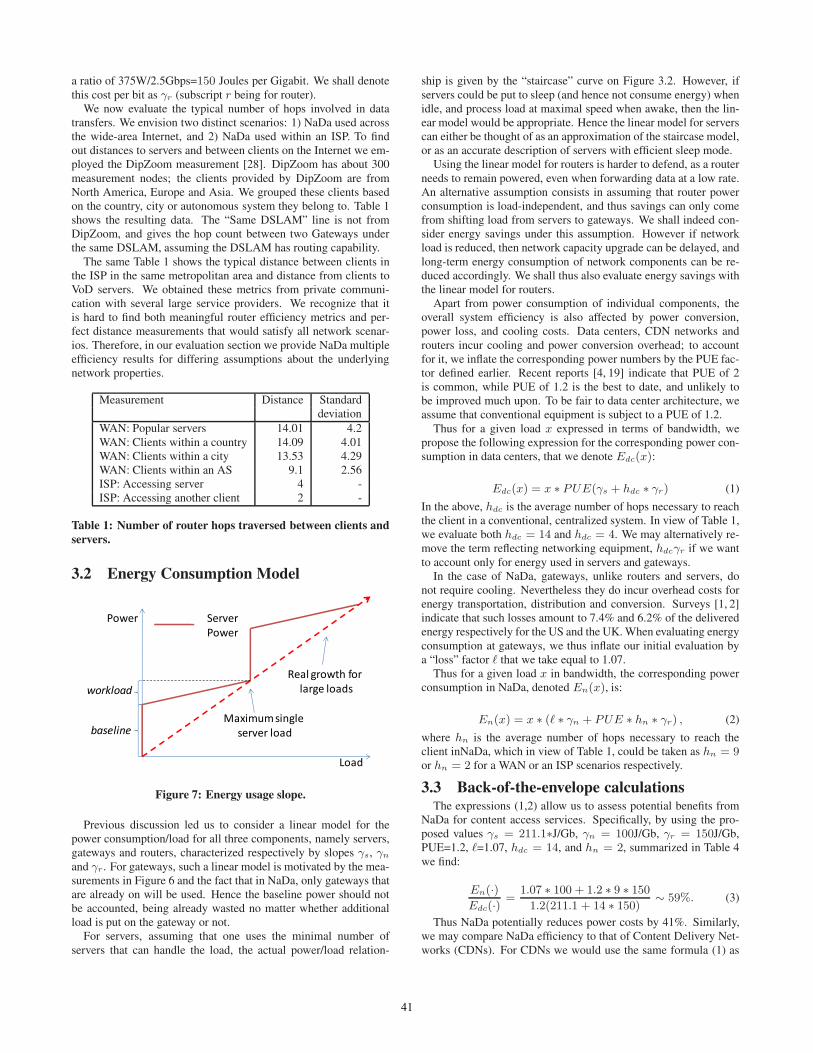
Measurement Distance Standarddeviation
WAN: Popular servers 14.01 4.2WAN: Clients within a country 14.09 4.01WAN: Clients within a city 13.53 4.29WAN: Clients within an AS 9.1 2.56ISP: Accessing server 4 -ISP: Accessing another client 2 -
Table 1: Number of router hops traversed between clients andservers.
3.2 Energy Consumption Model
Load
Power ServerPower
Real growth forlarge loads
baseline
workload
Maximumsingleserver load
Figure 7: Energy usage slope.
Previous discussion led us to consider a linear model for thepower consumption/load for all three components, namely servers,gateways and routers, characterized respectively by slopes γs, γn
and γr. For gateways, such a linear model is motivated by the mea-surements in Figure 6 and the fact that in NaDa, only gateways thatare already on will be used. Hence the baseline power should notbe accounted, being already wasted no matter whether additionalload is put on the gateway or not.
For servers, assuming that one uses the minimal number ofservers that can handle the load, the actual power/load relation-
ship is given by the “staircase” curve on Figure 3.2. However, ifservers could be put to sleep (and hence not consume energy) whenidle, and process load at maximal speed when awake, then the lin-ear model would be appropriate. Hence the linear model for serverscan either be thought of as an approximation of the staircase model,or as an accurate description of servers with efficient sleep mode.
Using the linear model for routers is harder to defend, as a routerneeds to remain powered, even when forwarding data at a low rate.An alternative assumption consists in assuming that router powerconsumption is load-independent, and thus savings can only comefrom shifting load from servers to gateways. We shall indeed con-sider energy savings under this assumption. However if networkload is reduced, then network capacity upgrade can be delayed, andlong-term energy consumption of network components can be re-duced accordingly. We shall thus also evaluate energy savings withthe linear model for routers.
Apart from power consumption of individual components, theoverall system efficiency is also affected by power conversion,power loss, and cooling costs. Data centers, CDN networks androuters incur cooling and power conversion overhead; to accountfor it, we inflate the corresponding power numbers by the PUE fac-tor defined earlier. Recent reports [4, 19] indicate that PUE of 2is common, while PUE of 1.2 is the best to date, and unlikely tobe improved much upon. To be fair to data center architecture, weassume that conventional equipment is subject to a PUE of 1.2.
Thus for a given load x expressed in terms of bandwidth, wepropose the following expression for the corresponding power con-sumption in data centers, that we denote Edc(x):
Edc(x) = x ∗ PUE(γs + hdc ∗ γr) (1)
In the above, hdc is the average number of hops necessary to reachthe client in a conventional, centralized system. In view of Table 1,we evaluate both hdc = 14 and hdc = 4. We may alternatively re-move the term reflecting networking equipment, hdcγr if we wantto account only for energy used in servers and gateways.
In the case of NaDa, gateways, unlike routers and servers, donot require cooling. Nevertheless they do incur overhead costs forenergy transportation, distribution and conversion. Surveys [1, 2]indicate that such losses amount to 7.4% and 6.2% of the deliveredenergy respectively for the US and the UK. When evaluating energyconsumption at gateways, we thus inflate our initial evaluation bya “loss” factor � that we take equal to 1.07.
Thus for a given load x in bandwidth, the corresponding powerconsumption in NaDa, denoted En(x), is:
En(x) = x ∗ (� ∗ γn + PUE ∗ hn ∗ γr) , (2)
where hn is the average number of hops necessary to reach theclient inNaDa, which in view of Table 1, could be taken as hn = 9or hn = 2 for a WAN or an ISP scenarios respectively.
3.3 Back-of-the-envelope calculationsThe expressions (1,2) allow us to assess potential benefits from
NaDa for content access services. Specifically, by using the pro-posed values γs = 211.1∗J/Gb, γn = 100J/Gb, γr = 150J/Gb,PUE=1.2, �=1.07, hdc = 14, and hn = 2, summarized in Table 4we find:
En(·)Edc(·) =
1.07 ∗ 100 + 1.2 ∗ 9 ∗ 150
1.2(211.1 + 14 ∗ 150)∼ 59%. (3)
Thus NaDa potentially reduces power costs by 41%. Similarly,we may compare NaDa efficiency to that of Content Delivery Net-works (CDNs). For CDNs we would use the same formula (1) as
41
for data centers, except that we would set the hop count term tohcdn = 4 in view of Table 1. The corresponding expression, thatwe may denote Ecdn, would yield the following evaluation:
En(·)Ecdn(·) =
1.07 ∗ 100 + 1.2 ∗ 2 ∗ 150
1.2(211.1 + 4 ∗ 150)∼ 38%. (4)
Thus we may expect energy savings of the order of 62% in NaDacompared to CDNs.
When we consider only gateway and server energy, by removingthe network component in the above ratios, we arrive at a value of1.07∗100/(1.2∗211.1) ∼ 42%, thus savings on data centers only(i.e. network excluded) of potentially 58%.
The above values are idealized values of course. To quantifymore precisely a concrete application scenario, e.g., NaDa-basedVoD, many more parameters need to be considered including thememory used at Gateways, the placement strategies, and the popu-larity profile of content. We perform an in-depth evaluation of theseimpacts in the next section.
4. VIDEO-ON-DEMAND SERVICENaDa platform is ambitious in the sense that it could eventually
host various third party distributed applications (e.g. distributedgames, file sharing, social networks, web hosting, etc). However,designing applications to run on such highly distributed environ-ment is non-trivial (security concerns, data consistency and parti-tioning, etc) and thus it is outside of the scope of this paper. Tohighlight the benefits of NaDa in terms of energy savings, insteadwe focus on one particular application: a distributed VoD system.Video content distribution will likely be the main driver of Internettraffic growth in the next 5 years [13].
Results on the energy consumption of VoD delivered from NaDa,evaluated via event-driven simulations, are presented in Section 5.In this Section we set the stage by describing the system architec-ture, the data sets, the content placement method and the simulationsetup used in the evaluation.
4.1 VoD Service Architecture in NaDaThe fundamental element in NaDa is the gateway. In addition,
a tracker manages gateway resources. Finally, content servers takecare of ingesting content in the system, and provide a fall-back op-tion under shortage of gateway resources. We now detail furtherthe roles of these three key components:
Gateways provide storage, and bandwidth resources. In the caseof VoD, they store full or partial replicas of video content objects,and provide uplink bandwidth to deliver these objects to other gate-ways. NaDa gateways have two separate virtual circuits on theirupstream line with different capacities allocated to each: one vir-tual circuit is dedicated to conventional Internet use while the otheris allocated for NaDa use. Such setting is challenging to achieveon cable networks, but readily available with DSL and fiber-to-the-home technologies. In the case of DSL service providers can sepa-rate and contain the traffic from gateways using different VPI/VCIdesignators, while in the case of FTTH networks ISPs can useVLANs or GPON compatible technologies. In our evaluation weassume gateways with 1Mbps to 2Mbps upstream speeds.
Current home gateways today are (almost) always on, making ef-ficient use of baseline energy an easy target. In the future however,we envision that gateways will have the ability to enter so called“sleep mode”. Such gateways operate as usual when they are in ac-tive use and switch to a sleep mode to preserve power when no useractivity is present. While in practice the gateways can be activedue to normal Internet use, in the most pessimistic case for NaDa
the gateways can serve the content only when the same gateway isused to retrieve some other content. As we shall see, even in such apessimistic scenario we can achieve up to 15-30% energy savings.
It may be necessary to provide incentives for home users to hostNaDa gateways, especially since the required power is paid for bythe users. This could be achieved through “miles” or service dis-count schemes introduced to reward users. However, as we can seein the Figure 11, the typical daily load on a gateway is about 4000megabits of traffic which translates to an additional 2.5 kW/hour ayear. Given the price range of 10-20 cents per kW-hour, this addi-tional energy cost to a single home user is not significant.
The tracker coordinates all VoD-related activities in NaDa. Itmonitors the availability and content possession of gateways, an-swers requests for content by lists of gateways holding the desiredcontent. It is then up to the requesting gateway to download movieparts from other gateways. Such downloads are performed at arate equal to the minimum of the spare uplink bandwidth and thestreaming rate; if spare uplink bandwidth is less than streamingrate, other gateways are contacted in parallel. When the total down-load rate from gateways is less than the streaming rate, contentservers provide the missing data at the desired speed.
The tracker also has the role to inform gateways of suitable con-tent updates to perform. Such content updates are performed at lownetwork utilization periods, possibly by using multicast. A cachedcontent copy at the gateway can be retrieved numerous times thusrendering content update costs marginal.
Content servers provide the content from legacy data centersor caches. Content servers can belong to the entity that managesthe NaDa platform, or to content providers. Their primary roleis to pre-load gateways in offline mode with content that they cansubsequently re-distribute. Content servers can also serve contentrequests online if no gateway can treat the request.
We evaluate NaDa platform by performing content placementand access simulation in a large metropolitan area served by onePoP and a few thousands of users. As a consequence, each useris assumed to have identical network distance to every other userin a network (this is what would happen on a mid-sized metropoli-tan area network). Similarly every user has the same distance tothe content servers. We describe the data sets we use to drive thesimulations and then proceed to the VoD placement and servingalgorithms.
4.2 DatasetsWe use content access traces from three sources (see Table 2):
(1) Netflix movie database, (2) Youtube traces [8], and (3) IPTVaccess statistics from a large ISP [9]. Netflix movie database con-tains the number of rentals for each movie - we interpret a rental asa content access. For each movie in Netflix database, we assumethe same duration, namely 90 minutes. Youtube traces contain bothview count and the length of each video object. The IPTV statis-tics represent a service with approximately 250,000 customers andcontains anonymized 60 day-long trace. We take a random sampleof 2,000 users and we treat each TV program as a separate ob-ject. While today IPTV programs are mostly streamed to usersusing multicast, service evolutions such as catch-up TV will makeIPTV look more and more as another VoD service. Finally we usea mixed trace which is an equal mix of all the content in the threetraces mentioned above.
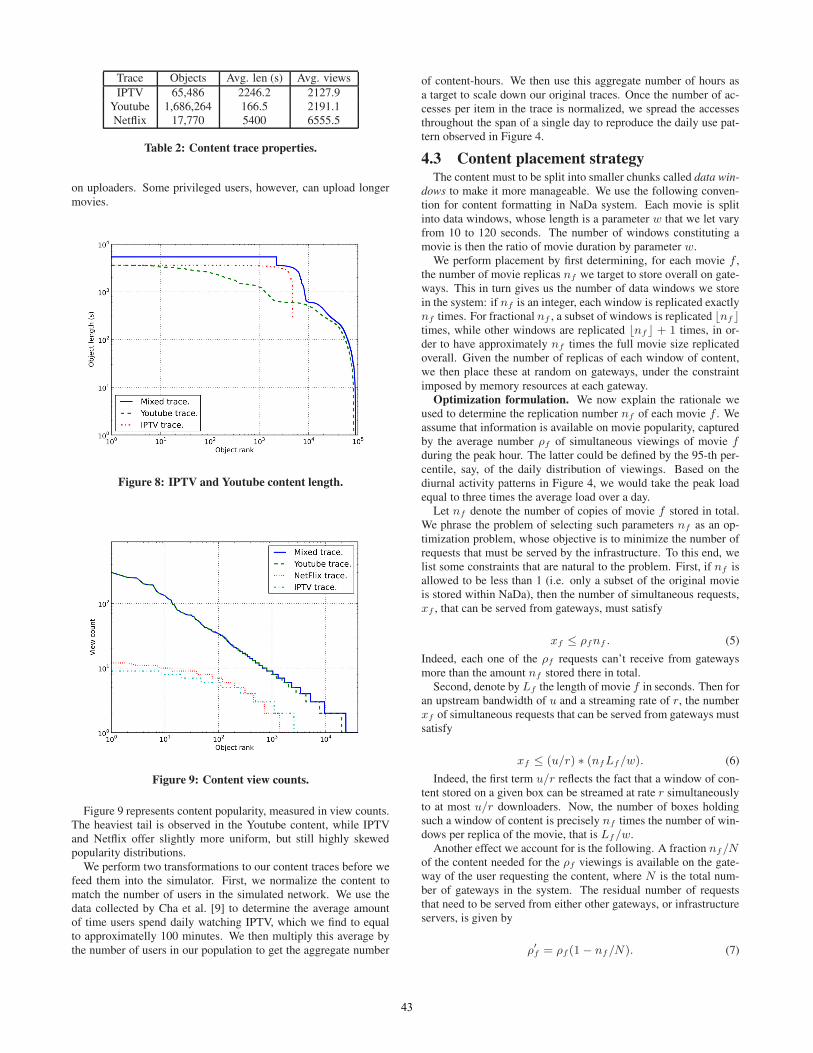
Figures 8 and 9 show length and popularity distributions for thetraces. Netflix is not plotted in the length figure as all movies areassumed to have the same length. Length of IPTV content is almostconstant, while Youtube content duration is more variable. The sec-ond dip in the Youtube curve reflects the 10 minute limit imposed
42
Trace Objects Avg. len (s) Avg. viewsIPTV 65,486 2246.2 2127.9
Youtube 1,686,264 166.5 2191.1Netflix 17,770 5400 6555.5
Table 2: Content trace properties.
on uploaders. Some privileged users, however, can upload longermovies.
Figure 8: IPTV and Youtube content length.
Figure 9: Content view counts.
Figure 9 represents content popularity, measured in view counts.The heaviest tail is observed in the Youtube content, while IPTVand Netflix offer slightly more uniform, but still highly skewedpopularity distributions.
We perform two transformations to our content traces before wefeed them into the simulator. First, we normalize the content tomatch the number of users in the simulated network. We use thedata collected by Cha et al. [9] to determine the average amountof time users spend daily watching IPTV, which we find to equalto approximatelly 100 minutes. We then multiply this average bythe number of users in our population to get the aggregate number
of content-hours. We then use this aggregate number of hours asa target to scale down our original traces. Once the number of ac-cesses per item in the trace is normalized, we spread the accessesthroughout the span of a single day to reproduce the daily use pat-tern observed in Figure 4.
4.3 Content placement strategyThe content must to be split into smaller chunks called data win-
dows to make it more manageable. We use the following conven-tion for content formatting in NaDa system. Each movie is splitinto data windows, whose length is a parameter w that we let varyfrom 10 to 120 seconds. The number of windows constituting amovie is then the ratio of movie duration by parameter w.
We perform placement by first determining, for each movie f ,the number of movie replicas nf we target to store overall on gate-ways. This in turn gives us the number of data windows we storein the system: if nf is an integer, each window is replicated exactlynf times. For fractional nf , a subset of windows is replicated �nf�times, while other windows are replicated �nf� + 1 times, in or-der to have approximately nf times the full movie size replicatedoverall. Given the number of replicas of each window of content,we then place these at random on gateways, under the constraintimposed by memory resources at each gateway.
Optimization formulation. We now explain the rationale weused to determine the replication number nf of each movie f . Weassume that information is available on movie popularity, capturedby the average number ρf of simultaneous viewings of movie fduring the peak hour. The latter could be defined by the 95-th per-centile, say, of the daily distribution of viewings. Based on thediurnal activity patterns in Figure 4, we would take the peak loadequal to three times the average load over a day.
Let nf denote the number of copies of movie f stored in total.We phrase the problem of selecting such parameters nf as an op-timization problem, whose objective is to minimize the number ofrequests that must be served by the infrastructure. To this end, welist some constraints that are natural to the problem. First, if nf isallowed to be less than 1 (i.e. only a subset of the original movieis stored within NaDa), then the number of simultaneous requests,xf , that can be served from gateways, must satisfy
xf ≤ ρfnf . (5)
Indeed, each one of the ρf requests can’t receive from gatewaysmore than the amount nf stored there in total.
Second, denote by Lf the length of movie f in seconds. Then foran upstream bandwidth of u and a streaming rate of r, the numberxf of simultaneous requests that can be served from gateways mustsatisfy
xf ≤ (u/r) ∗ (nfLf/w). (6)
Indeed, the first term u/r reflects the fact that a window of con-tent stored on a given box can be streamed at rate r simultaneouslyto at most u/r downloaders. Now, the number of boxes holdingsuch a window of content is precisely nf times the number of win-dows per replica of the movie, that is Lf/w.
Another effect we account for is the following. A fraction nf/Nof the content needed for the ρf viewings is available on the gate-way of the user requesting the content, where N is the total num-ber of gateways in the system. The residual number of requeststhat need to be served from either other gateways, or infrastructureservers, is given by
ρ′f = ρf (1 − nf/N). (7)
43
2AM 6AM 12PM 6PM 10PMTime
0
10000
20000
0000
0000
0000
60000
Energyuse(Joules/m
in)
Without NaDaNaDaServer fractionGateway fraction
(a) Imagenio IPTV.
2AM 6AM 12PM 6PM 10PMTime
0
10000
20000
0000
0000
0000
60000
Energyuse(Joules/m
in)
Without NaDaNaDaServer fractionGateway fraction
(b) Youtube.
2AM 6AM 12PM 6PM 10PMTime
0
10000
20000
0000
0000
0000
60000
Energyuse(Joules/m
in)
Without NaDaNaDaServer fractionGateway fraction
(c) Netflix.
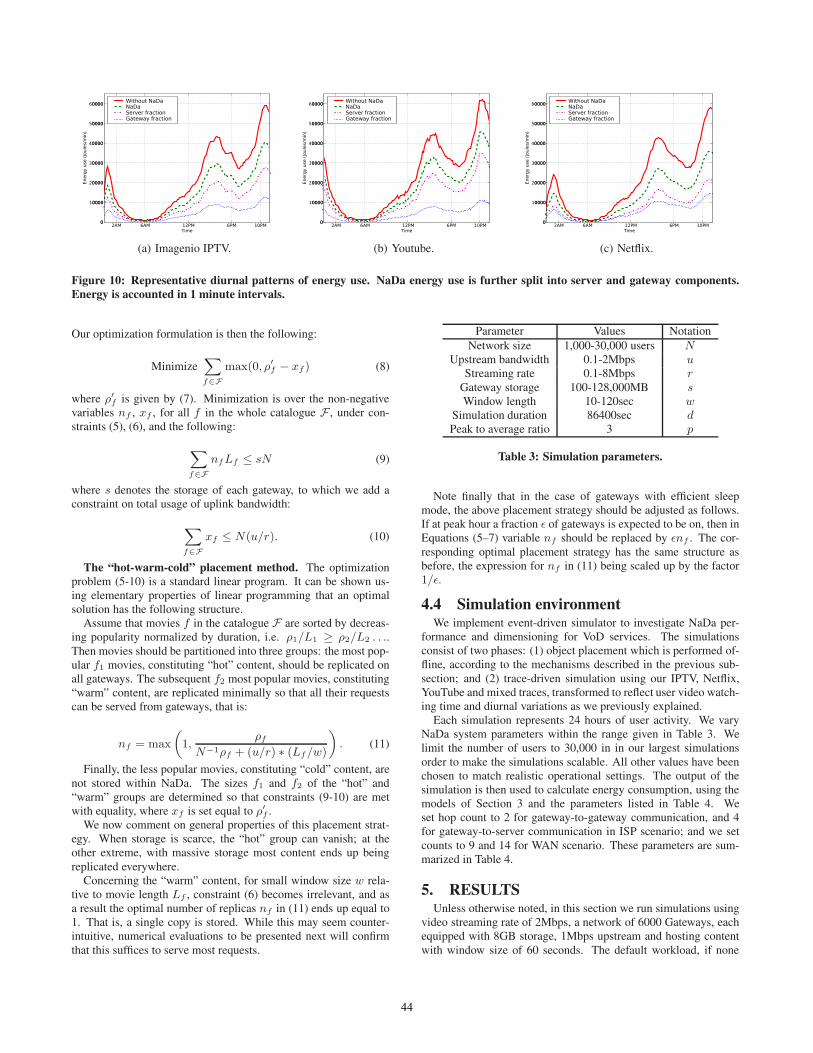
Figure 10: Representative diurnal patterns of energy use. NaDa energy use is further split into server and gateway components.Energy is accounted in 1 minute intervals.
Our optimization formulation is then the following:
MinimizeXf∈F
max(0, ρ′f − xf ) (8)
where ρ′f is given by (7). Minimization is over the non-negative
variables nf , xf , for all f in the whole catalogue F , under con-straints (5), (6), and the following:
Xf∈F
nfLf ≤ sN (9)
where s denotes the storage of each gateway, to which we add aconstraint on total usage of uplink bandwidth:
Xf∈F
xf ≤ N(u/r). (10)
The “hot-warm-cold” placement method. The optimizationproblem (5-10) is a standard linear program. It can be shown us-ing elementary properties of linear programming that an optimalsolution has the following structure.
Assume that movies f in the catalogue F are sorted by decreas-ing popularity normalized by duration, i.e. ρ1/L1 ≥ ρ2/L2 . . ..Then movies should be partitioned into three groups: the most pop-ular f1 movies, constituting “hot” content, should be replicated onall gateways. The subsequent f2 most popular movies, constituting“warm” content, are replicated minimally so that all their requestscan be served from gateways, that is:
nf = max
„1,
ρf
N−1ρf + (u/r) ∗ (Lf/w)
«. (11)
Finally, the less popular movies, constituting “cold” content, arenot stored within NaDa. The sizes f1 and f2 of the “hot” and“warm” groups are determined so that constraints (9-10) are metwith equality, where xf is set equal to ρ′
f .We now comment on general properties of this placement strat-
egy. When storage is scarce, the “hot” group can vanish; at theother extreme, with massive storage most content ends up beingreplicated everywhere.
Concerning the “warm” content, for small window size w rela-tive to movie length Lf , constraint (6) becomes irrelevant, and asa result the optimal number of replicas nf in (11) ends up equal to1. That is, a single copy is stored. While this may seem counter-intuitive, numerical evaluations to be presented next will confirmthat this suffices to serve most requests.
Parameter Values NotationNetwork size 1,000-30,000 users N
Upstream bandwidth 0.1-2Mbps uStreaming rate 0.1-8Mbps r
Gateway storage 100-128,000MB sWindow length 10-120sec w
Simulation duration 86400sec dPeak to average ratio 3 p
Table 3: Simulation parameters.
Note finally that in the case of gateways with efficient sleepmode, the above placement strategy should be adjusted as follows.If at peak hour a fraction ε of gateways is expected to be on, then inEquations (5–7) variable nf should be replaced by εnf . The cor-responding optimal placement strategy has the same structure asbefore, the expression for nf in (11) being scaled up by the factor1/ε.
4.4 Simulation environmentWe implement event-driven simulator to investigate NaDa per-
formance and dimensioning for VoD services. The simulationsconsist of two phases: (1) object placement which is performed of-fline, according to the mechanisms described in the previous sub-section; and (2) trace-driven simulation using our IPTV, Netflix,YouTube and mixed traces, transformed to reflect user video watch-ing time and diurnal variations as we previously explained.
Each simulation represents 24 hours of user activity. We varyNaDa system parameters within the range given in Table 3. Welimit the number of users to 30,000 in in our largest simulationsorder to make the simulations scalable. All other values have beenchosen to match realistic operational settings. The output of thesimulation is then used to calculate energy consumption, using themodels of Section 3 and the parameters listed in Table 4. Weset hop count to 2 for gateway-to-gateway communication, and 4for gateway-to-server communication in ISP scenario; and we setcounts to 9 and 14 for WAN scenario. These parameters are sum-marized in Table 4.
5. RESULTSUnless otherwise noted, in this section we run simulations using
video streaming rate of 2Mbps, a network of 6000 Gateways, eachequipped with 8GB storage, 1Mbps upstream and hosting contentwith window size of 60 seconds. The default workload, if none
44
Storage(MB)/user
Load(M
bit)/user
Using all gateways
Storage(MB)/user
Using only other active gateways
NaDa bandwidth
Server bandwidth
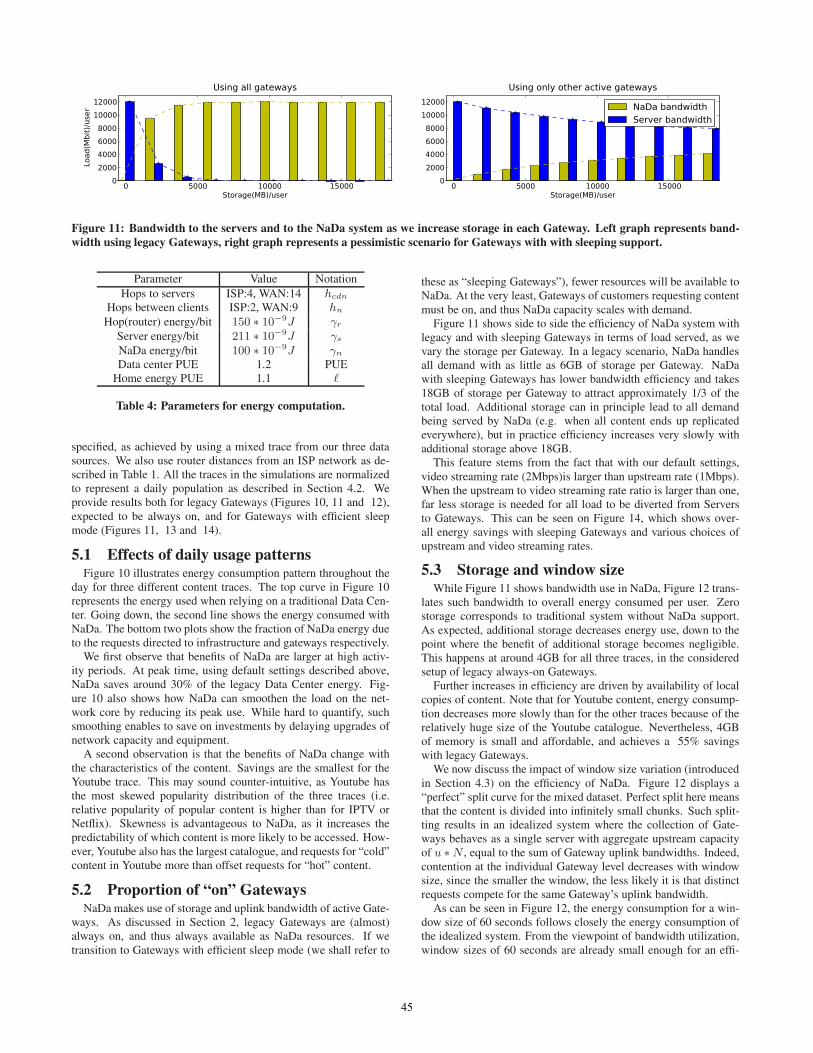
Figure 11: Bandwidth to the servers and to the NaDa system as we increase storage in each Gateway. Left graph represents band-width using legacy Gateways, right graph represents a pessimistic scenario for Gateways with with sleeping support.
Parameter Value NotationHops to servers ISP:4, WAN:14 hcdn
Hops between clients ISP:2, WAN:9 hn
Hop(router) energy/bit 150 ∗ 10−9J γr
Server energy/bit 211 ∗ 10−9J γs
NaDa energy/bit 100 ∗ 10−9J γn
Data center PUE 1.2 PUEHome energy PUE 1.1 �
Table 4: Parameters for energy computation.
specified, as achieved by using a mixed trace from our three datasources. We also use router distances from an ISP network as de-scribed in Table 1. All the traces in the simulations are normalizedto represent a daily population as described in Section 4.2. Weprovide results both for legacy Gateways (Figures 10, 11 and 12),expected to be always on, and for Gateways with efficient sleepmode (Figures 11, 13 and 14).
5.1 Effects of daily usage patternsFigure 10 illustrates energy consumption pattern throughout the
day for three different content traces. The top curve in Figure 10represents the energy used when relying on a traditional Data Cen-ter. Going down, the second line shows the energy consumed withNaDa. The bottom two plots show the fraction of NaDa energy dueto the requests directed to infrastructure and gateways respectively.
We first observe that benefits of NaDa are larger at high activ-ity periods. At peak time, using default settings described above,NaDa saves around 30% of the legacy Data Center energy. Fig-ure 10 also shows how NaDa can smoothen the load on the net-work core by reducing its peak use. While hard to quantify, suchsmoothing enables to save on investments by delaying upgrades ofnetwork capacity and equipment.
A second observation is that the benefits of NaDa change withthe characteristics of the content. Savings are the smallest for theYoutube trace. This may sound counter-intuitive, as Youtube hasthe most skewed popularity distribution of the three traces (i.e.relative popularity of popular content is higher than for IPTV orNetflix). Skewness is advantageous to NaDa, as it increases thepredictability of which content is more likely to be accessed. How-ever, Youtube also has the largest catalogue, and requests for “cold”content in Youtube more than offset requests for “hot” content.
5.2 Proportion of “on” GatewaysNaDa makes use of storage and uplink bandwidth of active Gate-
ways. As discussed in Section 2, legacy Gateways are (almost)always on, and thus always available as NaDa resources. If wetransition to Gateways with efficient sleep mode (we shall refer to
these as “sleeping Gateways”), fewer resources will be available toNaDa. At the very least, Gateways of customers requesting contentmust be on, and thus NaDa capacity scales with demand.
Figure 11 shows side to side the efficiency of NaDa system withlegacy and with sleeping Gateways in terms of load served, as wevary the storage per Gateway. In a legacy scenario, NaDa handlesall demand with as little as 6GB of storage per Gateway. NaDawith sleeping Gateways has lower bandwidth efficiency and takes18GB of storage per Gateway to attract approximately 1/3 of thetotal load. Additional storage can in principle lead to all demandbeing served by NaDa (e.g. when all content ends up replicatedeverywhere), but in practice efficiency increases very slowly withadditional storage above 18GB.
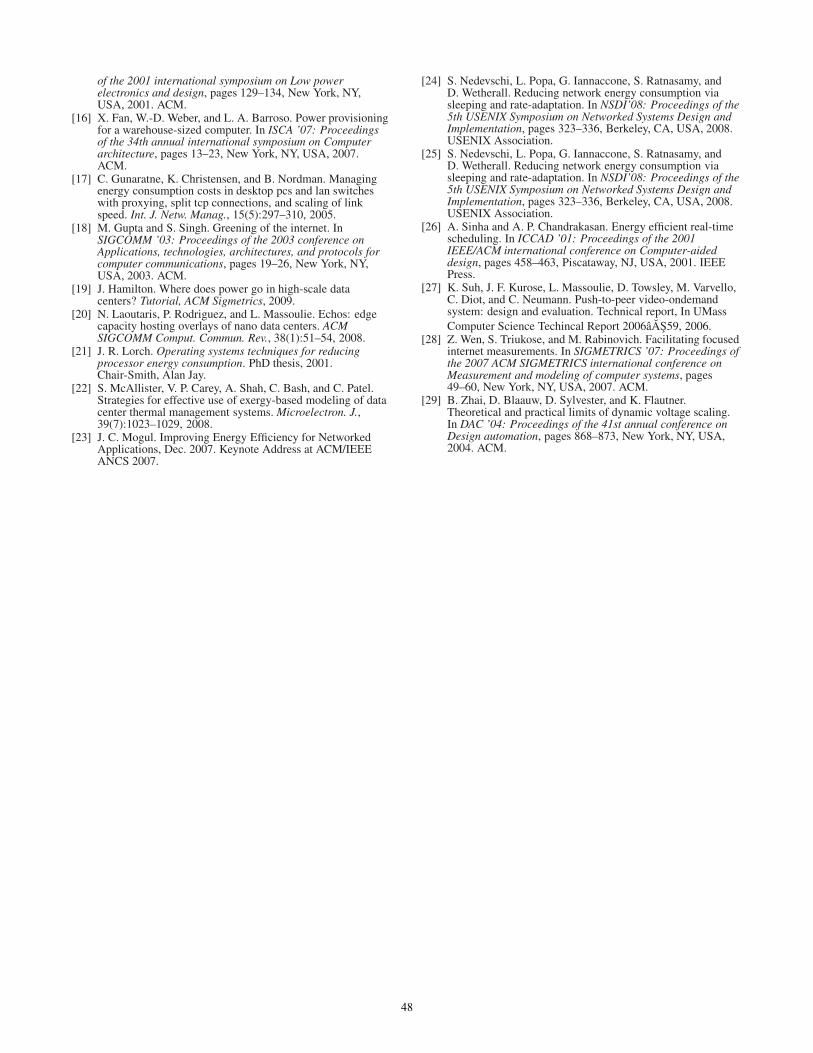
This feature stems from the fact that with our default settings,video streaming rate (2Mbps)is larger than upstream rate (1Mbps).When the upstream to video streaming rate ratio is larger than one,far less storage is needed for all load to be diverted from Serversto Gateways. This can be seen on Figure 14, which shows over-all energy savings with sleeping Gateways and various choices ofupstream and video streaming rates.
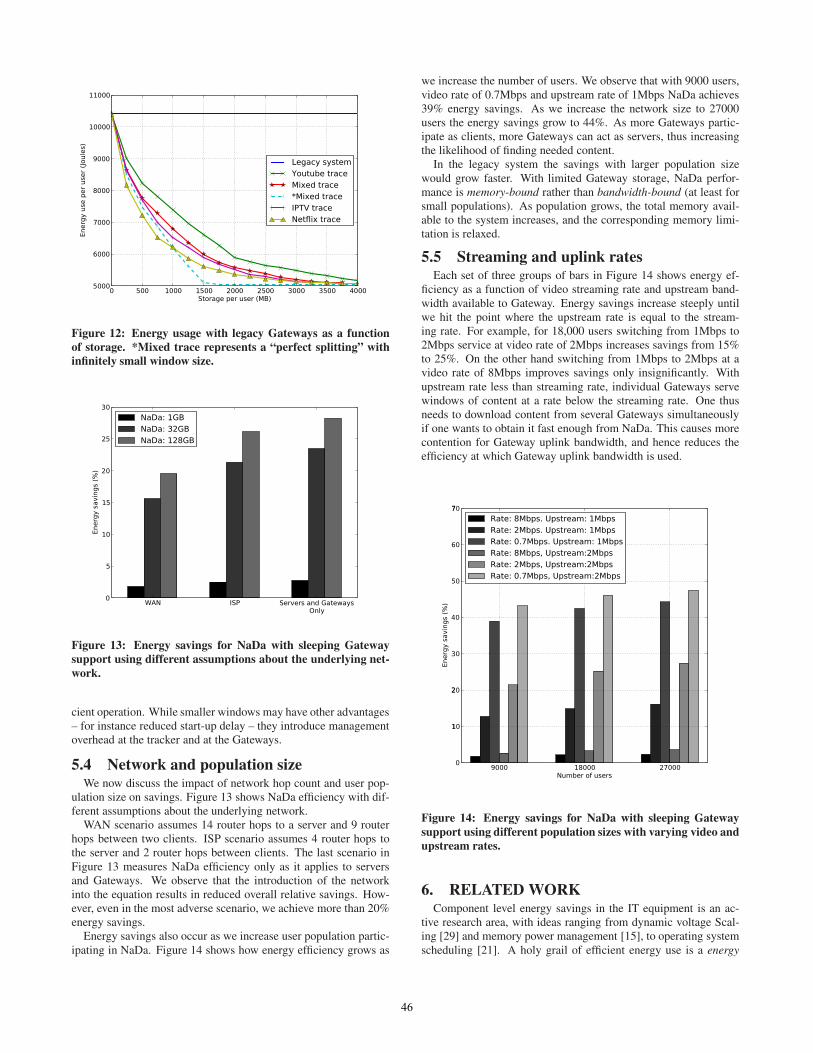
5.3 Storage and window sizeWhile Figure 11 shows bandwidth use in NaDa, Figure 12 trans-
lates such bandwidth to overall energy consumed per user. Zerostorage corresponds to traditional system without NaDa support.As expected, additional storage decreases energy use, down to thepoint where the benefit of additional storage becomes negligible.This happens at around 4GB for all three traces, in the consideredsetup of legacy always-on Gateways.
Further increases in efficiency are driven by availability of localcopies of content. Note that for Youtube content, energy consump-tion decreases more slowly than for the other traces because of therelatively huge size of the Youtube catalogue. Nevertheless, 4GBof memory is small and affordable, and achieves a 55% savingswith legacy Gateways.
We now discuss the impact of window size variation (introducedin Section 4.3) on the efficiency of NaDa. Figure 12 displays a“perfect” split curve for the mixed dataset. Perfect split here meansthat the content is divided into infinitely small chunks. Such split-ting results in an idealized system where the collection of Gate-ways behaves as a single server with aggregate upstream capacityof u ∗ N , equal to the sum of Gateway uplink bandwidths. Indeed,contention at the individual Gateway level decreases with windowsize, since the smaller the window, the less likely it is that distinctrequests compete for the same Gateway’s uplink bandwidth.
As can be seen in Figure 12, the energy consumption for a win-dow size of 60 seconds follows closely the energy consumption ofthe idealized system. From the viewpoint of bandwidth utilization,window sizes of 60 seconds are already small enough for an effi-
45
Storage per user (MB)
Energyuseperuser(Joules)
Legacy system
Youtube trace
Mixed trace
*Mixed trace
IPTV trace
Netflix trace
Figure 12: Energy usage with legacy Gateways as a functionof storage. *Mixed trace represents a “perfect splitting” withinfinitely small window size.
WAN ISP Servers and GatewaysOnly
Energysavings(%
)
NaDa: 1GB
NaDa: 32GB
NaDa: 128GB
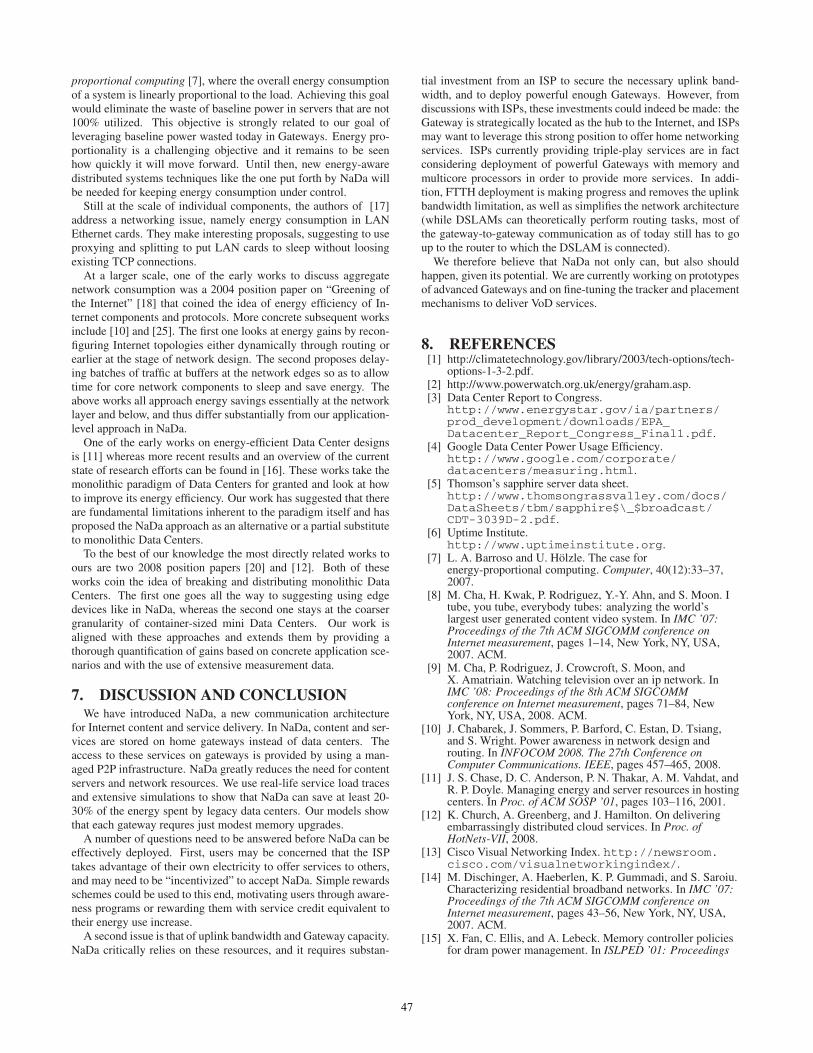
Figure 13: Energy savings for NaDa with sleeping Gatewaysupport using different assumptions about the underlying net-work.
cient operation. While smaller windows may have other advantages– for instance reduced start-up delay – they introduce managementoverhead at the tracker and at the Gateways.
5.4 Network and population sizeWe now discuss the impact of network hop count and user pop-
ulation size on savings. Figure 13 shows NaDa efficiency with dif-ferent assumptions about the underlying network.
WAN scenario assumes 14 router hops to a server and 9 routerhops between two clients. ISP scenario assumes 4 router hops tothe server and 2 router hops between clients. The last scenario inFigure 13 measures NaDa efficiency only as it applies to serversand Gateways. We observe that the introduction of the networkinto the equation results in reduced overall relative savings. How-ever, even in the most adverse scenario, we achieve more than 20%energy savings.
Energy savings also occur as we increase user population partic-ipating in NaDa. Figure 14 shows how energy efficiency grows as
we increase the number of users. We observe that with 9000 users,video rate of 0.7Mbps and upstream rate of 1Mbps NaDa achieves39% energy savings. As we increase the network size to 27000users the energy savings grow to 44%. As more Gateways partic-ipate as clients, more Gateways can act as servers, thus increasingthe likelihood of finding needed content.
In the legacy system the savings with larger population sizewould grow faster. With limited Gateway storage, NaDa perfor-mance is memory-bound rather than bandwidth-bound (at least forsmall populations). As population grows, the total memory avail-able to the system increases, and the corresponding memory limi-tation is relaxed.
5.5 Streaming and uplink ratesEach set of three groups of bars in Figure 14 shows energy ef-
ficiency as a function of video streaming rate and upstream band-width available to Gateway. Energy savings increase steeply untilwe hit the point where the upstream rate is equal to the stream-ing rate. For example, for 18,000 users switching from 1Mbps to2Mbps service at video rate of 2Mbps increases savings from 15%to 25%. On the other hand switching from 1Mbps to 2Mbps at avideo rate of 8Mbps improves savings only insignificantly. Withupstream rate less than streaming rate, individual Gateways servewindows of content at a rate below the streaming rate. One thusneeds to download content from several Gateways simultaneouslyif one wants to obtain it fast enough from NaDa. This causes morecontention for Gateway uplink bandwidth, and hence reduces theefficiency at which Gateway uplink bandwidth is used.
9000 18000 27000Number of users
0
10
20
0
0
0
0
70
Energysavings(%
)
Rate: 8Mbps. Upstream: 1Mbps
Rate: 2Mbps. Upstream: 1Mbps
Rate: 0.7Mbps. Upstream: 1Mbps
Rate: 8Mbps, Upstream:2Mbps
Rate: 2Mbps, Upstream:2Mbps
Rate: 0.7Mbps, Upstream:2Mbps
Figure 14: Energy savings for NaDa with sleeping Gatewaysupport using different population sizes with varying video andupstream rates.
6. RELATED WORKComponent level energy savings in the IT equipment is an ac-
tive research area, with ideas ranging from dynamic voltage Scal-ing [29] and memory power management [15], to operating systemscheduling [21]. A holy grail of efficient energy use is a energy
46
proportional computing [7], where the overall energy consumptionof a system is linearly proportional to the load. Achieving this goalwould eliminate the waste of baseline power in servers that are not100% utilized. This objective is strongly related to our goal ofleveraging baseline power wasted today in Gateways. Energy pro-portionality is a challenging objective and it remains to be seenhow quickly it will move forward. Until then, new energy-awaredistributed systems techniques like the one put forth by NaDa willbe needed for keeping energy consumption under control.
Still at the scale of individual components, the authors of [17]address a networking issue, namely energy consumption in LANEthernet cards. They make interesting proposals, suggesting to useproxying and splitting to put LAN cards to sleep without loosingexisting TCP connections.
At a larger scale, one of the early works to discuss aggregatenetwork consumption was a 2004 position paper on “Greening ofthe Internet” [18] that coined the idea of energy efficiency of In-ternet components and protocols. More concrete subsequent worksinclude [10] and [25]. The first one looks at energy gains by recon-figuring Internet topologies either dynamically through routing orearlier at the stage of network design. The second proposes delay-ing batches of traffic at buffers at the network edges so as to allowtime for core network components to sleep and save energy. Theabove works all approach energy savings essentially at the networklayer and below, and thus differ substantially from our application-level approach in NaDa.
One of the early works on energy-efficient Data Center designsis [11] whereas more recent results and an overview of the currentstate of research efforts can be found in [16]. These works take themonolithic paradigm of Data Centers for granted and look at howto improve its energy efficiency. Our work has suggested that thereare fundamental limitations inherent to the paradigm itself and hasproposed the NaDa approach as an alternative or a partial substituteto monolithic Data Centers.
To the best of our knowledge the most directly related works toours are two 2008 position papers [20] and [12]. Both of theseworks coin the idea of breaking and distributing monolithic DataCenters. The first one goes all the way to suggesting using edgedevices like in NaDa, whereas the second one stays at the coarsergranularity of container-sized mini Data Centers. Our work isaligned with these approaches and extends them by providing athorough quantification of gains based on concrete application sce-narios and with the use of extensive measurement data.
7. DISCUSSION AND CONCLUSIONWe have introduced NaDa, a new communication architecture
for Internet content and service delivery. In NaDa, content and ser-vices are stored on home gateways instead of data centers. Theaccess to these services on gateways is provided by using a man-aged P2P infrastructure. NaDa greatly reduces the need for contentservers and network resources. We use real-life service load tracesand extensive simulations to show that NaDa can save at least 20-30% of the energy spent by legacy data centers. Our models showthat each gateway requres just modest memory upgrades.
A number of questions need to be answered before NaDa can beeffectively deployed. First, users may be concerned that the ISPtakes advantage of their own electricity to offer services to others,and may need to be “incentivized” to accept NaDa. Simple rewardsschemes could be used to this end, motivating users through aware-ness programs or rewarding them with service credit equivalent totheir energy use increase.
A second issue is that of uplink bandwidth and Gateway capacity.NaDa critically relies on these resources, and it requires substan-
tial investment from an ISP to secure the necessary uplink band-width, and to deploy powerful enough Gateways. However, fromdiscussions with ISPs, these investments could indeed be made: theGateway is strategically located as the hub to the Internet, and ISPsmay want to leverage this strong position to offer home networkingservices. ISPs currently providing triple-play services are in factconsidering deployment of powerful Gateways with memory andmulticore processors in order to provide more services. In addi-tion, FTTH deployment is making progress and removes the uplinkbandwidth limitation, as well as simplifies the network architecture(while DSLAMs can theoretically perform routing tasks, most ofthe gateway-to-gateway communication as of today still has to goup to the router to which the DSLAM is connected).
We therefore believe that NaDa not only can, but also shouldhappen, given its potential. We are currently working on prototypesof advanced Gateways and on fine-tuning the tracker and placementmechanisms to deliver VoD services.
8. REFERENCES[1] http://climatetechnology.gov/library/2003/tech-options/tech-
options-1-3-2.pdf.[2] http://www.powerwatch.org.uk/energy/graham.asp.[3] Data Center Report to Congress.
http://www.energystar.gov/ia/partners/prod_development/downloads/EPA_Datacenter_Report_Congress_Final1.pdf.
[4] Google Data Center Power Usage Efficiency.http://www.google.com/corporate/datacenters/measuring.html.
[5] Thomson’s sapphire server data sheet.http://www.thomsongrassvalley.com/docs/DataSheets/tbm/sapphire$\_$broadcast/CDT-3039D-2.pdf.
[6] Uptime Institute.http://www.uptimeinstitute.org.
[7] L. A. Barroso and U. Hölzle. The case forenergy-proportional computing. Computer, 40(12):33–37,2007.
[8] M. Cha, H. Kwak, P. Rodriguez, Y.-Y. Ahn, and S. Moon. Itube, you tube, everybody tubes: analyzing the world’slargest user generated content video system. In IMC ’07:Proceedings of the 7th ACM SIGCOMM conference onInternet measurement, pages 1–14, New York, NY, USA,2007. ACM.
[9] M. Cha, P. Rodriguez, J. Crowcroft, S. Moon, andX. Amatriain. Watching television over an ip network. InIMC ’08: Proceedings of the 8th ACM SIGCOMMconference on Internet measurement, pages 71–84, NewYork, NY, USA, 2008. ACM.
[10] J. Chabarek, J. Sommers, P. Barford, C. Estan, D. Tsiang,and S. Wright. Power awareness in network design androuting. In INFOCOM 2008. The 27th Conference onComputer Communications. IEEE, pages 457–465, 2008.
[11] J. S. Chase, D. C. Anderson, P. N. Thakar, A. M. Vahdat, andR. P. Doyle. Managing energy and server resources in hostingcenters. In Proc. of ACM SOSP ’01, pages 103–116, 2001.
[12] K. Church, A. Greenberg, and J. Hamilton. On deliveringembarrassingly distributed cloud services. In Proc. ofHotNets-VII, 2008.
[13] Cisco Visual Networking Index. http://newsroom.cisco.com/visualnetworkingindex/.
[14] M. Dischinger, A. Haeberlen, K. P. Gummadi, and S. Saroiu.Characterizing residential broadband networks. In IMC ’07:Proceedings of the 7th ACM SIGCOMM conference onInternet measurement, pages 43–56, New York, NY, USA,2007. ACM.
[15] X. Fan, C. Ellis, and A. Lebeck. Memory controller policiesfor dram power management. In ISLPED ’01: Proceedings
47
of the 2001 international symposium on Low powerelectronics and design, pages 129–134, New York, NY,USA, 2001. ACM.
[16] X. Fan, W.-D. Weber, and L. A. Barroso. Power provisioningfor a warehouse-sized computer. In ISCA ’07: Proceedingsof the 34th annual international symposium on Computerarchitecture, pages 13–23, New York, NY, USA, 2007.ACM.
[17] C. Gunaratne, K. Christensen, and B. Nordman. Managingenergy consumption costs in desktop pcs and lan switcheswith proxying, split tcp connections, and scaling of linkspeed. Int. J. Netw. Manag., 15(5):297–310, 2005.
[18] M. Gupta and S. Singh. Greening of the internet. InSIGCOMM ’03: Proceedings of the 2003 conference onApplications, technologies, architectures, and protocols forcomputer communications, pages 19–26, New York, NY,USA, 2003. ACM.
[19] J. Hamilton. Where does power go in high-scale datacenters? Tutorial, ACM Sigmetrics, 2009.
[20] N. Laoutaris, P. Rodriguez, and L. Massoulie. Echos: edgecapacity hosting overlays of nano data centers. ACMSIGCOMM Comput. Commun. Rev., 38(1):51–54, 2008.
[21] J. R. Lorch. Operating systems techniques for reducingprocessor energy consumption. PhD thesis, 2001.Chair-Smith, Alan Jay.
[22] S. McAllister, V. P. Carey, A. Shah, C. Bash, and C. Patel.Strategies for effective use of exergy-based modeling of datacenter thermal management systems. Microelectron. J.,39(7):1023–1029, 2008.
[23] J. C. Mogul. Improving Energy Efficiency for NetworkedApplications, Dec. 2007. Keynote Address at ACM/IEEEANCS 2007.
[24] S. Nedevschi, L. Popa, G. Iannaccone, S. Ratnasamy, andD. Wetherall. Reducing network energy consumption viasleeping and rate-adaptation. In NSDI’08: Proceedings of the5th USENIX Symposium on Networked Systems Design andImplementation, pages 323–336, Berkeley, CA, USA, 2008.USENIX Association.
[25] S. Nedevschi, L. Popa, G. Iannaccone, S. Ratnasamy, andD. Wetherall. Reducing network energy consumption viasleeping and rate-adaptation. In NSDI’08: Proceedings of the5th USENIX Symposium on Networked Systems Design andImplementation, pages 323–336, Berkeley, CA, USA, 2008.USENIX Association.
[26] A. Sinha and A. P. Chandrakasan. Energy efficient real-timescheduling. In ICCAD ’01: Proceedings of the 2001IEEE/ACM international conference on Computer-aideddesign, pages 458–463, Piscataway, NJ, USA, 2001. IEEEPress.
[27] K. Suh, J. F. Kurose, L. Massoulie, D. Towsley, M. Varvello,C. Diot, and C. Neumann. Push-to-peer video-ondemandsystem: design and evaluation. Technical report, In UMassComputer Science Techincal Report 2006âAS59, 2006.
[28] Z. Wen, S. Triukose, and M. Rabinovich. Facilitating focusedinternet measurements. In SIGMETRICS ’07: Proceedings ofthe 2007 ACM SIGMETRICS international conference onMeasurement and modeling of computer systems, pages49–60, New York, NY, USA, 2007. ACM.
[29] B. Zhai, D. Blaauw, D. Sylvester, and K. Flautner.Theoretical and practical limits of dynamic voltage scaling.In DAC ’04: Proceedings of the 41st annual conference onDesign automation, pages 868–873, New York, NY, USA,2004. ACM.
48