LNCS 7049 - GreenWare: Greening Cloud-Scale Data Centers ...2F978-3-642-25821-3_8.pdf · GreenWare:...
22
GreenWare: Greening Cloud-Scale Data Centers to Maximize the Use of Renewable Energy Yanwei Zhang 1 , Yefu Wang 1 , and Xiaorui Wang 1,2 1 Department of Electrical Engineering and Computer Science University of Tennessee, Knoxville, TN 37996 2 Department of Electrical and Computer Engineering The Ohio State University, Columbus, OH 43210 {yzhang82,ywang38}@eecs.utk.edu, [email protected] Abstract. To reduce the negative environmental implications (e.g., CO2 emission and global warming) caused by the rapidly increasing en- ergy consumption, many Internet service operators have started taking various initiatives to operate their cloud-scale data centers with renew- able energy. Unfortunately, due to the intermittent nature of renewable energy sources such as wind turbines and solar panels, currently renew- able energy is often more expensive than brown energy that is produced with conventional fossil-based fuel. As a result, utilizing renewable energy may impose a considerable pressure on the sometimes stringent operation budgets of Internet service operators. Therefore, two key questions faced by many cloud-service operators are 1) how to dynamically distribute service requests among data centers in different geographical locations, based on the local weather conditions, to maximize the use of renewable energy, and 2) how to do that within their allowed operation budgets. In this paper, we propose GreenWare, a novel middleware system that conducts dynamic request dispatching to maximize the percentage of re- newable energy used to power a network of distributed data centers, subject to the desired cost budget of the Internet service operator. Our solution first explicitly models the intermittent generation of renewable energy, e.g., wind power and solar power, with respect to varying weather conditions in the geographical location of each data center. We then for- mulate the core objective of GreenWare as a constrained optimization problem and propose an efficient request dispatching algorithm based on linear-fractional programming (LFP). We evaluate GreenWare with real- world weather, electricity price, and workload traces. Our experimental results show that GreenWare can significantly increase the use of renew- able energy in cloud-scale data centers without violating the desired cost budget, despite the intermittent supplies of renewable energy in different locations and time-varying electricity prices and workloads. 1 Introduction Recent years have seen the rapid growth of large and geographically distributed data centers deployed by Internet service operators to support various services F. Kon and A.-M. Kermarrec (Eds.): Middleware 2011, LNCS 7049, pp. 143–164, 2011. c IFIP International Federation for Information Processing 2011
Transcript of LNCS 7049 - GreenWare: Greening Cloud-Scale Data Centers ...2F978-3-642-25821-3_8.pdf · GreenWare:...

GreenWare: Greening Cloud-Scale Data Centers
to Maximize the Use of Renewable Energy
Yanwei Zhang1, Yefu Wang1, and Xiaorui Wang1,2
1 Department of Electrical Engineering and Computer ScienceUniversity of Tennessee, Knoxville, TN 37996
2 Department of Electrical and Computer EngineeringThe Ohio State University, Columbus, OH 43210
{yzhang82,ywang38}@eecs.utk.edu, [email protected]
Abstract. To reduce the negative environmental implications (e.g.,CO2 emission and global warming) caused by the rapidly increasing en-ergy consumption, many Internet service operators have started takingvarious initiatives to operate their cloud-scale data centers with renew-able energy. Unfortunately, due to the intermittent nature of renewableenergy sources such as wind turbines and solar panels, currently renew-able energy is often more expensive than brown energy that is producedwith conventional fossil-based fuel. As a result, utilizing renewable energymay impose a considerable pressure on the sometimes stringent operationbudgets of Internet service operators. Therefore, two key questions facedby many cloud-service operators are 1) how to dynamically distributeservice requests among data centers in different geographical locations,based on the local weather conditions, to maximize the use of renewableenergy, and 2) how to do that within their allowed operation budgets.
In this paper, we propose GreenWare, a novel middleware system thatconducts dynamic request dispatching to maximize the percentage of re-newable energy used to power a network of distributed data centers,subject to the desired cost budget of the Internet service operator. Oursolution first explicitly models the intermittent generation of renewableenergy, e.g., wind power and solar power, with respect to varying weatherconditions in the geographical location of each data center. We then for-mulate the core objective of GreenWare as a constrained optimizationproblem and propose an efficient request dispatching algorithm based onlinear-fractional programming (LFP). We evaluate GreenWare with real-world weather, electricity price, and workload traces. Our experimentalresults show that GreenWare can significantly increase the use of renew-able energy in cloud-scale data centers without violating the desired costbudget, despite the intermittent supplies of renewable energy in differentlocations and time-varying electricity prices and workloads.
1 Introduction
Recent years have seen the rapid growth of large and geographically distributeddata centers deployed by Internet service operators to support various services
F. Kon and A.-M. Kermarrec (Eds.): Middleware 2011, LNCS 7049, pp. 143–164, 2011.c© IFIP International Federation for Information Processing 2011

144 Y. Zhang, Y. Wang, and X. Wang
such as cloud computing. As an effort to deal with the increasingly severe globalenergy crisis, reducing the high energy consumption of those cloud-scale datacenters has become a serious challenge. For example, some cloud-service datacenters are termed as mega data centers, because they host hundreds of thou-sands of servers and can draw tens to hundreds of megawatts of power at peak[22]. It has also been reported that in a conservative estimation, Google hostsmore than 500,000 servers in its data centers distributed in different locationsand consumes at least 6.3 × 10⁵ MWh in total annually [39]. Therefore, mini-mizing the energy consumption of cloud-scale data centers has recently receiveda lot of research attention (e.g., [20,17,29,13,47,18]).
In addition to high electricity bills, the enormous energy consumption of cloud-scale data centers can also lead to negative environmental implications (e.g.,CO2 emission and global warming), due to their large carbon footprints. Thereason is that most of the produced electricity around the world comes fromcarbon-intensive approaches, e.g., coal burning [29]. Such energy produced withconventional fossil-based fuel is commonly referred to as brown energy. There-fore, to mitigate the negative environmental implications caused by the rapidlyincreasing energy consumption, many Internet service operators have startedtaking various initiatives to operate their cloud-scale data centers with renew-able (or green) energy. In contrast to brown energy, green (or clean) energy isnormally generated from renewable energy sources, such as wind turbines andsolar panels, and is thus more environmentally friendly. For example, major In-ternet service operators, e.g., Google, Microsoft, and Yahoo!, have all started toincreasingly power some of their data centers using renewable energy, and so re-duce their dependence on brown energy [38,4,43]. Therefore, since data centers indifferent geographical locations may have different availabilities of renewable en-ergy depending on the local weather conditions, it is important for cloud-serviceoperators to dynamically distribute service requests among different data centersto maximize the use of renewable energy.
Unfortunately, due to the intermittent nature of renewable energy sources suchas wind and sunlight, currently renewable energy can be often more expensive toproduce than brown energy [2,11]. While some data centers are trying to buildtheir own wind farms or solar photovoltaic (PV) power plants, due to concernssuch as expensive facility investments and management, many Internet service op-erators choose to work with professional renewable energy producers and utilizethe green energy integrated into the power grid. For example, Google has recentlypurchased 20 years’ worth of wind energy from an Iowa wind farm, which willbe sufficient to power several of its data centers in Oklahoma [12]. Google alsoinvested $100 million in the Shepherds Flat Wind Farm in Oregon to generate845 megawatts of green power, which will be sold directly to Southern CaliforniaEdison’s power grid. As a result of its higher production costs, renewable energycoming from the grid can be more expensive than brown energy. For example, theindustrial electricity price for solar energy can be 16.14 cents per KWh in a sunnyclimate and 35.51 cents per KWh in a cloudy climate [8]. In contrast, the whole-sale brown energy price can be around 6 cents per KWh [39]. The Los Angeles

GreenWare: Greening Cloud-Scale Data Centers 145
Department of Water and Power also estimates that the extra cost for green en-ergy is at least 3 cents per KWh [5]. Therefore, utilizing renewable energy mayimpose a considerable pressure on the sometimes stringent operation budgets ofInternet service operators, as the electricity cost of operating data centers has be-come a significant portion, e.g., 20% or more of the monthly costs of those enter-prises [22]. Hence, a key dilemma faced by many service operators is how to ex-ploit renewable energy to the maximum degree that is allowed by their monthlyoperating budgets.
In this paper, we propose GreenWare, a novel middleware system that con-ducts dynamic request dispatching to maximize the percentage of renewableenergy used to power a network of distributed data centers, subject to the de-sired cost budgets of Internet service operators. We first model the intermittentgeneration of renewable energy, i.e., wind power and solar power, with respect tothe varying weather conditions in the geographical location of each data center.For example, the available wind power generated from wind turbines is modeledbased on the ambient wind speed [35,9], while the available solar power fromsolar plants is estimated by modeling the maximum power point on irradiance(i.e., solar energy per unit area of the solar panel’s face) and temperature [31,41].Based on the models, we formulate the core objective of GreenWare as a con-strained optimization problem, in which the constraints capture the Quality ofService (QoS, e.g., response time) requirements from customers, the intermittentavailabilities of renewable energy in different locations, the peak power limit ofeach data center, and the monthly cost budget of the Internet service operator.We then transfer the optimization problem into a linear-fractional programming(LFP) formulation for an efficient request dispatching solution with a polynomialtime average complexity.
Specifically, this paper makes the following major contributions:
– We propose a novel GreenWare middleware system in operating geographi-cally distributed cloud-scale data centers. GreenWare dynamically dispatchesincoming service requests among different data centers, based on the time-varying electricity prices and availabilities of renewable energy in their geo-graphical locations, to maximize the use of renewable energy, while enforcingthe monthly budget determined by the Internet service operator.
– We explicitly model renewable energy generation, i.e., wind turbines and so-lar panels, with respect to the varying weather conditions in the geographicallocation of each data center. As a result, our solution can effectively handlethe intermittent supplies of renewable energy.
– We formulate the core objective of GreenWare as a constrained optimizationproblem and propose an efficient request dispatching solution based on LFP.
– We evaluate GreenWare with real-world weather, electricity price, and work-load traces. Our experimental results show that GreenWare can significantlyreduce the dependence of cloud-scale data centers on fossil-fuel-based energywithout violating the desired cost budget, despite the intermittent suppliesof renewable energy and time-varying electricity prices and workloads.

146 Y. Zhang, Y. Wang, and X. Wang
The rest of the paper is organized as follows. Section 2 introduces the overallarchitecture of the proposed GreenWare middleware system. Section 3 presentsthe modeling and formulations of GreenWare. Section 4 discusses the simulationstrategy. Section 5 evaluates GreenWare with real-world traces. Section 6 reviewsthe related work and Section 7 concludes the paper.
2 GreenWare Architecture
In this section, we provide a high-level description of the proposed GreenWaresystem. GreenWare dynamically conducts request dispatching among data cen-ters in order to maximize the percentage of renewable energy used to power anetwork of distributed data centers, based on the time-varying electricity pricesand availabilities of renewable energy in their geographical locations. In themeantime, GreenWare guarantees the desired QoS for customers and effectivelymaintains the electricity bill within a cost budget determined by the Internetservice operators.
In this work, we assume that a network of distributed data centers share acommon cost budget, which can be determined by the Internet service operatorperiodically in each budgeting period (e.g., a month). A local optimizer is as-sumed to be present in each single data center in the network to dynamicallyadjust the number of active servers to minimize the power consumption of thedata center, while maintaining a desired level of QoS based on a QoS modeldetailed in Section 3.2. We also assume that the short-term weather conditions(e.g., in one hour) and the configurations of wind turbines and solar panels ofeach data center are available. As shown in Figure 1, GreenWare is a centralizedsystem that manages a data center network for maximizing the use of renewableenergy within the cost budget. While such a centralized architecture is commonlyused in the management of data center networks [29,40,39], GreenWare can beextended to work in a hierarchical way, which is our future work. Similar to[13,34,48], we use one month as the budgeting period and one hour as the periodfor GreenWare to be invoked and conduct the request dispatching operation.
Fig. 1. Proposed GreenWare system for distributed cloud-scale data center networks

GreenWare: Greening Cloud-Scale Data Centers 147
In every invocation period, GreenWare performs three steps: First, Green-Ware computes the hourly budget based on the monthly cost budget from theservice operator and the electricity cost already consumed in the previous invo-cation periods, as well as the observations of the workload’s historical behaviorsin the same hours in the past (e.g., last two weeks) as discussed in Section 4.3.Second, based on the time-varying electricity prices and availability of renew-able energy at each data center, with respect to the varying weather conditionsin their geographical location (e.g., irradiance, temperature, and wind speed),GreenWare runs the optimization algorithm in Section 3 to compute the desiredrequest dispatching (e.g., the fraction of workload allocated to each data cen-ter) such that (1) the overall percentage of renewable energy used to power anetwork of distributed data centers is maximized within budget constraints; (2)the total electricity cost is below the budget of the current hour; and (3) theapplication-level QoS (e.g., desired response time) for customers is guaranteed.Third, GreenWare redirects the incoming requests among data centers basedon the determined request dispatching in Step (2), using the dynamic requestrouting mechanism already deployed in cloud-scale data center networks. Notethat dynamic request routing has already been implemented by many Internetservice operators to map requests to servers, for the purposes of customer QoSguarantees and fault-tolerance [39].
3 Design Methodology of GreenWare
In this section, we first present the problem formulation of the optimization ob-jective of GreenWare. We then introduce the adopted performance and serverpower models, as well as the wind power model and solar power model. Fi-nally, we discuss our request dispatching solution. Note that we focus mainlyon wind power and solar power in this work because there exists meteorologicaldata [6] for us to simulate their intermittent availabilities in distributed datacenters. GreenWare can be applied to other types of renewable energy, such ashydro-electric and geothermal, if their corresponding meteorological data is alsoavailable.
3.1 Problem Formulation
We first introduce the following notation. N data centers are operated in acloud-scale data-center network. The ith data center consumes pWi kilowatts ofwind energy, pSi kilowatts of solar energy and pBi kilowatts of brown energy,respectively. The total power consumption pi (i.e., pi = pWi + pSi + pBi) of theith data center should not exceed the peak power limit Psi of the data center.The intermittent availabilities of the renewable energy in the local power marketof the ith data center are denoted as PWi and PSi. In particular, PWi and PSi
are the estimated wind power output from the wind farm and the maximum solarpower output from the solar plant, respectively. The corresponding wind farmand solar plant are assumed to be the renewable energy sources for the local

148 Y. Zhang, Y. Wang, and X. Wang
power market of the ith data center. PrWi, PrWi and PrBi are the currentelectricity prices of the three types of energy from the power market of theith data center, respectively. The whole system has an incoming workload of λrequests per hour. Our algorithm allocates the ith data center with a workloadof λi requests per hour to maximize the percentage of renewable energy used,depending on the wind and solar power models based on local weather conditions(presented in Sections 3.3 and 3.4), within the allocated cost budget Cs. Theaverage response time of the ith data center is Ri and the corresponding responsetime set point is Rsi.
Given a workload of λ requests per hour, the optimization goal is to dy-namically choose a request dispatching strategy such that the ith data centeris assigned λi requests to maximally use renewable energy to power the datacenter network within the cost budget. Specifically, in order to maximize theoverall renewable energy usage of all the N data centers, xi percentage of windpower and yi percentage of solar power out of the total power consumption pi
by the ith data center will have to be determined. Then, zi percentage of thetotal power consumption is supplemented in the form of brown energy. It is clearthat zi = 1 − xi − yi. In summary, the optimization problem can be expressedas follows.Problem 1:
Maximize :
N∑
i=1
(pWi + pSi)
N∑
i=1
(pWi + pSi + pBi)(1)
subject toN∑
i=1
λi = λ (2)
λi ≥ 0 (3)
Ri ≤ Rsi (4)
0 ≤ pWi ≤ PWi (5)
0 ≤ pSi ≤ PSi (6)
0 ≤ pWi + pSi + pBi ≤ Psi (7)
N∑
i=1
(PrWi · pWi + PrSi · pSi + PrBi · pBi) ≤ Cs (8)

GreenWare: Greening Cloud-Scale Data Centers 149
Specifically, pWi, pSi, pBi, PWi, and PSi (in KW) will be numerically the sameas energy (in KWh) since the invocation period used in this work is assumed tobe one hour. In order to solve the optimization Problem 1, it is important tomodel the variables pWi, pSi and pBi as functions of λi, xi and yi. It is clearthat
pWi = xi · pi; pSi = yi · pi; pBi = zi · pi (9)
where xi + yi + zi = 1.Thus, in the following we first model the power consumption pi and the aver-
age response time Ri with the request distribution rate λi for the ith data center.We then model the availabilities of wind power and solar power, i.e., PWi andPSi, respectively, based on the weather condition of the ith data center, e.g., ir-radiance, temperature, and wind velocity. We discuss an efficient solution designfor Problem 1 in Section 3.5.
3.2 Response Time and Power Models
Queueing theory is widely used to model the performance of a web server [13,14].In this paper, we use the M/M/n queueing model in queueing theory [40] tomodel the response time for a data center. The average response time of therequests to a web server consists of two portions: (1) the average waiting timethat the requests spend in a queue waiting to be serviced and (2) the service time,i.e., 1
μ , given the service rate μ of the data center. Specifically, the average waitingtime for a data center with n active servers can be expressed as 1
n·μ−λ ·PQ, wherePQ represents the probability that the incoming requests need to wait in a queueto be serviced. Furthermore, we assume that all the active servers will likely keepbusy, i.e., running at close to 100% utilization, because a local optimizer runningin each data center minimizes the number of active servers. Hence, without lossof generality, PQ is assumed to be 1, since all the active servers are assumed tobe running at close to 100% utilization. The same assumption is used in existingsolutions on electricity cost minimization for data centers [40]. Therefore, wehave
Ri =1μi
+1
ni · μi − λi(10)
where ni is the number of active servers and μi is the average service rate of asingle server, i.e., the number of requests the server is able to process in a unittime, in the ith data center .
As discussed in Section 2, we assume that a local optimizer runs in every datacenter and dynamically adjusts the number of active servers to provide a desiredlevel of QoS (e.g., response time) with the least number of servers. As a result,given a request rate of λi and a desired response time Rsi of the ith data center,the number of desired active servers ni can be derived from equation (10). Thus,we have pi = ni · spi, where spi is the average power consumption of a singleserver in the ith data center. Although the power consumption of a server isusually a function of the utilization of the server, we assume that spi is constantbecause when the local optimizer minimizes the number of active servers, all the

150 Y. Zhang, Y. Wang, and X. Wang
servers remaining active will likely run close to a 100% utilization. Thus, theutilization will be approximately the same. It is then clear that a linear serverpower model based on the incoming work rate λi for the ith data center can bederived, i.e., pi = f(λi), where f(λi) is a linear function.
3.3 Wind Power Model
The number of wind turbine installations is rapidly growing worldwide. It isexpected that the US can get 20% of its electricity from wind energy by the year2030 [25,37]. It has been shown that wind power generated by wind turbines ina wind farm can be modeled as a function of the actual wind speed [35,9]. Forexample, the wind power output pwind by a single wind turbine, with respect toa wind speed of v, can be approximated as follows
pwind =
⎧⎨
⎩
0 v < vin, v > vout
pr · v−vin
vr−vinvin < v < vr
pr vr < v < vout
where vr, pr are the rated speed and power of the wind turbine and vin, vout arecut-in and cut-out wind speeds. Specifically, the cut-in speed is the wind speedat which the turbine first starts to rotate and generate power, e.g., a typicalvalue between 3 and 4 meters per second; while the cut-out speed is employedby the braking system to bring the rotor to a standstill to eliminate the risk ofdamaging the turbine rotor due to the continuously rising wind speed, e.g., acut-out speed of usually around 25 meters per second.
In the case of a large-scale wind power generation farm, e.g., one consisting ofa large number mw of wind-turbines, the overall wind power output is estimatedas the sum of the power output values sampled at different turbines for simplicity[21]
PW =mw∑
k=1
pkwind
where pkwind is the power output from the kth wind turbine with respect to the
wind speed v, with t05e assumption that the wind turbines have the same windspeed in the same wind farm.
3.4 Solar Power Model
The worldwide photovoltaic (PV) power capacity installation grows in a nearlyexponential way, despite their relatively high cost [41]. In this work, we modelthe solar power generated by solar plants with respect to the varying weatherconditions, such as irradiance and temperature, based on a single diode equation[41,36]. In particular, the single diode equation has been widely used to simulatethe available electrical power generated from a single PV panel. Specifically, theresulting current-voltage characteristic of a PV panel is
i = Iph − Io · (ev+i·Rsns·Vth − 1) − v + i · Rs
Rsh(11)

GreenWare: Greening Cloud-Scale Data Centers 151
where Iph is the photo-generated current while Io is the dark saturation currentwith respect to the ambient weather pattern. Moreover, the single-diode modeltakes into account both the series and parallel (shunt) resistance of the PV panel,referred to as Rs and Rsh, respectively. Vth is the junction thermal voltage, i.e.,Vth = k · T/q, where k is Boltzmann’s constant, q is the charge of the electronand T is the ambient temperature. ns is the number of the solar cells in the PVpanel connected in series, e.g., ns = 72 in BP-MSX 120 panels [1].
To show the solar power output from PV panels with respect to the varyingweather conditions (e.g., irradiance and temperature), equation (11) can then betransformed as equation (12) by including these two key factors, i.e., irradianceand temperature [41]. In particular, it has been demonstrated that the darksaturation current of Io just varies with the ambient temperature T , independenton the irradiance condition G [41,16]. Furthermore, for a high-quality solar cell,it typically has a low series resistance Rs but a high parallel resistance Rsh. Asa result, the solar model in this work only takes into considerations the seriesresistance (i.e., Rsh = ∞), which is consistent with the prior study [31]. We thushave the fact that Iph can be approximated by Isc for simplicity, where Isc is theshort-circuit current. In particular, Isc is directly proportional to the irradianceas well as the ambient temperature. Thus, we have
i(G, T ) = Isc(G, T ) − Io(T ) · ev(G,T )+i(G,T )·Rs
ns·Vth (12)
where Isc(G, T ) = GG0
·Isc ·(1+ ki
100 ·(T −T0)) and Io(T ) = Isc ·(1+ ki
100 ·(T −T0)) ·e−Voc+kv ·(T−T0)
ns·Vth . G0 and T0 are the respective irradiance level and temperature inStandard Test Conditions (STC), i.e., G0 = 1000W/m2 and T0 = 25oC. Isc, Voc,kv and ki are the given parameters of short-circuit current, open-circuit voltage,temperature coefficients of the short-circuit and the open-circuit in STC fromthe datasheet of PV panels, respectively.
In particular, the solar power produced by a PV panel with respect to thevarying weather conditions, based on the current-voltage characteristic shown asequation (11) is the product of the output voltage and current. Namely, psolar =v(G, T )·i(G, T ). It has been demonstrated that the power output psolar generatedby a PV panel shows a unique maximum value under uniform irradiation andtemperature [31,41]. In order to achieve the maximum efficiency of solar plants,some researchers have already put efforts in extracting the maximum power pointfrom solar plants [19,27]. We thus estimate the solar power output by a PV panelas the maximal power value which can be extracted from the PV panel (referredto as mpp). Specifically, mpp is achieved with respect to an optimal load rmp andthe corresponding current imp [19], where rmp = Rs + ns·Vth
Isc(G,T )+Io(T )−imp. Thus,
mpp = i2mp · rmp. The Lambert W -function method is then used to calculate themaximum power point mpp of the PV panel with respect to the varying weatherconditions. We assume that there are ms PV panels installed in a large-scalesolar plant. Thus, the overall solar power output by the solar plant is estimatedas

152 Y. Zhang, Y. Wang, and X. Wang
PS =ms∑
k=1
mppk
where mppk is the maximum power point from the kth PV panel with respectto the irradiance G and temperature T .
3.5 Problem Solution
Based on the analysis above, the optimization Problem 1 is a non-linear pro-gramming problem with both a non-linear objective function and non-linear con-straints, with respect to decision variables of λi, xi and yi. However, for a serviceoperator, it is important to design an efficient solution in order to dynamicallymake decisions to green the data centers with acceptable runtime overheads. Wethus transfer the non-linear optimization Problem 1 into a well-studied linear-fractional programming formulation as in the form of Problem 2, which canbe further transferred into a standard linear programming problem. Specifically,note that for the equations (9) with respect to pWi, pSi and pBi as discussedin Section 3.1, we can alternatively assume that among the λi requests servicedby the ith data center, λW
i , λSi and λB
i requests are serviced with wind energy,solar energy and brown energy, respectively. Thus, we can limit the decisionvariables for the optimization Problem 1 in (1 - 8) to only workload-relatedvariables of λW
i , λSi and λB
i , instead of both workload-related variables (i.e., λi)and percentage variables (i.e., xi and yi).
Since λi = λWi + λS
i + λBi , Problem 1 in (1 - 8) can be further transferred
as follows.Problem 2:
Maximize :
N∑
i=1
f(λWi + λS
i )
N∑
i=1
f(λWi + λS
i + λBi )
(13)
subject toN∑
i=1
(λWi + λS
i + λBi ) = λ (14)
λWi ≥ 0 (15)
λSi ≥ 0 (16)
λBi ≥ 0 (17)
Ri ≤ Rsi (18)

GreenWare: Greening Cloud-Scale Data Centers 153
0 ≤ f(λWi ) ≤ PWi (19)
0 ≤ f(λSi ) ≤ PSi (20)
0 ≤ f(λWi + λS
i + λBi ) ≤ Psi (21)
N∑
i=1
(PrWi · f(λWi ) + PrSi · f(λS
i ) + PrBi · f(λBi )) ≤ Cs (22)
Specifically, f(λWi ), f(λS
i ) and f(λBi ) represent the amount of wind energy, solar
energy and brown energy consumed in the ith data center, respectively. It is clearthat f(λW
i ), f(λSi ) and f(λB
i ) are linear functions as discussed in Section 3.2.Problem 2 is thus a specific case of linear-fractional programming problem
with a fractional objective function and linear constraints. In order to solve theLFP-based optimization Problem 2, we leverage a standard technique discussedin [24] to transfer the problem in (13 - 22) to a linear programming problem.The detailed transformation is not shown due to space limitations, but the stepscan be found in [24]. In our system, we implement the proposed GreenWaremiddleware system based on the linprog solver in Matlab. In particular, linproguses an simplex method, which has been proven to have a low complexity inpractice [7].
4 Simulation Setup
We aim to use realistic parameters in our experimental setup. We design a simu-lator and use real-world weather data, Web request traces, as well as electricityprice data from utility companies to evaluate the proposed GreenWare system.As discussed, GreenWare dynamically conducts request dispatching to maxi-mize the percentage of renewable energy used to power a network of distributeddata centers within the cost budget determined by the Internet service operator.These evaluations primarily target web server-based applications, which providethe request-response type of web services. Specifically, the setup simulates anInternet-scale data center network such as Google’s data centers within the US.
4.1 Datacenter Parameters
In our evaluation, we simulate a large system composed of four geographicallydistributed data centers for an Internet service operator (e.g., Google). Accord-ingly, four different locations are assumed in the simulator, i.e., San Luis Valleyin Colorado, Los Angeles in California, Oak Ridge in Tennessee and Lanai inHawaii, which are the locations whose meteorological data are available in [6].
The power consumption profile of each server in the same location is assumedto be approximately the same, which is usually true when homogeneous servers
154 Y. Zhang, Y. Wang, and X. Wang
and configurations are used in each data center [40,33]. Specifically, similar toa related study [32], the server configuration in each location is respectivelyassumed to be as follows: Data Center 1 (2.0 GHz AMD Athlon processor),Data Center 2 (1.2 GHz Intel Pentium 4630 processor), Data Center 3 (2.9GHz Intel Pentium D950 processor), and Data Center 4 (2.7 GHz AMD Athlonprocessor). Their power consumption is assumed to be 88.88, 34.10, 149.19, and141.28 Watts and their processing capacity coefficients are estimated as 500, 300,725, and 675 requests per second, respectively.
4.2 Renewable Energy Availability
To emulate the intermittent availabilities of renewable energy in the locations ofdifferent data centers, i.e., wind power and solar power, we use meteorologicaldata from the Measurement and Instrumentation Data Center (MIDC) [6] ofthe National Renewable Energy Laboratory. A variety of meteorological data,including irradiances, temperature, and wind speed, is covered in those recordsfrom the MIDC. Moreover, prior studies have shown that the data from theMIDC is sufficiently accurate [31]. In particular, we use meteorological data fromthe four stations, e.g., Sun Spot One, Loyola Marymount University RotatingShadowband Radiometer, Oak Ridge National Laboratory and La Ola Lanai, sincethey have consistent time periods with available meteorological data, beginningfrom June 1st, 2010 to June 30th, 2010. We further assume that there are 200turbines installed in each wind farm and 10,000 solar panels installed in eachsolar plant to provide renewable energy to the local power utilities of the 4 datacenters. In particular, BP-MSX 120 panels produced by British Petroleum areassumed to be used in the solar plants [1].
Specifically, based on the power models discussed in Sections 3.3 and 3.4,as well as the varying weather conditions obtained from MIDC, the availablerenewable energy of all the 4 data centers throughout the entire simulated monthis demonstrated in Figures 2 and 3. In particular, Figure 2 depicts the overallavailable wind energy of all the 4 data centers, while Figure 3 shows the overallavailable solar energy. As shown in these two figures, the available renewableenergy shows a diurnal pattern. This is due to the fact that the local weatherconditions have a nearly diurnal pattern.
4.3 Real-World Workload Traces
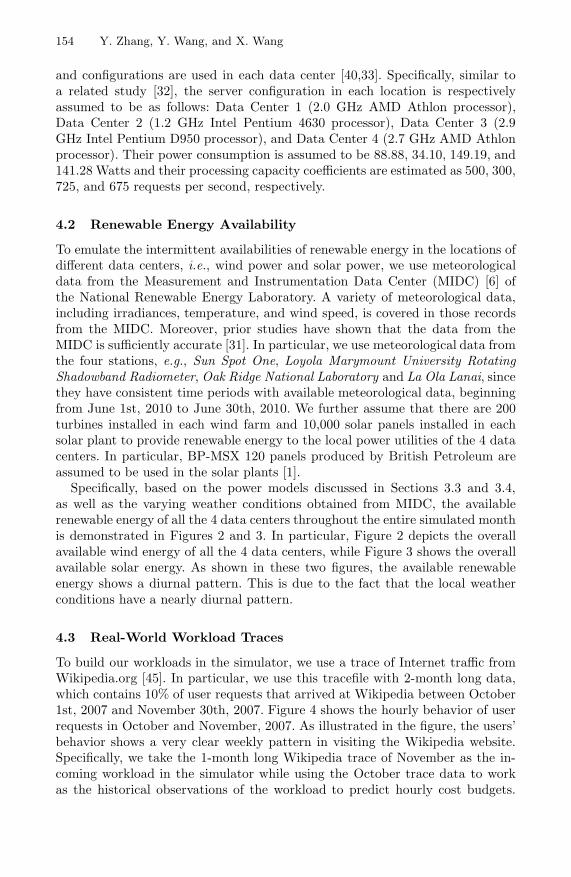
To build our workloads in the simulator, we use a trace of Internet traffic fromWikipedia.org [45]. In particular, we use this tracefile with 2-month long data,which contains 10% of user requests that arrived at Wikipedia between October1st, 2007 and November 30th, 2007. Figure 4 shows the hourly behavior of userrequests in October and November, 2007. As illustrated in the figure, the users’behavior shows a very clear weekly pattern in visiting the Wikipedia website.Specifically, we take the 1-month long Wikipedia trace of November as the in-coming workload in the simulator while using the October trace data to workas the historical observations of the workload to predict hourly cost budgets.

GreenWare: Greening Cloud-Scale Data Centers 155
0
0.5
1
1.5
2
2.5
3
3.5
4
4.5
5
0 96 192 288 384 480 576 672
Av
ail
ab
le W
ind
En
erg
y
(MW
h/h
r)
Time (hour)
Fig. 2. The trace of available wind energythroughout the entire simulated month
0
0.5
1
1.5
2
2.5
0 96 192 288 384 480 576 672
Availab
le S
ola
r E
nerg
y
(MW
h/h
r)
Time (hour)
Fig. 3. The trace of available solar energythroughout the entire simulated month
To do so, we maintain a history of the request arrival rate seen during eachhour of the week over the past several weeks. We then calculate every averagedhourly workload weight of the whole week over the past several weeks as thehourly budget weight in the coming week. Based on experiments, we find thatfor this Wikipedia trace, a 2-week long history trace data can provide a reason-able prediction on hourly cost budgets. Note that more sophisticated predictionmethods, such as [46], can also be integrated into our system.
To make our evaluation more general, we also stress test GreenWare withanother workload trace from the 1998 World Cup game, which includes therequest data of 33 servers from 4 geographical locations. In particular, it recordsthe incoming requests to all the servers with a granularity of 1 second from April30th to July 26th, 1998.
4.4 Electricity Price Traces
To simulate the electricity price for the brown energy, we use the price tracefrom New York Independent System Operator (NYISO) [10], since they havecomplete and accurate price data records. Specifically, we use the Day-Aheadprice data from November 1st, 2007 to November 30th, 2007, which is consistentwith the dates of the Wikipedia traces. We apply the price data from the four
2
4
6
8
10
12
14
16
18
0 80 160 240 320 400 480 560 640 720 800 880 960 1040 1120 1200 1280 1360 1440
Re
qu
es
t R
ate
(x
1.0
e6
/hr)
Time (hour)
Fig. 4. Wikipeida workload trace from October 1st, 2007 to November 30th, 2007

156 Y. Zhang, Y. Wang, and X. Wang
zones, including Capital, Central, Dunwoodie and Genesee to the 4 data centersin our simulation.
On the other hand, regarding the electricity price of renewable energy, it isusually true that renewable energy has a higher electricity price compared tobrown energy [2,5], due to the intermittent nature of renewable energy sourcessuch as wind and sunlight, as well as expensive facility investments and man-agement. For example, renewable energy costs an additional 1.5 cents per KWhcompared to the regular energy in the power market of Virginia [2]. Further-more, solar energy is typically much more expensive than wind energy, due tothe relatively high capital expenses [3,11]. Thus, to be more practical, in our sim-ulation we assume that the wind electricity price is 1.5 cents higher per KWhthan brown energy [2]; while solar energy is 18.0 cents higher per KWh [3].
5 Evaluation Results
In this section, we first introduce two baselines. We then compare the proposedGreenWare middleware system against the baselines.
5.1 Baselines
In our work, we use two baselines in our experiments, a cost minimization onlypolicy and a green energy usage maximization only policy, referred to as Min-Cost and Max-Green, respectively. (1) Min-Cost. Similar to GreenWare, Min-Cost also tries to minimize the electricity cost by distributing requests amonggeographically distributed data centers to leverage the varying electricity pricesin different locations. However, different from GreenWare, Min-Cost is unawareof renewable energy and thus prefers brown energy in cost minimization. Min-Cost is similar to the state-of-the-art work [40] in minimizing the electricitybill in operating data center networks. (2) Max-Green. Similar to GreenWare,Max-Green tries to maximize the use of renewable energy by distributing morerequests to data centers where more renewable energy is available. However,Max-Green does so regardless of the cost budget and thus may lead to a highoperation cost for the Internet service operators and sometimes even budgetviolations. This scheme is similar to the state-of-the-art work [42] in poweringdata centers with renewable energy.
5.2 Impacts of the Monthly Cost Budget
In this experiment, we evaluate the proposed GreenWare middleware with re-spect to different monthly cost budgets.
Figures 5 and 6 depict how GreenWare works with the Wikipedia workloadunder a monthly cost budget of $340K. In particular, these two figures show thatwith a sufficient monthly cost budget (e.g., as shown in Figure 5, the allocatedhourly budget is sufficient throughout the entire month), brown energy is usedonly in the invocation periods with insufficiently available renewable energy.

GreenWare: Greening Cloud-Scale Data Centers 157
That is, as indicated in Figure 6, only when the available renewable energysupply is less than the actual renewable energy demand (i.e., a difference lowerthan 0), the corresponding renewable energy usage does not reach 100%, e.g.,the hours of 2, 5, 6, 7 and etc. Note that there are some invocation periods whichhave a zero usage of renewable energy, e.g., the hours of 1, 3, 4 and etc. Thisis because that there is no available renewable energy at all due to the weatherconditions in those invocation periods. In addition, Figure 5 demonstrates thatthe hourly allocated cost budget within one week shows a growing trend. This isdue to the fact that we carry over the unused allocated cost budget from previousinvocation periods to the remaining invocation periods in the same week.
100
1000
10000
0 80 160 240 320 400 480 560 640 720
Ho
url
y C
os
t ($
) (l
og
sc
ale
)
Time (hour)
Hourly Budget
GreenWare
Fig. 5. Hourly electricity cost by GreenWare with a sufficient monthly cost budget of$340K, with respect to Nov. 2007 Wikipedia trace
0%
100%
0 80 160 240 320 400 480 560 640 720-2
0
5
Perc
en
tag
e
ou
t o
f T
ota
l E
nerg
y C
on
su
mp
tio
n
En
erg
y D
iffe
ren
ce (
MW
h)
Time (hour)
Renewable Energy Usage
Difference b/w Renewable Energy Supply and Renewable Energy Demand
Fig. 6. Hourly renewable energy usage by GreenWare with a sufficient monthly costbudget of $340K, with respect to Nov. 2007 Wikipedia trace
We then study GreenWare under a series of different monthly cost budgets.As shown in Figure 7, with the increase of the monthly cost budget, the monthlyaverage percentage of renewable energy usage keeps rising and then stays stable.This is due to the fact that fewer invocation periods are allocated with an in-sufficient cost budget in the case with a higher monthly cost budget. Therefore,more renewable energy can be used to power the data center networks. For ex-ample, with a monthly cost budget of $100K, there are 202 invocation periods

158 Y. Zhang, Y. Wang, and X. Wang
which have sufficient renewable energy supply but with an insufficient allocatedcost budget; while as low as only 42 invocation periods are allocated with aninsufficient cost budget in the case with a $160K monthly cost budget. As a re-sult, a higher monthly average percentage of 58.17% of renewable energy usageis achieved with the monthly cost budget of $160K, compared to a percentage of45.95% with the monthly budget $100K. Thus, when all the invocation periodshave a sufficient budget due to a sufficient monthly cost budget, e.g., $320Kand $340K, the monthly average renewable energy usage stays stable. This setof experiments demonstrates that GreenWare can significantly increase the useof renewable energy in powering the data center network, subject to the desiredcost budget.
40 %
45 %
50 %
55 %
60 %
65 %
70 %
75 %
100K 120K 140K 160K 300K 320K 340K 0
50
100
150
200
250
Mo
nth
ly P
erc
en
tag
e
ou
t o
f T
ota
l E
nerg
y C
on
su
mp
tio
n
Mo
nth
ly N
o. o
f In
vo
cati
on
s
Monthly Electricity Cost Budget Level
Average Renewable Energy Usage
Invocations effected by insufficient cost budget
Fig. 7. Average percentage of renewable energy usage by GreenWare with a series ofdifferent monthly cost budgets
5.3 Comparison with Baselines
In this experiment, we compare GreenWare with the two baselines: Min-Costand Max-Green.
Figure 8 depicts the cost and brown energy consumption of GreenWare, Max-Green and Min-Cost, with respect to a given monthly budget, e.g., $100K, forthe Wikipeida workload. The results are normalized against Min-Cost, whichactually indicates the case of only using brown energy in powering data centernetworks. Figure 8 shows that although Max-Green (i.e., maximizing the use ofgreen energy regardless of cost budget) can decrease brown energy consumptionby 58% compared to Min-Cost by utilizing as much renewable energy as pos-sible. However, due to its unawareness of cost budget, Max-Green results in a109% cost increase and exceeds the monthly cost budget by 29%. On the otherhand, GreenWare can achieve an as-much-as-42% decrease in brown energy con-sumption at only a 52% cost increase, compared to Min-Cost. More importantly,GreenWare successfully controls the electricity bill to stay within the cost budgetfor the Internet service operator.
To demonstrate the effectiveness of GreenWare with different workloads, wealso stress test GreenWare using the 1998 World Cup trace. Specifically, we usethe request trace in June as the incoming workload in the simulation, and the

GreenWare: Greening Cloud-Scale Data Centers 159
0
0.5
1
1.5
2
2.5
3
cost brownEnergy
Co
st
an
d B
row
n E
ne
rgy
GreenWare
Max-Green
Min-Cost
Monthly Cost Budget
Fig. 8. Comparison between GreenWareand baselines with respect to Nov. 2007Wikipeida trace
0
0.5
1
1.5
2
2.5
3
cost brownEnergy
Co
st
an
d B
row
n E
ne
rgy
GreenWare
Max-Green
Min-Cost
Monthly Cost Budget
Fig. 9. Comparison between GreenWareand baselines with respect to Jun. 1998World Cup trace
May trace as historical data to predict the hourly cost budget. To simulate theworkload of cloud-service data centers, we proportionally increase the requestnumbers. Figure 9 shows the experiment results on the comparison betweenGreenWare and the two baselines. As demonstrated in the figure, Max-Greenachieves a 42% decrease in brown energy consumption compared to Min-Cost.However, the electricity bill exceeds the given monthly cost budget (e.g., $100K)by 31%. On the other hand, GreenWare obtains an as-much-as-21% decrease inbrown energy consumption while successfully controlling the electricity bill tostay within the monthly cost budget.
5.4 Impacts of Pricing Policies of Renewable Energy
In this experiment, we show that the proposed GreenWare middleware alwaysprefers the type of renewable energy that has a lower electricity price. Thus, anefficient cost minimization is guaranteed. Since in our work we just consider twotypes of the most popular renewable energy, i.e., wind energy and solar energy,we assume two different pricing policies: (1) wind energy has a lower electricityprice, as discussed in Section 4.4; and (2) solar energy has a lower price thanwind energy. Note that the current practice is that wind energy is typically lessexpensive than solar energy. However, in order to stress test GreenWare, weassume a lower price for solar energy in (2).
Figures 10 and 11 demonstrate how the usage of different types of renewableenergy varies with different pricing policies as discussed above. Intuitively, themore expensive renewable energy is taken into use only when the less expensivetype of renewable energy is used up. As shown in Figure 10, with the first pricingpolicy (i.e., wind energy price is lower), solar energy is used to power datacenters only after all the supplied wind energy has been used up, as indicated inthe second data center (DC#2). Similarly, with the second pricing policy, windenergy is used to power data centers only after all the available less expensivesolar energy is consumed, as in all the data centers in Figure 11. Note that

160 Y. Zhang, Y. Wang, and X. Wang
in Figure 10, Data Centers 1, 3 and 4 begin to use the more expensive solarenergy though there is still some wind energy left. This is because that there aresome invocation periods when the available wind energy is too much to servethe incoming workload. As a result, some wind energy is left unused and theunused wind energy cannot be used in the following invocation periods due tothe intermittent feature of the renewable energy.
100
1000
DC#1 DC#2 DC#3 DC#4
Mo
nth
ly R
en
ew
ab
le E
nerg
y
(MW
h)
(lo
g s
cale
)
Different Data Centers
Wind Energy Demand
Solar Energy Demand
Solar Energy Supply
Wind Energy Supply
Fig. 10. Monthly renewable energy usageby GreenWare when wind energy price islower than solar energy price
100
1000
DC#1 DC#2 DC#3 DC#4
Mo
nth
ly R
en
ew
ab
le E
nerg
y
(MW
h)
(lo
g s
cale
)
Different Data Centers
Wind Energy Demand
Solar Energy Demand
Solar Energy Supply
Wind Energy Supply
Fig. 11. Monthly renewable energy usageby GreenWare when solar energy price islower than wind energy price
6 Related Work
Greening data centers is becoming an increasingly important topic in operatingcloud-scale data center networks for Internet service operators, due to (1) datacenters having become major energy consumers [44] and (2) the global energy cri-sis and environmental concerns (e.g., global warming) [31]. To our best knowledge,our study is the first one that proposes to maximally use the renewable energy sup-plied by the local power utilities for Internet service operators, while being awareof the time-varying electricity price and enforcing a desired cost budget. Com-pared with the state of the art, the considerations of various realistic constraintsmake GreenWare more practical. We now discuss the related work.
Energy conservation in data centers. Many recent research projects havetried to minimize the energy consumption of data centers. For example, Chenet al. [18] and Chase et al. [17] reduce the energy consumption of connectionservers hosting long-lived TCP-connection services and web servers providingrequest-response type of services, respectively. Heo et al. [23] have developedan adaptation graph analysis mechanism to solve the conflicts between inter-acting adaptive components, e.g., On/Off and dynamic voltage scaling policiesin server farms, to minimize energy consumption. Elnozahy et al. [20] investi-gate various combinations of dynamic voltage scaling and node on/off policiesto reduce the energy consumption in server farms. Other strategies on reducingenergy consumption of servers are also proposed (e.g., [26,47]).

GreenWare: Greening Cloud-Scale Data Centers 161
Our work differs from these efforts in several ways: (1) none of them try touse renewable energy to power data center networks; and (2) none of them putefforts on managing the electricity cost for the Internet service operators.
Managing electricity cost in data centers. A few recent projects have pro-posed to minimize the electricity bills of data center networks. For example,Qureshi et al. [39] try to lower the electricity bill by utilizing the varying elec-tricity prices in different locations of distributed data centers. Rao et al. [40]consider a multi-electricity-market environment to reduce the electricity bill. Ina recent study, Zhang et al. [48] propose an electricity bill capping algorithm tominimize the electricity cost within the cost budget for data center networks.Lin et al. [33] have tried to minimize the energy cost together with delay costby rightly sizing data centers. Our work differs significantly from these effortsin that none of them try to maximize the use of renewable energy in poweringdata center networks for the Internet service operators.
Utilizing renewable energy in data centers. This is a relatively new topicwith only few initial studies. Le et al. [29,28] propose to cap the consumptionof brown energy while maintaining service level agreements (SLAs). Liu et al.[34] investigate how renewable energy can be used to lower the electricity priceof brown energy in a specific power market, i.e., where the brown energy isdynamically priced in proportion to the total brown energy consumption. Brownet al. [15] propose a simulation infrastructure to model a data center usingrenewable energy sources. In contrast to those studies, GreenWare aims to solvea related but different problem, i.e., maximizing the use of renewable energysubject to the cost budget of the Internet service operators. Steward et al. [42]also try to maximize the use of renewable energy in data centers. However,their study assumes that Internet service operators have their own wind farmsor solar plants. In contrast, GreenWare considers a different case where theservice operators buy renewable energy from the power grid, which is a morecommon case for many data centers because of concerns such as expensive facilityinvestments and management. In addition, their study does not consider theextra cost of renewable energy and may lead to budget violations as shown inthe comparisons between GreenWare and Max-Green in Section 5.3. Li et al.[30] propose a load power tuning scheme for managing intermittent renewablepower in a single data center without considering the costs. In contrast, we focuson distributing requests among data centers in different locations.
7 Conclusion
Two key questions faced by many cloud-service operators are 1) how to dynam-ically distribute service requests among data centers in different geographicallocations, based on the local weather conditions, to maximize the use of renew-able energy, and 2) how to do so within their allowed operation budgets. In thispaper, we have presented GreenWare, a novel middleware system that conductsdynamic request dispatching to maximize the percentage of renewable energy

162 Y. Zhang, Y. Wang, and X. Wang
used to power a network of distributed data centers, subject to the desired costbudget of the Internet service operators. Our solution first explicitly models theintermittent generation of renewable energy, e.g., wind power and solar power,with respect to varying weather conditions in the geographical location of eachdata center. We then formulate the core objective of GreenWare as a constrainedoptimization problem and propose an efficient request dispatching algorithmbased on linear-fractional programming (LFP). We evaluate GreenWare withreal-world weather, electricity price, and workload traces. Our experimental re-sults show that GreenWare can significantly increase the use of renewable energyin cloud-scale data centers without violating the desired cost budget, despite theintermittent supplies of renewable energy in different locations and time-varyingelectricity prices and workloads.
Acknowledgments. This work was supported, in part, by NSF under CNS-0720663 and CAREER Award CNS-0845390.
References
1. BP MSX 120 solar module,http://pdf.directindustry.com/pdf/bp-solar/
bp-msx-120-solar-module/15873-68158.html
2. Dominion Virginia Power, http://www.dom.com/3. Energy modality comparison based on projected cents per kilowatt-hour,
http://peswiki.com/
4. Green House Data: Greening the data center, http://www.greenhousedata.com/5. Los Angeles Department of Water & Power, http://www.ladwp.com/6. Measurement and Instrumentation data center, http://www.nrel.gov/midc/7. The Running Time of the Simplex Method, http://www.mpi-inf.mpg.de8. Solar Electricity Prices, http://solarbuzz.com/9. WindPower Program, http://www.wind-power-program.com/index.htm
10. NYISO (1999), http://www.nyiso.com/11. Solar Power at Data Center Scale (2009), http://www.datacenterknowledge.com/12. Google Buys 20 Years’ Worth of Wind Energy To Power Data centers (2010),
http://www.huffingtonpost.com/
13. Ahmad, F., Vijaykumar, T.N.: Joint optimization of idle and cooling power in datacenters while maintaining response time. In: ASPLOS (2010)
14. Bolch, G., Greiner, S., de Meer, H., Trivedi, K.S.: Queueing Networks and MarkovChains. Wiley Interscience (2005)
15. Brown, M., Renau, J.: Rerack: Power simulation for data centers with renewableenergy generation. In: GreenMetrics (2011)
16. Castaner, L., Silvestre, S.: Modelling Photovoltaic Systems Using PSpice. JohnWiley & Sons (2002)
17. Chase, J.S., Anderson, D.C., Thakar, P.N., Vahdat, A.M., Doyle, R.P.: Managingenergy and server resources in hosting centers. In: SOSP (2001)
18. Chen, G., He, W., Liu, J., Nath, S., Rigas, L., Xiao, L., Zhao, F.: Energy-awareserver provisioning and load dispatching for connection-intensive internet services.In: NSDI (2008)

GreenWare: Greening Cloud-Scale Data Centers 163
19. Ding, J., Radhakrishnan, R.: A new method to determine the optimum load of areal solar cell using the lambert w-function. Solar Energy Materials and Solar Cell(2008)
20. Elnozahy, E.N.M., Kistler, J.J., Rajamony, R.: Energy-Efficient Server Clusters. In:Falsafi, B., VijayKumar, T.N. (eds.) PACS 2002. LNCS, vol. 2325, pp. 179–196.Springer, Heidelberg (2003)
21. Kariniotakis, G.N., Stavrakakis, G.S., Nogaret, E.F.: Wind power forecasting usingadvanced neural networks models. IEEE Transactions on Energy Conversion, 762–767 (1996)
22. Greenberg, A., Hamilton, J., Maltz, D.A., Patel, P.: The cost of a cloud: researchproblems in data center networks. ACM SIGCOMM Computer CommunicationReview (2008)
23. Heo, J., Henriksson, D., Liu, X., Abdelzaher, T.: Integrating adaptive components:An emerging challenge in performance-adaptive systems and a server farm case-study. In: RTSS (2007)
24. Hillier, F.S., Lieberman, G.J.: Introduction to Operations Research. McGraw-Hill(2005)
25. Hohl, A.: Wind Power for Data Centers (2009),http://www.renewableenergyworld.com/rea/blog/post/2009/08/
wind-power-for-data-centers
26. Horvath, T., Abdelzaher, T., Skadron, K., Liu, X.: Dynamic voltage scaling in mul-titier web servers with end-to-end delay control. IEEE Transactions on Computers,444–458 (2007)
27. Kothari, L.S., Mathur, P.C., Kapoor, A., Saxena, P., Sharma, R.P.: Determinationof optimum load for a solar cell. Journal of Applied Physics, 5982–5984 (2009)
28. Le, K., Bianchini, R., Martonosi, M., Nguyen, T.D.: Cost- and energy-aware loaddistribution across data centers. In: HOTPOWER (2009)
29. Le, K., Bilgir, O., Bianchini, R., Martonosi, M., Nguyen, T.D.: Managing the cost,energy consumption, and carbon footprint of internet services. In: SIGMETRICS(2010)
30. Li, C., Qouneh, A., Li, T.: Characterizing and analyzing renewable energy drivendata centers. In: SIGMETRICS (2011)
31. Li, C., Zhang, W., Cho, C.B., Li, T.: Solarcore: Solar energy driven multi-corearchitecture power management. In: HPCA (2011)
32. Li, J., Li, Z., Ren, K., Liu, X., Su, H.: Towards optimal electric demand manage-ment for internet data centers. In: Techreport (2010)
33. Lin, M., Wierman, A., Andrew, L.L.H., Thereska, E.: Dynamic right-sizing forpower-proportional data centers. In: INFOCOM (2011)
34. Liu, Z., Lin, M., Wierman, A., Low, S.H., Andrew, L.L.H.: Greening geograhpicalload balancing. In: SIGMETRICS (2011)
35. Patel, M.R.: Power systems: Design, Analysis, and Operation. CRC Press (2006)
36. Paukshto, M.V., Lovetskiy, K.: Invariance of single diode equation and its applica-tion. In: PVSC (2008)
37. Petru, T., Thiringer, T.: Modeling of wind turbines for power system studies. IEEETransactions on Power Systems, 1132–1139 (2002)
38. Pistoia, G.: Battery Operated Devices and Systems: From Portable Electronics toIndustrial Products. Elsevier (2011)
39. Qureshi, A., Weber, R., Balakrishnan, H., Guttag, J., Maggs, B.: Cutting theelectric bill for internet-scale systems. In: SIGCOMM (2009)

164 Y. Zhang, Y. Wang, and X. Wang
40. Rao, L., Liu, X., Xie, L., Liu, W.: Minimizing electricity cost: optimization ofdistributed internet data centers in a multi-electricity-market environment. In: IN-FOCOM (2010)
41. Sera, D., Teodorescu, R., Rodriguez, P.: PV panel model based on datasheet values.In: ISIE (2007)
42. Stewart, C., Shen, K.: Some joules are more precious than others: Managing re-newable energy in the datacenter. In: HOTPOWER (2009)
43. Thibodeau, P.: Wind power data center project planned in urban area (2008),http://www.computerworld.com/
44. United states environmental protection agency. Report to congress on server anddata center energy efficiency (2007)
45. Urdaneta, G., Pierre, G., van Steen, M.: Wikipedia workload analysis for decen-tralized hosting. Elsevier Computer Networks 53(11), 1830–1845 (2009),http://www.globule.org/publi/WWADH_comnet2009.html
46. Urgaonkar, B., Shenoy, P., Chandra, A., Goyal, P.: Dynamic provisioning of multi-tier internet applications. In: ICAC (2005)
47. Verma, A., Dasgupta, G., Nayak, T.K., De, P., Kothari, R.: Server workload anal-ysis for power minimization using consolidation. In: USENIX ATC (2009)
48. Zhang, Y., Wang, Y., Wang, X.: Capping the electricity cost of cloud-scale datacenters with impacts on power markets. In: HPDC (2011)