Analysis of Greenhouse Gas Emission Reduction Potential of Light Duty Vehicle Technologies in

Greenhouse Gas Reduction Potential for
South Korea l
Jung Wk Kim*, Young-Doo Wang**, John Byme**, Hyun Kyo Suh***,
Kyoung-soo Lim****, Sunny Ahn***** and Mi Hong Lee****** 2)
r-------------------------<Conten~>-------------------------,
I. Trends and Future Projections in Energy and the Greenhouse Gas
II. Greenhouse Gas Reduction Potential from Energy Efficiency Upgrading
III. Greenhouse Gas Reduction Potential in Land Use and Transportation
IV. Greenhouse Gas Reduction Potential in Agricultural Sector
V. Sequestration from Fores~
VI. Summary _________________________________________________________ J
I. Trends and Future Projections in Energy and the Greenhouse Gas
South Korea's energy policies over the past 40 years have focused on securing stable energy supplies
from fossil fuels and nuclear power. In 2000, imported energy, mainly coal, oil, natural gas and uranium,
accounted for 97.2% of national energy supply. The country's energy intensity has been much above the
world average and is still increasing. The energy consumption per capita grew from 2.17 tons of oil
equivalent(TOE) in 1990 to 4.10 tons of oil equivalent(TOE) in 2000, higher than in Japan and
Germany. South Korea was the tenth largest source of carbon dioxide (C02) emissions in the world as of
1999(World Bank, 1999).
South Korea has suffered environmental problems because of its heavy reliance on energy-intensive
economy. South Korea's anthropogenic emissions of greenhouse gases in 1997 are shown in Table 1.
Net CO2 emissions in 1997 were 439.2 MT, and energy-related CO2 emissions were 428.7,98% of the
total. South Korea's annual carbon dioxide emissions per capita are estimated to be 8.3 metric tons
versus 20.8 metric tons in the United States (World Bank, 1999: 208-209).
The CO2 emissions from fossil fuel combustion in the industrial sector contributed the largest share,
1) This paper was presented at the International Symposium Celebrating the 30th Anniversary of Graduate School
of Environmental Studies, Seoul National University, October 16, 2003.
2) * Professor, Graduate School of Environmental Studies, Seoul National University, [email protected], ** Professor, Center
for Energy and Environmental Policy, University of Delaware, Newark DE 19716-7301, *** Ph.D. Student, Graduate
School of Environmental Studies, Seoul National University, **** E-jang, Chuncheon City, Gangwon-do, 200-962, Korea,
***** Heuksalim Soil Research Institute, Aengcheon-li, Goesan-gun, Chungbuk, 367-911, Korea, ****** Research
Professor, Sangji University.

100
Table 1. Greenhouse Gas Emissions and Sinks by Sector in South Korea (1997)
(Unit: 1,000 Tons)
Emissions Source CO2 CH4 N20 NOx CO NMVOC
Net Emissions 439,206 3,041 24 1,837 4,316 2,088
Energy-Related Emissions 428,700 226 4 1,829 4,269 991
Industrial Process 33,981 19 11 9 46 1,096
Agriculture 603 9
Land Use and Forestry -26,503
Waste Management 3,027 2,192
Source: MOCIE and KEEL 1998. The Second-Year Study of Planning National Actions for the United Nations
Framework Convention on Climate Change. December: 69.
Table 2. Projections of Trends in Major Economic and Environmental Indicators by MOCIEIKEEI
Annual Growth (%) Major Indicator 1995 2000 2010 2020
96-00 01-10 11-20
GDP (In 1995 Won, Trillion) 377 461 784 1,163 4.1 5.4 4.0
Population (Million) 45.1 47.3 50.6 52.4 0.9 0.7 0.4
Primary Energy Consumption(MTOE) 150.4 191.1 271.2 332.2 4.9 3.6 2.1
CO2 Emissions (Million TC) 101.8 120.6 173.2 204.4 3.6 3.7 1.7
Energy/GDP (TOE/'95 Million Won) 0.40 0.41 0.35 0.29 0.8 -1.8 -1.9
COzlGDP (TC/'95 Million Won) 0.27 0.26 0.22 0.18 -0.5 -1.7 -2.2
Final Energy Consumption(MiIlionTOE) 122.0 152.4 213.9 257.9 4.6 3.4 1.9
Source: MOCIE/KEEI. 1999.
accounting for 35% of total CO2 emissions in 1997. The electricity generation sector was the second
largest source of CO2 emissions, with a share of 25%. The shares for the transportation and the
residential/commercial sectors were 22% and 17%, respectively. Even though the 1997-98 financial
crisis dampened energy consumption and consequently reduced CO2 emissions, South Korea resumed
earlier trends, with the average annual growth rate of total CO2 emissions being 0.8% during 1997-2000.
The electricity and industrial sectors posted faster growth in 2000, surpassing 1997 levels. It is notable
that despite South Korea's substantial investment in nuclear power, CO2 emissions from electricity
generation have grown faster recently than in any other.
The South Korean government's official forecast for energy and CO2 is shown in Table 2. The CO2
emissions from the energy sector are projected to more than double, growing at an annual rate of 2.8%
during the period of 1996-2020, from 101.8 million tons of carbon (MTC) in 1995 to 204.4 MTC in
2020. Per capita CO2 emissions are projected to increase from 2.3 TC in 1995 to 3.7 TC in 2020.
Greenhouse Gas Reduction Potential for South Korea 101
II. Greenhouse Gas Reduction Potential from Energr Efficiency Upgrading
An Energy Efficiency Database based on Energy Innovations (ASE et ai., 1997) published by the U.S.
Department of Energy (DOE) and its five national laboratories, a consortium of independent, non
governmental researchers in the U.S. and Recommended Strategies for the Mitigation of CO2 Emissions:
Phase I (CAS A, 1997) was used to assess the potentials of energy savings and greenhouse gas reduction.
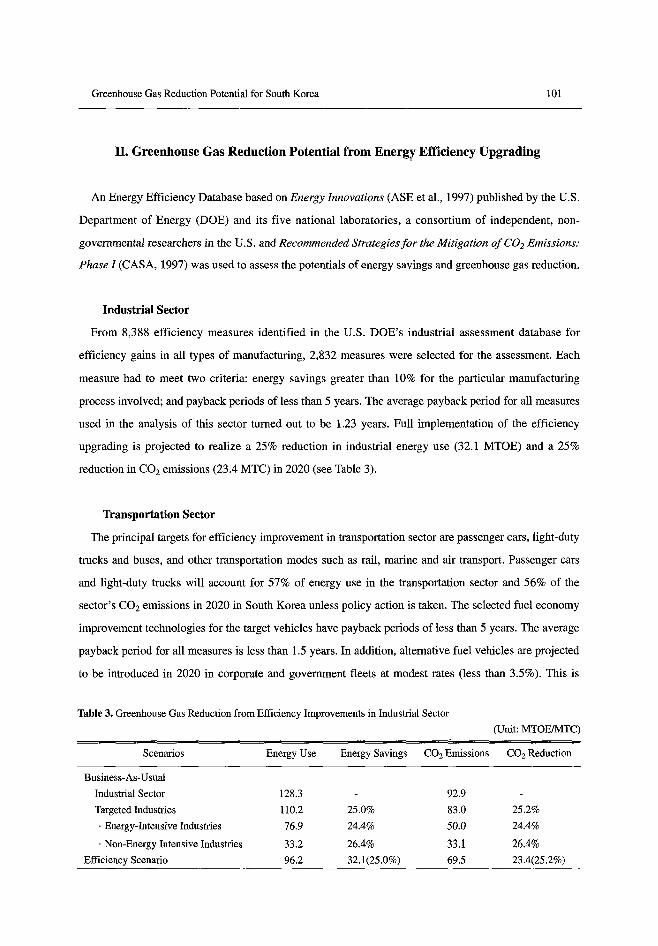
Industrial Sector
From 8,388 efficiency measures identified in the U.S. DOE's industrial assessment database for
efficiency gains in all types of manufacturing, 2,832 measures were selected for the assessment. Each
measure had to meet two criteria: energy savings greater than 10% for the particular manufacturing
process involved; and payback periods of less than 5 years. The average payback period for all measures
used in the analysis of this sector turned out to be 1.23 years. Full implementation of the efficiency
upgrading is projected to realize a 25% reduction in industrial energy use (32.1 MTOE) and a 25%
reduction in CO2 emissions (23.4 MTC) in 2020 (see Table 3).
Transportation Sector
The principal targets for efficiency improvement in transportation sector are passenger cars, light-duty
trucks and buses, and other transportation modes such as rail, marine and air transport. Passenger cars
and light-duty trucks will account for 57% of energy use in the transportation sector and 56% of the
sector's CO2 emissions in 2020 in South Korea unless policy action is taken. The selected fuel economy
improvement technologies for the target vehicles have payback periods of less than 5 years. The average
payback period for all measures is less than 1.5 years. In addition, alternative fuel vehicles are projected
to be introduced in 2020 in corporate and government fleets at modest rates (less than 3.5%). This is
Table 3. Greenhouse Gas Reduction from Efficiency Improvements in Industrial Sector (Unit: MTOEIMTC)
Scenarios Energy Use Energy Savings CO2 Emissions CO2 Reduction
Business-As-Usual Industrial Sector 128.3 92.9
Targeted Industries IlO.2 25.0% 83.0 25.2%
. Energy-Intensive Industries 76.9 24.4% 50.0 24.4%
. Non-Energy Intensive Industries 33.2 26.4% 33.1 26.4% Efficiency Scenario 96.2 32.1(25.0%) 69.5 23.4(25.2%)

102
Table 4. Greenhouse Gas Reduction from Improvements in Transportation Sector
(Unit: MTOEIMTC)
Scenarios Energy Use Energy Savings CO2 Emissions CO2 Reduction
Business-As-Usual
Transportation Sector 58.8 48.0
Targeted Technologies 58.8 28.1% 48.0 28.0%
Passenger Cars 25.4 34.6% 19.7 35.7%
Light-duty Trucks 8.3 24.2% 7.0 24.3%
Heavy Trucks 4.2 23.6% 3.5 23.6%
Buses 5.7 29.0% 4.8 28.4%
Rail, Marine and Air 15.1 20.0% 13.0 19.3%
Efficiency Scenario 42.3 16.5(28.1 %) 34.5 13.5(28.0%)
Table 5. Greenhouse Gas Reduction from Efficiency Improvements in Residential Sector
(Unit: MTOEIMTC)
Scenarios Energy Use Energy Savings CO2 Emissions CO2 Reduction
Business-As-Usual
Residential Sector 43.4 35.4
Targeted Technologies 35.0 33.8% 27.4 34.5%
· Space Heating 32.0 26.9% 23.3 26.8%
· Air Conditioning 0.8 17.3% 1.0 17.3%
· Refrigeration 0.9 38.0% 1.2 38.0%
· Lighting 1.4 61.9% 1.9 61.9%
· Shell Technology Improvements (1.9) 5.5% (1.4) 5.1%
Efficiency Scenario 28.7 14.7(33.8%) 23.2 12.2(34.5%)
projected to realize a 28% reduction in energy use (16.5 MTOE) and a 28% reduction in CO2 emissions
(13.5 MTC) in 2020 (see Table 4).
Residential Sector
Target end uses considered in the residential sector are water heating, air conditioning, lighting,
refrigeration and shell technology improvements. Energy used by these technologies will account for
81 % of the sector's consumption and 77% of CO2 emissi{)ns in 2020. For the analysis of this sector,
high-efficiency technologies with a cost of conserved energy of less than 60 wonlkWh (5¢IkWh) were
selected. It is projected to realize a 34% decrease in energy use (14.7 MTOE) and a 35% reduction in
CO2 emissions (12.2 MTC) in 2020 (see Table 5).

Greenhouse Gas Reduction Potential for South Korea 103
Commercial Sector
In the commercial sector, HVAC (heating, ventilation and air conditioning) upgrades, shell
improvements and the rapid diffusion of high-efficiency motors and high-efficiency lighting were the
major target. HVAC systems, motors and lighting will be responsible for 83% of energy use in the
commercial sector and 88% of CO2 emissions in 2020 unless action is taken. Technology improvements
were selected with a cost of conserved energy of less than 60 wonJkWh (5¢/kWh). It is projected to
realize a 36% savings in energy use (9.8 MTOE) and a 35% reduction in CO2 emissions (9.9 MTC) in
2020 (see Table 6).
Summarizing the results, the primary energy can be saved by 95.4 MTOE, a 28.7% down from the
BAU(business-as-usual) forecast and CO2 emission can be reduced by 58.9 MTC, a 28.8% down from
the BAU. The electricity savings amounts to 149.5 TWh which alleviate the need for constructing 17
nuclear power plants which can supply only 121.1 TWh as shown in Table 7. This shows that cost
effective options for energy efficiency improvements enable South Korea to meet national economic
objectives without the construction of additional nuclear power plants, justifying a nuclear power
moratorium. A key advantage of a moratorium policy would be the release of 30 trillion won (US$25
billion) for market-based development of energy efficiency (and other) strategies to meet South Korea's
energy needs in an ecologically responsible way.
Figure 1 contrasts South Korea's projected primary energy consumption and CO2 emissions in 2020
under the government's official forecast (MOCIEIKEEI, 1999) with the effects of full implementation of
the energy efficiency improvement scenario.
Table 6. Greenhouse Gas Reduction from Efficiency Improvements in Commercial Sector
(Unit: MTOEIMTC)
Scenarios Energy Use Energy Savings CO2 Emissions CO2 Reduction
Business-As-Usual
Commercial Sector 27.4 28.1
Targeted Technologies 22.8 35.8 24.8 35.3
. Space Heating 10.1 29.2 7.6 27.1
. Air Conditioning 2.4 39.0 3.3 39.0
. Lighting & Other 7.2 33.1 9.6 33.0
. Motor 3.2 42.0 4.3 42.0
. Shell Technology Improvements (1.8) 7.8 (1.4) 5.5 Efficiency Scenario 17.6 9.8(35.8%) 18.3 9.9(35.3%)

104
Table 7. Summary of Primary Energy Savings and CO2 Emission Reductions from Efficiency Improvement in 2020
Sector
TOTAL SAVINGS
. Primary Energy
. CO2
New Nuclear Plant Capacity
Energy Efficiency Improvements(Electricity)
350,---------------..,
~ 300 Q)
<Il
;., 150 ~rz=0 ~ !-< 200
f 1150
U 100
~ ~ 50 ........... .
.. .
1993 1010
BAll
200
~ 160
" OIl,.. ...,u "'f-o !! 0: 120
J ~ 30
c; U
40
1993 2010
1010
2020
Effect of Energy Efficiency Improvement
95.4 MTOE(28.7% down)
58.9 MTC(28.8% down)
30.3 MTOE(121.2 TWh)
33.6 MTOE(149.5 TWh)
Energy Efficiency hnprovement ~Or-------------_,
300 Savi1le:. = 95.4 MTOE
250
1991l 2010 2020
EnB"gy Efficiency hnprovement
200 Reduct.",. = 58.9 MTC
lI\)
III
00
40
W3 2010 2020
Figure 1. Energy Consumption and C02 Emissions in 2020: BAU and the Energy Efficiency Improvement Scenario
III. Greenhouse Gas Reduction Potential in Land Use and Transportation
Transportation is the primary cause for the urban air pollution in Korea: it accounts for 87% of
nitrogen oxides and 96% of hydrocarbons in Seoul(Jeon and Kim 1997), which are the main air
pollutants causing the smog in the city. The air qualities in Korean metropolitan cities are much worse
than other metropolitan cities in developed countries, even though the Korea's emission standards of

Greenhouse Gas Reduction Potential for South Korea 105
automobiles are one of the tightest in the world. This means that the current transportation system in
Korea is in great need of improvement to reduce the automobile trips. The energy use, especially that in
transportation, varies markedly depending on the land use planning. The demand for transportation and
energy can be reduced by improving the land use and the transportation system in such a way as to
reduce the demand for automobile trip and the travel distance and to increase the share of mass transport
and bicycle trip. Land use in national scale as well as urban scale affects the demands for energy and
transportation. But it is not easy to assess the cause-effect analysis of land use and transportation system
in national scale. So this study focuses on the urban land use and transportation system. Since the
transportation accounts for about 20% of the total energy use in Korea(JISEEF, 1999), saving energy in
this sector will have a significant effect on reducing GHGs.
The automobiles are the most important means of transportation in Korea: the share of automobiles in
the passengers transportation was 81.7%, that of subway 10.7% and that of railroad 6.3% in
1997(JISEEF, 1999). Among the three, the number of automobiles is increasing the fastest. The number
of automobiles is expected to grow two fold by 2020 according to the BAU scenario: the total number of
vehicles is projected at over 22 million, nearly one car for every two persons.
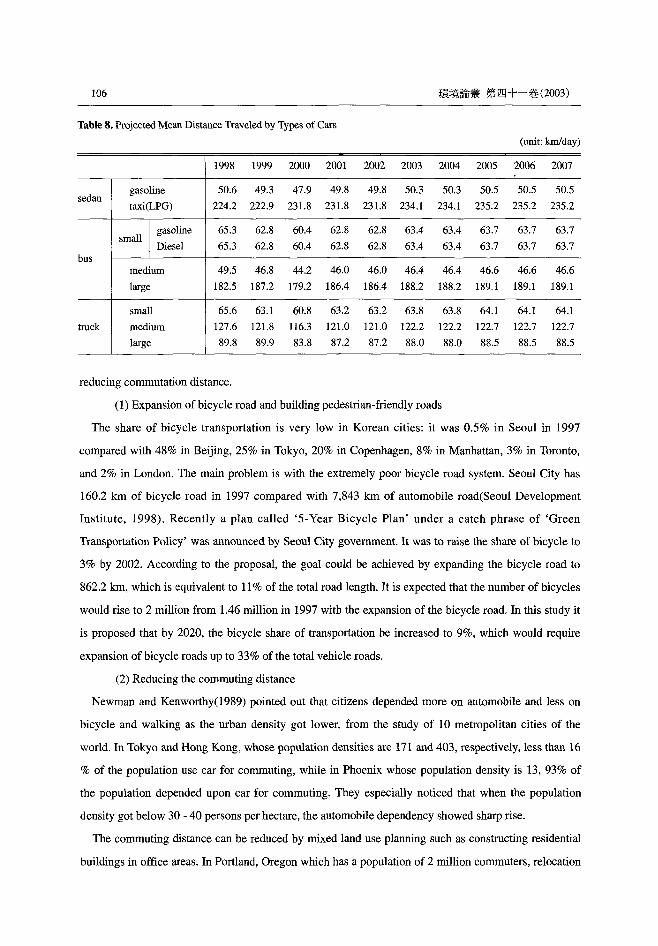
The serious problem with the Korean transportation system is in that the distances automobiles travel
are far longer than those in any other developed countries of the world. The sedan's mean distance
traveled(MDT) in Korea is 25,696 km/year, which is far greater than the reported value of United States
of America, 19,051 km/year, and 2.5 times that of Japan, 9,990 km/year(W.S. Kim, 1999).
The government is constructing local trunk roads to link between cities and surrounding regions to
facilitate local transportation and national highways allover the country to link between every comers of
the nation within 6 hours. Judging from the current transportation policies and trend, the automobile
travel distances are by no means likely to decrease. The MDTs are projected to stay at almost the same
level as the current level in spite of the increased number of cars as shown in Table 8 (SDI, 1998).
Some cities in the world have successfully improved their traffic conditions by reducing the traffic. In
this sense, Korea needs to improve land use and transportation system in such a way to minimize the
travel demand and subsequently the energy use. This will help improve the air qualities as well as reduce
the GHGs emissions.
Policy Approach
Land use policies to reduce traffic and energy demand can be approached in diverse ways both in
national and regional scale. The policies frequently discussed include expansion of bicycle road,
building pedestrian-friendly environment, suppressing automobile trips by reducing parking space and
106
Table 8. Projected Mean Distance Traveled by Types of Cars
(unit: km/day)
1998 1999 2000 2001 2002 2003 2004 2005 2006 2007
gasoline 50.6 49.3 47.9 49.8 49.8 50.3 50.3 50.s 50.s 50.5 sedan
taxi(LPG) 224.2 222.9 231.8 231.8 231.8 234.1 234.1 235.2 235.2 235.2
gasoline 65.3 62.8 60.4 62.8 62.8 63.4 63.4 63.7 63.7 63.7 small
Diesel 65.3 62.8 60.4 62.8 62.8 63.4 63.4 63.7 63.7 63.7 bus
medium 49.5 46.8 44.2 46.0 46.0 46.4 46.4 46.6 46.6 46.6
large 182.5 187.2 179.2 186.4 186.4 188.2 188.2 189.1 189.1 189.1
small 65.6 63.1 60.8 63.2 63.2 63.8 63.8 64.1 64.1 64.1
truck medium 127.6 121.8 116.3 121.0 121.0 122.2 122.2 122.7 122.7 122.7
large 89.8 89.9 83.8 87.2 87.2 88.0 88.0 88.5 88.5 88.5
reducing commutation distance.
(1) Expansion of bicycle road and building pedestrian-friendly roads
The share of bicycle transportation is very low in Korean cities: it was 0.5% in Seoul in 1997
compared with 48% in Beijing, 25% in Tokyo, 20% in Copenhagen, 8% in Manhattan, 3% in Toronto,
and 2% in London. The main problem is with the extremely poor bicycle road system. Seoul City has
160.2 km of bicycle road in 1997 compared with 7,843 km of automobile road (Seoul Development
Institute, 1998). Recently a plan called '5-Year Bicycle Plan' under a catch phrase of 'Green
Transportation Policy' was announced by Seoul City government. It was to raise the share of bicycle to
3% by 2002. According to the proposal, the goal could be achieved by expanding the bicycle road to
862.2 km, which is equivalent to 11 % of the total road length. It is expected that the number of bicycles
would rise to 2 million from 1.46 million in 1997 with the expansion of the bicycle road. In this study it
is proposed that by 2020, the bicycle share of transportation be increased to 9%, which would require
expansion of bicycle roads up to 33% of the total vehicle roads.
(2) Reducing the commuting distance
Newman and Kenworthy(1989) pointed out that citizens depended more on automobile and less on
bicycle and walking as the urban density got lower, from the study of 10 metropolitan cities of the
world. In Tokyo and Hong Kong, whose population densities are 171 and 403, respectively, less than 16
% of the population use car for commuting, while in Phoenix whose population density is 13, 93% of
the population depended upon car for commuting. They especially noticed that when the population
density got below 30 - 40 persons per hectare, the automobile dependency showed sharp rise.
The commuting distance can be reduced by mixed land use planning such as constructing residential
buildings in office areas. In Portland, Oregon which has a population of 2 million commuters, relocation
Greenhouse Gas Reduction Potential for South Korea
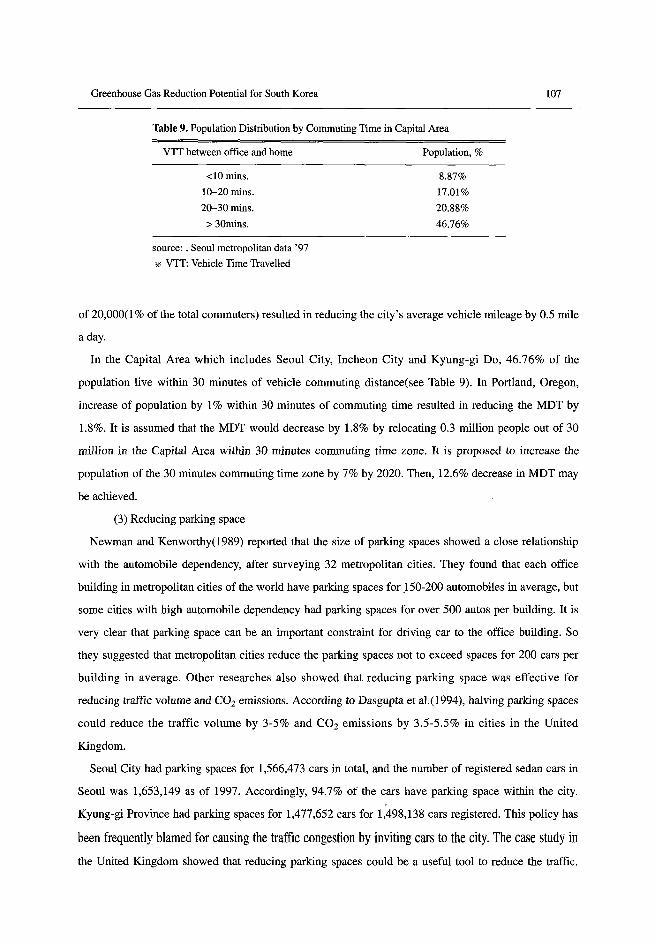
Table 9. Population Distribution by Commuting Time in Capital Area
VTT between office and home
<lOmins. 10-20 mins. 20-30mins. > 30mins.
source: , Seoul metropolitan data '97 *' VTT: Vehicle Time Travelled
Population, 0/0
8.870/0
17.010/0
20.880/0
46.760/0
107
of 20,000(1 % of the total commuters) resulted in reducing the city's average vehicle mileage by 0.5 mile
a day.
In the Capital Area which includes Seoul City, Incheon City and Kyung-gi Do, 46.76% of the
population live within 30 minutes of vehicle commuting distance(see Table 9). In Portland, Oregon,
increase of population by 1 % within 30 minutes of commuting time resulted in reducing the MDT by
1.8%. It is assumed that the MDT would decrease by 1.8% by relocating 0.3 million people out of 30
million in the Capital Area within 30 minutes commuting time zone. It is proposed to increase the
population of the 30 minutes commuting time zone by 7% by 2020. Then, 12.6% decrease in MDT may
be achieved.
(3) Reducing parking space
Newman and Kenworthy(1989) reported that the size of parking spaces showed a close relationship
with the automobile dependency, after surveying 32 metropolitan cities. They found that each office
building in metropolitan cities of the world have parking spaces for .150-200 automobiles in average, but
some cities with high automobile dependency had parking spaces for over 500 autos per building. It is
very clear that parking space can be an important constraint for driving car to the office bUilding. So
they suggested that metropolitan cities reduce the parking spaces not to exceed spaces for 200 cars per
building in average. Other researches also showed that reducing parking space was effective for
reducing traffic volume and CO2 emissions. According to Dasgupta et al.(1994), halving parking spaces
could reduce the traffic volume by 3-5% and CO2 emissions by 3.5-5.5% in cities in the United
Kingdom.
Seoul City had parking spaces for 1,566,473 cars in total, and the number of registered sedan cars in
Seoul was 1,653,149 as of 1997. Accordingly, 94.7% of the cars have parking space within the city.
Kyung-gi Province had parking spaces for 1,477,652 cars for 1,498,138 cars registered. This policy has
been frequently blamed for causing the traffic congestion by inviting cars to the city. The case study in
the United Kingdom showed that reducing parking spaces could be a useful tool to reduce the traffic.

108
Table 10. Summary of Policies and Their Effects
policies
I. expand 2,586 kIn bicycle road
---> increase in TSR of bicycle by 9%
2. reduce parking space by 50%
---> decrease in MDT by 3.7%
3. increase population within 30 mins.
commuting time zone by 7%
---> decrease in MDT by 12.6%
'* TSR(Transportation share ratio)
MDT(Mean distance travelled)
effects
. decrease in TSR
by 9%
. decrease in MDT
by 16.3%
net effect in 2020
Traffic: 23% 1 (= 100 - 91 x 0.837)
Energy: 9.7 MTOE 1
CO2: 7.9MTC 1
Reducing the parking spaces by 50% by 2020 was set as a possible scenario following the British
example.
Reduction Potential
These three policies proposed above and their effects are summarized in Table 10.
We can reduce the traffic demand considerably just by expanding bicycle roads, reducing parking
spaces and relocating commuters closer to their work places. If the policies suggested in this study,
which has been proved effective in other countries, are fully implemented, the traffic demand could be
reduced by 23%. This can further reduce the energy use by 9.7 MTOE and CO2 emission by 7.9 MTC in
2020.
IV. Greenhouse Gas Reduction Potential in Agricultural Sector
The GHGs emissions arise from a variety of sources including methane(CH4) from rice paddies and
livestock, nitrous oxide (N20) from the use of nitrogenous fertilizer, cultivated soils and feedlots, and
carbon dioxide(C02) from the consumption of energy used in farming machines and heating of green
house.
The beneficial role of agriculture in sequestering GHGs used not to be counted in assessing the GHGs
emissions in Korea(Office for Government Policy Coordination, 1999).3 The agriculture can reduce the
3) According to the documents on climate change issued by the government, the agricultural sector was simply
considered as an emitter of GHGs while the forestry was regarded as a creditor of GHGs. And in projecting the
future emission of GHGs, the increase in energy and GHGs emission from mechanization and greenhouse
farming was not considered. Thus, according to the Comprehensive Plan for Climate Change Strategies made by
the government, it is predicted that the GHGs emissions from the agricultural sector would reach 2.56 million TC
in 2020, which is 1.0% of the total down from 2.2% in 1995.

Greenhouse Gas Reduction Potential for South Korea 109
amount of atmospheric CO2 through biomass production, especially through integrated ecological
farming systems including rotation of crops, crop mixing, improved irrigation system, management of
nutrient budgets, livestock waste management, and conserved tillage.
There have been conflicting opinions regarding the contribution of paddy land in GHGs. Some
western countries see the paddy land as a main source of methane and insist that the GHGs emission tax
should be imposed on the rice-producing countries in the East and Southeast Asia(Ministry of
Environment, 1997). In 1992, the rice paddies in South Korea was estimated to produce 399,000 metric
tons of methane. But the carbon dioxide absorbed in the same year by the paddies was estimated at
18,975,000 metric tons(JISEEF, 1999). Since the methane gas is considered to be 11 times more
effective in warming up the globe than carbon dioxide, the net effect of the rice paddies will be
absorption of 14,586,000 tons of carbon dioxide, which is more than 4 times the global warming effect
of methane gas produced by the paddies(see Table 11). Therefore, rice paddies should be considered as
GHGs creditor, not an emitter.
The rice paddies in South Korea have been rapidly converted into other land uses such as urban,
industrial and resort development because farming is not economically attractive at all, thus lowering the
self-reliance rate of food in South Korea down below 30%. Therefore it was regarded as very important
to suppress the reckless conversion of rice paddies to other land uses to a minimum to secure a certain
acreage of land for rice production.
The Emission of GHGs and Sequestration
(1) Emission
The main emission sources of GHGs are methane(CH4) from paddy land, nitrous oxide(N20) from the
use of chemical fertilizer, methane(CH4) from the livestock raising, and carbon dioxide(C02) from the
energy consumption for machine and greenhouse farming.
The projected emissions of GHGs in agriculture in whole are summarized in table 12(J.W. Kim et aI.,
2002). Some important messages of the results can be pointed out as follows.
-The emission of GHGs from rice paddies is expected to decrease and its contribution to the total
GHGs in agricultural sector also: from 47% in 1985 to 23% in 2020. It will not be the major emission
source of GHGs in agricultural sector anymore in the future.
Table 11. The Carbon Dioxide Absorbed and Methane Produced by the Rice Paddies In South Korea(as of 1992)
C02 absorbed CH4 produced equivalent C02 produced(ll times CH4) net C02 absorbed
18,975,000t 399,000t 4,389,000 14,586,000

110 ~~iffiBii ~1m+-1iH2003)
Table 12. The Projected Emission of GHGs in Agricultural Sector(BAU)
1985 1990 1995 2000 2005 2010 2020
CH4 from Paddy emission(1000 TC) 2,322 2,407 1,992 1,920 1,820 1,820 1,820
percent to the total 47% 42% 32% 27% 24% 24% 23%
1000 TC 696 934 776 749 708 667 667 N20
percent to the total 14% 17% 12% 11% 10% 9% 8%
1000TC 1,195 1,043 1,470 1,510 1,575 1,640 1,770 C~ from Livestock
percent to the total 24% 18% 23% 21% 21% 22% 22%
1000TC 726 1,251 2,090 2,925 3,343 3,510 3,677 CO2 from Energy Use
percent to the total 15% 22% 33% 41% 45% 46% 46%
l000TC 4,939 5,635 6,328 7,104 7,446 7,637 7,934 total
growth rate basis 14% ..... 28% ..... 43% ..... 50% ..... 54% ..... 60% .....
-The emission of N20 from nitrogenous fertilizer is expected to remain steady, but its contribution to
the total GHGs will decrease in the future: from 14% in 1985 to 8% in 2020,
-The emission of CH4 from the livestock farming will increase, but the contribution to the total is
expected to remain almost the same: from 24% in 1985 to 22% in 2020,
-The contribution of energy use for farming machines and greenhouse is growing rapidly and is
becoming the major source of GHGs in agriculture. In 1985, it accounted for only 15% of the total
GHGs emission. But it is expected to reach more than 46% of the total in 2020.
(2) Sequestration
Well-managed agricultural resources can increase both the environmental benefits and the efficiency
of agricultural production. But the role of agriculture in reducing CO2 has been almost neglected. The
sequestration effect of agriculture for GHGs has decreased continually, mainly because the farming area
has decreased ..
The GHGs sequestration effect of agriculture depends on the kind of crops. The sequestration of
GHGs is estimated from each crop's capacity of carbon assimilation and its farming area as in Table 13.
The Staple food crops such as grains, beans and potato are better than non-staple crops such as
vegetables and fruits in terms of both sequestration and food security(see Table 14). The government has
tried to preserve especially the rice paddies for food security by banning conversion of rice paddies to
other land uses but unsuccessfully. Other grain crops, without the government's supportive policy, have
fallen down much more rapidly. The BAU analysis shows that the farming area for staple crops other
than rice in 2020 would fall to 34% of that in 1985.

Greenhouse Gas Reduction Potential for South Korea
Table 13. The CO2 Absorption Capacities of Crops
rice
grains other 9 major grains
sub-total
fruits
leaves vegetables
roots
sub-total
Table 14. Sequestration of GHGs in Agricultural Sector
1985
Staple Crops 8,108
Rice 5,635
Other Staple Crops (barley, 2,473
miscellaneous grains, pulse and potato)
Non-Staple Crop
(vegetables, fruits and so on) 133
Total 8,241
Strategies
(1) Strategy1: Reduction of Emission
-CH4 from Paddy
1990
7,603
5,669
1,933
160
7,763
111
(unit: 1000 tons/year, as of 1993)
16,351
2,624
18,975
67
146
212
425
(unit: 1000 TC)
1995 2000 2005 2010
6,136 5,835 5,560 5,414
4,811 4,691 4,560 4,560
1,325 1,144 1,000 854
232 210 195 170
6,368 5,938 5,755 5,646
Since paddy land is very beneficial for sequestrating GHGs through photosynthesis, the reduction of
paddy lands is not recommended. Rather paddy lands should be preserved as much as possible. The
effective ways for solving the CH4 emission from rice paddies are not in reducing the paddy lands, but
should be found in improving the farming methods such as irrigation and seeding. For example, direct
seeding is better than transplantation and methane production can be reduced by improving irrigation
method.
-N20 from Fertilizers
Nitrous oxide is 270 times more effective in absorbing heat than carbon dioxide. The best way to
reduce the emission of N20 is in reducing the use of nitrogenous fertilizers. Recently the government
announced that it was planning to reduce the fertilizer use by 30% in Saemangum watershed to improve
the water quality of the freshwater lake to be constructed in the reclamation site. It declared that such
reduction would have no impact on the agricultural output(Joint Investigation Committee for

112
Saemangum Project, 2000).
The following strategies are considered as effective in reducing the N20 emission.
· The organic wastes such as manure and food wastes are compos ted for fertilizer.
· Growing ducks, snails and loaches in rice paddies as practiced by some farmers in order to remove
weeds and pests can reduce significant amount of chemical fertilizers.
· The use of nitrogen-fixing plants commonly found in Korea such as azola can help reduce the use
of nitrogenous fertilizers. These grasses are also very effective in suppressing the growth of other
weeds.
-CH4 from the Livestock
Reduction of the livestock farming is the best way to reduce the CH4 emission from livestock
farming. Anaerobic digestion is it good method to dispose of the livestock manure. Methane is produced
in the process, but it can be used as fuel instead of being released into the atmosphere. It reduces the
water pollution as well as the methane emission. The digested sludge is an excellent organic fertilizer
which would reduce the use of nitrogenous fertilizer. This in tum will reduce the emission of nitrous
oxide.
-C02 from Energy Consumption
Until now Korea has emphasized on raising the crop production per unit area neglecting all the energy
input to produce it. But in fact it should be realized that the net production is more important after all
because most types of energy are exchangeable through market. Emphasis should be given to raising the
energy efficiency of farming machines and developing ecological farming practices like no-tillage and
direct seeding which require less energy and manpower. The greenhouse is a very energy-intensive
farming. It is mainly to supply out-of-season fruits and vegetables. The government used to give subsidy
for establishing large-scale greenhouses. But it is time to reconsider the policy and give subsidy to de
greenhousing for environmental reasons.
(2) Strategy2: Raising of Sequestration
-The Most important point is that the scale of agriculture must not be reduced. The reduction of
agricultural activity is the root of all wrongs in the GHGs management policy.
-The production of other staple crops such as grains like barley and wheat, pulse and potato should be
increased. Especially, wheat and barley grown in rice paddies can effectively reduce GHGs in winter
without much additional energy input. If wheats are grown in 28% of the paddy land in winter, it can
supply 30% of domestic wheat consumption. In 1965, 27% of wheat consumption was supplied from the
domestic production. But, the import of wheat flour from the U.S.A from 1970 totally destroyed the
base of domestic wheat production.
Greenhouse Gas Reduction Potential for South Korea 113
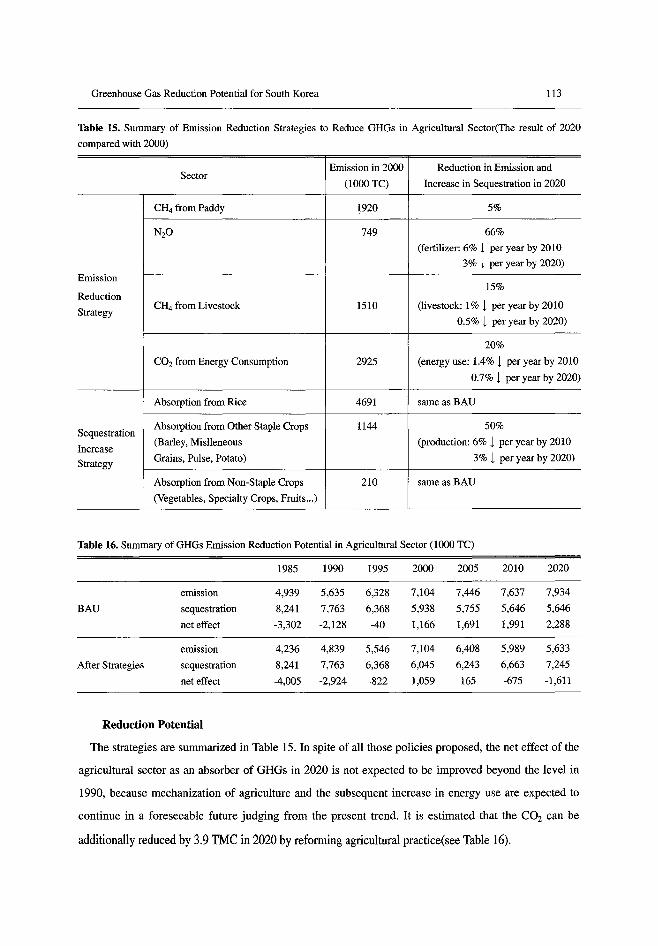
Table 15. Summary of Emission Reduction Strategies to Reduce GHGs in Agricultural Sector(The result of 2020
compared with 2000)
Emission in 2000 Reduction in Emission and Sector
(lOOOTC) Increase in Sequestration in 2020
CH4 from Paddy 1920 5%
N20 749 66%
(fertilizer: 6% 1 per year by 2010
3% 1 per year by 2020)
Emission 15%
Reduction
Strategy CH4 from Livestock 1510 (livestock: 1 % 1 per year by 2010
0.5% 1 per year by 2020)
20%
CO2 from Energy Consumption 2925 (energy use: 1.4% 1 per year by 2010
0.7% 1 per year by 2020)
Absorption from Rice 4691 same as BAU
Sequestration Absorption from Other Staple Crops 1144 50%
Increase (Barley, Mislleneous (production: 6% 1 per year by 2010
Strategy Grains, Pulse, Potato) 3% 1 per year by 2020)
Absorption from Non-Staple Crops 210 same as BAU
(Vegetables, Specialty Crops, Fruits ... )
Table 16. Summary of GHGs Emission Reduction Potential in Agricultural Sector (1000 TC)
1985 1990 1995 2000 2005 2010 2020
emission 4,939 5,635 6,328 7,104 7,446 7,637 7,934
BAU sequestration 8,241 7,763 6,368 5,938 5,755 5,646 5,646
net effect -3,302 -2,128 -40 1,166 1,691 1,991 2,288
emission 4,236 4,839 5,546 7,104 6,408 5,989 5,633
After Strategies sequestration 8,241 7,763 6,368 6,045 6,243 6,663 7,245
net effect -4,005 -2,924 -822 1,059 165 -675 -1,611
Reduction Potential
The strategies are summarized in Table 15. In spite of all those policies proposed, the net effect of the
agricultural sector as an absorber of GHGs in 2020 is not expected to be improved beyond the level in
1990, because mechanization of agriculture and the subsequent increase in energy use are expected to
continue in a foreseeable future judging from the present trend. It is estimated that the CO2 can be
additionally reduced by 3.9 TMC in 2020 by reforming agricultural practice(see Table 16).

114
v. Sequestration from Forests
The Kyoto Protocol to the United Nations Framework Convention on Climate Change specifies the
principle that carbon sequestration can be used by participating nations to help meet their respective net
emission reduction targets for carbon dioxide and other green house gases. Several studies have found
that growing trees to sequester carbon could provide relatively low-cost net emission reductions for a
number of countries including Korea(Richard G. Newell, Robert N. Stavins, 1999).
However, the forest area has decreased steadily during the course of industrialization and
urbanization, from 6,701,000 ha in 1960 to 6,436,000 ha in 1998(Statistical yearbook of forestry, 29,
1999). The main cause of decrease in forest area is conversion offorest into other land uses. As of 1995,
forests occupied 65.8% of the total land in Korea, farm land 22.1 %, public area 2.4%, building site
2.2%, manufacturing area 0.4% and others 7.1 % as of 1995(Korea Research Institute for Human
Settlement, www.kiris.re.kr). The sequestration capacity of the forests is projected to decrease as shown
in Table 17.
Policy Approach
The fores~ policy in Korea should be focused first on preserving the forest lands, because they have
been disappearing continually, and next on enhancing the carbon sequestration capacity of the existing
forests by increasing the forest storage.
(1) Preservation of the forest area.
The forests in Korea have been disappearing mainly because of logging, conversion of forest lands for
development into other land uses and pest infection.
Table 17. CO2 Sink and Emission in Forest Sector (BAU)
(unit: MTC)
Year 1990 1995 2000 2010 2020
The Change of forestry Net absorption -7.154 -6.866 -8.750 -7.910 -7.450
or other ligneous Gross absorption -7.957 -7.493 -10.020 -9.900 -10.310 biomass storage The emission of deforestation 0.803 0.627 1.270 1.990 2.860
The emission of CO2 from
forestry and grassland conversion NA .071 .050 .040 .030
The emission from the soil NA 1.278 1.300 1.230 .770
Total -6.212 -5.517 -7.400 -6.640 -6.660
Source: Office for Government Policy Coordination(l999), The Comprehensive Responsive Program about Climate
Change Convention

Greenhouse Gas Reduction Potential for South Korea 115
Reducing logging
Currently, 8.7% of the forest storage is logged annually (Forestry Administration, The Fourth Forest
General Planning ('99-2008) ). If this trend continues further in the future, there is not much left to do
about forest policies. Therefore, it is very important to control the logging at a certain manageable level.
Suppressing the conversion offorest lands into other land uses
The conversion of forest land into other uses should be controlled. According to the BAU scenario,
the land use conversion of forest land is expected to decrease by 4.8% each year from 2000.
Pest management
Effective management of forest may be more effective than securing forest area and planting the trees.
So the Korean government is gradually showing more interest in managing the forest. Especially, pest
management is important. Every year, vermin does a great harm to pine forests. According to <The
Fourth Basic Forest Plan>, the government is planning to work on 270,000 hectares each year for pest
management.
(2) Enhancement of sequestrating capacity of forest
Enhancing the carbon sequestrating capacity of forest land by accumulating forest storage is also very
important. The methods to increase the biomass storage of forest can be listed as follows.
Planting trees in the forests
According to <The Fourth Basic Forest Plan>, afforestation area will be 21,000 hectares each year. It
is known that the natural forest in Korea generally can fix 4.36kg of carbonlm2-year (Jo, 1995). Then,
916 million tons of carbon can be fixed additionally if this plan is implemented.
Managing the urbanforests
There are two methods of managing the urban forests. One is creating new urban, forests and the other
is planting the roadside trees. According to <The Fourth Basic Forest Plan>, urban forest afforestation
area will be 58,000 hectares each year, and the number of roadside trees to be planted is 2 million each
year. It is reported that the urban forest can fix 3.55kg of carbonlm2-year (Jo, 1995). Then, 2 million tons
of carbon can be fixed annually by urban forest. Ginkgo, widely planted in roadside, is known to be an
excellent carbon absorber: each ginkgo tree is known to absorb 0.2kg of carbon a year in average (Jo,
1995). Then, 2 million trees can fix 0.4 million tons of carbon in a year.
Conversion of idle land into forestry
Many farm lands have been left idle as farmers leave the country. Those idle lands rarely are returned
to farm lands again. They are usually located in remote areas or deep mountain areas. These lands can be
changed into forest. According to <The Fourth Basic Forest Plan>, 400 hectares of idle lands will be
made into forest each year. Since the Korean natural forest is known to absorb 4.36kg of carbonlm2-

116
Table 18. Summary of Policy Scenarios
Scenario Measure Explored
BAU -the CO2 emission due to logging increases by 4% annually.
(Business As Usual) -the CO2 emission from land use conversion decrease by 2.5% annually
-policyl: no increase in CO2 from logging.
-policy2: the CO2 emission from land use conversion decrease by 2.8% each year.
Forest Sequestration
Strategies
-policy3: create 0.916 MTC with new forestry each year.
-policy4: create 2.059 MTC with urban forest each year.
-policy5: create 0.400 MTC with urban landscape trees each year.
-policy6: create 0.017 MTC by converting idle land into forestry each year.
Table 19. Carbon Sequestration by Forest
(Unit: MTC)
BAU With Forest Policies
1990 -6.212 -6.212
1995 -5.517 -5.517
2000 -7.400 -7.400
2005 -7.020 -12.033
2010 -6.640 -11.975
2015 -6.650 -12.186
2020 -6.660 -12.387
year, this plan can absorb 17,000 tons of additional carbon annually.
Planting pollution-resistant trees and trees with better carbon-fixing ability
Planting the pollution-resistant trees and trees with better carbon-fixing capability is more effective in
sequestrating carbon emission. It is known that broad-leaved trees can store 2.5 times more carbon than
conifers because of rapid growth (10,1995).
Sustainable forestry
Well-managed forests are known to be 1.3 times more effective in storing carbon than neglected
forests (Korea Forest Research Institute, 1998). According to <The Fourth Basic Forest Plan>, 261,000
hectares of forest will be taken care of each year under the sustainable forestry program.
The policies are summarized in Table 18.
Table 19 shows the amount of CO2 sequestered until 2020. As shown in the table, Korea's carbon
sequestration capacity can be raised through proper management of forest. The full implementation
scenario can raise the sequestration capacity by 12.387 MTC, the major sink development scenario by
10.916 MTC per year and the moderate scenario by 9.357 MTC per year in 2020.
The Sequestration of carbon by forest was estimated at 6.212 MC in 1990 and projected to stay at
Greenhouse Gas Reduction Potential for South Korea 117
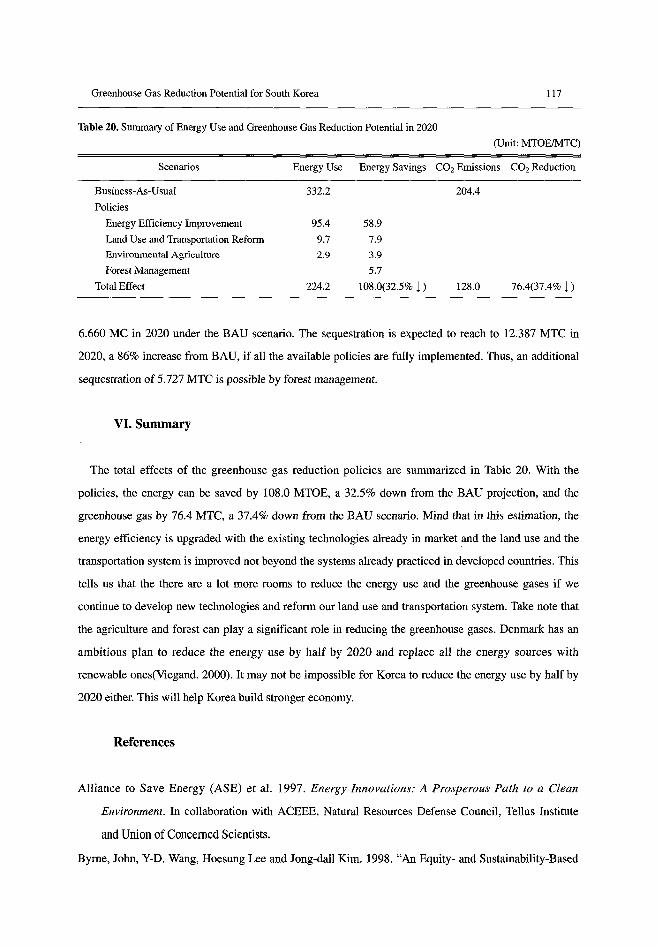
Table 20. Summary of Energy Use and Greenhouse Gas Reduction Potential in 2020
(Unit: MTOEIMTC)
Scenarios Energy Use Energy Savings CO2 Emissions CO2 Reduction
Business-As-Usual 332.2 204.4
Policies
Energy Efficiency Improvement 95.4 58.9
Land Use and Transportation Reform 9.7 7.9
Environmental Agriculture 2.9 3.9
Forest Management 5.7
Total Effect 224.2 108.0(32.5% 1 ) 128.0 76.4(37.4% 1 )
6.660 MC in 2020 under the BAD scenario. The sequestration is expected to reach to 12.387 MTC in
2020, a 86% increase from BAD, if all the available policies are fully implemented. Thus, an additional
sequestration of 5.727 MTC is possible by forest management.
VI. Summary
The total effects of the greenhouse gas reduction policies are summarized in Table 20. With the
policies, the energy can be saved by 108.0 MTOE, a 32.5% down from the BAD projection, and the
greenhouse gas by 76.4 MTC, a 37.4% down from the BAD scenario. Mind that in this estimation, the
energy efficiency is upgraded with the existing technologies already in market and the land use and the
transportation system is improved not beyond the systems already practiced in developed countries. This
tells us that the there are a lot more rooms to reduce the energy use and the greenhouse gases if we
continue to develop new technologies and reform our land use and transportation system. Take note that
the agriculture and forest can play a significant role in reducing the greenhouse gases. Denmark has an
ambitious plan to reduce the energy use by half by 2020 and replace all the energy sources with
renewable ones(Viegand. 2000). It may not be impossible for Korea to reduce the energy use by half by
2020 either. This will help Korea build stronger economy.
References
Alliance to Save Energy (ASE) et a!. 1997. Energy Innovations: A Prosperous Path to a Clean
Environment. In collaboration with ACEEE, Natural Resources Defense Council, Tellus Institute
and Union of Concerned Scientists.
Byrne, John, Y-D. Wang, Hoesung Lee and Jong-dall Kim. 1998. "An Equity- and Sustainability-Based

118
Policy Response to Global Climate Change." Energy Policy 26(4): 335-343.
CASA. 1997. Recommended Strategies for the Mitigation of CO2 Emissions: Phase I. Japan.
Chae, Jei Chun et al. 1999. "The Prospects of Safe Food Production Technology", Food Crisis: Korea's
Path, The Organizing Committee for Joint Symposium of Korea Society of Breeding Science,
Korea Society of Agricultural Crop Science and Korea Society of Soil Fertility, pl22.
Dasgupta, M. et al. 1994. Impact of transport policies in five cities, Transport Research Laboratory.
Edmonds, Jae, Michael J. Scott, Joseph M. Roop, Christopher N. MacCracken. 1999. International
Emissions Trading & Global Climate Change: Impacts on the Costs of Greenhouse Gas Mitigation.
Prepared for the Pew Center on Global Climate Change. December.
Environmental Planning Institute (EPI). 1999. "Sectoral Energy Consumption Patterns and
Environmental Conditions in South Korea." Sustainable Energy and Environment White Paper.
Prepared by EPI, RIEEE and CIES. Seoul: Seoul National University.
Forestry Administration. 1999. The Fourth Forest General Planning ('99-2008).
Forestry Administration. 1999. Statistical yearbook offorestry, Vol. 29.
Intergovernmental Panel on Climate Change (IPCq. 2001. Climate Change 2001: The Scientific Basis.
Eds. J.T. Houghton, Y. Ding, DJ. Griggs et al. New York: Cambridge University Press.
__ .1996. Climate Change 1995: The Science of Climate Change, Contribution of Working Group II
to the 2nd Assessment Report of the Intergovernmental Panel on Climate Change. Cambridge,
England: Cambridge University Press. Pp. 589-647.
__ . Summary for Policymaker Land use, Land-use Change, and Forestry
Interlaboratory Working Group (JWG). 2000. Scenarios for a Clean Energy Future. Prepared for Office
of Energy Efficiency and Renewable Energy, U.S. Department of Energy. Prepared by staff from
five DOE national Laboratories: Oak Ridge National Laboratory, Lawrence Berkeley National
Laboratory, Argonne National Laboratory, the National Renewable Energy Laboratory and the
Pacific Northwest National Laboratory.
Jeon, E.c. and lW. Kim. 1997. "State of Air Pollution and Policy Issues in Seoul, Republic of Korea,"
J. Env. Studies, 35, 71-89 .
nSEEF. 1999. "Sustainable Energy and Environmental White Paper", Journal of Kyobo Education and
Cultural Studies, 1,471-618, the Kyobo Foundation for Education and Culture. Kim, Soon Gwan.
1997. Transportation census and database in Seoul.
Jo, Hyun-Kil, et al. 1995. "Atmospheric CO2 Sequestration by Urban Greenspace -In the case of
chuncheon", Journal of Korea landscape architecture, Vol. 23. No 3.80-93.
10, Hyun-Kil and Cho, Dong-Ha. 1998. "Annual CO2 Uptake by Urban Popular Landscape Tree

Greenhouse Gas Reduction Potential for South Korea 119
Species", Journal of Korea Landscape Architecture, Vol. 26. No 2, 38-53.
Joint Investigation Committee for Saemangum Project. 2000. The Final Report of the Joint Investigation
on the Saemangum Project: The Water Quality Section.
Kim, 1.w. , K.S. Lim and S. Ahn. 2002. "The Greenhouse Gas Emission in Agricultural Sector in South
Korea and Strategies toward Sustainability", Proc. the 6th Asia-Pacific NGO's Environmental
Conference, Kaoshiung, Taiwan, Asia- Pacific Environmental Council, 3A201-3A218.
Kim, Woon Soo. 1999. A study on Preliminary Implementation of Reducing Excessive Emissions from
Old Vehiclesfrom Old Vehicles, SDI.
Korea Energy Economics Institute (KEEl). 2000. Energy Statistics Information System. Available at
http://her.keei.re.kr: 3081.
__ . 2001. Korea Monthly Energy Review.
__ . 2000. Korea Monthly Energy Review.
__ . 1999. Energy Statistics Information System. Available at 2000. 2000 Yearbook of Energy
Statistics.
__ . 1999. The Third-Year Study of Planning National Actions for the United Nations Framework
Convention on Climate Change. December.
__ . 1998. The Second-Year Study of Planning National Actions for the United Nations Framework
Convention on Climate Change. December.
Korea Institue of Agricultural Economy. 1999. Agricultral Prospects 2000.
Korea Forest Research Institute. 1998. The Practice Planning about Climate Change Convention.
Ministry of Environment, 1997. The recent trend and each nation policy direction about Climate
Change Convention (2).
Newell, Richard G. and Robert N. Stavins. 1999. "Climate Change and Forest Sinks: Factors Affecting
the Costs of Carbon Sequestration", Resources for the Future.
Newman, P. and Kenworthy, J. 1989. Cities and Automobile Dependence: An International Sourcebook,
Aldershot, UK.: Gower.
OECD. 1997. Innovation in transport behavior and technology.
Office for Government Policy Coordination. 1999. The comprehensive responsive program about
Climate Change Convention.
RIEEE. 1999. CO2 emission prospect at transportation sector in 2020.
SDI. 1998. Seoul City's Air Quality Management Plan.
SDI. 1998. A Study for Seoul Bicycle Plan.
Viegand, 1. 2000. "Implementation of Energy Efficiency Measures in Denmark towards Sustainability",

120
Proc. Int'l Seminar on Sustainable Conservation and Development Strategies, Graduate School fo
Environmental Studies, SNV.
World Bank. 1999. World Development Report: Knowledge for Development. New York: Oxford
University Press.