REDUCING NON-ENERGY GREENHOUSE GASESagrienvarchive.ca/download1/reduce_non-energy_GHGs94.pdf ·...
199
REDUCING NON-ENERGY GREENHOUSE GASES NOVEMBER 1994 Ministry of Environment and Energy
Transcript of REDUCING NON-ENERGY GREENHOUSE GASESagrienvarchive.ca/download1/reduce_non-energy_GHGs94.pdf ·...
REDUCING NON-ENERGY
GREENHOUSE GASES
NOVEMBER 1994
Ministry of Environment and Energy


ISBN 0-7778-2787-5
REDUCING NON-ENERGYGREENHOUSE GASES
NOVEMBER 1994
Cette publication techniquen'est disponible qu'en anglais.
Copyright: Queen's Printer for Ontario, 1994This publication may be reproduced for non-commercial purpose
with appropriate attribution.
PIBS 3289E


REDUCING NON-ENERGYGREENHOUSE GASES
Report prepared by:VHB!HICKLING
Concord Scientific LimitedEconometric Research Limited
Report prepared for:
Ontario Ministry of Environment and Energy

ACKNOWLEDGEMENT AND DISCLAIMER
This report was prepared for the Ontario Ministry of Environment and Energy as partof a Ministry funded project. The views and ideas expressed in this report are those ofthe author and do not necessarily reflect the views and policies of the Ministry of theEnvironment and Energy, nor does mention of trade names or commercial productsconstitute endorsements or recommendation for use.
The Ministry, however, encourages the distribution of information and stronglysupports technology transfer and diffusion. Any person who wishes to republish partor ail of this report should apply for permission to do so to the Ontario Ministry ofEnvironment and Energy, 135 St. Clair Avenue West, Toronto, Ontario, M4V 1P5,Canada.
Copyright: Queen's Printer for Ontario, 1994. This publication may be reproduced fornoncommercial purposes with appropriate attribution.
Caveat:
This report was completed in 1993. Some of the assumptions may differ from those usedin the development of Canada's National Action Plan for Climate Change in 1994.
In particular, Canada's target for Greenhouse Gas Emissions excludes CFC's and othergases controlled under the Montreal Protocol, which are included in this report. Also thecoefficients assumed for Global Warming potentials (in CO2 equivalents) are being revisedupward in light of new evidence. Consequently the aggregate results should be interpretedin this light. Total non-energy gases as shown in the Action Plan will be a smaller sharethan is shown here. The individual measure analyses and results are unaffected by thesefactors.


Contents
Tables v
Executive summary vii
Abbreviations xii
1 Introduction 11.1 The greenhouse effect 11.2 Preventing or avoiding impacts from the greenhouse effect 11.3 Objectives and scope of the study 3
2 Major sources of non-energy greenhouse gases 42.1 Types of non-energy greenhouse gases 42.2 Global warming potentials 62.3 Sources of greenhouse gas emissions 82.4 Target sources of greenhouse gases 9
3 Actions to reduce CFC emissions 133.1 Criteria for selecting actions 143.2 Plastic foams 163.3 Refrigeration and air conditioning 233.4 Aerosols 303.5 Sterilization 323.6 Solvents 33
4 Actions to reduce methane emissions 354.1 Livestock methane emissions 354.2. Methane emissions from the natural gas industry 414.3 Methane emissions from sewage treatment plants 444.4 Methane emissions from solid waste decomposition 454.5 Relationships among actions 51
i

5 Actions for reducing carbon dioxide emissions 535.1 Concrete 535.2 Lime 575.3 Pulp and paper 585.4 Ammonia 605.5 Raw CO2 61
6 Actions to reduce nitrous oxide emissions 636.1 Adipic acid 636.2 N2O 646.3 Nitrogenous fertilizer 646.4 Ammonia 67
7 Costs of actions and measures 697.1 Actions to reduce GHG emissions 697.2 Measures to induce the actions 74
8 Impact analysis of actions 818.1 Description of impact analysis 828.2 Economic impact of actions 848.3 Results of impact analysis 85
9 Conclusions and recommendations 92
A Action summary information sheets 94
B Modelling framework 143B.1 Estimation of carbon dioxide equivalence 144B.2 Estimation of private or social costs 145B.3 Determination of incremental unit costs 147B.4 Construction of the abatement cost curve 147
ii

C Measures applicable to specific emission types 149C.1 CFC emissions 149C.2 Livestock emissions 152C.3 Natural gas utility emissions 156C.4 Landfill methane emissions 161C.5 Adipic acid 165C.6 N2O anaesthetic 165C.7 Nitrogenous fertilizer 166C.8 Ammonia 168C.9 Cement and lime manufacturing 170C.10 Pulp and paper 172C.11 Raw CO2 172
References 173
iii

iv

Tables
Table 1 Summary of key greenhouse gases affected by human activities. 2Table 2 Emission reductions required to stabilise atmospheric
concentrations at present day levels 2Table 3 Relative global warming potentials (GWP) of greenhouse gases 6Table 4 Greenhouse gas emissions in Ontario, 1988 10Table 5 Significant sources of anthropogenic non-energy greenhouse gases
in Ontario, 1988 11Table 6 Potential reduction of CFC emissions in the plastic foams industry
in 2005 22Table 7 Emissions from commercial refrigeration 28Table 8 Potential reduction of CFC emissions in refrigeration in 2005 31Table 9 Estimated methane emissions from livestock respiration, Ontario, 1988 37Table 10 Methane emissions during transmission and distribution in Ontario,
1989 42Table 11 Cost and reduction potential of landfill gas recovery actions 49Table 12 Cost and reduction potential of composting actions 50Table 13 Cost and reduction potential of incineration 50Table 14 Effect of diversion of waste in 1995 on landfill gas production in
2005 51Table 15 Summary of incremental reductions and costs by action, within
major groups 71Table 16 Actions ordered by economic attractiveness 72Table 17 Summary of criteria for the evaluation of measures 78Table 18 Types of measures applicable by control factors 79Table 19 Economic impact of actions on Ontario 89Table 20 Employment impacts by industry if actions on Ontario 90Table 21 Ranking of actions by value added multiplier, employment and unit cost 91Table B-1 Framework for estimating carbon dioxide equivalences 144Table B-2 Summary of calculation of annualized cost of action 146Table B-3 Example of estimating incremental unit costs where there are
different implementation timetables 148Table C-1 Measures for CFCs 149Table C-2 Measures applicable to livestock emissions 153Table C-3 Measures for natural gas utilities 157
v
Table C-4 Measures applicable to landfill methane emissions 161Table C-5 Measures applicable to nitrogenous fertilizers 166Table C-6 Measures applicable to ammonia production 169Table C-7 Measures applicable to cement and lime manufacturing 171
vi

Executive summary
Purpose
The purpose of this study is to assist the Ontario Ministries of Environment, Energy andTreasury and Economics in formulating policies to reduce the non-energy emissions ofgreenhouse gases in Ontario.
Objective and scope
The objectives of the study are:
< to identify emission sources to be targeted for assessment of actions and measures;
< to identify and evaluate behavioural and technical actions to reduce non-energyemissions of greenhouse gases in Ontario;
< to estimate the potential quantities of greenhouse gas reductions which could beachieved and the costs of achieving them; and
< to review issues related to implementation including measures to induce the actions,timing and economic impacts.
The study focuses on emissions other than CO2 from combustion for energy, which isaddressed elsewhere by existing, on-going or proposed government of Ontario analyses. Itconsiders the economic and environmental costs and benefits of the actions and measuresthat affect these emissions.
The greenhouse gases considered are carbon dioxide, methane, chlorofluorocarbons andtheir substitutes, and nitrous oxide. The time frame for the analysis is 1991 to 2005.
vii
Methodology
The approach to the study consists of the following:
Identify major sources of greenhouse gas emission in Ontario—based on existinggreenhouse gas inventories the non-energy anthropogenic sources of greenhouse gases areidentified. These source emissions are standardized using carbon dioxide equivalent globalwarming potentials. Significant sources of greenhouse emissions are targeted for furtheranalysis.
Identification of actions—through a review of the literature and consultation with industryand government, actions for reducing greenhouse gas emissions are identified. The potentialeffect of these actions will have on greenhouse gas emissions are evaluated on a per unitbasis by source. Estimates of the total number of units affected by each action for eachsource are made.
Evaluation of actions—costs are estimated for the actions, and are expressed on a unit basis(i.e. dollars per tonne of carbon dioxide equivalent) for 2005 emissions. Where there aremultiple actions aimed at the same emissions source, an estimate of the nature of thecombined effect of the actions is estimated by calculating incremental unit costs. On thisbasis it is possible to order actions from the least to the most expensive per tonne of carbondioxide equivalent.
Implementation issues—in principle, the actions evaluated are technical or behaviouralchanges that reduce the quantity of greenhouse gas emissions emitted in 2005. (In practice,it is often difficult to separate actions from policy measures.) Policy measures that mightinduce these actions to be taken are reviewed, and the impacts of the actions and measuresare considered using the Ontario regional input—output model and experiences in otherjurisdictions. Implementation issues such as timing of action, public perception, stockturnover rates, fairness considerations, level of government involvement required, technicalmaturity of the action and possible market imperfections are identified. Distributionalconsiderations by sector and geography of measures are discussed and possible ways ofmitigating these inequities are examined.
viii

Sources of data and their limitations
Emissions—the major source of greenhouse gas emissions data is SENES (1992). Wherenecessary greenhouse gas emissions from specific sources are estimated. Sources for whichno reliable estimate of greenhouse gas emissions are available are excluded from theanalysis. There is considerable uncertainty surrounding the significance and forecast ofvarious emissions and there is limited opportunity for reducing this uncertainty. Potentialreductions in emissions for actions are based on a review of relevant literature anddiscussions with industry and government representatives. Often potential emissionsreductions are process or source specific.
Global warming potential—greenhouse gas emissions are converted into carbon dioxideequivalents using IPCC (1990) 100 year time horizon global warming potentials. Indirectglobal warming effects are excluded. The 100 year time frame was considered to be mostappropriate for policy analysis and for consistency with other studies undertaken. Shorteror longer time frames can be chosen altering the relative effects of the different greenhousegases.
Costs of actions and measures—information regarding actions and measures are compiledfrom reviews of the literature and contact with industry and government representatives.The data may reflect the costs associated with development and testing of an action. Costsof actions cannot be applied to specific sources in Ontario. Many actions and measures forreducing greenhouse gas emissions are under development and not yet commerciallyavailable. The costs and effects of these actions are not known.
Implementation impacts—are based on secondary sources of information and the Ontarioinput-output model. The analysis of the impacts of implementing actions is limited by thereliability of the emissions forecast and lack of detailed cost data for most actions.
Findings
1) Non-energy greenhouse emissions account for about 30 per cent of total greenhouseemissions in Ontario and about 43 per cent of anthropogenic emissions (carbondioxide equivalent). Chlorofluorocarbons and methane are the largest contributors.Based on carbon dioxide equivalency non-energy sources of greenhouse gases aresignificant contributors to global warming.
ix

2) The most significant sources of emissions are chlorofluorocarbons for refrigeration andplastic foam production, and methane from landfills. Up to four times morechlorofluorocarbons are used for plastic foam insulation than is used as refrigerant ina domestic refrigeration unit.
3) Actions for reducing greenhouse gases from most major sources are available. Inmany cases these actions will be taken without further intervention to achieve otherobjectives. For example, elimination of N2O emissions from adipic acid production,chlorofluorocarbons emissions (due to the Montreal Protocol) and the capture oflandfill gas (CH4).
4) There is a lack of data for quantifying actions for reducing emissions from somesources, particularly emissions from chlorofluorocarbon use and from industrialprocesses.
5) Actions identified in this study could reduce emissions by almost three-quarters if fullyadopted. The costs of doing so are about 1.4 billion dollars per year in 2005 althoughsome of the actions (composting and landfill gas recovery) result in a net benefit andothers are not expected to result in any significant costs (alternatives tochlorofluorocarbons as blowing agents in plastic foams production).
6) Except for mobile air conditioning the impact of implementing actions to reducechlorofluorocarbons is not significant for the sources examined. Greenhouse gasemissions from waste can be reduced and result in net benefits. The reduction ofmethane emissions from livestock can be implemented with minimal impacts.
7) The earlier actions which affect emissions from sources which store or "bank"greenhouse gases are implemented the greater the emissions reduction in 2005. Suchactions should be implemented as soon as possible.
8) Adoption of the actions will result in reduction of greenhouse gas emissions beyond2005.
x

Conclusions
1) Most of the sources and types of non-energy greenhouse gas emissions have beenidentified in current greenhouse gas emission inventories. Incomplete inventoriesexist for chlorofluorocarbons, fertilizer applications, and non-anthropogenic sources.
2) Actions to reduce non-energy greenhouse gas emissions can be implemented withminimal impact on the Ontario economy. Actions which reduce chlorofluorocarbonemissions from mobile air conditioners result in greater impacts on economic activity,employment and tax revenue resulting from the high capital and operatingexpenditures on related industries and consumers.
Recommendations
1) A complete inventory of sources and quantities of chlorofluorocarbons and industrialnon-energy greenhouse gases should be undertaken to facilitate the evaluation ofpossible actions and measures on these sources.
2) Further research is required to determine the costs and impacts of measures forimplementing the adopted actions.
3) Actions for reducing non-energy greenhouse gas emissions should be combined withactions for reducing energy related emissions to facilitate in the development of acomprehensive strategy for the reduction of greenhouse gas emissions.
4) Research into the dynamic impacts of implementing a strategy to reduce greenhousegas emissions including the actions evaluated in this study should be undertaken.
xi

Abbreviations
a the SI symbol for annum (year)CE carbon dioxide equivalentCFC chlorofluorocarbonDOC digestible organic compoundsGHG greenhouse gasGWP global warming potential (often relative to CO2)k kilo (thousands)M mega (millions)MSW municipal solid wasteNUG non-utility generatort tonne (1000 kilograms)
xii

1 Introduction
1.1 The greenhouse effect
One of the most serious environmental issues facing society today is global warming. It isclear that there is a natural greenhouse effect which keeps Earth warmer than it wouldotherwise be. In addition to this background effects, emissions from human activities aresubstantially increasing the atmospheric concentrations of the greenhouse gases : primarilycarbon dioxide (CO2), methane (CH4), chlorofluorocarbons (CFCs) and nitrous oxide (N2O).(see Table 1.)
These increases are expected to enhance the natural greenhouse effect, resulting inadditional warming of Earth's surface (IPCC 1990). Carbon dioxide and other traceatmospheric gases (nitrous oxide, methane, chlorofluorocarbons and halocarbons) aretransparent to incoming visible and ultraviolet solar radiation but readily absorb the longerwavelength (infrared) radiation that is re-emitted from Earth's surface. The subsequentdownward refraction ( or remission) of the infrared radiation and the absorption of infraredradiation raises the temperature of Earth's surface by more than 30EC over what it wouldbe in the absence of the trace gases—the natural greenhouse effect.
That increased concentrations of greenhouse gases will affect global climate is certain, butthe timing, the magnitude and locales of the impacts remain controversial. The knowledgeof emission rates of greenhouse gases, and of the means and implications of preventing oradapting to greenhouse warming will play a vital role in enhancing understanding of societalimplications of this effect.
1.2 Preventing or avoiding impacts from the greenhouse effect
In order to stabilize atmospheric concentrations, substantial reductions in global emissionsof these gases are required, as is indicated in Table 2. Achieving these reductions willrequire significant changes in technology, lifestyles or both in developed countries, likeCanada, which are highly dependent on energy sources and products that account for theseemissions; Canada is identified with the fifth highest per capita greenhouse gas emissionsin the world, exceeded only by Lao People's Democratic Republic, Qatar, United ArabEmirates and Bahrain (WRI 1990:17).
1

Table 1. Summary of key greenhouse gases affected by human activities.
Carbondioxide Methane CFC-11 CFC-12 Nitrous
oxide
Atmospheric concentration ppmv b ppmv pptv c pptv ppbv d
Pre-industrial (1750-1800) 280 0.8 0 0 288
Present day (1990) 353 1.72 280 484 310
Current rate of change per year 1.8 (0.5%)
0.015(0.9%)
9.5 (4%)
17 (4%)
0.8 (0.25%)
Atmospheric lifetime (years) (50-200) a 10 65 130 150
SOURCE: IPCC 1990, p. xvi.
NOTES: a. The way in which CO2 is absorbed by the oceans and biosphere is not simpleand a single value cannot be given.
b. ppmv= parts per million by volume.c. ppbv = parts per billion by volume.D. pptv = parts per trillion by volume.
Table 2. Emission reductions required to stabilise atmospheric concentrations at presentday levels.
Greenhouse gas Reduction required
Carbon dioxide >60%
Methane 15 - 20%
Nitrous oxide 70 - 80%
CFC-11 70 - 75%
CFC-12 75 - 85%
HCFC-22 40 - 50%
SOURCE: IPPC 1990.
In Ontario, a considerable amount of work has been done on assessing the potential forreducing greenhouse gas emissions associated with energy use, and the implications ofmeasures for achieving the same. In addition, actions have been taken to reduce the releaseof other greenhouse gases, such as CFCs and NOx (which contains N2O). However, thesenon-energy related sources of greenhouse gases remain significant.
2

In summary, emissions of greenhouse gases is a serious environmental problem facingglobal society, including Ontario. Sources of greenhouse gas emissions include both energyand non-energy related sources, and significant reductions in these are required to stabilizeatmospheric concentrations at present day levels. Preliminary estimates for Ontario, and theexperience reported in other jurisdictions suggest that non-energy sources of greenhousegas emissions are significant, and merit investigation.
1.3 Objectives and scope of the study
The purpose of this study is to assist the Ontario Ministries of Environment, Energy andTreasury and Economics in formulating policies to reduce the non-energy emissions ofgreenhouse gases in Ontario.
The objectives of the study are:
< to identify emission sources to be targeted for assessment of actions and measures;
< to identify and evaluate behavioural and technical actions to reduce non-energyemissions of greenhouse gases in Ontario;
< to estimate the potential quantities of greenhouse gas reductions which could beachieved and the costs of achieving them; and
< to review issues related to implementation including measures to induce the actions,timing and economic impacts.
The study focuses on emissions other than CO2 from combustion for energy, which isaddressed elsewhere by existing, on-going or proposed government of Ontario analyses. Itconsiders the economic and environmental costs and benefits of the actions and measuresthat affect these emissions.
The greenhouse gases considered are carbon dioxide, methane, chlorofluorocarbons andtheir substitutes, and nitrous oxide. The time frame for the analysis is 1991 to 2005.
3

2 Major sources of non-energy greenhouse gases
2.1 Types of non-energy greenhouse gases
The discussion below identifies types of greenhouse gas as a prerequisite for identifyingactions and measures.
2.1.1 Chlorofluorocarbons
Chlorofluorocarbons are long lived synthetic chemicals containing chlorine, fluorine andcarbon. They are released into the atmosphere from many sources including plastic foammanufacturing and use, air conditioning and refrigeration systems manufacturing, servicingand disposal, and as solvents, propellants in aerosols and sterilants. While emissions of CFCsare relatively small, their global warming potential (GWP) is significant, as much as tenthousand times that of carbon dioxide, tonne for tonne. This is due to their chemical andradiative properties and their life in the atmosphere, which may be several hundred years.
The major CFCs of concern are CFC-11, CFC-12, and CFC-113.
2.1.2 Methane
Methane is produced naturally as a product of anaerobic decomposition, or organicdecomposition in the absence of oxygen, and as a byproduct of the petroleum industry.
Methane as the result of anaerobic decomposition has several sources: animals, particularlyruminants, expel significant quantities of methane as a byproduct of the digestion of fodder.Human and livestock manure gives off methane gas as it decomposes; and municipal solidwaste also yields methane as it decomposes in landfills. Anaerobic decomposition also occursnaturally in wetlands and swamps.
Methane emitted from manure storage tanks and landfills poses a potentially seriousexplosive threat as well as an environmental threat. Collection and disposal of theseemissions is already undertaken to ameliorate the explosive hazard: expansion of thiscollection and use of the gas for energy can provide an economic benefit and eliminate the
4
environmental harm caused by atmospheric methane at the same time.
2.1.3 Nitrous oxides
Of all the greenhouse gases, the nitrous oxide flux is least understood. N2O emission levelsare also extremely uncertain; the primary biogenic sources identified are microbial soilnitrification and denitrification (OTA 1990). Anthropogenic sources of N2O, althoughestimates are highly uncertain, include fossil fuel combustion (particularly coal), industrialprocesses such as nitric acid and adipic acid production, nitrogenous fertilizer use and directuse of nitrous oxide as an anaesthetic and a propellant.
The global warming potential of nitrous oxide includes not only direct radiative properties,but also indirect effects, as nitrous oxide contributes to ozone depletion in the upperatmosphere.
2.1.4 Carbon dioxide
As well as being a significant byproduct of fossil fuel combustion, carbon dioxide is storedin living organic matter and released during decomposition. Deforestation has been a leadingcause of increasing concentrations of carbon dioxide in the atmosphere.
Carbon dioxide is also a product of the aerobic decomposition of sewage, animal waste andmunicipal solid waste and is given off during the combustion of biomass including wasteincineration, wood residue incineration and forest fires.
Carbon dioxide emission during decomposition of organics, e.g., municipal solid waste andanimal manure, have not been considered in this study. To the extent that forestry, forexample, is practised sustainably, i.e., that sufficient trees are planted to replace thoseharvested, carbon dioxide given off during the decomposition of products made from trees,like timber, or given off during combustion, like CO2 emissions from forest fires, is, in turn,taken up by living, growing trees. This is true of carbon dioxide emissions given off duringhuman and livestock respiration, during decomposition of animal waste, and duringdecomposition of organic foodstuffs and yard waste. To the extent, however, that organicsare not produced sustainably, i.e., they are mined, CO2 emissions given off duringdecomposition are net emissions to the atmosphere, at least in the short term.
5

Carbon dioxide is emitted during the manufacture of cement, as a byproduct of industrialfermentation processes and during kraft wood pulp manufacture. Coke and ammoniaproduction also releases carbon dioxide into the atmosphere.
However, as carbon dioxide can be released from organic material, it can also besequestered in growing or preserved organic material, such as forest products.
2.2 Global warming potentials
There are numerous compounds that contribute to global warming. In order to assess therelative significance of any emission, it is desirable to be able to express emissions ofdifferent compounds on a common basis, that reflects their contribution to the problem. Onemeans of doing this is by using an index of a compound's global warming potential (GWP).There are several such indices, some based on physical factors, and some based oneconomic factors. The GWPs in most common use are those based on physical properties,developed by the 1990 Intergovernmental Panel on Climate Change (IPCC). These arepresented in Table 3.
Table 3. Relative global warming potentials (GWP) of greenhouse gases.
Greenhouse gas Global warming potential
Carbon dioxide 1
Methane 21
Nitrous oxide 290
CFC-11 3500
CFC-12 7300
HCFC-22 1500
SOURCE: IPCC 1990
6
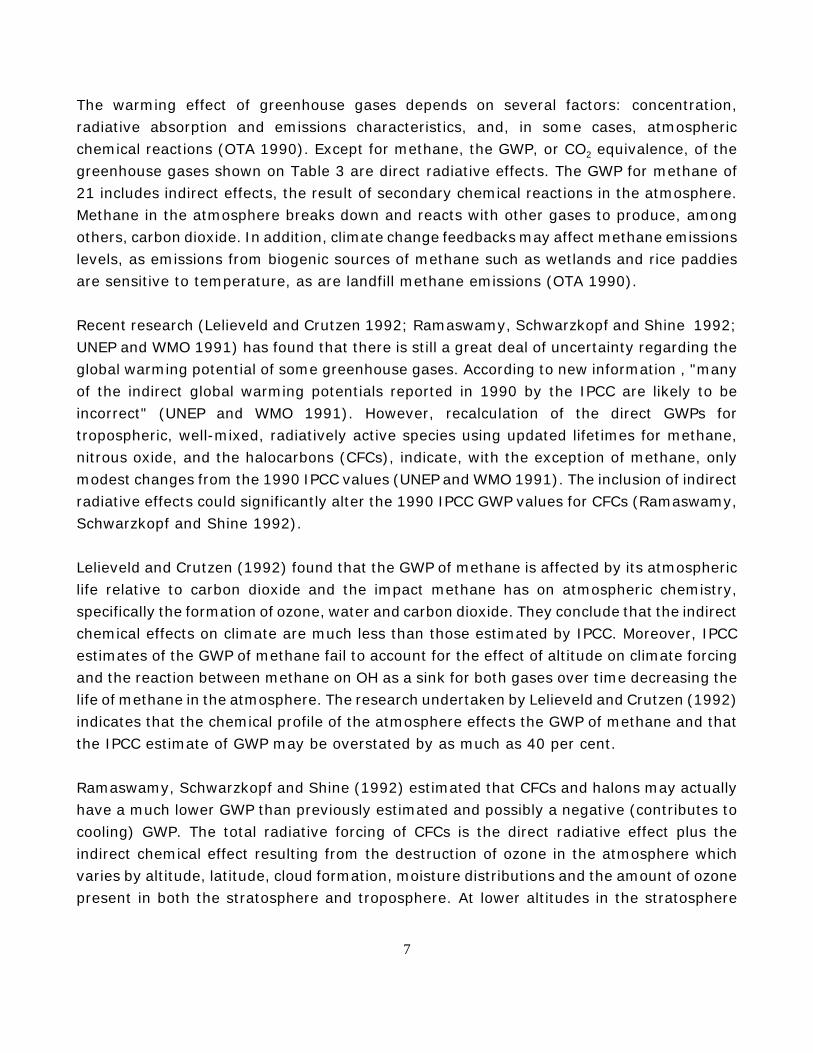
The warming effect of greenhouse gases depends on several factors: concentration,radiative absorption and emissions characteristics, and, in some cases, atmosphericchemical reactions (OTA 1990). Except for methane, the GWP, or CO2 equivalence, of thegreenhouse gases shown on Table 3 are direct radiative effects. The GWP for methane of21 includes indirect effects, the result of secondary chemical reactions in the atmosphere.Methane in the atmosphere breaks down and reacts with other gases to produce, amongothers, carbon dioxide. In addition, climate change feedbacks may affect methane emissionslevels, as emissions from biogenic sources of methane such as wetlands and rice paddiesare sensitive to temperature, as are landfill methane emissions (OTA 1990).
Recent research (Lelieveld and Crutzen 1992; Ramaswamy, Schwarzkopf and Shine 1992;UNEP and WMO 1991) has found that there is still a great deal of uncertainty regarding theglobal warming potential of some greenhouse gases. According to new information , "manyof the indirect global warming potentials reported in 1990 by the IPCC are likely to beincorrect" (UNEP and WMO 1991). However, recalculation of the direct GWPs fortropospheric, well-mixed, radiatively active species using updated lifetimes for methane,nitrous oxide, and the halocarbons (CFCs), indicate, with the exception of methane, onlymodest changes from the 1990 IPCC values (UNEP and WMO 1991). The inclusion of indirectradiative effects could significantly alter the 1990 IPCC GWP values for CFCs (Ramaswamy,Schwarzkopf and Shine 1992).
Lelieveld and Crutzen (1992) found that the GWP of methane is affected by its atmosphericlife relative to carbon dioxide and the impact methane has on atmospheric chemistry,specifically the formation of ozone, water and carbon dioxide. They conclude that the indirectchemical effects on climate are much less than those estimated by IPCC. Moreover, IPCCestimates of the GWP of methane fail to account for the effect of altitude on climate forcingand the reaction between methane on OH as a sink for both gases over time decreasing thelife of methane in the atmosphere. The research undertaken by Lelieveld and Crutzen (1992)indicates that the chemical profile of the atmosphere effects the GWP of methane and thatthe IPCC estimate of GWP may be overstated by as much as 40 per cent.
Ramaswamy, Schwarzkopf and Shine (1992) estimated that CFCs and halons may actuallyhave a much lower GWP than previously estimated and possibly a negative (contributes tocooling) GWP. The total radiative forcing of CFCs is the direct radiative effect plus theindirect chemical effect resulting from the destruction of ozone in the atmosphere whichvaries by altitude, latitude, cloud formation, moisture distributions and the amount of ozonepresent in both the stratosphere and troposphere. At lower altitudes in the stratosphere
7
direct radiative forcing from CFCs is partially or fully offset by the negative forcing resultingfrom the depletion of stratospheric ozone. Moreover, the positive forcing potential oftropospheric (ground level) ozone is also offset by CFC destruction of ozone. As such theGWP for CFCs developed by IPCC and used in this study may overstate the global warmingpotential of CFCs.
In another study (UNEP and WMO 1991) also concluded that stratospheric ozone depletioninduces decreased atmospheric radiative forcing, offsetting "a significant fraction" of theincreased forcing attributed to emissions of greenhouse gases. They predicted that thedecreased radiative forcing as a result of ozone depletion may be approximately equal to theradiative forcing caused by emissions of CFCs, the primary contributors to ozone depletion.This suggests that the net global warming potential of CFCs may be relatively small, evennil. However, the UNEP and WMO study is still under review, and there remains significantuncertainty regarding GHG emissions and the relative effects of greenhouse gases. Thefollowing discussion of actions to reduce greenhouse gases will include CFCs, still theprimary cause of stratospheric ozone depletion.
2.3 Sources of greenhouse gas emissions
The Global Warming Inventory for the Province of Ontario (SENES 1992) and theCompilation of an Ontario Gridded Carbon Dioxide and Nitrous Oxide Emission Inventory(ORTECH 1991), are the available Ontario-specific inventories of greenhouse gas emissions.It is only recently that efforts have been made to quantify greenhouse gas emissions, andthese inventories are best considered preliminary estimates.
Nevertheless, they provide a good starting point for identifying the relative order ofimportance of various emission types.
2.3.1 SENES inventories for CO2, N2O, CH4 and CFCs
SENES (1992) estimates inventories for CO2, N2O, CH4 and CFCs for 1988. The reportincludes estimates of uptake by sinks and methodologies for forecasting net GHG emissions.The methodology followed for the inventory is standard. The main finding of the inventoryis summarized in Table 4.
A time scale of 100 years was chosen in the SENES report to express the GWP for the
8

inventoried greenhouse gases. Different uncertainties in the GWPs for the variousgreenhouse gases could affect the relative importance of gases from a control point of view.In view of these factors, determination of the uncertainties in the emissions is vital.
2.4 Target sources of greenhouse gases
Of the anthropogenic non-energy related sources of greenhouse gas emissions inventoried,17 sources comprise over 80% of the total. These sources (shown in Table 5 and Figure 1)are the primary focus of actions and measures to induce reduced emissions.
More than one-half of these emissions are CFCs, while CH4 and CO2 form the next largestcomponents respectively. Nitrous oxide emissions are a relatively minor contributor, entirelyaccounted for by the production of ammonia and adipic acid. Since DuPont Canada is theonly producer of adipic acid in the province, and has already announced plans to eliminateemissions of nitrous oxide during the manufacture of adipic acid, this source requires littleattention (DuPont Canada 1992).
9
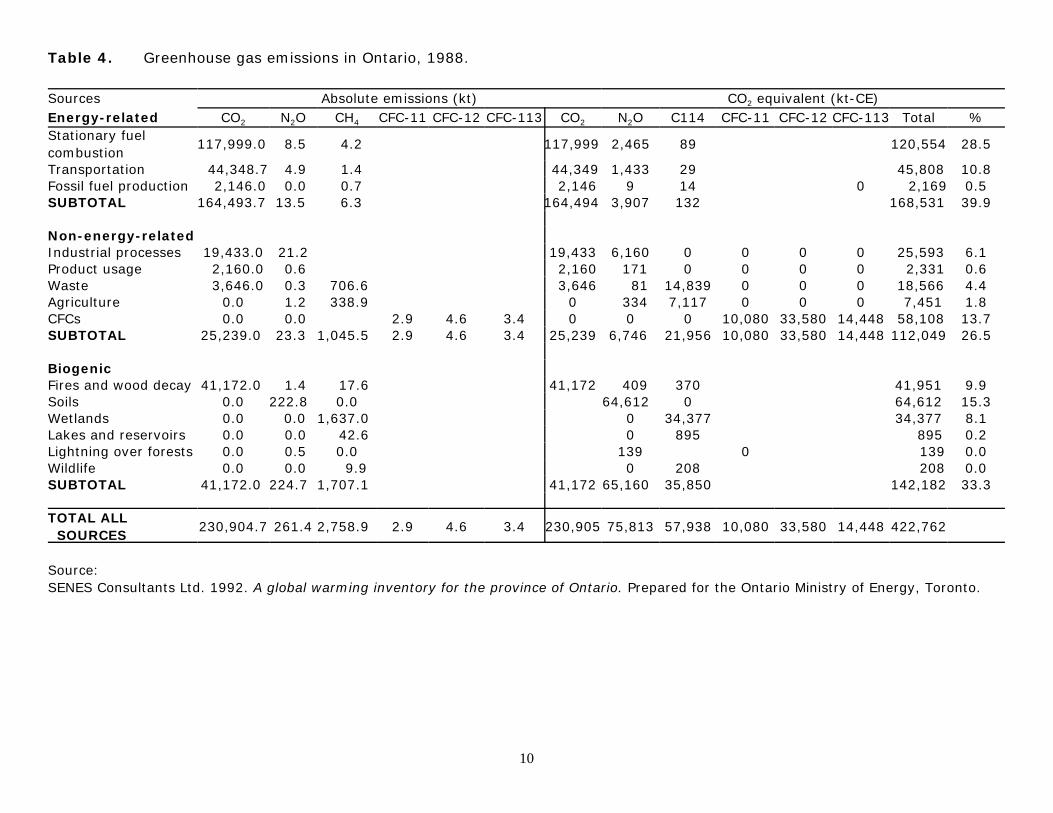
Table 4. Greenhouse gas emissions in Ontario, 1988.
Sources Absolute emissions (kt) CO2 equivalent (kt-CE)Energy-related CO2 N2O CH4 CFC-11 CFC-12 CFC-113 CO2 N2O C114 CFC-11 CFC-12 CFC-113 Total %Stationary fuelcombustion 117,999.0 8.5 4.2 117,999 2,465 89 120,554 28.5
Transportation 44,348.7 4.9 1.4 44,349 1,433 29 45,808 10.8Fossil fuel production 2,146.0 0.0 0.7 2,146 9 14 0 2,169 0.5SUBTOTAL 164,493.7 13.5 6.3 164,494 3,907 132 168,531 39.9
Non-energy-relatedIndustrial processes 19,433.0 21.2 19,433 6,160 0 0 0 0 25,593 6.1Product usage 2,160.0 0.6 2,160 171 0 0 0 0 2,331 0.6Waste 3,646.0 0.3 706.6 3,646 81 14,839 0 0 0 18,566 4.4Agriculture 0.0 1.2 338.9 0 334 7,117 0 0 0 7,451 1.8CFCs 0.0 0.0 2.9 4.6 3.4 0 0 0 10,080 33,580 14,448 58,108 13.7SUBTOTAL 25,239.0 23.3 1,045.5 2.9 4.6 3.4 25,239 6,746 21,956 10,080 33,580 14,448 112,049 26.5
BiogenicFires and wood decay 41,172.0 1.4 17.6 41,172 409 370 41,951 9.9Soils 0.0 222.8 0.0 64,612 0 64,612 15.3Wetlands 0.0 0.0 1,637.0 0 34,377 34,377 8.1Lakes and reservoirs 0.0 0.0 42.6 0 895 895 0.2Lightning over forests 0.0 0.5 0.0 139 0 139 0.0Wildlife 0.0 0.0 9.9 0 208 208 0.0SUBTOTAL 41,172.0 224.7 1,707.1 41,172 65,160 35,850 142,182 33.3
TOTAL ALL SOURCES 230,904.7 261.4 2,758.9 2.9 4.6 3.4 230,905 75,813 57,938 10,080 33,580 14,448 422,762
Source: SENES Consultants Ltd. 1992. A global warming inventory for the province of Ontario. Prepared for the Ontario Ministry of Energy, Toronto.
10

Table 5. Sources of anthropogenic non-energy greenhouse gases in Ontario, 1988.
Sources Absolute emissions (kt) CO2 equivalence (kt)CO2 N2O CH4 CFC-11 CFC-12 CFC-I13 CO2 N2O CH4 CFC-11 CFC-12 CFC-113 Total %
Fossil fuel production Natural gas transport 2049.0 0.0 0.2 2049.0 5.8 4.2 0.0 0.0 0.0 2059.0 2.2Industrial processescement manufacturing 2720.0 2720.0 0.0 0.0 0.0 0.0 0.0 2720.0 2.9lime manufacturing 1418.0 1418.0 0.0 0.0 0.0 0.0 0.0 1410.0 1.5ammonia production I596.0 8.7 1596.0 2523.0 0.0 0.0 0.0 0.0 4119.0 4.4adipic acid production 11.7 0.0 3378.5 0.0 0.0 0.0 0.0 3378.5 3.6
subtotal 5734.0 20.4 0.0 0.0 0.0 0.0 5734.0 5901.5 0.0 0.0 0.0 0.0 11635.5 12.3 Product usageRaw CO2 usage 2160.0 2160.0 0.0 0.0 0.0 0.0 0.0 2160.0 2.3WasteMSW landfills 1792.0 569.8 1792.0 0.0 11965.8 0.0 0.0 0.0 13757.6 14.6 sewage treatment plant, 129.6 0.0 0.0 2721.6 0.0 0.0 0.0 2721.6 2.9
subtotal 1792.0 0.0 699.4 00 0.0 0.0 1792.0 00 14687.4 0.0 0.0 0.0 16479.4 17.5 Livestockcattle respiration 125.7 0.0 0.0 2639.7 0.0 0.0 0.0 2639.7 2.8Livestock waste 54.6 0.0 0.0 1146.6 0.0 0.0 0.0 I146.6 1.2
subtotal 0.0 0.0 180.3 0.0 0.0 0.0 0.0 0.0 3786.3 0.0 0.0 0.0 3786.3 4.0CFCsfugitive production 0.1 0.7 0.2 0.0 0.0 0.0 385.0 2044.0 672.0 3101.0 3.3refrigeration 0.4 1.9 1.3 0.0 0.0 0.0 1400.0 130700 5460.0 20730.0 22.0 open all foam 0.2 1.1 0.0 0.0 0.0 595.0 8030.0 0.0 8625.0 9.2closed cell foam 2.2 0.5 0.6 0.0 0.0 0.0 7700.0 3723.0 2436.0 13859.0 14.7 solvents 1.1 0.0 0.0 0.0 0.0 0.0 4620.0 4620.0 4.9aerosol 0.8 0.0 0.0 0.0 0.0 5913.0 0,0 5913.0 6.3miscellaneous 0.3 0.0 0.0 0.0 0.0 0.0 1260.0 1260.0 1.3
subtotal 0.0 0.0 0.0 2.9 4.6 3.4 0.0 0.0 0.0 10080.0 33583.0 14448.0 58108.0 61.7
TOTAL SIGNIFICANT 11735.0 20.4 879.9 2.9 4.6 3.4 11775.0 5907.3 18477.9 10080.0 33580.0 14448.0 94228.2 (proportion) 12.45% 6.27% 19.61% 10.70% 35.64% 15.73% 100.00%
TOTAL NON-ENERGY 25239.0 23.3 1045.5 2.9 4.6 3.4 25239.0 6746.0 21956.0 10080.0 33580.0 14448.0 112 049.0 (significant / non-energy) 46.50% 87.57% 84.16% 100.00% 100.00% 100.00% 84.10%
SOURCE: SENES Consultants Ltd. 1992.
NOTE: Values reported in this table may not correspond to numbers reported earlier as a summary of total greenhouse gas emissions for Ontario. Valuespresented here represent only significant sources selected according to criteria outlined elsewhere, and as such represent a sub-set of the totalvalues front each source.
11

Figure 1. Significant sources of non-energy related greenhouse gases, Ontario, 1988.
Note: All quantities are shown in carbon tome equivalent Total carbon equivalent non-energy emissions are 94228 t/a
Source. SENES 1997
12

3 Actions to reduce CFC emissions
Actions are activities undertaken by individuals, firms or government which result in reducedemissions of non-energy greenhouse gases. For example, the reduction of CFC-11 used asa blowing agent for producing rigid polyurethane foams is an action. Actions differ frommeasures which are government initiatives or programs aimed at encouraging actions whichreduce emissions of non-energy greenhouse gases. Government can undertake three typesof policy measures to encourage actions to reduce non-energy greenhouse gas emissions:
< economic instruments which alter incentives for making choices regarding thepurchase or provision of products or services;
< regulatory measures which change the range of products and services available ordictate the specific actions to be taken; and
< measures which increase the amount of information on the choice of products andservices available, with the aim of encouraging people to make choices that achievethe policy option.
The distinction between actions and measures is important. For example collecting andcombusting landfill gas is an action that will reduce the amount of methane emitted fromlandfills; government may implement measures, like banning organic wastes from landfill(regulatory measure) or charging a higher tipping fee for organic wastes (economicinstrument), to prohibit or discourage the dumping of organic materials into landfills. Thematching of measures to actions ensures that the measure effects the action and thereduction of non-energy greenhouse gases occurs.
This chapter considers criteria for selecting actions (section 3.1) dealing with CFCs in eachof the major use categories.
13

3.1 Criteria for selecting actions
The actions chosen for reducing non-energy greenhouse gas emissions described in this andthe following three sections were selected based on the following criteria:
< availability of information describing the action and the source of the action;
< potential for reducing global warming;
< opportunities for implementing the action prior to 2005;
< availability of cost data regarding the action; and
< likely indirect impacts of the action (ozone depleting potential, energy use, otherenvironmental impacts).
3.1.1 Availability of information
A number of possible actions for each source of emissions of CFCs are still in developmentand testing. These actions may be available by 2005 but are in the preliminary researchstage and still must undergo testing and trial operations. For example, vacuum panels aresubstitutes for CFC blown insulation in refrigerators and freezers. Although these panels areproduced for commercial applications in some areas, problems exist in their reliability anddurability. Further development and testing is required before vacuum panels can beconsidered a viable alternative to CFC blown insulation.
The actions selected have detailed information available regarding their potential forimplementation and expected market penetration.
14
3.1.2 Potential for reducing global warming
The actions considered as replacements for CFCs have a lower GWP than the CFC theyreplace.
The GWP for CFCs used in this study are those presented in IPCC (1990). Currently,revisions to the GWP of CFCs is underway. Recent research (Ramaswamy, Schwarzkopf andShine 1992) estimate that CFCs and halons may actually have a much lower GWP thanpreviously estimated and possibly a negative (contributes to cooling) GWP. The GWP of CFCsis the direct radiative effect plus the indirect chemical. effect resulting from the destructionof ozone in the atmosphere. As such the GWP for CFCs developed by IPCC and used in thisstudy may overstate the global warming potential of CFCs.
3.1.3 Opportunities for implementing the action prior to 2005
The earlier some actions are implemented the larger the potential CFC emission reductionin 2005.1 Actions were placed into one of three groups:
< commercially available on a wide scale in 1995;
< commercially available on a limited scale in 2005; and
< available after 2005.
Preference is given to actions which already have been demonstrated in the marketplace.
_________________
1 Actions which mitigate emissions during the manufacture of products containing CFCs or fromsources which are prompt emitters have the same impact on emissions in 2005 regardless ofwhen they are implemented.
15

3.1.4 Cost data
Actions lacking cost data are not considered. Actions not considered are those which are notcommercially available or are in the development and testing stage.
3.1.5 Indirect impacts
The indirect impacts of each action on health, safety and the environment are considered.Actions involving substitutes are selected based on the substitute's flammability, toxicity,and contribution to ozone depletion and low level smog formation. The impact of the actionon energy use is also identified.
3.2 Plastic foams
The potential exists for eliminating all uses of CFCs in plastic foams production prior to 2005.CFCs are no longer used in the production of expanded and extruded polystyrene foams inCanada (Stevenson Kellogg Ernst & Young 1990; UNEP 1991), which constituted 45 per centof rigid foam insulation use in 1988 (Abt Associates 1989). Possible actions for reducing andeliminating CFC use in rigid and flexible polyurethane foams are considered below. 2
Consistent with the Montreal Protocol on substances that deplete the ozone layer the federalgovernment has announced plans to ban CFC use as a blowing agent in flexible foams bythe end of 1993, as a blowing agent in poured and sprayed plastic foam insulation by theend of 1995 and in rigid plastic foam insulating boardstock by 1994 (Environment CanadaNews Release 1990).
The Province of Ontario banned the use of CFCs in producing foam packaging in 1989 andin 1993 CFC use in all foam manufacturing will be banned (Madill 1992). The actionsrecommended in this report are consistent with the proposed provincial bans on CFC use inplastic foam production. All CFC use in plastic foam production will be phased out by 1997
_________________2 Actions for reducing CFC use in phenolic and polyolefin foams are not included in this study
due to the lack of reliable use and emissions data. Rigid polystyrene is not considered becauseCFCs are no longer used in its manufacture.
16

(by 1993 in Ontario). The banning of CFC use in plastic foam insulation manufacturing toachieve the Montreal Protocol targets will result in the adoption of the same actionsproposed in this study for reducing CFCs as greenhouse gases.
3.2.1 Rigid polyurethane plastic foam
Rigid polyurethane foams are generally produced as a result of the exothermic reaction ofisocyanates and polyols to produce gas bubbles as a blowing agent in the polymerisingmixture. The blowing agent can either be chemically formed by the reaction, such as CO2,or a physical blowing agent like CFCs can be added to the reaction. Often both blowingagents are used. In such instances CFCs are auxiliary blowing agents. CFC-11 is the auxiliaryblowing agent in producing rigid polyurethane foams.
Rigid polyurethane foams are primarily used as insulation:
< appliance insulation (75 to 80 per cent of which is in refrigerators and freezers);
< construction laminated boardstock (between 60 and 75 per cent of which is used incommercial roof insulation);
< construction and transport sandwich panels (rigid insulation laminated facings);
< spray foam insulation (used for residential, commercial and industrial insulation andin insulated refrigeration trucks); and
< slabstock (insulation for pipes and storage tanks and refrigerated containers).
Emissions in Ontario
In 1988, 7,100 tonnes of CFCs were used for the production of rigid polyurethane foams(Environment Canada 1990a).
In Ontario the 1988 use of CFC-11 for rigid polyurethane foam production is estimated tobe about one-half of national use, or about 3550 tonnes. A forecast of CFC-11 use for rigidpolyurethane foam production in Ontario to 2005 is not available. As such, CFC-11 use inOntario to 2005 for rigid foam production is assumed constant at 1988 levels. In theabsence of actions to replace CFC-11 this suggests either a reduction in rigid polyurethane
17

foam use in the province or greater efficiency in the use of CFC-11 for producing rigidpolyurethane foam.
Rigid foam blown with CFC-11 is a closed cell foam which experiences a loss of about 5 percent during manufacturing. The remaining CFC-11 is emitted at a rate of 4.5 per cent perannum for 20 years (Bach and Jain 1990). Due to a lack of time series data, 1988 CFC-11use is used to approximate CFC-11 emissions from rigid polyurethane foams. Emissions in1988 and 2005 are estimated at 3,183 tonnes (4.5% times 3,550 tonnes times 20 years,plus 3550 times 5.0%).
Selected actions
Two actions are considered for reducing emissions of CFC-11 from rigid polyurethane foams:
< reduction of CFC-11 used as an auxiliary blowing agent; and
< substitution of HCFC-123 as the auxiliary blowing agent.
Reduction of CFC-11 :
The reduction of CFC-11 in the manufacturing of polyurethane foams achieves an immediatereduction in CFC-11 use and reduces emissions during manufacturing and over the life ofthe foam product. The reduction in CFC-11 use is achieved through an increase in theamount of water, a decrease in the amount of isocyanate used in the reaction or both.CFC-11 use can be reduced by as much as 50 per cent; from 15 to 6.5 per cent of content(as a blowing agent) in manufacturing construction boardstock; from 13 to 6.5 per cent ofcontent (as a blowing agent) in appliance insulation; and up to 50 per cent of CFC-11 usedin construction and transport sandwich panels and spray foam applications.
Slight increases in the operating costs of production are possible although likely offset byreduced use of CFC-11 (UNEP 1991). No change in capital costs is anticipated. The thermalconductivity of insulation produced using less CFC-11 may increase 5 per cent.
The reduction of CFC-11 in rigid polyurethane foam production is a short term option sincethe production of CFC-11 is banned as of 1995. Only recycled CFC-11 is expected to beavailable for foam production after that date.
18

Substitution of HCFC-123 for CFC-11:
Rigid polyurethane foam blown with HCFC-123 has similar physical properties, thermalconductivity and aging (life) as foam blown with CFC-11.
HCFC-123 is a near drop-in alternative for CFC-11 use as a blowing agent in rigidpolyurethane foam production. The capital costs of converting foam production using CFC-11to HCFC-123 are minimal and zero if part of ongoing plant capital improvements. The costsof R&D are $110 000 for industry in Ontario (Stevenson Kellogg Ernst and Young 1988b).3
The cost of HCFC-123 for the production of rigid polyurethane foam is expected to increase25 per cent in the short term as a result of a shortage of HCFC-123. However no change inoperating costs in the long term are expected as HCFC-123 becomes more readily availablein the marketplace and its cost drops to that for CFC-11.
HCFC-123 may be toxic. ODP reduced to 0.02 of CFC-11. HCFC-123 is not flammable (UNEP1991b).
3.2.2 Flexible polyurethane plastic foam
Flexible polyurethane is used as a cushioning material. It is formed using a blowing agent,carbon dioxide, generated through the exothermic reaction of water with a polyol andtoluene diisocyanate. The greater amount of water used, the greater the volume of CO2
formed. This results in more expansion and lower density foam. There are limitations to theincreased formation of CO2 in the manufacture of flexible polyurethane. The heat developedfrom greater amounts of water used in the production process results in degradation of thefoam interior (scorching) and the formation of urea which limits the softness of the foam.CFC-11 is used as an auxiliary blowing agent, acting as a cooling agent for the waterisocyanate exothermic reaction to reduce foam density (firmness) and increase softness ofthe foam. Other auxiliary agents are also used such as methylene chloride, acetone andmethyl chloroform.
There are two processes for manufacturing flexible polyurethane foam, a conveyor systemproducing continuously poured slabstock or a system using moulds to produce a specificproduct (e.g., automotive seats).
________________3 One time capital costs and on-going expenses related to the research and development of the
alternative.
19

Slabstock foams are used to produce low density super soft, and high density type foamproducts used in furniture, bedding, carpet underlay and motor vehicle interiors (UNEP1991b).
Moulded foams are used in the manufacture of transportation vehicles (e.g., motor vehicle)industry for seat cushions, back cushions and headrests. About 10 per cent of moulded foamproduction is used in furniture manufacturing.
Emissions in Ontario
In 1988, 1,157 tonnes of CFCs were used for the production of flexible polyurethane foams(Environment Canada 1990). Slabstock production used about 717 tonnes (68 per cent)'andmoulded production about 440 tonnes (32 per cent) of CFC-11. About one-half of all flexiblefoams are produced in Ontario, or about 579 tonnes of CFC-11 in 1988. A forecast of usefor flexible foam production in Ontario in 2005 is not available. As such, CFC-11 use inflexible foam manufacturing is assumed constant at 1988 levels. In the absence of actionsto replace CPC-11 this suggests either a reduction in flexible polyurethane foam use in theprovince or greater efficiency in the use of CFC-11 for producing flexible foams.
Flexible polyurethane is an open cell foam. The CFC-11 contained within the foam is releasedin a relatively short period of time after the foam is manufactured. It is estimated that 25per cent of emissions of CFC-11 occur during manufacturing; 83 per cent of the remainingCFC-11 is emitted during the year in which the flexible foam was manufactured and theremaining 17 per cent in the following year (Bach and Jain 1990). Assuming 1988 use levelsof CFC-11, an estimated 579 tonnes of CFC-11 are emitted annually.
Selected actions
Three actions are considered for reducing emissions of CFC-11 from flexible polyurethanefoams:
< reduction of CFC-11 used as an auxiliary blowing agent through process change andbetter management practises/housekeeping during the production process;
< substitution of HCFC-123 as the auxiliary blowing agent for CFC-11; and
< use of product substitutes such as natural and synthetic fibrefill and latex for flexibleslabstock.
20

Reduction of CFC-11:
Certain housekeeping and maintenance activities help minimise blowing agent emissions.Routine maintenance of pumps, fittings and flanges, the unloading of the blowing agentthrough closed loop systems and avoiding the use of CFC-11 for flushing and cleaning theprocessing system will reduce CFC emissions. Restricting the density of foams andreformulating the foam to minimise the need for an auxiliary blowing agent also reduces CFCuse. These actions can result in a reduction of CFC-11 use by up to two-thirds in flexiblefoam manufacture (UNEP 1991b).
It is assumed that there are no additional costs associated with the adoption of this action.Any increases in operating costs are expected to be offset by reduced use of CFC-11(Stevenson Kellogg Ernst and Young 1988b).
No indirect impacts are expected from the adoption of this action.
Substitution of HCFC-123 for CFC-11:
HCFC-123 is expected to be the likely substitute for CFC-11 in flexible foam production(Stevenson Kellogg Ernst & Young 1988a). HCFC-123 has a GWP of 85 relative to CO2, only2 per cent the GWP of CFC-11. The use of HCFC-123 as the auxiliary blowing agent is notexpected to affect the quality or durability of flexible foam products.
The estimated costs of adopting HCFC-123 by flexible foam producers in Ontario is about$275 000 for research, developing and testing (Stevenson Kellogg Ernst and Young 1988b).4
HCFC-123 is technically compatible with CFC-11. No additional capital costs are expected.Operating costs may increase 1 to 2 per cent due to the expected higher cost of HCFC-123relative to CFC-11. In the long term this increase in operating costs will diminish asHCFC-123 becomes more widely available.
HCFC-123 is not flammable and has an ODP of 0.02 relative to CFC-11. HCFC-123 may betoxic.
__________________4 One time capital costs and on-going expenses related to the research and development of the
alternative.
21

Product substitutes for flexible slabstock:
Alternative foams such as synthetic fibrefill and latex can replace flexible polyurethane foamslabstock use in selected furniture and bedding applications (Stevenson Kellogg Ernst &Young 1988b). The use of these substitutes will not alter the quality of the products but maydiminish their durability. Some users of flexible foams are reluctant to try alternativeproducts. These product substitutes will reduce slabstock use by about 5 per cent andreduce total CFC-11 use in flexible foam production by 4 per cent.
The market for cushioning materials is competitive. No significant change in the costs areexpected.
No significant indirect impacts are expected from the adoption of this action. Use naturalfibrefill and rubber products as substitutes may decrease the available stock of these naturalresources.
3.2.3 Summary of plastic foams actions
The actions considered for reducing CFC emissions in the plastic foams industry and thepotential reduction in emissions in 2005 are presented in Table 6. Table 6. Potential reduction of CFC emissions in the plastic foams industry in 2005.
Action Decrease frombase case (%)
Reduce amount of CFC-11 used to manufacture rigid foams in 2004 10Reduce amount of CFC-11 used to manufacture rigid foams in 2000 50Reduce amount of CFC-11 used to manufacture rigid foams in 1995 >100 a
Substitute HCFC-123 for CFC-11 in rigid foams in 2004 10Substitute HCFC-123 for CFC-11 in rigid foams in 2000 50Substitute HCFC-123 for CFC-11 in rigid foams in 1995 >100 a
Substitute HCFC-123 for CFC-11 in flexible foams in 2004 100Reduce CFC-11 use and emissions in flexible foams in 2004 67Use product substitutes for flexible foams to reduce CFC-11 use in 2004 4SOURCE: Action summary sheets Appendix A.NOTES: a emissions reductions are estimated at greater than the forecast emissions in 2005. The
larger reduction is a result of the forecast constant emissions from 1988 to 2005 andthe long period of times which CFCs remain "banked" in rigid (closed cell) foams(emissions in 2005 include CFCs banked prior to 1988).
22

3.3 Refrigeration and air conditioning 5
In 1988 refrigeration and air conditioning accounted for an estimated 34 per cent (7000 t)of CFC use in Ontario (SENES 1992). Mobile air conditioners (almost 50 per cent) andcommercial refrigeration (about 25 per cent) constitute the major users and emitters ofCFCs from refrigeration sources (UNEP 1991). Actions for reducing CFC emissions from thesetwo sources and domestic refrigeration and freezers are discussed below.
Consistent with the Montreal Protocol on substances that deplete the ozone layer the federalgovernment has announced plans to ban all CFC production and import by the end of 1995and use by 2000 (CCME 1992). All CFC use in new refrigeration systems will also be phasedout by the end of 1995. The achievement of the Montreal Protocol targets will result in theadoption of the same actions proposed in this study for reducing CFCs as GHG fromrefrigeration systems. These actions are also consistent with provincial regulations regardingthe capture of CFCs from motor vehicles.
3.3.1 Mobile air conditioning
CFC-12 is used as a refrigerant in mobile air conditioning in passenger vehicles and lighttrucks. The air conditioning unit is typically installed by the vehicle manufacturer. Mostmobile air conditioning units are not hermetic (closed) systems and must be rechargedannually to maintain effectiveness.
Under the Montreal Protocol for the control and elimination of substances which deplete theozone layer Canada committed to the banning of the use of CFCs in motor vehicle airconditioners beginning in the 1995 model year (Environment Canada News Release 1990).Ontario already requires the recovery and reuse of CFCs when motor vehicle air conditioningsystems are serviced (since, 1 July 1991). Both of these policies are consistent with theactions proposed below. The achievement of the Montreal Protocol targets for the modelyear 1995 would effectively eliminate actions for replacing CFCs with non-CFCs in new motorvehicles or the retrofitting of motor vehicles produced after 1995.
__________________5 Actions to reduce CFC emissions from cold storage and food processing, industrial refrigeration
and commercial air conditioning (chillers) are not included in this study due to the lack of dataon CFC emissions and the need to develop actions which are applicable for specific sources.
23

Emissions in Ontario
In 1988, there were 272,000 new and 1.8 million existing motor vehicles (cars and lighttrucks) in Ontario equipped with air conditioning (MENY 1990; Abt Associates 1990). Theaverage charge of CFC-12 for new vehicle air conditioners is 1.29 kg and the averageremaining charge of CFC-12 in any given year in air conditioners in existing motor vehiclesis 0.89 kg (Abt Associates 1990). For 1988 the estimated total use of CFC-12 in new motorvehicles is 351 tonnes and the existing bank of CFC-12 is 1616 tonnes.
The forecasted number of new vehicles containing air conditioning is 542,000 and theexisting stock of vehicles containing air conditioning systems is 3.99 million in 2005 (MENY1990; Abt Associates 1989a). The estimated total use of CFC-12 in 2005 in new motorvehicles is 700 tonnes (542,000 vehicles times 1.29 kg/vehicle) and the existing bank ofCFC-12 is 3550 tonnes.
Emissions of CFC-12 can occur at three stages of a vehicle's life, manufacturing (less thanone per cent of total emissions from mobile air conditioners), servicing and wrecking.
Mobile air conditioning units require frequent servicing to maintain a full charge ofrefrigerant. Emissions from mobile air conditioners occur at a rate of about 0.4 kg/a pervehicle per year. The remaining charge of refrigerant, 0.89 kg/vehicle, is emitted when avehicle is wrecked and dismantled. The estimated emissions from the vehicle stock andwrecked vehicles, containing air conditioners in 1988 is 726 tonnes and 171 tonnes,respectively.
In 2005 existing motor vehicles with air conditioning are forecast to emit 1600 tonnes (0.4kg/a times 3,990,000 vehicles) and disposed vehicles 365 tonnes (0.89 kg times 410,000vehicles) of CFC-12.
Selected actions
Four actions are considered for reducing emissions of CFC-12 from mobile air conditioners:
< substitute HFC-134a in new motor vehicle air conditioning;
< substitute HFC-134a in current motor vehicle air conditioning stock;
< recover and incinerate CFC-12 prior to disposal of the motor vehicle; and
< recover and incinerate CFC-12 in current motor vehicle air conditioning stock.
24

Currently, there is no reliable incineration equipment for the destruction of CFCs (Madill1992). For the purposes of this study it was assumed that the effective incineration of CFCswill be commercially available by 1995.
Substitute HFC 134a in new motor vehicle air conditioning:
HFC-134a is the most likely substitute for CFC-12 in mobile air conditioning (UNEP 1991a).HFC-134a has a GWP of 1200 relative to CO2, 16 per cent the GWP of CFC-12. The systemchanges required for HFC-134a are relatively modest, the pressure/condensingcharacteristics of HFC-134a are similar to CFC-12 although enhanced condensing will berequired to maintain performance and durability similar to CFC-12. A suitable new lubricantfor HFC-134a must be used.
Minimal design changes are required to the current mobile air conditioning design to useHFC-134a. The estimated costs of new mobile air conditioning systems using HFC-134aresult in additional capital costs of $115 and operating costs of $49 per vehicle/a (UNEP1991a).
HFC-134a is not flammable and has an ODP of zero. Fuel vehicle efficiency may drop by 2per cent. The change in fuel efficiency is included in the costs of the action.
Substitute HFC-134a in current motor vehicle air conditioning:
HFC-134a is the likely retrofit replacement for CFC-12 in mobile air conditioners. Airconditioning components which must be compatible with any new combination of refrigerantand lubricant include the desiccant, compressor, hoses, O-rings as well as the chemicalstability of the system (UNEP 1991a). These components must be replaced for HFC-134a toperform adequately as a retrofit replacement for CFC-12.
The cost of retrofitting a mobile air conditioner for HFC-134a is $437 additional capital costsand $49/a additional operation costs. Capital costs include $436 dollars for retrofit andrepair of the air conditioning system (UNEP 1991a) and 78 cents for the incineration of therecovered CFC-12. 6
______________6 Estimated cost of incinerating CFCs, HCFCs and HFCs is $1,900 per tonne (Notorfonzo, 1992).
Cost of incinerating CFCs based on $1,400 per tonne for PCBs plus an extra charge forhandling a gaseous waste.
25

HFC-134a is not flammable and has an ODP of zero. Fuel vehicle efficiency may drop by 2per cent. The change in fuel efficiency is included in the costs of the action.
Recover and incinerate CFC-12 prior to disposal of the motor vehicle:
At present CFC-12 is not recovered from motor vehicles sent to the wrecker. When thevehicle is crushed the CFC-12 contained in the air conditioning system, 0.89 kg/vehicle,escapes into the atmosphere. Remaining CFCs can be recovered during servicing throughthe implementation of CFC capture and recovery systems at wrecking yards. These recoverysystems can capture 95 per cent of CFCs contained in the air conditioning unit. There arean estimated 14 wrecking yards in Ontario.
The estimated cost of the capture and incineration of CFC-12 at the wrecker's yard is $5000for the capture and recovery system, $49 dollars additional labour costs per vehicle (UNEP1991a) and 78 cents incineration costs (Notorfonzo 1992).
The implementation of a capture and recovery system for vehicles sent to the wreckers canalso be used to recover and recycle chemical substitutes developed to replace CFCs in mobileair conditioners.
Recover and incinerate CFC-12 from current motor vehicle air conditioning stock:
This action results in the permanent removal of air conditioning refrigerant from motorvehicles. At present CFC-12 is captured, cleaned and reused when motor vehicle airconditioning systems are serviced. Motor vehicle air conditioning systems require annualservicing as a result of leakages of refrigerants from the system. The remaining CFCscontained in the motor vehicle air conditioning system can be recovered through theimplementation of a CFC capture and recovery system at garages and service stations. Thecaptured CFC-12 is sent for incineration. These recovery systems can capture 95 per centof CFCs contained in the air conditioning unit.
The estimated cost of the capture and incineration of CFC-12 at the garages and servicestations is $5000 for the capture and recovery system, $49 dollars additional labour costsper vehicle (UNEP 1991a) and 78 cents incineration costs (Notorfonzo 1992).
The implementation of a capture and recovery system for vehicles sent to garages andservices stations can also be used to recover and recycle chemical substitutes developed toreplace CFCs in mobile air conditioners.
26

3.3.2 Commercial refrigeration
Commercial refrigeration includes self-contained stand alone equipment, remotely supplieddisplay cases, and pre-fabricated (sectional/modular) walk-in cold storage rooms. Most ofthe equipment is factory assembled and installed on the job-site. Commercial refrigerationequipment ranges from single compressor units to multi-compressor parallel systems usingreciprocating rotary screw compressors. Commercial refrigeration systems exclude industrialand domestic refrigeration systems.
Most commercial refrigeration systems are used in food merchandising and food serviceapplications such as supermarkets, food stores, convenience stores, restaurants, cafeterias,commercial and institutional kitchens and delicatessens. Other applications include smallsystems supplying vending machines for beverages and food.
CFC-12 is currently used both for medium and high temperature refrigeration (-15 to 15°C).HCFC-22 is used for evaporator temperatures down to -37°C and R-502 is used fortemperatures down to -45°C. The distribution between CFC-12, R-502 and HCFC-22 is asfollows (UNEP 1991a);
CFC-12 79%R-502 19%HCFC-22 2%
CFC-12 is the preferred refrigerant since it is cheaper and less corrosive to the coolingsystem.
Emissions in Ontario
Commercial refrigeration systems account for about one-quarter of annual CFC use inrefrigeration and air conditioning applications (UNEP 1991a). In 1988 it is estimated that1680 tonnes of CFC-12 were used in Canada for commercial refrigeration applications. Afurther 462 tonnes of R-502 (51% CFC-115 and 49% HCFC-22) were used in commercialrefrigeration in Canada.
In Ontario it is estimated that 50 per cent of Canadian CFC use or 840 tonnes of CFC-12 and231 tonnes of R-502 were used (117 tonnes CFC-115 and 114 tonnes HCFC-22).
One estimate of emissions of CFCs from commercial refrigeration indicates that servicing is
27

the major source of CFC emissions in commercial refrigeration (Table 7).
Table 7. Emissions from commercial refrigeration.
Source Factory assembled system Field assembled system
Manufacture leak testing 5.4% 2.3%
Installation 5.4% 5.7%
Leakage 8.1% 23.0%
Service 54.0% 57.0%
Disposal (100% capture) 27.0% 11.5%
Total 100.0% 100.0%
Typical system charge 25 kg 230 kg
Total emission 90 kg 200 kg
SOURCE: UNEP 1991.
It is estimated that between 62 and 80 per cent of total emissions occur over the twentyyear life of the refrigeration system. In smaller systems emissions are less since the systemis hermetically sealed. Most R-502 and HCFC-22 applications are in self contained displaycases with low leakages.
No estimates of emissions of CFCs from commercial refrigeration and air conditioning areavailable.
Selected actions
The most likely actions for commercial refrigeration and air conditioning are the following:
< Replace CFC-12 with HFC-134a. HCFC-134a can be substituted for CFC-12 in somecommercial applications. However, HFC-134a is expensive, requires alternativelubricants and lowers energy efficiency.
< Replace CFC-12 with HCFC-22 in both medium and low temperature applications.
28

< Replace CFC-12 with ammonia. Ammonia is an attractive alternative since it ischeaper than CFC-12 or other alternatives, is an excellent refrigerant, increasesenergy efficiency and has no GWP or ODP. There are safety considerations, ammoniais toxic and flammable (UNEP 1991a).,
These actions are not considered for analysis since no reliable data on emissions areavailable.
3.3.3 Domestic refrigeration and air conditioning
Domestic refrigerators and freezers are used to preserve food using a vapour-compressionscycle. CFC-12 is the refrigerant. The average refrigerator or freezer has a life of about 15years and can operate for as long as 30 years. Since domestic refrigerators and freezers arehermetic (sealed) units there is little leakage of CFC-12. Typically the CFC-12 is emittedduring the disposal of the appliance.
Domestic air conditioners (central and window) are also hermetic units which use HCFC-22as the refrigerant. Domestic air conditioners are not included in the study.
Emissions in Ontario
No estimates of emissions of CFCs from domestic refrigeration are available.
Selected actions
The most likely actions for domestic refrigerators and freezers are the following:
< Replace CFC-12 with HFC-134a a near drop-in substitute. HFC-134a requires differenttypes of oils (Polyethylene glycols) which contain more water than conventionalmineral. Therefore a dryer is also needed to absorb the water quickly and efficientlyto ensure operation of the appliance. That is, a molecular sieve desiccant. HFC-134amay not be as attractive when larger volumes of refrigerant are required sincethermodynamic efficiencies drop and desiccant problems arise. As such energyconsumption increases 5 to 8 per cent. Other alternatives—Dimethyl ether andHFC-152a—are flammable although they increase efficiency of the unit withoutredesigning the equipment. Energy savings of 3 to 7 per cent are possible.
29
< There is a large potential for release of CFC-12 (and CFC-11 insulation) fromrefrigerators and freezers upon disposal. CFCs can be captured, recovered andrecycled. Such recovery is planned in many areas and is incorporated into wastemanagement or demand side management practises for these appliances. In Ontario,many municipalities have a problem with the disposal and handling of white goods,including refrigerators and freezers. These municipalities collect their white goodsseparately and send them to special processing centres. CFCs can also be destroyedthrough incineration at temperatures greater than 590 C with subsequent flue gasscrubbing. The estimated cost of incinerating the CFC-12 captured in a domesticrefrigerator or appliance is about $1/unit (Notorfonzo, 1992)
These actions are not considered for analysis since no reliable data on emissions areavailable.
3.3.4 Summary of refrigeration actions
The actions considered for reducing CFC emissions in the refrigeration and the potentialreduction in emissions in 2005 are presented in Table 8.
3.4 Aerosols
Aerosols are considered prompt emitters, that is, the propellant and contents are releasedabout six months after manufacture (Bach and Jain 1990). Aerosols include products usedfor personal, pharmaceutical, household, medical, commercial and industrial and pesticideuse.
30

Table 8. Potential reduction of CFC emissions in refrigeration in 2005.
ActionReduction
(%)Substitute HFC-134a for CFC-12 in mobile air conditioners in 2004 - newvehicles only
10
Substitute HFC-134a for CFC-12 in mobile air conditioners in 2000 - newvehicles only
53
Substitute HFC-134a for CFC-12 in mobile air conditioners in 1995 - newvehicles only
100
Substitute HFC-134a for CFC-12 in mobile air conditioners in 2004 - retrofitexisting stock
78
Capture and incinerate CFCs from mobile air conditioners prior to wrecking in2004
18
Capture and incinerate CFCs from mobile air conditioners at the servicing levelin 2004 - existing fleet
78
SOURCE: Action summary sheets, Appendix A.
Most aerosols use hydrocarbons (propane, n-butane, iso-butane or other blends or carbondioxide) (USEPA 1990). In 1988 aerosols constituted 8 per cent or about 1600 tonnes(SENES 1992) of CFC use in Canada. In 1989 the use of aerosols and related products(spray solvents, compressed CFCs for foghorn applications) decreased to between 650 and800 tonnes or less than 5 per cent of total aerosol use (Canada Gazette 1990). In January1990 all uses of CFCs in aerosols were banned in Canada (exempting medical applications,research and some industrial applications (mould release agents, cleaners and solvents ofelectrical/electronic equipment and lubricants in mining applications) (Environment Canada1990b). The use of CFCs in these exempted applications and products are expected to bephased-out by 1993 in Canada (Canada Gazette 1990).
A complete CFC ban for most aerosol use poses no technical problem and is not costly(Stevenson Kellogg Ernst and Young 1989b). No actions are considered for reducing aerosolemissions in 2005.
31

3.5 Sterilization
CFCs are used to propel sterilant gases for sterilization and fumigation at hospitals and atcommercial sterilizers in Canada. Typically the sterilization process takes place in anenclosed chamber where the air is removed and pressurized gas introduced. After a periodof time the gas is evacuated. Ethylene oxide (EO) is used for sterilization with CFC-12 (EO12% and CFC-12 88%). The CFC-12 is vented through the chamber to evacuate all ethyleneoxide which is both corrosive and flammable.
Consistent with the Montreal Protocol on substances that deplete the ozone layer the federalgovernment has announced plans to ban CFC use as hospital sterilants by 1994(Environment Canada 1990b). All CFC production and import will be phased out by the endof 1995 and CFC use by 2000 (CCME 1992). The Montreal Protocol target will result in theadoption of the same actions proposed in this study for reducing CFCs as greenhouse gasesfrom hospital sterilization systems.
Emissions in Ontario
Sterilization is a prompt emitter of CFCs. In 1988, 484 tonnes of CFC-12 were used inCanada for sterilization (Environment Canada 1990a). It is estimated that 50 per cent ofthese emissions occurred in Ontario, resulting in emissions of 242 tonnes in 1988.
A forecast of future CFC-12 use for sterilization is not available.
Selected actions
The most likely actions for reducing CFC use in sterilization are the following.
< Use of disposable, pre-sterilized instruments for reusable, re-sterilizable instrumentsin health facilities. This action increases the costs of managing a health facility.
< Substitute the ethylene oxide/CFC-12 sterilant gas with a mix of ethylene oxide andCO2 (10 per cent EO and 90 per cent CO2). Sterilizing chambers would undergoretrofitting. CO2 is a greenhouse gas.
< Use pure ethylene oxide for sterilization and purge with nitrogen. Sterilizing chamberswould undergo retrofitting.
32

< Convert sterilization process from EO to gamma radiation. The use of gammaradiation requires the construction of new facilities. Health facilities would contracttheir sterilization requirements to these facilities.
These actions were not included in analysis due to a lack of reliable data on quantitiesemitted and conversion costs.
3.6 Solvents
Solvents containing CFC-113 are used in cleaning most electrical and electronic equipmentas well as some medical and pharmaceutical equipment. CFC-113 is used because it doesnot react with the materials it cleans and it has a high degree of purity. The major processesrequiring CFC-113 as a solvent are conveyorized vapour degreasing, cold cleaning, drycleaning and open top vapour degreasing.
Consistent with the Montreal Protocol on substances that deplete the ozone layer the federalgovernment has announced plans to ban CFC use as solvents for sensitive electronicequipment by 1994 (Environment Canada 1990b). All CFC production import will be phasedout by the end of 1995 and use by 2000 (CCME 1992). Meeting the Montreal Protocol targetwill require the adoption of the actions to reduce the use of CFCs as cleaning solvents. Manyof the substitute actions will reduce not only the contribution to ozone depletion, but alsoto global warming.
Emissions in Ontario
Solvent use is a short term emitter of CFC-113. Most emissions occur in the first year ofapplication with some emissions in the second year after initial use. SENES estimatesOntario emissions of CFC-113 from solvent use at 1,113 kt in 1988.
A forecast of future CFC-113 use for solvents is not available.
33

Selected actions
There are a number of actions available for reducing CFC use as a solvent. Many of theseactions are applicable for use in specific production processes producing specific products.It is beyond the scope of this study to detail all of these actions (UNEP 1991c; StevensonKellogg Ernst & Young 1988a). The two most widely applicable actions for replacing CFC useas a cleaning solvent are the following:
< Terpene based solvents (isometric hydrocarbons) made from coniferous and citrustrees can substitute for CFC-113 use as a cleaning solvent. Terpene use can createa visible haze if proper ventilation systems are not in place. This action has long termpotential.
< Aqueous cleaning using a mix of water and isopropyl alcohol can be used in manyapplications of cold cleaning, vapour and conveyorized degreasing in both electronicand non-electronic applications.
These actions could not be included in the analysis due to a lack of reliable data onquantities emitted, conversion costs and the site specific uses of solvents and alternativeactions.
34

4 Actions to reduce methane emissions
This section of the report discusses actions to reduce methane emissions from the followingsources:
< livestock, including respiration and manure;
< the natural gas industry;
< sewage treatment plants; and
< municipal solid waste landfills.
The list of actions discussed here are those actions most likely to be undertaken by 2005.Where data are unavailable for sources, an effort has been made to indicate the relativecosts and potential emissions reductions of possible future actions. This information is basedon a review of the literature and interviews with industry representatives and governmentofficials. The information found in this Chapter is presented in greater detail in Appendix A.
4.1 Livestock methane emissions
There are two types of actions to reduce livestock methane emissions: actions that reduceemissions on a per animal basis, such as increasing digestion efficiency and animalproductivity, and actions that reduce the numbers of livestock, such as the use of bovinegrowth hormones like rBST and changing human dietary patterns to substitute meats fromlower methane producing animals for those which produce more methane. Both types ofactions are considered here.
4.1.1 Respiration
Opportunities for reducing the rate of methane emissions from livestock include increasingdigestion efficiency and animal productivity, i.e., the amount of animal product produced perunit of feed. Specific options include (U.S. EPA 1989):
35

< supplementing the diets of grazing animals to correct nutrient deficiencies often foundin lower quality forage;
< increasing digestion efficiency by substituting high concentrate feeds with lowmethane producing potential for high roughage feeds with higher methane producingpotential in the diets of confined animals;
< supplementing diets with feed additives that increase digestion efficiency and reducemethanogenesis in the rumen, e.g. antibiotic compounds, sex and growth hormonesand ionophores. Ionophores reduce feed requirements per unit of production, thusreducing corresponding methanogenesis, and inhibit methanogenesis by alteringrumen fermentation patterns (Johnson, Branine and Ward 1991).
< improving reproductive efficiency (increased fertility rates, infant birth weights anddecreased infant mortality rates all contribute to increased reproduction efficiency,necessitating a smaller breeding stock to maintain a given herd size); and
< decreasing animal morbidity and mortality by more efficient diagnosis and treatmentof animal disease.
Of these actions, most of which have been actively pursued for many years for economicreasons, few are expected to achieve significant reductions in methane emissions in Ontarioin the short-term. Beef and dairy producers in Ontario are considered to be among the mostefficient in the world, and readily adopt new technologies and management practices toincrease productivity or reduce management costs. The chief obstacle to implementing newfeed additives or productivity enhancing supplements are delays associated with theregulatory approval process.
Emissions in Ontario
Emissions from livestock respiration in Ontario were estimated to be 147 kt in 1988. Thisis lower than SENES' estimate of 240 kt, chiefly due to the difference in respiration bychickens. Methane emissions from livestock respiration are shown in the following table.
36

Table 9. Estimated methane emissions from livestock respiration, Ontario, 1988.
Type of livestock NumberCH4 emissions(kg/animal/a)
CH4 emissions (t/a)
Horses (a) 300,000 18.000 5,400Cattle (b) 2,250,000 58.475 131,568 Sheep 212,000 10.000 2,120Goats (c) 32,460 5.000 162Pigs (b) 3,230,000 2.311 7,465Turkeys 2,665,000 0.010 27Chickens 29,484,000 0.011 328
Total 38,173,460 147,070 SOURCES: OMAF 1991; Jaques 1992.NOTES:
(a) Estimated population as of June 3, 1986 (OMAF 1991)(b) Weighted average emission factor (Jaques 1991).(c) Population as of lune 3, 1986 (OMAF 1991).
Selected actions
Reduce rumen methanogenesis:
There may also be potential actions to reduce rumen methanogenesis unrelated to animalproductivity:
< anticipated biotechnology may be able to manipulate rumen microflora to reducemethanogenic activity (Benzing-Purdie 1992); and
< chemical feed additives may fix hydrogen in the rumen, preventing the formation ofmethane at a molecular level (Chang 1992).
These actions are considered to be experimental.
37

Recombinant bovine somatotropin:
Recombinant bovine somatotropin (rBST) is a protein-based growth hormone that has beendemonstrated to increase milk yields in superior cows by as much as 40 per cent (Deloitteand Touche, 1990). Several studies have demonstrated the economic benefits associatedwith use of rBST in dairy herds in Ontario (Deloitte and Touche, 1991; Stennes, Barichelloand Graham, 1991). The Food and Drug Administration (Juskevich and Guyer, 1990) andthe Office of Technology Assessment (OTA 1991) have found there to be no increasedhuman health risks from dairy products from cows treated with rBST. rBST, however, hasyet to be approved for use in Canada.
The net effects of rBST adoption in Ontario's dairy industry are difficult to predict partlybecause of the current system of milk production, processing and marketing in Ontario. Thesupply of milk is regulated by the Ontario Milk Marketing Board, which issues quotas for milkproduction to dairy farmers in the province.
With increasing milk yields, there are several possible impact scenarios related to theresponse of prices and quota levels to increased per cow milk production. It has beenassumed here that administered prices, quota levels, levies, subsidies and farm gate pricesare all unchanged. As production per cow increases the number of cows will be reducedsince total production remains constant. In this scenario, the full economic benefits of rBSTwill be realized by producers.
This scenario was chosen because it is considered that, in the short term, rBST would beadopted gradually so that it would not be seen to have a one-time distinct impact on milksupply and, consequently, prices and quota values. As such, the Ontario Milk MarketingBoard would not be required to respond directly to the perceived impacts of rBST adoptionin Ontario.
4.1.2 Methane from animal waste
Animal wastes generated at farms where animals are confined, e.g., beef feed-lots, dairies,piggeries and poultry farms, are often handled as a liquid slurry, washed from barns andpens into storage tanks. To the extent that manure is stored or handled anaerobically, it islikely to give off methane and carbon dioxide as the organic matter decomposes.
38

Emissions in Ontario
SENES estimated methane emissions from animal waste to be 98.7 kt in 1988, increasingto 103.8 kt in 2005.
Selected actions
Actions to reduce methane from animal waste involve collecting the methane that isproduced, or undertaking to prevent its production. These actions include the following:
< collecting biogas for energy or for flaring;
< implementing alternative manure application methods to prevent anaerobicdecomposition;
< modifying manure storage facilities to prevent anaerobic decomposition Collection ofbiogas:
About 50 to 90 per cent of methane generated from waste lagoons could potentially berecovered (EM 1990; USAID 1990; EPA 1989). Manure may also be collected and processedin anaerobic digesters, the CH4 generated offsetting demand for other fuels. In China, forexample, there were 3 to 4.5 million family-sized digesters in 1984 (World Bank 1985).
Alternative manure application:
Alternative manure application technologies, include injection rather than broadcast sprayingor irrigation, to encourage aerobic decomposition and modifying anaerobic storage facilitiesto prevent methane formation. Alternative manure handling strategies are most practicalfor intensive farming, such as beef feed-lots, dairy, hog and poultry farms.
Alternative manure application technologies are the most promising in terms of economicand technical feasibility for reducing CH4 emissions from animal waste (Hilborn 1992). Thepossibility that current application methods also increase natural sources of methanethrough soil run-off and leaching of organic matter into receiving waterways indicates thatactions related to manure application may be worthy of future investigation. A study ispresently underway to identify the environmental impact of alternative manure applicationmethods (Hilborn 1992).
39
Anaerobic digestion of livestock wastes for biogas recovery:
Although there have been many studies of anaerobic digestion of animal wastes for biogascollection, the existing technology is not economically viable, especially where such digestersare retrofitted to existing manure handling facilities (Ralph G. Winfield and Associates,1986). Studies have been done of the possibility of centrifugally separating single-cellproteins from processed animal waste, as part of the biogas collection process, for use asa livestock feed supplement. Weight gains from livestock fed this supplement have generallybeen lower than expected with the result that this action is not considered to be acost-effective source of dietary protein for livestock (Van Die 1987).
4.1.3 Other actions
Another action to reduce methane emissions associated with livestock rearing for humanconsumption is to modify our diet to minimise or, at least, reduce methane emissionsassociated with human dietary patterns.
Substitute pork or poultry for beef
One way to minimise methane emissions from cattle is to substitute pork or poultry for beefconsumption. An assessment of the effectiveness of this action requires a comparison of theper unit of production emissions associated with beef and its alternatives, and a comparisonof their costs. The costs used in this analysis are producer prices for beef and pork dressedcarcasses, which do not necessarily correlate with retail prices faced by the consumer (Leslie1992; McCutcheon 1992). It should be noted that this is a first-run attempt at this analysis.A more detailed analysis would require an analysis of dietary requirements and thenutritional value of alternative proteins, including perhaps legumes and dairy products, andan analysis of secondary effects, such as energy inputs to beef raising and alternatives,fertilizers and pesticide use.
40

4.2 Methane emissions from the natural gas industry
4.2.1 Sources of emissions from the natural gas industry
The American Gas Association identifies the following sources of methane from the naturalgas industry (AGA 1989):
During normal operations
< natural gas can be used to operate various types of instruments including valves,controllers and pressure regulators. A portion of this gas is emitted to the atmosphereduring the operation of these instruments.
< Produced liquids that are collected in the gathering, transmission and distributionsystems must be removed from the pipelines at specified locations. Natural gas isemitted to the atmosphere when the valves at these locations are opened to drain theliquids.
< Relief valves are used to prevent gas pipelines and equipment from exceeding theirmaximum operating pressure. In the event of excess pressure, the relief valve opens,emitting gas to the atmosphere, to relieve the pressure.
During maintenance and construction
< Natural gas may be purposely vented to the atmosphere during maintenance or newconstruction of gas process equipment and pipelines. The gas is evacuated to theatmosphere from facilities to provide a non-flammable and safe operatingenvironment before maintenance or construction begins.
< Natural gas is emitted during the purging of pipelines and equipment prior toconstruction and maintenance.
Leaks
< Natural gas is unintentionally emitted to the atmosphere when-pipelines, valves orassociated equipment leak.
41

According to the AGA, each company employs inspection techniques and performs leakagesurveys to identify points of natural gas leakage for economic reasons, i.e., to minimize lostgas. Companies routinely maintain data on lost and unaccounted-for gas, calculated bysubtracting the total gas accounted for in sales from the total gas received from all sources,including discrepancies due to meter error; gas theft, variations in gas purchase and salebilling dates and periods, non-leak components and leaks.
Emissions in Ontario
Methane emissions during the transmission and distribution of natural gas in Ontario are avery small proportion of throughput (between 0.3 and 0.5 per cent), and among the lowestin North America (Hare 1992; Sherville 1992). Principal sources of emissions during thetransmission and distribution of natural gas are from pneumatic instruments and third partydamages. Emissions from Ontario's natural gas industry were estimated to be 3.22 kt in1989 (See Table 10).
Table 10. Methane emissions during transmission and distribution in Ontario, 1989.
Resulting from:Gas released
kilotonnes PercentPneumatic instruments 1.57 48.9Third party damage 1.39 43.4Purging in and out of service 0.17 5.2Regulator maintenance 0.07 2.1Miscellaneous operations 0.01 0.4
Total 3.22 100.0 SOURCES: Consumers Gas 1991a; Union Gas 1992; Statistics Canada 1990.
Selected actions
There remain limited opportunities to reduce emissions further. Possible actions include:
< replace permeable cast iron main-line pipe and pneumatic valves;
< reduce third party damages and improve leak detection programs;
42
< design to minimize the length of pipe which may require purging prior to and duringconstruction and maintenance; and
< implement blowdown recovery projects.
The first action relates mostly to older gas delivery infrastructure; cast iron pipe is no longerinstalled, nor is pneumatic monitoring equipment that releases gas to the atmosphere. Theother actions are relevant for even the newest infrastructure.
Replace permeable cast iron pipe and pneumatic valves:
Some of the older main-line gas distribution infrastructure in Ontario is cast iron.Recognizing that cast iron leaks more than newer steel and plastic pipe, Ontario's gasutilities have embarked on programs to replace cast iron with steel and plastic pipe. Themajority of cast iron pipe still in service in Ontario, in Metropolitan Toronto, is in the processof being replaced (Hare 1992; Sherville 1992; Consumer's Gas 1992). Pneumatic valves arealso in the process of being replaced.
Reduce third party damages and improve leak detection :
Third party damages involve unintentional ruptures of gas pipelines by excavators. Gasutilities already sponsor "call-before-you-dig" services and information campaigns to reducethe incidence of accidental ruptures. The premise underlying leak detection programs,already undertaken by utilities in Ontario, is that if leaks are detected sooner, less gas willbe leaked.
Minimise length of pipe requiring purging prior to servicing:
Prior to servicing, all components of the gas distribution system must be purged to minimiseoccupational hazard. The current practice is to pump a denser gas into the line, forcing theevacuation of natural gas through valves to the atmosphere. In Ontario, much of this ventedgas is flared at the valve head, resulting in CO2 emissions rather than CH4. There is,however, expected to be some small fugitive emission of methane resulting from thisprocedure. If the system is designed to minimize the volume that requires purging beforeservicing, by installing shut-off valves at shorter intervals along pipelines and at compressorstations and delivery points, less methane may be released. There are no data available
43

related to the relative cost and reduction potential of this action.
Blowdown recovery:
Blowdown recovery reduces gas releases prior to and during construction and maintenance,or to recover or flare vented gas. Safety precautions require that compressor piping bepurged of gas whenever the compressor is not operating to provide safe working conditionsfor operators and maintenance personnel. This is normally accomplished by venting gascontained in compressor units and adjacent pipes to the atmosphere.
Union Gas has undertaken a blowdown recovery project at their Dawn Operations Centre torecover this gas, either by routing it to low pressure market lines, or, if other compressorsare operating, into the fuel gas rack for these compressors (MacDonald 1992). In anemergency, gas may still be vented to the atmosphere. This project recovers over 15,000m' of gas each year. The capital cost of this project was approximately $1 million, and theeconomic benefits, in terms of the value of gas saved each year, amount to approximately$1550.
This blowdown recovery project was initiated for a number of reasons, methane emissionsreduction among them. The primary reason, however, was to reduce the noise ofblowdowns. Previously, the noise associated with venting gas at pipeline pressureconstituted an occupational hazard and an environmental cost for people living nearby. Sincethe project was completed, the noise of venting has been virtually eliminated.
While cost and benefit data for other actions to reduce gas emissions from the natural gasindustry are not available, the high cost of blow-down recovery is instructive in terms ofindicating the approximate orders-of-magnitude of achievable emissions reductions and thecosts involved. Actions not yet undertaken implicitly have relatively higher costs andrelatively lower emissions reductions (MacDonald, 1992). Because the Canadian natural gasindustry is among the most efficient and technologically advanced in the world, rates ofunaccounted-for-gas and fugitive emissions are already as low as is economically andtechnologically feasible. Further reductions may be expected to be made only at high cost.
4.3 Methane emissions from sewage treatment plants
Sewage handling facilities and STPs are designed explicitly to minimize the production ofmethane to control odours and mitigate explosive hazards. Some STPs are equipped,
44

however, with one or two-stage anaerobic digestion facilities as a means of treating sewagesludge. Methane produced in these digesters is used to heat the digester to optimaltemperatures for methane production. Excess gas is vented and flared or stored (Archer1992). Fugitive emissions from digesters are possible, but likely represent a small fractionof methane production, and a negligible contribution to total anthropogenic greenhouse gasemissions. Small emissions may also occur in the sewage handling system prior to entry inan STP, though these emissions have not been estimated and are considered to be negligiblealso.
No actions for reducing methane emissions from STPs are considered in this study.
4.4 Methane emissions from solid waste decomposition
4.4.1 Methane emissions from MSW landfills
Methane is generated during anaerobic decomposition of solid waste in landfills ofdegradable organic carbon in the waste. Landfill gas is primarily comprised of methane andcarbon dioxide, and trace amounts of volatile organic compounds (Lashof and Tirpak 1990:570). The amount of gas produced at a given site is a function of the amount andcomposition of landfilled waste, the degradable organic carbon (DOC) content of the wasteand characteristics of the site, such as depth of fill, soil type, climate and precipitation.
In Ontario, several landfills have gas collection systems already in place, designed tomitigate odours and explosive hazards. Methane is flammable in concentrations between 5and 15 per cent by volume in air at ordinary temperatures (Lashof and Tirpak, 1990) andposes an explosive hazard if not collected and controlled.
Emissions in Ontario
To estimate the reduction potential of both types of actions to reduce methane emissionsfrom landfills, it was necessary to project base-line emissions to 2005. Following examplesset out in the literature (Jaques 1992; MacViro 1991; Senes 1992), the EPA's Scholl Canyonmodel for predicting landfill biogas emissions was used to estimate future emissions inOntario.
The Scholl Canyon model projects biogas yield to decline exponentially from the time ofplacement of the waste according to the following equation (MacViro 1991):
45

dL / dt = -kLo -k ( t- to )
where:L = the amount of gas left to generate per unit weight of refusek = the gas generation constantt = time (years)Lo = the ultimate biogas yieldto = initial time of landfilling
In order to use the Scholl Canyon model to estimate biogas emissions, it is necessary tomake a number of assumptions regarding the decomposition environment within Ontario'slandfills. Key factors are climate, such as mean daily temperature and average precipitation,waste composition, site characteristics and landfill management practices. Due to theunavailability of much of this data for specific landfills in Ontario, estimates have been basedon best available data and the following assumptions (Jaques 1992; MacViro 1991):
< All waste generated in Ontario is disposed of in a single landfill, possessingcharacteristics of a typical landfill in Ontario based on available data. Disposal in thislandfill commenced in 1941. A primary assumption of the Scholl Canyon model is thatnecessary bacteria for decomposition to take place are present when landfillingcommences. Where this is true, a tonne of waste placed in an old landfill and a newlandfill have the same ultimate biogas yield.
< Annual disposal figures for 1941 to 1989 are based on historical data (B.H. Levelton1990). Disposal figures after 1989 are based on projections of population growth to2010 and current per capita waste generation rates of 1.53 kg per day (0.56 tonnesper year).
< Except for a constant 258 700 tonnes per year that is incinerated in existing facilities,all waste generated in Ontario is landfilled. This assumption is necessary to estimatethe impact of diversion of digestible organic wastes from landfills. (In estimatingfuture emissions of methane from Ontario landfills, Senes Consultants assumed theOntario Government's waste diversion targets of 50 per cent by 2000 would beachieved, implying that a significant quantity of DOCs would be diverted.) A reductionin DOCs disposed of in landfills is simulated by an identical percentage reduction inthe total waste disposed of in landfill.
< The ultimate biogas yield (Lo) is estimated to be in the range of 2 to 4 ft3/lb of MSW,approximately 109 to 218 kg of methane per tonne of waste (MacViro, 1991). This
46

is a lower estimated yield than that used, by Senes (1992).
< The gas generation constant (k) for the Scholl Canyon model, the rate at which gasgeneration decreases from the time of disposal, is 0.07, resulting in a half-life, atwhich point half of the biogas is emitted, of 8 years (MacViro, 1991). This is higherthan the constant chosen by Senes (1992), of 0.02, which resulted in a half-life of 38years.
< The composition of landfill gas is typically in the range of 50 to 60 per cent (Jaques,1992). For this study a value of 55 per cent was assumed.
< The average gas recovery efficiency of gas collection systems ranges from 30 to 80per cent (MacViro 1991). For this study a value of 55 per cent was assumed. Thissuggests that gas recovery at Ontario's landfills will result in, at best, a 55 per centreduction of methane emissions.
Having made these assumptions it is possible to estimate future landfill gas emissions andto evaluate alternative actions to reduce them.
It is estimated that landfills in Ontario emitted 447.6 kt of biogas in 1988, of whichapproximately 55 per cent (246.2 kt) was methane and 45 per cent (201.4 kt) was carbondioxide. This is lower than SENES' estimate of 569.8 kt of methane in 1988. The differencein estimates can be attributed to differing assumptions regarding the organic content ofmunicipal solid waste in Ontario, disposal rates, and methane generation rates. With a globalwarming potential 21 times that of CO2, total landfill emissions are equivalent to 5170.2 ktof carbon dioxide, approximately 6 per cent of anthropogenic sources of non-energy relatedgreenhouse gas emissions in Ontario in 1988.
Selected actions
Categories of actions to reduce methane emissions from landfills include collecting landfillgas emissions and reducing emissions by diverting methane producing wastes from landfillsfor alternative processing. These actions include:
< recovering landfill gas, for flaring or energy production;
< aerobic composting of digestible organic compounds (DOCs); and
47

< incineration, including energy-from-waste facilities.
Landfill gas recovery:
Two of Ontario's largest landfill sites have gas collection and energy recovery systems: BrockWest landfill has a 23 MW electrical power plant and a 15 MW facility was recently approvedfor the Keele Valley site (MacViro 1991). Brock West and Keele Valley service MetropolitanToronto, and are among the largest landfills in Canada.
The economic feasibility of energy recovery depends on landfills satisfying the followingcriteria (MacViro 1991):
< accepts mainly municipal solid waste (residential and industrial /commercial/institutional);
< has a minimum design capacity of one million tonnes of refuse;
< has minimum landfilling area of 40 hectares; and
< has a closing date within the last ten years.
26 landfill sites in Ontario meet these criteria. It has been estimated that these sites mightyield 250 million cubic metres of methane, or 179 kilotonnes (MacViro 1991). This amountsto approximately 30 per cent of estimated methane emissions from landfills in Ontario(SENES 1992).
The viability of gas collection systems at smaller landfills depends on the type of waste andlandfilling method used, but also depends on access to the electricity transmission grid, inthe case of electricity generation, or access to a suitable consumer, in the case of raw gasor steam heat production.
Costs and reduction potential have been estimated for a range of landfill sizes servingmunicipalities with populations from 4,500 to over 500,000 people. Since fewer smallerlandfills will be proximate to the electricity grid than larger landfills, it was assumed that 50per cent of landfills receiving 2,500 to 25,000 t MSW/a would have access to the grid, andthat the percentage of landfills having access to the grid would increase gradually until 90per cent of those receiving 500,000 and over would have access to the grid. Those landfillsnot having access to the transmission grid would be expected to collect and flare landfill gas.
48

In addition, it was assumed that average gas recovery efficiency at all landfills is 85 per cent(MacViro 1991).
The cost and reduction potential of landfill gas recovery is summarized in Table 11.
Table 11. Cost and reduction potential of landfill gas recovery actions.
ActionNo. ofUnits a
Landfill capacity(tMSW/a)
Annual net cost ($)
Reduction potential b (t CH4 2005)
Collect and flare 4 2,500 117,390 3878 5,000 258,815 15497 10,000 268,233 271011 25,000 584,494 10140 2 50,000 150,107 38721 100,000 67,306 23231 150000 99,464 34841 500,000 320,637 15486
Recover LFG for energy 4 2,500 40,757 3878 5,000 (47,716) 15497 10,000 (268,196) 271011 25,000 (1,522,907) 10140 8 50,000 (2,464,884) 38723 100,000 (2,224,110) 23235 150,000 (5,312,082) 34847 500,000 (24,702,063) 15486
SOURCE: Data are from Appendix A.NOTES: a “Units" are the number of landfills of the indicated capacity at which the action
can be applied.b Reduction potential is tonnes of CH4 reduced in the year 2005 by the action.
Composting of food and yard waste:
Composting of DOCs reduces or eliminates methane emissions associated with the anaerobicdecomposition of MSW. Composting produces a humus which may be used as a soilenhancer or as refuse-derived-fuel. The scale of composters range from household capacityto industrial single or two-stage composters with a capacity of greater than 1000 tonnes perday of DOCs. Single stage composting processes can involve mechanical drums, whichaerate the waste and provide a consistent temperature and humidity ideal for
49

decomposition, or simply spreading waste on the ground thinly or in windrows to encourageaerobic decomposition. Costs and reduction potential have been estimated for householdcomposting, municipal yard waste composting and municipal organic waste composting.These are summarized in Table 12.
Table 12. Cost and reduction potential of composting actions.
ActionUnit capacity (t waste/a)
Annual net cost
Reductionpotential
(t CH4 2005)Household composting 0.36 ($33,318,242) 41,093Municipal yard waste composting 10,000 ($9,701,707) 13,431Municipal organic waste composting 44,000 $2,973,253 34,732SOURCE: Appendix A.
Incineration of municipal solid waste:
Another option for diverting waste from landfill is to incinerate it. Although new incineratorsare currently banned in Ontario, there are several operating energy-from-waste incinerationfacilities in the province. Energy is produced in the form of steam and electricity.Advantages, other than energy production and subsequent fuel displacement, include wastemanagement advantages; although only approximately 30 per cent of the municipal solidwaste stream is decomposed in landfills or by composting, 70 to 80 per cent of the wastestream is combustible and will provide energy, leaving from 20 to 30 per cent (by weight)of the waste stream to be disposed of by landfilling. As an option for methane emissionsreduction, incineration is, however, relatively more expensive than landfill gas recovery orcomposting. Costs and reduction potential have been estimated for small (100,000 t/a),medium (250,000 t/a) and large (500,000 t/a) incinerators. These are summarized inTable 13.
Table 13. Cost and reduction potential of incineration.
ActionUnit capacity (t waste/a)
Annual net cost
Reduction potential (t CH4 2005)
Incineration (medium) 10,000 $77,698,311 9,530Incineration (large) 500,000 $156,199,325 29,323SOURCE: Appendix A
50
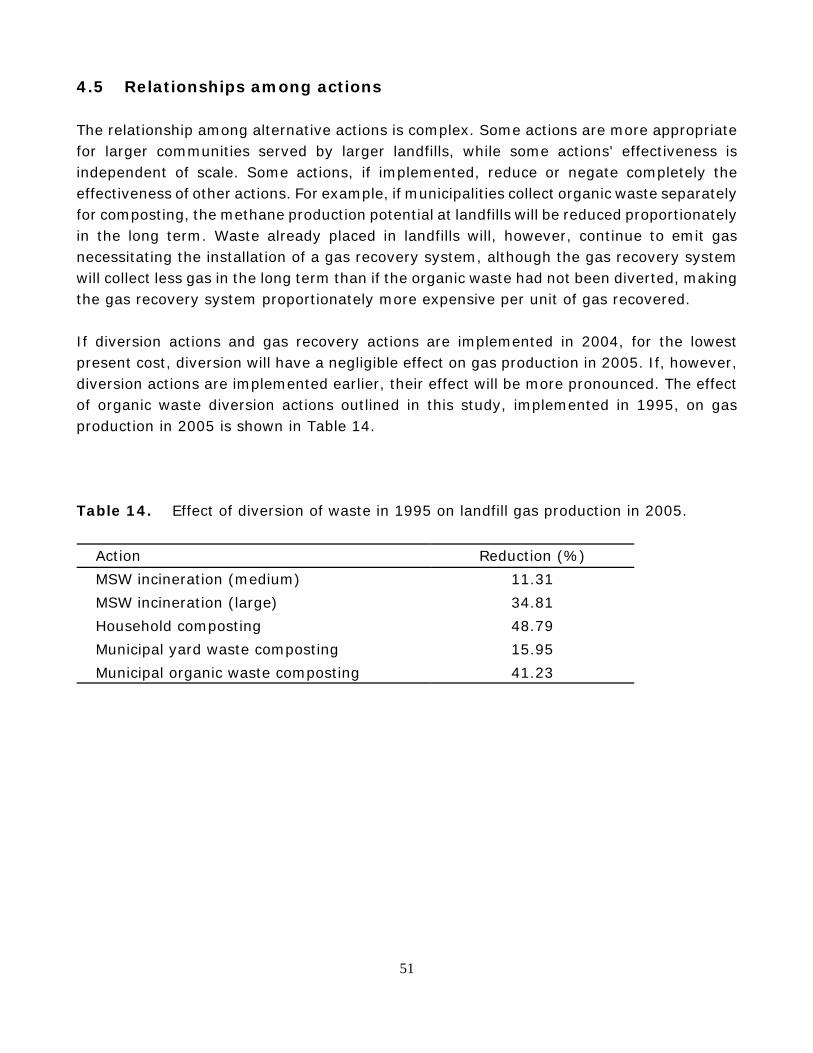
4.5 Relationships among actions
The relationship among alternative actions is complex. Some actions are more appropriatefor larger communities served by larger landfills, while some actions' effectiveness isindependent of scale. Some actions, if implemented, reduce or negate completely theeffectiveness of other actions. For example, if municipalities collect organic waste separatelyfor composting, the methane production potential at landfills will be reduced proportionatelyin the long term. Waste already placed in landfills will, however, continue to emit gasnecessitating the installation of a gas recovery system, although the gas recovery systemwill collect less gas in the long term than if the organic waste had not been diverted, makingthe gas recovery system proportionately more expensive per unit of gas recovered.
If diversion actions and gas recovery actions are implemented in 2004, for the lowestpresent cost, diversion will have a negligible effect on gas production in 2005. If, however,diversion actions are implemented earlier, their effect will be more pronounced. The effectof organic waste diversion actions outlined in this study, implemented in 1995, on gasproduction in 2005 is shown in Table 14.
Table 14. Effect of diversion of waste in 1995 on landfill gas production in 2005.
Action Reduction (%)MSW incineration (medium) 11.31MSW incineration (large) 34.81Household composting 48.79Municipal yard waste composting 15.95Municipal organic waste composting 41.23
51

For example, if medium-scale incineration of waste were to be implemented in 1995, itwould result in a 11.3 per cent reduction in total landfill methane emissions in Ontario in2005. 7 If municipal organic waste composting were implemented in Ontario in 1995, totallandfill methane emissions in Ontario in 2005 would be reduced by 41.2 per cent. Thepercentages shown above are not necessarily additive: if household composting is fullyimplemented, there will be less organic waste available for municipal yard and organiccomposting and vice versa. (These actions could, however, be considered complementarycomponents of an organic waste management and methane reduction strategy with optimalimplementation levels assigned to each action.)
_____________________7 These diversion percentages were calculated using the Scholl Canyon landfill gas generation
model assuming technical waste diversion potential for each waste diversion action as outlinedin Appendix A. Every tonne of waste that is diverted from landfill, to incineration or elsewhere,will reduce total landfill emissions in Ontario. The diversion percentage reported is intendedto be applied as a fraction of total landfill methane emissions in Ontario in 2005, resulting fromwaste diversion actions implemented in 1995.
52

5 Actions for reducing carbon dioxide emissions
CO2 emissions arise from production processes in industry. The industries considered asnon-energy sources of GHG are cement, lime, pulp and paper, ammonia production, and rawCO2 use. For each industry, the industrial process leading to GHG emissions is described alongwith the major uses of the product. This is followed by a discussion of possible actionsidentified for each industry.
Actions considered can be classified into the following categories:
< product substitution;
< process changes; and
< emission control measures.
The manufacturing processes for each industry are described to identify the basis of the GHGemissions. The potential for reduction of other non-GHG emissions associated with theprocess are identified also.
5.1 Concrete
5.1.1 Cement manufacturing
The basic raw materials required for portland cement are calciferous materials such aslimestone, and chalk, and materials rich in silica, such as clay. Additional materials includesand, waste bauxite and iron ore which are used to adjust product mix. The overall processused to produce the cement clinker product involves grinding the raw materials, mixingthem and heating the mixture in a kiln at high temperatures to produce the cement. Thecement clinker is cooled and ground in a pulverizer to produce a powdered cement.Combustion of fuel is required to produce the high temperatures from the hot combustiongases in the kiln. The basic reactions occurring in the kiln are:
< a drying process that evaporates free water and combined water in the clay;
< a calcining process which uses a thermal decomposition reaction to breakdowncalcium carbonate to produce carbon dioxide and calcium oxide; and
53

< a clinkering zone where the main reaction between lime and clay occurs to producecement clinker (high temperatures 1427 EC to 1650 EC).
The major GHG emitted is CO2 from the calcination reaction in the calcination zone in the kiln.(Austin 1984; CPCA 1989). Cement manufacturing accounts for about 2 per cent of thenon-energy emissions in Ontario from the calcination reaction (SENES 1992).
The major market for portland cement is concrete used in construction. In Ontario there are7 cement plants. Plant data for 1989 are available on the portland cement industryincluding:
< capacity summary by process and kiln age;
< capacity summary by fuel usage;
< provincial ranking by clinker and finish grinding;
< kiln capacity ranking; and
< detailed plant information by company (Portland Cement Association 1990).
Emissions in Ontario
Based on an emissions factor of 0.5 tonnes CO2 per tonne of concrete produced(Environment Canada 1992) emissions of CO2 in Ontario in 1988 were 2,700 kilotonnes(SENES 1992). The forecast emissions of CO2 in 2005 is 4,040 kilotonnes (SENES 1992).
Selected actions
Reduction of CO2 emissions are theoretically possible from scrubbing, radical changes inmanufacturing by substituting different raw materials, such as ground granulated blastfurnace slag, or by product substitution. The following actions are considered feasible toreduce carbon dioxide emissions.
Ground granulated blast furnace slag :
Ground granulated blast furnace (GGBF) slag is a cementatious material produced as aresidual waste as a of result of steel-making. GGBF slag can be substituted for portland
54
cement in making concrete. The combining of GGBF with portland cement has twoprocessing advantages: 1) each material can be ground to optimum fineness and 2) theproportions of each can be adjusted to suit particular project needs.
GGBF slag consists of silica and alumina combined with calcium and magnesium oxides. Thecementatious properties of GGBF slag is determined by its composition and the rate at whichthe molten steel is cooled when it comes form the blast furnace. To maximize thecementatious properties of GGBF slag it must be chilled rapidly as it leaves the blast furnace,converting it to a fine aggregate.
Blended concretes in which GGBF slags are combined with portland cement are (i)slag-modified portland cement (GGBF slag less than 25 per cent of total weight, (ii) portlandblast-furnace slag cement (25 to 70 per cent GGBF slag) and (iii) slag cement (70 per centor more GGBF slag). These concretes have been used for over 100 years and have excellentservice records (ASI 1987). GGBF slags are usually substituted for portland cement on aone-to-one basis by mass.
The proportion of GGBF slag used in concrete is dictated by:
< the purpose for which the cement is used;
< curing temperature;
< grade (activity) of GGBF slag;
< time of setting and finishing (GGBF slag increases the setting time); sulphateresistance; and
< the control of expansion due to alkali silica reaction.
GGBF slag improves the workability and placability of cement compared to concrete notcontaining GGBF slag and reduces bleeding since it is finer than portland cement. Concretecontaining GGBF slag also is less permeable, improves sulphate resistance of concrete andreduces potential expansion of concrete due to alkali-silica reaction.
One drawback of concrete containing over 30 per cent GGBF slag is a loss in strength anddurability while curing. The extent to which GGBF slag affects strength is dependent on thegrade (composition and fineness) of GGBF slag and the ratio it is used in mixture. Theamount of water and curing temperature are also factors influencing the strength of concretecontaining GGBF slag.
55
Concrete containing GGBF slag exhibits similar freezing and thawing and resistance todeicing chemicals, has no impact on corrosion of steel and has similar modulus of elasticityas concrete not containing GGBF slag (ASI 1987).
Concrete containing 25 to 70 per cent GGBF slag can be used as a partial replacement in allconcrete applications presently using portland cement except where high early strengths arerequired. Ultimately the use of GGBF slag depends upon the desired qualities of the concrete(ASI 1987). GGBF slag/portland cement mixtures can also be used for ready-to-mixconcrete, precast concrete products and for mortars and grouts.
Replacement of cement with slag cement will result in reduction of energy used (less productproduced) and a corresponding reduction in emissions of VOC, NOx, SOx, particulates andlead.
Currently, Kock Minerals Company, a manufacturer of water-granulated blast slag cement,and National Slag Limited, use slag as a partial substitute for cement. Kock Minerals receivesits slag from Algoma Steel in Sault Ste. Marie and National Slag Limited handles the slaggenerated from the steel producers in southern Ontario. The slag used is chemically similarto portland cement but with a higher silica content (Kock Minerals 1992).
Reduction:
Improved concrete characteristics can extend the life of structures. At the present,structures are being repaired and replaced before the functional life of the structure. Thedevelopment of high performance concrete has improved the durability for use in structuralapplications (CPCA, 1991).
Reducing the demand for cement will result in reductions in emissions from the basicprocess.
Reuse and recycle:
Demolished concrete structures can be reused in protecting shorelines. Broken floor slabsand sidewalks can replace quarried stone in dry stone retaining walls applications.Technologies exist to recycle concrete structures but the economics have been a barrier forthis option (CPCA 1991).
If the economics became attractive, reusing cement would result in a reduction of cementproduced.
56

Cement kiln dust
Residual cement kiln dust (CKD) obtained from the stack gases can be sold as a byproductor can be disposed in a landfill. Current markets for the CKD include fertilizers, treatmentof municipal sewage, soil sweetening and as stabilizing agent for soil and sludge (CPCA1991).
Use of CKD in the applications mentioned above would reduce the demand for lime; hence,reductions in emissions associated with lime production could be expected.
5.2 Lime
5.2.1 Lime manufacturing
Lime is produced by calcining limestone (calcium carbonate) or dolomite (a combination ofmagnesium and calcium carbonates) at high temperatures to drive off carbon dioxide andproducing calcium oxide (quicklime). This process is carried out in a kiln. There are two basickiln designs:
< Rotary kiln — a long cylindrical kiln angled slightly from the horizontal. The kiln isfired using a fuel source and the kiln feed enters at the top end. Carbon dioxide is aby-product gas along with combustion gases.
< Vertical or shaft kiln — these are short, vertical cylinders lined with refractorymaterials. There are four basic zones in a shaft kiln including : (1) stone storagezone, (2) preheating zone (3) calcining zone and (4) cooling and discharge zone.
Other designs include rotary hearth kiln and the flousolids kiln. The non-energy source ofcarbon dioxide is from the calcination reaction.
The major users of lime include the following sectors (National Lime Association 1992):
< steel manufacture;< soil stabilization;< building construction;< air pollution control; and< water treatment.
Some uses of lime absorb atmospheric carbon dioxide to form calcium carbonate. The usesincluded the following:
57

< precipitated carbon carbonate;< construction (soil stabilization, finishing lime, mason's lime);< environmental applications (flue gas sulphur removal, water purification); and< agriculture.
These uses can be considered as sinks in the carbon cycle.
A study is presently being conducted by ICF Incorporated for the U.S. EPA that is concernedwith GHG emissions in the lime and cement industry. The study was concerned with anemissions inventory for the cement and lime industry in the United States.
Emissions in Ontario
There are nine major producers of lime in Ontario. Emissions of carbon dioxide from limeproduction were 1418 kilotonnes in 1988 and are forecast to increase to 1854 kt by 2005(SENES 1992).
Selected actions
At present there are actions planned to mitigate non-energy GHG emissions from limemanufacturing (Personal communication, National Lime Association). No actions wereconsidered for the lime industry.
5.3 Pulp and paper
5.3.1 Pulp and paper manufacturing
The production process for pulp and paper operations at an integrated Kraft mill consists ofthe following steps (CERI 1989):
< raw material harvest, collection and transportation;< wood preparation, debarking and chipping;< pulping;< bleaching;< pulp stock preparation;< sheet preparation;< pressing;< drying;
58

< finishing, coating, cutting and binding.
The pulping process involves breaking wood down by disintegrating the lignin to producethe cellulose fibre mass called pulp. Pulping can be performed using mechanical processesor by the use of chemicals, heat or pressure to produce various grades of fibres. The Kraftprocess is the most common chemical pulp process in Canada.
Wood chips are dissolved in a heated chemical solution of sodium sulphate called whiteliquor. After the pulping process in the digester, the spent or black pulping liquor containslignin and sodium sulphate. Evaporated and compressed black liquor is sprayed into a boilerwhere the organics are burned off leaving behind smelt. Green liquor is produced fromdissolved smelt by regeneration in the causticizing stage. Lime produced from a kiln is addedto liquor at the causticizing stage. Carbon dioxide is emitted during the Kraft process fromblack liquor combustion in the furnace.
The major markets for Kraft pulp include:
< printing and writing paper;< paperboard.
Emissions in Ontario
CO2 emissions from the combustion of spent pulping (black) liquors in the furnace isestimated at 441 kilotonnes in 1988 and 666 kilotonnes in 2005 (SENES 1992).
Selected actions
Several actions are considered for reducing CO2 emissions from the combustion of blackliquors. These actions are not included in the analysis due to a lack of information onpotential reductions in GHG emissions and cost data.
Recycle :
An increase in the recycling of forest products (paper products — old newspapers, finepaper, old corrugated cardboard) results in a decrease in demand for virgin pulp. Thisdecreases the amount of Kraft pulp produced.
59
Process change:
The most promising technological changes in chemical pulping is in the chemical recoverystage. Research is being conducted in the gasification of the black liquor. Two examples ofthis technology are the Champion International gasification system which turns black liquorinto green liquor and heating gas although recausticizing is still required in the cycle andplasma gasification which does not need the causticizing step but requires more energy(generally electricity). Development of plasma gasification is not expected due to highcapital and operating costs (CERI 1989).
Implementation of the Champion system will result in reduced energy requirements but notnon-energy CO2 emissions. The plasma technology will lower non-energy carbon dioxideemissions but increase emissions associated with the increased consumption of energy.
5.4 Ammonia
5.4.1 Ammonia production
The processes for producing ammonia were described above in Section 6.4.1. CO2 is emittedas a by-product from the CO2 regenerator.
The three ammonia plants in Ontario capture the CO2 regenerated from the CO shiftconverter through CO2 scrubbing and stripping (McBeath 1987). The CO2 is used for ureamanufacture or sold for making carbonic acid, dry ice, etc. Surplus CO2 is released into theatmosphere. One plant in Ontario, Nitrochem, generates CO2 from its nitrogen scrubbingunit. These emissions are released into the atmosphere.
Emissions in Ontario
Carbon dioxide emissions from ammonia production in Ontario are estimated at 1600kilotonnes in 1988 and 1400 kilotonnes in 2005 (SENES 1992).
Selected actions
All three Ontario manufacturers of ammonia use control technologies to mitigate emissionsof CO2.
60
Capture and recover CO2 :
Carbon dioxide emissions from ammonia manufacturing can be reduced through the sale ofCO2 captured, rather than released into the atmosphere, during the CO2 regeneration processfor use in urea manufacturing, carbonic acid, dry ice etc. There are no costs associated withthis action since CO2 is already captured and sold into these markets. Greater demand forCO2 in these markets will reduce the amount of CO2 released into the atmosphere fromammonia production.
This action results in a transfer of greenhouse gas emissions from ammonia production toanother source and is not considered further.
Currently there are no technically feasible actions for the control of CO2 emissions fromnitrogen scrubbing during ammonia manufacture.
5.5 Raw CO2
5.5.1 Raw CO2 use
Carbon dioxide is available from a number of sources including:
< recovery from synthesis gas in ammonia production;
< recovery as a by-product in the production of substitute natural gas from gasificationof coal;
< recovery from production of ethanol by fermentation; and
< recovery from natural wells.
High purity CO2 is obtained by using an absorption system (Austin 1984). The main uses ofCO2 in all forms include:
< production of urea;< pressurizing oil wells for secondary oil recovery;< refrigeration (solid CO2);< beverage carbonation (liquid); and< fire extinguisher (liquid) (Austin 1984).
61
Emissions in Ontario
About 1000 tonnes of CO2 were emitted through raw CO2 use in Ontario in 1988 (SENES1992). A forecast of emissions in the year 2005 is not available.
Selected actions
No actions were identified during the study for reducing emissions from raw CO2 use.
62

6 Actions to reduce nitrous oxide emissions
Nitrogen oxide emissions arise from production processes in industry. The industrialprocesses considered to be the most significant are adipic acid production, nitrogenousfertilizer use in agriculture, N2O use as an anaesthetic and ammonia production. For eachindustry, the industrial process leading to GHG emissions is described along with the majoruses of the product. This is followed by a discussion of possible actions identified for eachindustry.
Actions considered can be classified into the following categories:
< product substitution;< process changes;< emission control measures.
The manufacturing processes for each industry are described to identify the basis of the GHGemissions. The potential for reduction of other non-GHG emissions associated with theprocess are identified also.
6.1 Adipic acid
6.1.1 Adipic Acid Production
Adipic acid production emits N2O during the production process. Current control measuresremove about 50 per cent of N2O emissions. The single manufacturing plant in Ontario(DuPont) has announced plans to virtually eliminate N2O emissions from their plant withinthe next five years. DuPont is evaluating the available technologies used to implement thisreduction.
Emissions in Ontario
SENES (1992) estimates 1988 N2O emissions from adipic acid production to be 11,700tonnes. Emissions of N2O in 2005 are expected to be zero.
Selected actions
Since N2O emissions from adipic acid production will be eliminated within five years no
63

mitigation actions are considered.
6.2 N2O
6.2.1 N2O use as an anaesthetic
Efforts to control N2O emissions are under way primarily to reduce occupational exposure.Some of the recommended measures will also reduce emissions from hospital anaestheticoperating rooms. The Ontario Ministry of Labour is currently undertaking a study regardingN2O exposure in dental offices but results of that study are not yet available.
Emission in Ontario
N2O used as an anaesthetic in hospitals and dental offices account for 600 tonnes of N2Oemissions in Ontario in 1998 and are expected to reach 700 tonnes by 2005.
Selected actions
No actions are considered for N2O anaesthetic use.
6.3 Nitrogenous fertilizer
6.3.1 Nitrogenous fertilizer use in agriculture
When nitrogenous fertilizer is applied on agricultural soils, N2O emissions occur. SignificantN2O emissions may also arise from domestic (residential) fertilizer use but are not includedin the analysis. 8 N2O is released in the soil by microbial processes resulting from thereduction and oxidation of mineral nitrogen (Jaques 1992). When nitrogenous fertilizer isapplied to agricultural soils a majority of the nitrogen is oxidized to nitrate before it isadsorbed by plants. This process is called nitrification. The remaining oxidized nitrogen isreleased to the atmosphere as N2O.
_____________8 It is assumed that domestic fertilizers are included in the data of total fertilizer use in Ontario
on which the emissions from agriculture fertilizer use are based.
64

The level of N2O emissions from fertilized soils depends on:
< fertilizer type and amount;
< application techniques and timing;
< tillage and irrigation practises;
< use of pesticides;
< soil and crop type; and
< amount of residual nitrogen in the soil (U.S. Department of Commerce 1991).
N2O emissions vary widely depending on how these factors interact.
Several options are available to increase fertilizer efficiency or reduce the need for fertilizer,thereby reducing emissions of N2O. The extent to which emissions can be lowered is notknown (U.S. Department of Commerce 1991).
The environmental benefits of reduced use of nitrogenous fertilizers is reducedcontamination of surface and groundwater and lower emissions of GHG into the atmosphere.
The linkages between the ammonia industrial sector and the fertilizer/agricultural sector arebeyond the scope of this study but are important (in terms of determining the efficacy ofproduct substitution in relation to greenhouse gas emissions and crop yields).
Emissions in Ontario
It is difficult to estimate N2O emissions from fertilizer use due to the factors (fertilizer type,application technique, etc.) which affect the rate of emissions. SENES (1992) calculates N2Oemissions from fertilizer applications on agricultural lands in Ontario at 1150 tonnes in 1988.ORTECH (1992) estimates emissions of 1733 tonnes of N2O in 1988 and Jaques (1992)estimates total N2O emissions for Ontario at 2462 tonnes in 1990.
SENES estimates emissions of N2O from fertilizer use in 2005 at 1300 tonnes.
65

Selected actions
Fertilizers are often used inefficiently in agriculture. Several actions are available forreducing N2O emissions from fertilizer use:
< efficient fertilizer application;< low N2O-emitting fertilizers;< slow-release fertilizers;< nitrification inhibitors; and< leguminous sources of nitrogen (O.T.A. 1990).
Efficient fertilizer application:
Nitrogenous fertilizers are applied to agricultural crops to increase yields. The effectivenessof fertilizer use (the amount of nitrogen in fertilizer applied to the soil taken up by plants)can be improved by determining the optimal amount of fertilizer to use based on:
< the amount of nitrogen already available in the root zone;< how much nitrogen the crops actually use;< the best time during the growing cycle to apply fertilizer; and< the depth at which the fertilizer should be applied (U.S. Department of Commerce
1991).
Low N2O-emitting fertilizers:
Anhydrous ammonia accounts for 13 per cent of fertilizer use and 63 per cent of total N2Oemissions resulting from fertilizer applications while urea accounts for 42 cent of totalfertilizer use and only 8 cent of N2O emissions9 (ORTECH 1992). Significant emissionsreductions may be possible by changing the type of nitrogenous fertilizer used onagricultural soils._______________________9 Fertilizer use by type in Ontario is as follows (ORTECH 1992):
Fertilizer Type N2O (t/a) Fertilizer Type N2O (t/a)anhydrous ammonia 1095 ammonium sulphate 2urea 140 monoammonium phosphate 39ammonium nitrate 150 diammonium phosphate 71solution 236 10-30-400 0
Total 733These data show that anhydrous ammonia has the largest potential for reduction presumably by substitutingan equivalent fertiliser which bas lower equivalent N2O emissions.
66

Applicability of this action and reductions in N2O emissions depend on a variety of factorsincluding type of crop and soil conditions. Further research is required.
Slow-release fertilizers and nitrification inhibitors:
Slow release fertilizers and nitrification inhibitors can reduce emissions of N2O by allowingfor more efficient plant uptake. In certain conditions the reduction in nitrogen losses are upto 30 per cent.
Slow release fertilizers and nitrification inhibitors may only delay emissions of N2O until afterthe nutrient uptake ceases and the crop is harvested.
Leguminous sources of nitrogen:
By growing "nitrogen fixing" legume crops such as peas or beans in rotation with grains theneed to apply fertilizer is less. The use of crop rotation using legumes would also loweremissions resulting from fertilizer production and conserve soil.
There is a lack of data on emissions reduction resulting from legume cultivation. Legumecultivation also may have limited applications in Ontario.
6.4 Ammonia
6.4.1 Ammonia production
Ammonia is the base product from which most nitrogen-containing chemical products arederived. Synthetic ammonia accounts for the major source of ammonia. Atmosphericnitrogen and hydrogen are reacted to form ammonia using ammonia catalysts. The majorsupply of hydrogen is from methane and other hydrocarbons. In Canada, 98 per cent ofsynthetic ammonia comes from the catalytic reforming of natural gas (McBeath 1987).Another source of ammonium compounds are coking plants which produce ammonia liquors,ammonium sulphate and ammonium phosphates. There are three ammonia producers inOntario.
The major use of ammonia is in the nitrogenous fertilizer industry (Austin 1984). Other usesinclude heat tracing, paper pulping, nitric acid, nitrates manufacture, nitric ester and nitrocompounds, explosives and as a refrigerant. The major fertilizers include ammonia,
67
ammonium nitrate, ammonium sulphate, ammonium phosphates (MAP and DAP) and urea.In Ontario about 78 per cent of ammonia production is used in manufacturing nitrogenousfertilizers (McBeath 1987).
Greenhouse gas emissions from ammonia production include a small amount of N2O ventedfrom the primary reformer stack.
Emissions in Ontario
Emissions of nitrous oxides from ammonia production are estimated at 8.7 kilotonnes in1988 and 7.7 kilotonnes in 2005 (SENES 1992). These estimates do not include possibleincreases in the use of ammonia as an alternative refrigerant to chlorofluorocarbons incommercial and industrial refrigeration and air conditioning applications.
Selected actions
N2O emissions from ammonia production are not controlled. There are no viable actions forthe control of N2O emissions from the reformer stack during ammonia manufacturing.
68

7 Costs of actions and measures
7.1 Actions to reduce GHG emissions
7.1.1 Estimating the costs of actions
Annual costs in 2005 for emission reductions that year are estimated by considering thecapital and operating costs of actions, the lifetime of technologies employed, and the delaybetween the time of implementation and achievement of emission reductions. In order toidentify the most economically attractive actions, their incremental unit costs in dollars pertonne of carbon dioxide equivalent were calculated.10
Because some of the actions apply to the same emissions source, it was necessary to assesshow actions interact. This was done by considering actions that apply to a single sourcetogether, and estimating the costs of moving from the least expensive to the most expensiveoption, and considering the incremental unit cost. For example, with flexible foams madusing CFC-11, it is possible to cut CFC use in half with reduction actions 11 (FLEX2, FLEX3),or a substitute blowing agent—HCFC-123—may be used (FLEX1) (see Table 16). The firsttwo actions will reduce CFC use (and hence emissions) and are free ($0.00/t-CE), whereasthe second eliminates all CFC-11 use and involves a modest equipment cost. In thisexample, the equipment cost that is part of the second action is spread not over all CFC use,but only that remaining after the zero cost reduction actions are taken.
Similarly, for some actions, including chemical substitution of CFCs it is possible to achievegreater reductions with earlier implementation, but at a greater cost. For example, the costof using HFC-134a in mobile air conditioners is about $28/t-CE if implemented in 2004 andabout $38/t-CE if implemented in 2000, reflecting the opportunity cost of capital betweenimplementation and realized emissions reductions in 2005. However, implementation in2000 will affect more vehicles, so reductions are greater. A complete description of themodelling framework used to determine the relative costs of actions is presented inAppendix B.
_____________________10 The details of the methodology used are described in Appendix B.
11 Actions are described using the action codes in Appendix A (e.g. FLEX1).
69

Based on the analysis of the incremental cost of each action, a number of actions are foundto be unattractive and will never be selected. These actions have a higher cost and loweremissions reductions than at least one other action that applies to the same emissionssource. The selected set of actions is presented in Table 15. Some actions considered werenever selected and are not presented in Table 15. For example, household composters areestimated to have a net negative cost and installing them in 2004 results in much lower CH4
emissions reductions from landfills than does installing them in 1995. Installing them earlierresults in not just lower emissions, but also larger economic savings. Consequently,installation of home composters in 2004 is never preferred.
7.1.2 The major actions for reducing GHG emissions
The largest sources from a quantity perspective are some of the CFC-related actions,accounting for almost 85 per cent of the (carbon dioxide equivalent) reductions associatedwith the selected actions (Table 15). As noted in Section 2.2, there is considerableuncertainty about the global warming potential of CFCs. Although many of the actions forCFC considered will be taken anyway to avert stratospheric ozone depletion, theirattractiveness as actions to reduce global warming may be limited. If the global warmingpotential of CFCs is near zero, the incremental reductions for CFCs indicated in Table 15 willalmost disappear.
As would be expected from the inventory data in Table 5, waste related actions are the nextmost significant types, followed by actions affecting smaller sources. Methane recovery fromlandfill results in the largest incremental emissions reduction from waste-related actions andhousehold composting reduces emissions from waste-related activities at least cost. Inassessing these actions, it should be noted that although the "other" actions as a group havean average incremental unit cost that is lower than the average for CFCs or waste relatedactions, there is quite a bit of variation in incremental unit costs within the three groups inTable 15.
70
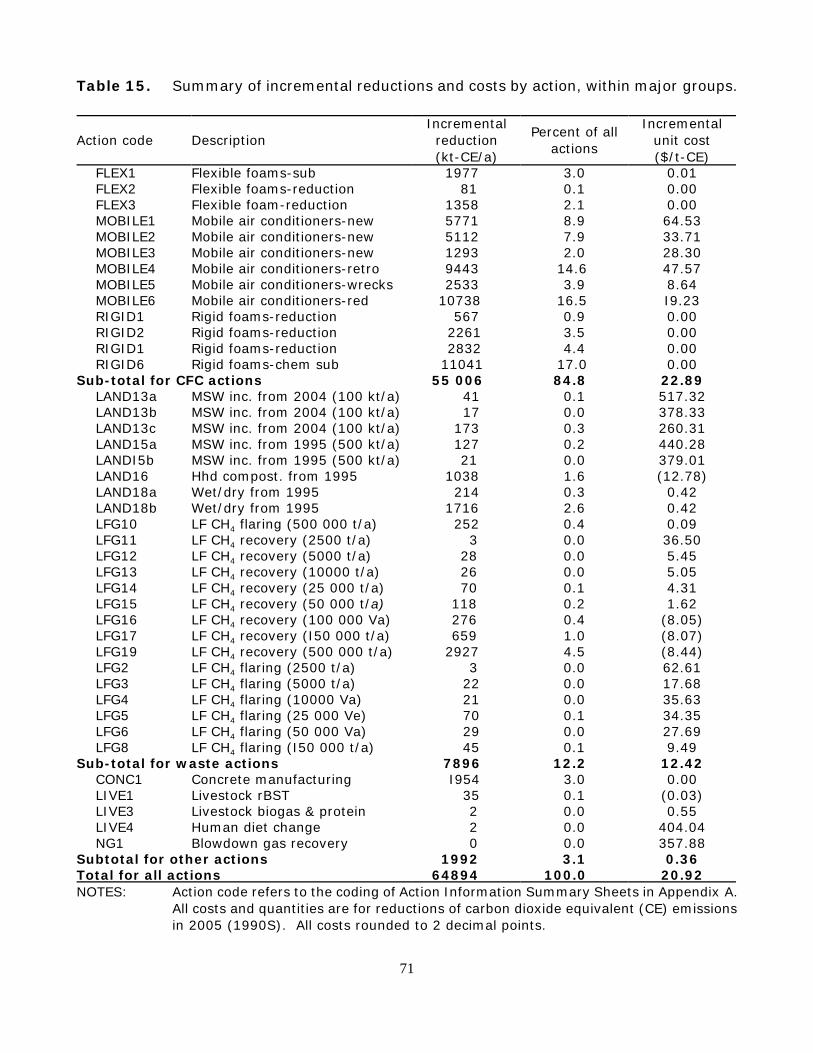
Table 15. Summary of incremental reductions and costs by action, within major groups.
Action code DescriptionIncrementalreduction(kt-CE/a)
Percent of allactions
Incrementalunit cost($/t-CE)
FLEX1 Flexible foams-sub 1977 3.0 0.01FLEX2 Flexible foams-reduction 81 0.1 0.00FLEX3 Flexible foam-reduction 1358 2.1 0.00MOBILE1 Mobile air conditioners-new 5771 8.9 64.53MOBILE2 Mobile air conditioners-new 5112 7.9 33.71MOBILE3 Mobile air conditioners-new 1293 2.0 28.30MOBILE4 Mobile air conditioners-retro 9443 14.6 47.57MOBILE5 Mobile air conditioners-wrecks 2533 3.9 8.64MOBILE6 Mobile air conditioners-red 10738 16.5 I9.23RIGID1 Rigid foams-reduction 567 0.9 0.00RIGID2 Rigid foams-reduction 2261 3.5 0.00RIGID1 Rigid foams-reduction 2832 4.4 0.00RIGID6 Rigid foams-chem sub 11041 17.0 0.00
Sub-total for CFC actions 55 006 84.8 22.89LAND13a MSW inc. from 2004 (100 kt/a) 41 0.1 517.32LAND13b MSW inc. from 2004 (100 kt/a) 17 0.0 378.33LAND13c MSW inc. from 2004 (100 kt/a) 173 0.3 260.31LAND15a MSW inc. from 1995 (500 kt/a) 127 0.2 440.28LANDI5b MSW inc. from 1995 (500 kt/a) 21 0.0 379.01LAND16 Hhd compost. from 1995 1038 1.6 (12.78)LAND18a Wet/dry from 1995 214 0.3 0.42LAND18b Wet/dry from 1995 1716 2.6 0.42LFG10 LF CH4 flaring (500 000 t/a) 252 0.4 0.09LFG11 LF CH4 recovery (2500 t/a) 3 0.0 36.50LFG12 LF CH4 recovery (5000 t/a) 28 0.0 5.45LFG13 LF CH4 recovery (10000 t/a) 26 0.0 5.05LFG14 LF CH4 recovery (25 000 t/a) 70 0.1 4.31LFG15 LF CH4 recovery (50 000 t/a) 118 0.2 1.62LFG16 LF CH4 recovery (100 000 Va) 276 0.4 (8.05)LFG17 LF CH4 recovery (I50 000 t/a) 659 1.0 (8.07)LFG19 LF CH4 recovery (500 000 t/a) 2927 4.5 (8.44)LFG2 LF CH4 flaring (2500 t/a) 3 0.0 62.61LFG3 LF CH4 flaring (5000 t/a) 22 0.0 17.68LFG4 LF CH4 flaring (10000 Va) 21 0.0 35.63LFG5 LF CH4 flaring (25 000 Ve) 70 0.1 34.35LFG6 LF CH4 flaring (50 000 Va) 29 0.0 27.69LFG8 LF CH4 flaring (I50 000 t/a) 45 0.1 9.49
Sub-total for waste actions 7896 12.2 12.42CONC1 Concrete manufacturing I954 3.0 0.00LIVE1 Livestock rBST 35 0.1 (0.03)LIVE3 Livestock biogas & protein 2 0.0 0.55LIVE4 Human diet change 2 0.0 404.04NG1 Blowdown gas recovery 0 0.0 357.88
Subtotal for other actions 1992 3.1 0.36Total for all actions 64894 100.0 20.92NOTES: Action code refers to the coding of Action Information Summary Sheets in Appendix A.
All costs and quantities are for reductions of carbon dioxide equivalent (CE) emissionsin 2005 (1990S). All costs rounded to 2 decimal points.
71
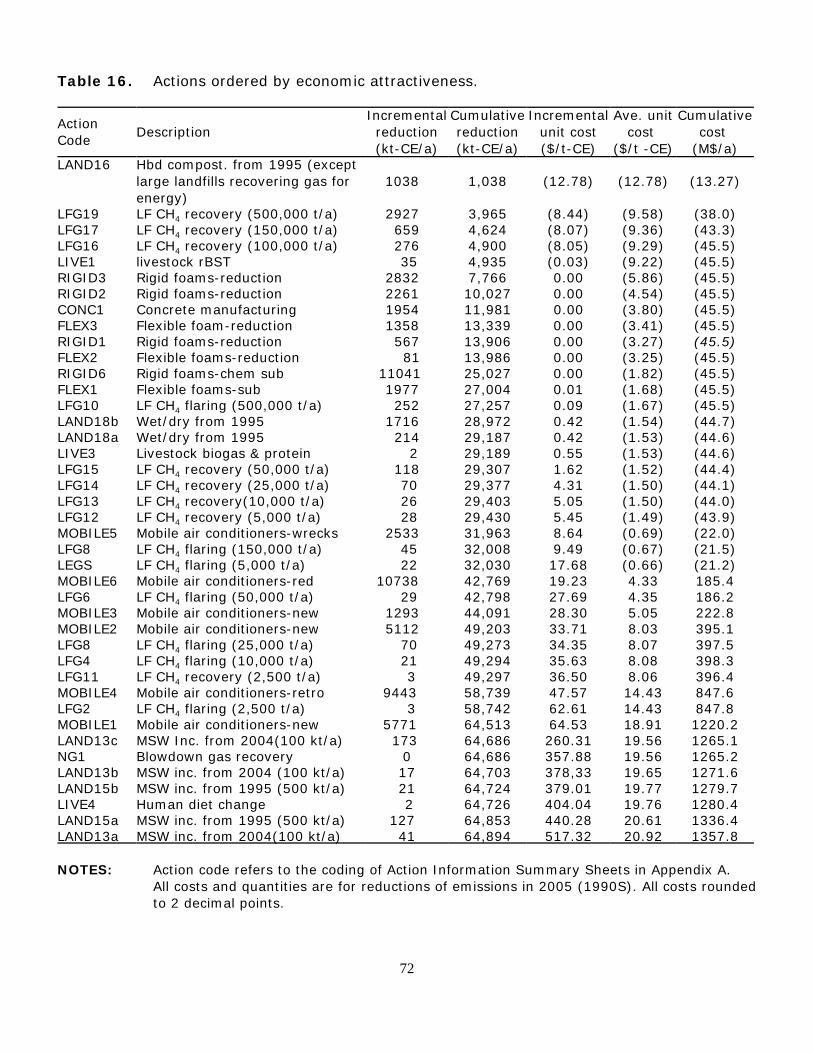
Table 16. Actions ordered by economic attractiveness.
ActionCode Description
Incrementalreduction(kt-CE/a)
Cumulativereduction(kt-CE/a)
Incrementalunit cost($/t-CE)
Ave. unitcost
($/t -CE)
Cumulativecost
(M$/a)LAND16 Hbd compost. from 1995 (except
large landfills recovering gas forenergy)
1038 1,038 (12.78) (12.78) (13.27)
LFG19 LF CH4 recovery (500,000 t/a) 2927 3,965 (8.44) (9.58) (38.0)LFG17 LF CH4 recovery (150,000 t/a) 659 4,624 (8.07) (9.36) (43.3)LFG16 LF CH4 recovery (100,000 t/a) 276 4,900 (8.05) (9.29) (45.5)LIVE1 livestock rBST 35 4,935 (0.03) (9.22) (45.5)RIGID3 Rigid foams-reduction 2832 7,766 0.00 (5.86) (45.5)RIGID2 Rigid foams-reduction 2261 10,027 0.00 (4.54) (45.5)CONC1 Concrete manufacturing 1954 11,981 0.00 (3.80) (45.5)FLEX3 Flexible foam-reduction 1358 13,339 0.00 (3.41) (45.5)RIGID1 Rigid foams-reduction 567 13,906 0.00 (3.27) (45.5)FLEX2 Flexible foams-reduction 81 13,986 0.00 (3.25) (45.5)RIGID6 Rigid foams-chem sub 11041 25,027 0.00 (1.82) (45.5)FLEX1 Flexible foams-sub 1977 27,004 0.01 (1.68) (45.5)LFG10 LF CH4 flaring (500,000 t/a) 252 27,257 0.09 (1.67) (45.5)LAND18b Wet/dry from 1995 1716 28,972 0.42 (1.54) (44.7)LAND18a Wet/dry from 1995 214 29,187 0.42 (1.53) (44.6)LIVE3 Livestock biogas & protein 2 29,189 0.55 (1.53) (44.6)LFG15 LF CH4 recovery (50,000 t/a) 118 29,307 1.62 (1.52) (44.4)LFG14 LF CH4 recovery (25,000 t/a) 70 29,377 4.31 (1.50) (44.1)LFG13 LF CH4 recovery(10,000 t/a) 26 29,403 5.05 (1.50) (44.0)LFG12 LF CH4 recovery (5,000 t/a) 28 29,430 5.45 (1.49) (43.9)MOBILE5 Mobile air conditioners-wrecks 2533 31,963 8.64 (0.69) (22.0)LFG8 LF CH4 flaring (150,000 t/a) 45 32,008 9.49 (0.67) (21.5)LEGS LF CH4 flaring (5,000 t/a) 22 32,030 17.68 (0.66) (21.2)MOBILE6 Mobile air conditioners-red 10738 42,769 19.23 4.33 185.4LFG6 LF CH4 flaring (50,000 t/a) 29 42,798 27.69 4.35 186.2MOBILE3 Mobile air conditioners-new 1293 44,091 28.30 5.05 222.8MOBILE2 Mobile air conditioners-new 5112 49,203 33.71 8.03 395.1LFG8 LF CH4 flaring (25,000 t/a) 70 49,273 34.35 8.07 397.5LFG4 LF CH4 flaring (10,000 t/a) 21 49,294 35.63 8.08 398.3LFG11 LF CH4 recovery (2,500 t/a) 3 49,297 36.50 8.06 396.4MOBILE4 Mobile air conditioners-retro 9443 58,739 47.57 14.43 847.6LFG2 LF CH4 flaring (2,500 t/a) 3 58,742 62.61 14.43 847.8MOBILE1 Mobile air conditioners-new 5771 64,513 64.53 18.91 1220.2LAND13c MSW Inc. from 2004(100 kt/a) 173 64,686 260.31 19.56 1265.1NG1 Blowdown gas recovery 0 64,686 357.88 19.56 1265.2LAND13b MSW inc. from 2004 (100 kt/a) 17 64,703 378,33 19.65 1271.6LAND15b MSW inc. from 1995 (500 kt/a) 21 64,724 379.01 19.77 1279.7LIVE4 Human diet change 2 64,726 404.04 19.76 1280.4LAND15a MSW inc. from 1995 (500 kt/a) 127 64,853 440.28 20.61 1336.4LAND13a MSW inc. from 2004(100 kt/a) 41 64,894 517.32 20.92 1357.8
NOTES: Action code refers to the coding of Action Information Summary Sheets in Appendix A.All costs and quantities are for reductions of emissions in 2005 (1990S). All costs roundedto 2 decimal points.
72

In fact, as indicated in Table 16, household composters are the most attractive in allcommunities where landfill gas recovery cannot be done, or where landfills have a capacitybelow 100,000 t/a. In communities with larger landfills where the energy can be recovered,landfill gas recovery is the most attractive means of reducing emissions.
7.1.3 An abatement cost curve for actions
The abatement cost curve is estimated by plotting and sorting the incremental unit costs ofactions against the cumulative carbon dioxide equivalent reduction in GHG emissions. Forexample, in Table 16 action LIVE] (livestock rBST) is more attractive than action CONC1(concrete manufacturing) for reducing carbon dioxide equivalent GHG emissions since itsincremental unit cost is less (LIVE] costs $-0.03/t-CE versus CONC1 $0.00/t-CE).
The actions ordered by their economic attractiveness for reducing CE emissions from leastto most expensive are presented in Table 16. Ranking is based on the incremental unit costof each action. Household composting implemented in 1995 is the most economicallyattractive action. Of the five actions which result in a negative cost (a net benefit) four affectwaste-related activity (household composting and CH4 recovery from landfill). These fiveactions result in a cumulative reduction of 4,935 t-CE/a.
The largest incremental reductions in emissions result from actions affecting emissions ofCFCs, particularly through substitution actions, for rigid foam manufacturing and mobile airconditioners. Actions affecting rigid foam manufacturing are expected to be free(incremental unit cost of $0.00/t-CE) whereas actions affecting mobile air conditioners aremore expensive varying between about $9/t-CE and $63/t-CE.
The average unit cost, including all of the actions in Table 16 is $20.92/t-CE. This results ina reduction in GHG emissions of about 64,900 t-CE/a. The estimated cumulative cost ofthese actions is an estimated $1.4 billion. More than 32,000 t-CE could be reduced with nonet cost and with significant savings ($21 million).
Figure 2 presents the data in Table 16 graphically. Figure 3 presents the same data withCFCs excluded, indicating that if CFCs do not contribute significantly to global warming, thepotential reductions of emissions are considerably lower, but most of these reductions canbe achieved at no cost. 12
______________12 Note that the x-axes are different for Figure 2 and Figure 3.
73

7.2 Measures to induce the actions
Some of the actions are already being taken on the basis df current policies and economics.There are additional opportunities to increase the performance of these actions, and thusfurther reduce GHG emissions from non-energy sources, by adopting new measures.
In this section, the importance of assessing measures (as distinct from actions) isconsidered, and criteria for evaluating measures are considered. Finally, consideration isgiven to how plotting measures might affect the abatement cost curve in Figure 2.
7.2.1 The need for measures
There are two major barriers to the performance of actions to reduce emissions:
< Those responsible for a particular emissions source recognize that there are abatementactions that they could take for which there are net benefits to society as a whole, butthey refrain from taking these actions because the benefits to them only are less than thecosts they would incur (i.e. in economic terms, an "externality" exists).
< Those responsible for a particular emissions source are unaware that there are abatementactions that they could take for which the benefits exceed the costs, even when viewedfrom their private perspective (i.e. there exists a lack of information or knowledgeregarding possible abatement actions).
In practice, there may be a combination of these factors inhibiting the performance ofactions. This suggests three different types of policy instruments to overcome these barriers.Policy instruments to address these barriers include:
< regulations, to require the performance (or avoidance) of particular actions by commandand control of government;
< economic instruments (such as taxes, subsidies or tradeable emissions allowances) toprovide incentives for actions to be taken; and
< information measures, where government undertakes or sponsors the production anddissemination of information to promote awareness of cost effective abatement actions.
74

Figure 2. Average and incremental costs of achieving reductions in non-energygreenhouse gas emissions.
75

Figure 3. Average and incremental costs of achieving reductions in non-energygreenhouse gas emissions (excluding CFCs).
76

Where both externalities and lack of information inhibit action, measures employingcombinations of policy instruments may be needed.
7.2.2 Criteria for evaluating measures
The appropriateness of new environmental policy measures must usually be assessedagainst several criteria. One such set of criteria is outlined in Table 17. These are broadlyconsistent with other lists of criteria for evaluating measures (see, e.g., OECD 1991).
First, there is administrative feasibility, which is a part of a broader criterion of applicability,including the level of jurisdiction that can apply the measure (i.e. whether the measure iswithin federal, provincial or provincial/municipal jurisdiction).
Second there is effectiveness of the measure in achieving an environmental target.
Third, based on the total costs of a measure, including its administrative costs as well as thecosts of the action that it induces, the efficiency of the measure is assessed. Since theadministrative costs of measures will be different, the order of measures in terms of costmay be different from the order of actions. For example, the costs of mandating landfill gasrecovery are minimal but the costs of training and implementation for home composting arehigh. As such, when a measure's cost is added to the action costs the total costs will notonly increase but may also affect the order of actions. Therefore, the abatement cost curvefor measures will have higher costs, and could have a different order of actions than theabatement cost curve for actions. Nevertheless, it is the abatement cost curve for measuresrather than actions that is relevant in assessing a measure on the basis of efficiency froma policy maker's perspective.
Finally, we consider acceptability as part of a broader criterion of equity, because whereacceptability is challenged it is usually based on some consideration of equity. Also, weconsider acceptability in relation to effectiveness and efficiency, because acceptability islikely to affect the level and costs of compliance. The Polluter Pays Principle (OECD 1975),which the OECD has recommended on the basis both of efficiency and equity, is also appliedhere as an aspect of equity. The Polluter Pays Principle states that polluters should beresponsible for meeting environmental standards and any costs that they incur in doing so;polluters should not be subsidized to meet environmental standards.
77

Table 17. Summary of criteria for the evaluation of measures.
Applicability jurisdictionadministrative meansease of monitoring performanceindependently adoptable
Effectiveness potential reduction (t-CE)potential reduction (%targets)response capacityenforceable
Efficiency administrative costsstatic net cost/t-CEstatic separable cost/t-CEdynamic efficiency
Equity polluter pays principledistribution relative to status quoallocation of joint costs/benefitsequal costs per unit of contribution to global warming
There is a large number of measures that are potentially applicable to each source andaction, including economic instruments and information measures, as well as regulations.It is impractical or very costly to monitor GHG emissions directly. Therefore, policy measuresto control GHG emissions directly are usually inapplicable.
As such it may also be necessary to base policies on proxy factors (control factors whicheffect the level of GHG emissions) that are indicative of GHG emissions. The rate or quantityof emissions from an anthropogenic process will depend on the following control factors:
< the types and quantities of inputs and outputs;
< the technology that is used;
< the manner of operation of the technology; and
< the situation in which the operation occurs.
These control factors of GHG emissions yield a range of possible policy instrumentsthat are intended to limit or restrict GHG emissions (Table 18).
78

Table 18. Types of measures applicable by control factors.
Control factor
Economicinstruments
Regulatorymeasures
Informationmeasures
Emissions charges (per unit)tradeable permitsnon-compliance feesperformance bonds
limits
Inputs/Outputs charges added to pricedeposit-refund system
restrictions on typerestrictions on usessunsetting uses
promote alternativesproduct labelling R&D:new products
Technology chargessubsidiestax differentiation
standardssunsettingtechnologies
promote alternativesproduct labelling R&D:new technologies
Operation tax differentiationnon-compliance feesperformance bonds
operating requirements
augment trainingresearch
Situation tax differentiationnon-compliance feesperformance bonds
restrictions augment trainingresearch
Given the extensive range of possible measures for each source, it is desirable to specify andassess these measures qualitatively according to the evaluation criteria (Table 17). This willreduce the number of measures considered in more detailed to a few for each source. Theadvantage of this approach is that rather than undertaking a detailed evaluation of allmeasures only the most promising for each emission source are evaluated.
79

7.2.3 An abatement cost curve for measures
The ultimate aim should be to produce an abatement cost curve for measures, as has beendone for actions. The full cost of achieving the reductions includes both the costs of thetechnology, and the costs of implementing and administering the measure to induce itsadoption. As noted above, the ordering of economic attractiveness of individual actions maydiffer when the costs of measures is included since some actions will require measures thatare more difficult and expensive to implement than others.
To this end, it is necessary to consider the component costs for administering some of themeasures. In some cases, it may be possible to say whether the administrative costs of ameasure are likely to be "large" or "small" relative to the costs of the actions to comply withthe measures. Based on the availability of this information a provisional least-costabatement curve for measures may be constructed from the abatement cost curve foractions by temporarily taking out the actions for which administrative costs are relativelylarge, until the costs of these measures (including administrative costs) can be determinedmore precisely.
Administrative costs are likely to be greatest for those measures that apply to a largenumber of establishments (households, farms). Administrative costs will usually be relativelysmall for industries (including landfills, wrecking yards, etc.), especially those with a smallnumber of firms; this is the case for most of the actions. The acceptability of measures isalso likely to be greater in these latter cases.
80
8 Impact analysis of actions
Until recently, government planning and policy formulation and evaluation have reliedheavily on intuition and assumption rather than on empirical assessment. Today,environmental policy is under pressure to increase its capacity to utilize information andexpertise in the planning and evaluation processes.
As economic resources are becoming scarcer, competition for dwindling resources hascreated the necessity for rationalizing the use of these scarce resources and public funds asnever before. In this respect social and general indicators are no longer sufficient. Equallyimportant is the use of economic methods and techniques to evaluate the economic worthand impact of activities on the provincial economy and on several recognized economic andsocial indicators.
In this chapter the impacts of actions mitigating non-energy greenhouse gas emissions areestimated using an input-output model. The actions considered are for the most significantsources of non-energy greenhouse gas emissions: CFCs for refrigeration and airconditioning, plastic foam production for insulation and methane gases from landfills, aspresented in Table 16.
The actions considered use scarce resources, alter the economic structures of originaloperations and change the commodity composition of outputs and inputs of what would haveexisted in the absence of any mitigating action. This change in the pattern of resource useand the nature of the action taken to reduce non-energy GHG emissions determines themagnitude and nature of the economic consequences of these actions. Some of theseimpacts, particularly those actions requiring large capital and operating expenditures, mayresult in positive impacts in the sense that they involve new expenditures on goods andservices within the province and could, as such, be considered as employment sustaining.
However, some of the actions considered in this study involve re-arranging the emissionsso as to permit the re-utilization of the emissions in productive activity (i.e. recovery oflandfill methane). The impact of these actions on economy may be negative. This occurs ifthe operating and capital costs needed to sustain the collection and re-utilization of thecaptured emissions is lower than the use of alternative inputs whose use is placed injeopardy.
This chapter outlines the type of impacts estimated using the input-output model andpresents the results of this analysis for actions reducing non-energy GHG emissions.
81

8.1 Description of impact analysis
Economic impact analysis is predicated on two fundamental principles:
< Regardless of the primary function and worth of any action or activity in society, tothe extent that its implementation involves the use of economic resources, societyderives an economic impact from it that is particularly dependent on its level ofoperation and pattern of resource use.
< Economic impacts are only partially measured using the initial expenditures on theaction. A more complete and accurate picture of impacts emerges from adding theindirect and induced effects to the initial effects.
The secondary effects (indirect and induced) arise because the economy is a complexsystem of interacting sectors that are tightly linked to one another. For example,expenditures by firms on machinery call for a large array of supporting supplies from othersectors that are not intuitively associated with machinery production. Expenses onmachinery will increase the demand for cement, steel, other machinery, furniture and so onwhich, in turn, generates demand for labour, energy, etc. These impacts are generallyreferred to as the indirect effects of the original expenditures on machinery. But asproduction increases, incomes of factors of production also increase, triggering in turnadditional expenditures on consumer goods. The latter impacts are generally referred to asthe induced effects. The sum total of direct, indirect and induced effects represent the totalimpact of the original expenditures on the economy. These three component effects arecaptured using an input/output model. The use of these models to capture all the rounds ofimpacts is now a standard practice in impact analysis.
Economic impacts may be measured from either the demand side or the supply side. Thedemand side is deemed more appropriate in cases where consumer demand and choicesprevail. In the analysis of investment projects and mitigative activities such as thoseconsidered in this study, the supply side is more relevant. Expenditures associated withmitigating actions are broken down into their commodity composition (inputs intoproduction) and the latter allocated to the appropriate final demand category. A fullinput/output solution is generated driven by the specified final demand.
Different indicators can be used to gauge the magnitude and direction of the impacts ofchanges in economic activity. The most relevant and commonly used economic indicator isthat of employment sustained by the action. Employment impacts are the person-years ofemployment created as a result of the. action and are relevant here inasmuch as some ofthe actions may be expected to result in negative impacts.
82

In addition to employment, value added (income) which represents the sum total of factorpayments made in the course of implementing the action is calculated. Value added may notcorrespond directly to employment. Some actions may have high employment but modestvalue added impacts. Another indicator of impact is gross output (shipments or sales). Thisis a valuable indicator of overall activity in an economy to businesses which are concernedabout their turnover and volume of sales. Labour income is an indicator of the incomereceived through employment resulting from the implementation of each action.
The ability of government to introduce measures that lead to the implementation of theseactions depends on its ability to fund them. As such an indicator regarding tax revenues bylevel of government also is used. The level of tax revenue arising from an action providessome information about the likely revenues government can expect from implementing anaction. Tax revenues are also determined by a number of economic variables that includewages and salaries, other income, sales, etc.
All of the economic activity indicators used in this study are presented in terms of theirdirect (initial), indirect and induced effects. Multipliers associated with each action andeconomic impact indicator are calculated for comparative purposes. Generally, multipliersare calculated by dividing total economic effect by original expenditures. The employmentmultiplier is calculated by dividing total employment by direct employment to determine themultiplier.
Impact analysis is only one method of many to analyze the economic consequences ofactions to reduce greenhouse gases from non-energy sources. Cost benefit analysis couldalso be used to evaluate the total social costs and benefits of the actions. In addition, amanagement or financial accounting approach could be used to examine the total revenuesand expenditures resulting from each action. From the perspective of impact analysis, givenits heavy emphasis on maintaining jobs, the creation of new sources of energy could beconsidered a drawback, particularly if it were to reduce the jobs in the community. Forexample, the recycling of methane which saves on energy requirements for heating andproduction cannot be considered as having totally negative impacts.
The impact analysis undertaken in this study does not utilize a multiple accountingframework of the social worth of different actions and activities which delineates theperimeters of trade-offs involved between economic and environmental objectives. Ratherit provides only information on secondary economic consequences associated with directexpenditures on actions.
83

8.2 Economic impact of actions
A number of actions are identified as attractive for reducing non-energy greenhouse gasemissions (Table 16).
Some emissions sources had more than one economically attractive action. In suchinstances it was necessary to assess how these actions interact with one another. This wasdone by considering actions that apply to a single source together, and then estimating thecost of moving from the least expensive to the most expensive action on an incrementalbasis. Based on this analysis, it was possible to eliminate some actions and combine others.These involved higher costs and result in small reductions in emissions than at least oneother action that applies to the same emissions source. Thus, household composters arevery attractive in all communities where landfill gas recovery cannot be done, or wherelandfill capacity is below 100,000 t/a. On the other hand, in large communities with largelandfill capacities where it is possible to recover methane, this recovery is the most efficientmeans for reducing emissions. A more detailed description of the selection of economicallyattractive actions is provided in Appendix B.
Each action considered in the study was assigned a capital cost and a stream of operatingcosts. The latter were discounted and their present value estimated in 1990 dollars(Appendix A). To the extent that an action involves capital or operating costs or both withno compensating revenues, these costs were allocated to the commodities sustaining theexpenditure. It is these expenditures which are fed separately for each action through theinput/output model to generate the results shown in Table 19 and Table 20.
If an action resulted in displacing another commodity input or generated its own source ofenergy (eg. landfill methane), the revenues from these commodity inputs were deductedfrom the initial capital and operating expenditures to arrive at what is termed as netimpacts. For example, the capital and operating expenditures to purchase a set ofcommodity inputs to recover landfill methane results in a commodity output (energy). Theuse of this output as a commodity input elsewhere in the economy is a flow of revenue tothe initial action. It is this flow of revenue which is deducted from the initial capital andoperating expenditures.
In one case there were reductions in inputs with no or little increase in operating or capitalexpenditures. This is the case of CONC1, in which cement use was reduced by 25 per cent.The economic level of construction in Ontario in 1990 was used to assume the final demandfor concrete, but with a technological change that reduces the use of cement by 25 per cent.Naturally, the results showed a major decline in the number of jobs and income. The resultsunder the column heading of Concrete are therefore negative.
84

The result of eliminating non-cost effective actions and combining actions affecting commonsources results in 14 separate groupings of 24 actions included in the impact analysis.
8.3 Results of impact analysis
The action to reduce non-energy sources of GHG emissions were evaluated based on thefollowing:
< total provincial impacts;< impacts by industrial sector; and< relative (comparative) impacts between actions.
Each action was analysed separately in the input-output model.
8.3.1 Provincial impacts
Based on a total initial expenditure just under $5 billion, the estimated total net provincialimpact of all the actions considered is about 122 thousand new person-years of employmentand over $7 billion in value added income (Table 19). The economic impact on provincialgross output is expected to increase by about $12 billion while total labour income increasesby about $5 billion (Table 19). Government tax revenue is expected to increase by about $2billion with federal authorities receiving almost two-thirds of the increased revenue.
Mobile actions (MOBILE1 and MOBILE4) show the highest impacts since they result in verylarge capital and operating expenditures. Together these two actions result in over 60% ofthe net employment and value added impacts. It is not hard to believe that these impactsmay be additional to the overall economic performance of Ontario. Together they call for anet initial expenditure of about $3 billion (Table 19). This amount is not expected to bemade in one or two years. Rather it is expected to be spread over a long period. The $3billion is the present value of a stream of expenditures over a period of years depending onthe action (eg. from 1 year for MOBILE4 to 10 years for MOBILE1). A complete descriptionof the length of time from implementing the action to 2005 is provided in Appendix A.
It is possible, therefore, that the economy will be able to absorb the impact of these actionswithout any crowding out of other activities given the low inflationary pressures and thestate of generalized excess capacity of the current and medium term outlook of the Ontarioeconomy.
85

Only one action results in a negative net economic impact, CONCRETE1. This is notunexpected since the assumption used to estimate these impacts assumes cement use wasreduced by 25%, adversely affecting the final demand for construction services.
8.3.2 Sectoral employment impacts
It is to be expected that a different sectoral profile of the economic impact is likely toemerge in association with each action. These impacts on 25 different industrial sectors arepresented in Table 20.
The largest employment impacts occur in the services and government, machinery and tradesectors where just under one-half of all new person years of employment were created. Themajor actions contributing to the gain in employment are MOBILE1 and MOBILE4. Theseactions require significant new purchases of installation and servicing equipment as well asregular inspection and maintenance of motor vehicles.
The LFG actions contribute only marginally to sectoral employment since these actionscreate a flow of revenue through the sale of energy, offsetting the employment gains fromthe initial capital expenditures. 13
Several conclusions can be reached based on the sectoral analysis. First, the utility sectoris seen to lose jobs as landfill gases (LFG) are gathered and used. Second, under compostingactions (LAND16) it seems that plastic production (other manufacturing) is significantlyincreased as plastic composters are used whereas the other landfil diversion LAND actionsresult in a significant increase in the machinery and services and government sectors. Third,a selected set of sectors are impacted more than others for most actions. These includemachinery, services & government, utilities, metals, plastic (other manufacturing) and trade.This is the result of a change in final demand arising from the indirect and induced impactsof the actions.
The results of the sectoral impact analysis exclude the CONC1 action since the assumptionto determine the impact of this action is based on the reduction of the final demand forconstruction services. The reduction in final demand impacts different industrial sectors butdoes not make explicit the relationship between sectoral impacts and the action (CONC1).
__________________13 FLEX1 which results in the least provincial impact is excluded from the sectoral analysis since
its sectoral impact is negligible (less than 0.5 person years of employment for any singlesector.
86

8.3.3 Comparative ranking of the impact of actions
Since the economic impact results vary by sector as well as by indicator for each action, itwould be useful to narrow down the basis of comparing actions by adopting, a common base(denominator) for all the actions as was done for the ranking of economic attractivenesswhere t-CE was used as a denominator (Table 16). Such a comparison, or ranking, of theimpacts of actions provides a more comprehensive picture of the relative impact of eachaction.
Two possible ranking schemes were considered. Firstly, to rank each action in terms of itsimpact resulting from the same amount of dollar expenditures to initiate the action. That is,all impacts arise from the same common level of expenditures per action. Secondly, to rankthe impacts of actions based on the same level of reduction in GHG emissions (the samequantity reduction in GHG is imposed on all actions). This second method; resulting in adifferent level of expenditure per action to attain the same reduction in GHG, is used in thisstudy for standardizing the impacts of the actions.
For example, consider the fact that household composting in smaller communities (LAND16)involves the net initial expenditure of about $200 million (Table 19). Alternatively, largescale landfill gas recovery (LFG16, LFG17 and LFG19) involves the expenditure of about$210 million. It is not legitimate to compare these two actions without reducing them to thesame denominator. All that is required is either to reduce gas recovery expendituresproportionately to $200 from $210 or to raise household composting to $210 from $196. Ineither case it is clear that landfill gas recovery is more efficient as it results in higher incomeand employment impacts for the same level of dollars (Table 19). The same standardizingprocedure may be applied to all the actions. It is only after this standardization procedurethat a true comparison can be made. Such a comparison permits an assessment of thetrade-offs implicit in choosing any one action rather than another.
Three economic indicators were used to rank the impact of actions:
< According to their income (value added) contributions (this ranking resulted in asimilar ranking to gross output and labour income).
< According to the total number of person-years of employment they sustain.
< By the income multiplier associated with the different actions. This ranking focuseson the efficiency of the action to generate income per unit of expenditure (cost). Itis independent of the size of the impact.
87

In Table 16, actions are listed in descending order of their incremental costs ($/t-CE) ofemissions reduction. Because these actions use scarce resources and some even generaterevenues, they result in a stream of economic consequences on the economy at large. Theeconomic streams may not be in one-to-one correspondence with their economicattractiveness rankings in Table 16. This being the case, it is possible to define the termsof trade offs in economic activity between actions as shown in Table 19.
The relative comparison of the impacts of each action provide some interesting results.Firstly, while the large scale landfill gas recovery action (LFG16, LFG17 and LFG19) assumesthe top position under the income generated per one dollar of expenditure, it ranks in themiddle in terms of employment generation and near the top in unit costs. As such, it, andall landfill gas actions (LFG), do not show a discernible pattern about the way these actionsmake their contribution to economic activity. Secondly, large scale gas flaring (LFG10)shows a relatively low income multiplier, employment generation and incremental reduction.It ranks above average only in terms of low unit cost.
Thirdly, in terms of sheer size, retrofitting mobile air conditioners (MOBILE4) makes a largecontribution to incremental emission reduction and employment, but in terms of efficiencyit ranks rather low (value added multiplier). All the mobile actions result in large reductionsin emissions but surprisingly, only MOBILE4 and MOBILE1 result in the creation of significantamounts of employment. Invariably, all of the MOBILE actions show small value addedmultipliers and relatively high unit costs. Finally, LAND16, household composters, is themost efficient in terms of income per unit of GHG reduced of all of the actions.
The fact that different ordering of actions emerged under each of the different economicindicators used in Table 19 suggests that there exists a need to further assess the implicittrade-offs in the choosing one or another of these actions.
88

Table 19. Economic impact of actions on Ontario.
Projects
Impacts (millions of 1990$)
LAND16 LFG16, 17& 19
CON-CRETE
FLEX1 LFG10 LAND18a,18b
LFG12,13, 14& 15
MOBILE5 MOBILE6 LFG4, 5& 6
MOBILE1 MOBILE4 LAND13a& 13b
LAND15a& 15b
Total
Net initial $196.2 $210.9 ($243.8) $0.3 $4.4 $240.1 $48.0 $20.6 $209.0 $11.2 $818.6 $2128.9 $615.1 $447.3 $4706.8 expendituresGross output Direct $196.2 $210.9 ($243.81 $0.3 $4.4 $240.1 $48.0 $20.6 $209.0 $11.2 $818.6 $2128.9 $615.1 $447.3 $4706.8 Indirect & induced $296.2 $324.5 ($354.9) $0.4 $6.4 $351.3 $72.7 $32.2 $346.9 $16.3 $1194.2 $3145.8 $889.8 $647.1 $6968.9 Total $492.4 $535.4 ($598.7) $0.7 $10.8 $591.4 $120.7 $52.8 $555.9 $27.5 $2012.8 $5274.7 $1504.9 $1094.4 $11675.7
Multiplier 2.5 2.5 2.5 2.5 2.5 2.5 2.5 2.6 2.7 2.5 2.5 2.5 2.4 2.4 2.5
Value added Direct $88.5 $95.5 ($114.6) $0.1 $2.0 $110.8 $21.9 $7.8 $62.2 $3.2 $346.3 $921.8 $287.0 $208.8 $2043.3 Indirect & induced $206.5 $236.0 ($261.9) $0.3 $4.7 $255.7 $53.1 $21.2 $205.8 $12.0 $844.9 $2230.4 $654.7 $476.2 $4939.6 Total $295.0 $331.5 ($376.5) $0.4 $6.7 $366.5 $25.0 $29.0 $268.0 $17.2 $1191.2 $3152.2 $941.7 $685.0 $6982.9
Multiplier 1.5 1.6 1.5 1.6 1.5 1.5 1.6 1.4 1.3 1.5 1.5 1.5 1.5 1.5 1.5Employment (person years) Direct 1434.0 1789.0 (1868.0) 2.0 37.0 1874.0 411.0 1250 783.0 94.0 5914.0 16078.0 5292.0 3849.0 35844.0 Indirect & induced 3747.0 4054.0 (4622.0) 5.0 81.0 4399.0 911.0 379.0 3 843.0 205.0 14807.0 38870.0 11221.0 8161.0 86056.0 Total 5181.0 5843.0 (6495.0) 7.0 118.0 6273.0 1322.0 504.0 4 626.0 299.0 20751.0 54948.0 16513.0 12010.0 121900.0
Multiplier 3.6 3.3 3.5 3.5 3.2 3.3 3.2 0.0 5.9 3.2 3.5 3.4 3.1 3.1 3.4
Labour income Direct $ 56.6 $65.1 ($62.6) $0.1 $1.3 $69.6 $14.7 $4.9 $37.2 $3.3 $211.7 $574.9 $180.8 $131.5 $1284.1 Indirect & induced $149.0 $170.7 ($182.5) $0.2 $3.4 $183.2 $38.2 $15.5 $154.6 $8.5 $598.6 $1594.9 $366.0 $338.9 $3439.2 Total $205.6 $235.8 ($250.1) $0.3 $4.7 $252.8 $52.9 $20.4 $191.8 $11.8 $810.3 $2169.8 $546.8 $470.4 $4723.3Taxes Federal $66.0 $68.8 ($61.9) $0.1 $1.3 $71.8 $15.3 $5.5 $49.0 $3.3 $226.0 $602.7 $179.5 $130.5 $1357.9 Provincial $25.4 $28.4 ($31.3) $0.0 $0.6 $30.3 $6.4 $2.5 $24.3 $1.4 $100.9 $264.9 $77.3 $56.2 $587.3 Local $5.0 $5.6 ($7.1) $0.0 $0.1 $6.0 $1.3 $0.5 $4.4 $0.3 $21.3 $53.0 $15.1 $11.0 $116.5 Total $96.4 $102.8 ($100.3) $0.1 $2.0 $108.1 $23.0 $8.5 $77.7 $5.0 $348.2 $920.6 $271.9 $197.7 $2061.7
NOTE: The sectoral inputs for CONCRETE1 are excluded since the impacts are based on a change in the final demand for construction services rather than change in the commodityinputs to concrete manufacture. Non-cost effective actions and action affecting identical scums are combined. For a description of each action and expected initialexpenditures and the sources affected see Appendix B.
89

Table 20. Employment impacts by industry if actions on Ontario.
Projects
Industry (Person years employment)
LAND16 LAND16,17 & 19
LFG10 LAND18a &18b
LFG12, 13,14 & 15
MOBILE5 MOBILE6 LFG4, 5, 6 MOBILE1 MOBILE4 LAND13a.,13b & 13c
LAND15a &15b TOTAL
Agriculture 75.9 77.4 1.3 80.9 17.3 6.6 62.5 3.8 397.0 835.8 206.2 151.4 I918.3 Forestry 14.3 7.7 0.1 7.5 1.7 0.6 6.3 0.4 28.2 70.0 19.6 14.3 170.8Fishing 0.8 0.9 0.0 1.0 0.2 0.1 0.8 0.1 3.3 8.5 2.5 1.8 19.9Mining 32.7 4.7 0.1 7.2 1.2 0.6 5.8 0.3 34.4 73.0 19.0 13.8 192.8Food and beverage 58.0 66.1 1.3 69.5 14.8 5.6 52.3 3.3 258.4 633.2 178.4 129.8 I470.6 Primary tex1ile 82.3 16.9 0.3 17.5 3.8 1.9 22.7 0.8 59.4 163.1 45.1 32.8 446.6Knitting & weaving 43.8 32.2 0.6 34.5 2.2 2.8 26.5 1.6 110.7 296.5 88.2 64.2 710.7Wood 8.3 6.6 0.1 7.0 1.5 0.6 6.2 0.3 22.6 61.1 17.7 12.9 143.2Furniture 11.0 16.0 0.3 16.9 3.6 1.2 10.2 0.8 50.3 137.5 42.2 30.7 320.6Paper 83.8 28.6 0.5 27.1 6.3 2.3 22.4 1.3 114.4 265.1 70.4 51.2 673.3Printing 36.0 58.0 1.0 47.4 12.6 4.6 46.0 2.5 185.7 475.1 135.0 98.2 1101.9 Primary metals 35.1 189.0 3.2 183.8 40.6 14.9 149.0 8.2 457.8 1415.2 431.3 313.7 3241.9 Fabricated metals 65.7 476.4 8.1 459.9 102.2 24.1 108.0 20.3 1091.6 3237.2 1077.4 713.6 7454.7 Machinery 9.4 1455.7 24.5 1404.4 311.8 59.3 49.4 62.4 3199.5 9457.4 3266.0 2375.2 21674.9 Transport equipment 25.6 48.0 0.9 50.3 10.6 51.6 991.7 2.3 140.1 1304.3 124.9 90.8 2841.1 Electrical Products 31.6 570.1 9.7 551.7 122.3 25.0 51.5 24.6 1280.5 3777.5 1 290.4 938.5 8673.3 Non-Metal 11.7 19.4 0.4 19.6 4.2 2.3 29.3 0.9 65.7 182.2 42.8 34.8 418.1Petroleum petrochemical 14.2 8.7 0.2 12.6 2.1 1.1 10.3 0.6 88.1 156.8 33.8 24.6 353.1Chemical Production 152.1 42.6 0.8 43.4 9.4 3.7 37.6 2.0 1307.0 1543.2 108.8 79.2 3329.8 Other manufacturing 2432.5 115.7 2.1 113.8 25.3 10.3 109.9 5.3 382.7 1010.3 281.9 205.0 4694.7 Construction 34.3 26.3 0.8 41.8 6.7 3.5 34.5 2.0 153.2 381.8 113.3 82.4 880.4Utilities 342.2 (567.6) 7.7 415.6 (70.6) 36.4 370.2 19.6 I531.3 3834.6 I487.2 I081.6 8488.7Trade 609.5 878.9 16.2 852.8 194.3 67.4 599.1 41.2 2849.0 2510.9 2237.1 1627.0 17488.2 Service & Government 529.1 1762.1 22.4 1261.0 380.1 134.1 I 413.0 69.7 5210.2 13485.2 3806.7 2768.5 30847.1 Other employment 439.0 503.2 9.9 539.6 112.9 43.5 409.6 25.3 I729.6 4631.7 1380.7 1004.1 10829.0
Total 5 180.6 5 843.6 117.2 6 221.6 1 322.1 503.9 4 625.2 299.7 20 750.5 54 947.3 16 513.7 12 010.0 128 385.8
NOTE: The sectoral impacts for CONCRETE1 are excluded since the impacts based on a change in the final demand for construction services rather than a change in the commodityinputs to concrete manufacture. Non-cost effective actions and actions affecting identical sources are combined. For a description of each action and expected initialexpenditures and the sources affected see Appendix B.
90
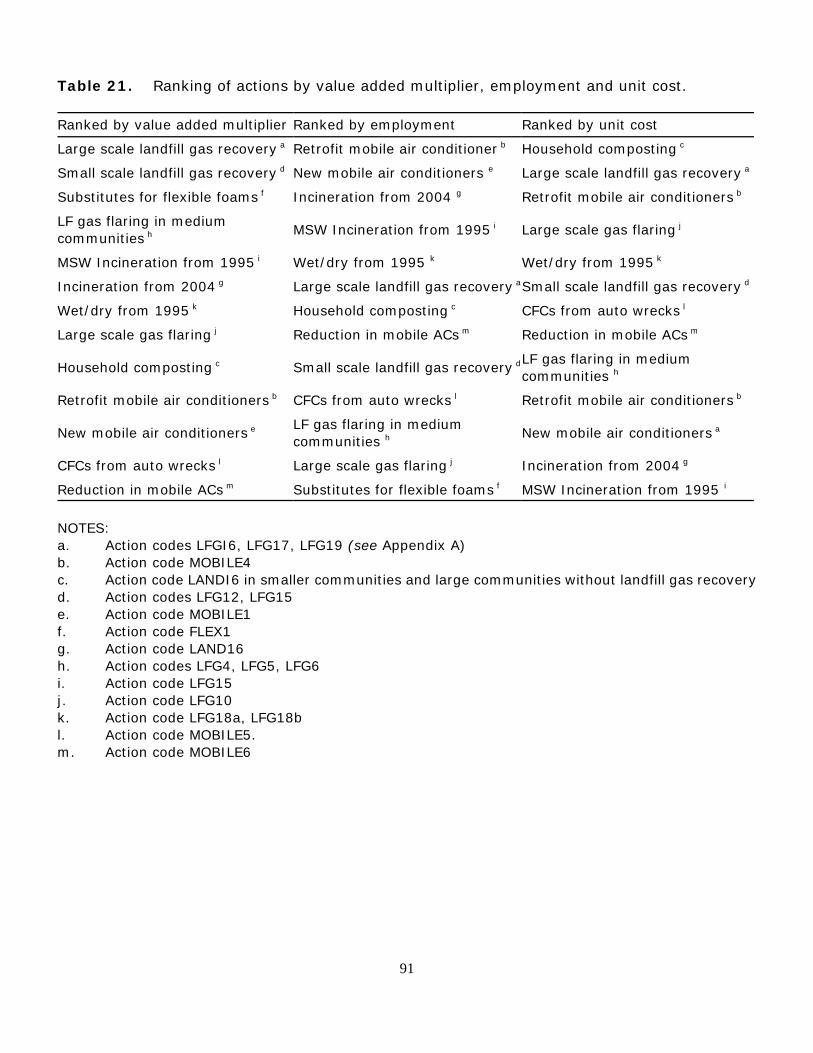
Table 21. Ranking of actions by value added multiplier, employment and unit cost.
Ranked by value added multiplier Ranked by employment Ranked by unit cost
Large scale landfill gas recovery a Retrofit mobile air conditioner b Household composting c
Small scale landfill gas recovery d New mobile air conditioners e Large scale landfill gas recovery a
Substitutes for flexible foams f Incineration from 2004 g Retrofit mobile air conditioners b
LF gas flaring in mediumcommunities h MSW Incineration from 1995 i Large scale gas flaring j
MSW Incineration from 1995 i Wet/dry from 1995 k Wet/dry from 1995 k
Incineration from 2004 g Large scale landfill gas recovery aSmall scale landfill gas recovery d
Wet/dry from 1995 k Household composting c CFCs from auto wrecks l
Large scale gas flaring j Reduction in mobile ACs m Reduction in mobile ACs m
Household composting c Small scale landfill gas recovery dLF gas flaring in mediumcommunities h
Retrofit mobile air conditioners b CFCs from auto wrecks l Retrofit mobile air conditioners b
New mobile air conditioners e LF gas flaring in mediumcommunities h New mobile air conditioners a
CFCs from auto wrecks l Large scale gas flaring j Incineration from 2004 g
Reduction in mobile ACs m Substitutes for flexible foams f MSW Incineration from 1995 i
NOTES: a. Action codes LFGI6, LFG17, LFG19 (see Appendix A)b. Action code MOBILE4c. Action code LANDI6 in smaller communities and large communities without landfill gas recoveryd. Action codes LFG12, LFG15e. Action code MOBILE1f. Action code FLEX1g. Action code LAND16h. Action codes LFG4, LFG5, LFG6i. Action code LFG15j. Action code LFG10k. Action code LFG18a, LFG18bl. Action code MOBILE5. m. Action code MOBILE6
91

9 Conclusions and recommendations
The major sources of non-energy greenhouse gas emissions, and the major areas wherereductions are possible, are CFCs used for foam blowing agents and for refrigerants.Methane emitted from landfills is the largest non-CFC source.
There are a range of actions possible for reducing emissions, some related to reducing thedemand for the product; others relate to finding substitute products. Assessing which ofthese is most attractive requires consideration of the quantities of gas affected, the cost ofthe action, the global warming potential of affected gases (including substitutes), and thecosts of other actions for the same source. Implementation date is also important for somesources, since releases occur considerably after the decision is made to use a particular CFCor to landfill waste. Many of the actions considered in this study to eliminate the use of CFCsas foam blowing agents and for refrigerants are consistent with the proposed bans andphaseouts recommended by the Montreal Protocol and adopted by the federal and Ontariogovernments.
The methodology presented in the report allows all these factors to be assessed, andsuggests an ordering of actions based on costs. To achieve emission reductions in 2005,some actions ought to be taken soon, but others can be deferred until near 2005. However,deferring actions will not reduce emissions today. Almost a third of the anticipated emissionsreductions can be achieved at zero or negative cost, and many of these actions are likely tobe taken to accrue other benefits such as lower operating costs. On average, more than halfthe emissions reductions can be achieved at zero cost. Consequently, there will be minimalcost associated with achieving significant reductions in non-energy related sources ofgreenhouse gases.
92

93

Appendix A. Action summary information sheets
Actions available to reduce non-energy greenhouse gas emissions, discussed in Chapters 3through 6, are summarized in the following Action Summary Information Sheets.
Most fields included in the summary information sheets are self-explanatory. Where theSOURCE AFFECTED is, for example, concrete manufacturing, the QUANTITY OF SOURCE isexpressed in units of concrete manufacturers (such as that summarized in action codeCONC1). GREENHOUSE GAS QUANTITY reductions are expressed in natural units (t/a) forthe number of units (sources) identified. This total potential quantity reduced is multipliedby expected LEVEL OF EFFECTIVENESS to yield estimated EFFECT ON GREENHOUSE GASES.CAPITAL COST OF ACTION and OPERATING COST OF ACTION, together with LIFETIME,IMPLEMENTATION SCHEDULE and PRIVATE AND SOCIAL DISCOUNT RATE, combine toproduce TOTAL NET COST OF ACTION per year (1990$/a).
94

Action summary information sheet
Sources affected Concrete manufacturing Action code Conc1Action ReductionType of action Reduce amount of portland cement by 25 per centDescription Use slag, fly ash or bottom ash instead of Portland cement in the manufacture
of concrete.Comments Slag, fly ash or bottom ash has been used in concrete manufacture for over
100 years. For most concrete uses fly ash is a viable alternative. May not beappropriate where strength of concrete is a priority. Can replace between 25and 70 of required raw materials (e.g., lime, silica).
References OTA 1990; ACI 1987; PCA 1989.Greenhouse gases CO2
Indirect impacts Reduction of waste to landfill: reduced enemy use in the manufacture ofcement.
Quantity of source 7 Portland cementproducers
Greenhouse gas quantity na per unit (kg/a) 7 814 000 Total (t/a)
Capital cost of action $0 (1990$)/unit
Operating cost of action $0 (1990$)/unit/a
Operating benefits n/aLifetime of action 25 yearDelay in reduction 0 yearLevel of effectiveness 25.0%
Implementation schedule 2005
Effect on greenhouse gases
Reduction (t/a) CO2
1953500Total net cost ofaction
Capital cost(1990$)
Operating cost (1990$/a)
Operating benefits(1990$/a)
Annual net cost(1990$/a)
$0 $0 $0 $0Discount rate Private Social
6.00% 3.00%
95

Action summary information sheet
Sources affected Flexible foams Action code Flex1Action Chemical substitutionType of action HCFC-123Description Flexible polyurethane slabstock and moulded foam used for cushioning.Comments Auxiliary blowing agent HCFC-123 has 0.02 the GWP of CFC-11. Undergoing
toxicity testing. Concerns regarding health and safety in the workplace.References Bach and Jain 1990; Environment Canada 1989; Stevenson Kellogg Ernst &
Young 1989; Jeffs, Rosebotham and Thomas 1990; Jeffs and Sparrow 1990;Cunningham, Rosebotham and Sparrow 1990; Lashof and Tirpak 1990.
Greenhouse gases CFC-11Indirect impacts Reduces ODP.Quantity of source 9 producersGreenhouse gas quantity na per unit (kg/a) 579 Total (t/a)
Capital cost of action $275 000 (1990$)/unitOperating cost of action na (1990$)/unit/a
Operating benefits n/aLifetime of action 20 yearsDelay in reduction 1 yearsLevel of effectiveness 100%Implementation schedule 2004
Effect on greenhouse Reduction (t/a) gases CFC-11 HCFC-123
579 (579)Total net cost of Capital Operating Operating Annual net action cost cost benefits cost
(1990$) (1990$/a) (1990$/a) (1990$/a)$275 000 na $0 $25 414
Discount rate Private Social6.00% 3.00%
96

Action summary information sheet
Sources affected Flexible foams Action code Flex2Action ReductionType of action Better management practices/housekeeping during production process of
flexible polyurethane foams.Description Decrease use of isocyanate in manufacturing process, decreasing the need for
CFCs as softeners.Comments Flexible foam used for padding in furniture, carpet underlay and motor vehicle
seats. Manufacturers can reduce isocyanate use immediately. Operating costsaving in isocyanate and CFCs used. Avoid using CFC for flushing/cleaningsystem.
References UNEP 1991.Greenhouse gases CFC-11Indirect impacts None.Quantity of source 9 producersGreenhouse gas quantity na per unit (kg/a) 579 Total (t/a)
Capital cost of action $0 (1990$)/unitOperating cost of action $0 (1990$)/unit/a
Operating benefits n/aLifetime of action 20 yearsDelay in reduction 1 yearsLevel of effectiveness 67%Implementation schedule 2004
Effect on greenhouse gases
Reduction (t/a)CFC-11388
Total net cost of action
Capitalcost(1990$)
Operating cost(1990$/a)
Operatingbenefits(1990$/a)
Annual net cost(1990$/a)
$0 $0 $0 $0Discount rate Private Social
6.00% 3.00%
97

Action summary information sheet
Sources affected Flexible foams Action code Flex3Action Product substitutesType of action Alternative cushioning.Description Use currently available materials such as rubber and synthetic fibrefill instead
of CFC.Comments Applicable to furniture and bedding uses of slabstock.References UNEP 1991; Stevenson Kellogg Ernst & Young 1990.Greenhouse gases CFC-11Indirect impacts Eliminates ODP. Reduces stock of natural resources.
Quantity of source na tonnesGreenhouse gasquantity na per unit (kg/a) 579 Total (t/a)
Capital cost of action $0 (1990$)/unitOperating cost ofaction $0 (1990$)/unit/a
Operating benefits n/aLifetime of action 20 years Delay in reduction 1 yearsLevel of effectiveness 4%Implementation schedule 2004
Effect on greenhouse gases
Reduction (t/a)CFC-1123
Total net cost of action
Capital cost(1990$)
Operating cost(1990$/a)
Operatingbenefits(1990$/a)
Annual netcost(1990$/a)
$0 $0 $0 $0Discount rate Private Social
6.00% 3.00%
98
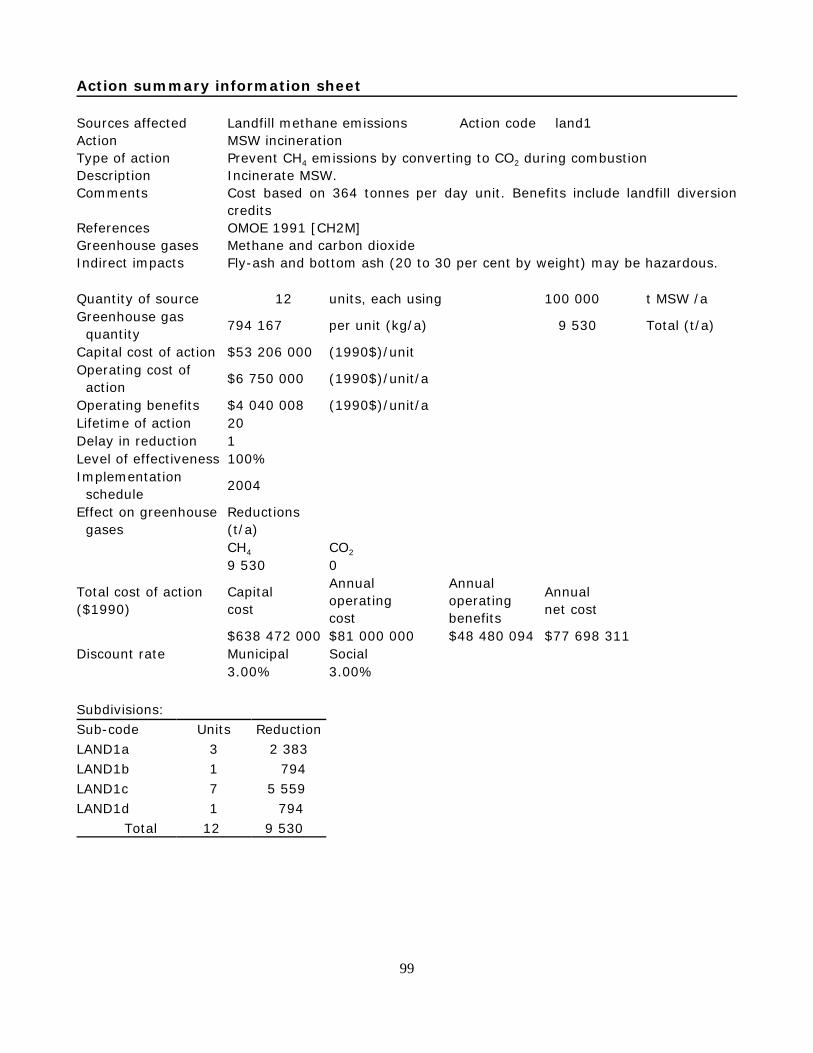
Action summary information sheet
Sources affected Landfill methane emissions Action code land1Action MSW incinerationType of action Prevent CH4 emissions by converting to CO2 during combustionDescription Incinerate MSW.Comments Cost based on 364 tonnes per day unit. Benefits include landfill diversion
creditsReferences OMOE 1991 [CH2M]Greenhouse gases Methane and carbon dioxideIndirect impacts Fly-ash and bottom ash (20 to 30 per cent by weight) may be hazardous.
Quantity of source 12 units, each using 100 000 t MSW /aGreenhouse gas quantity 794 167 per unit (kg/a) 9 530 Total (t/a)
Capital cost of action $53 206 000 (1990$)/unitOperating cost of action $6 750 000 (1990$)/unit/a
Operating benefits $4 040 008 (1990$)/unit/aLifetime of action 20Delay in reduction 1Level of effectiveness 100%Implementation schedule 2004
Effect on greenhouse gases
Reductions(t/a)CH4 CO2
9 530 0
Total cost of action($1990)
Capital cost
Annualoperatingcost
Annualoperatingbenefits
Annual net cost
$638 472 000 $81 000 000 $48 480 094 $77 698 311Discount rate Municipal Social
3.00% 3.00%
Subdivisions:Sub-code Units ReductionLAND1a 3 2 383LAND1b 1 794LAND1c 7 5 559 LAND1d 1 794
Total 12 9 530
99

Action summary information sheet
Sources affected Landfill methane emissions Action code land3Action MSW incinerationType of action Prevent CH4 emissions by converting to CO2 during combustionDescription Incinerate MSW.Comments Cost based on 3000 tonnes per day unit. Benefits include landfill diversion
creditsReferences OMOE 1991 [CH2M]Greenhouse gases Methane and carbon dioxideIndirect impacts Fly-ash and bottom ash (20 to 30 per cent by weight) may be hazardous.
Quantity of source 8 units, each using 500 000 t MSW /aGreenhouse gasquantity 4 189 000 per unit (kg/a) 29 323 Total (t/a)
Capital cost of action $299 250 000 (1990$)/unitOperating cost of action $21 750 000 (1990$)/unit/a
Operating benefits $20 200 039 (1990$)/unit/aLifetime of action 20Delay in reduction 1Level of effectiveness 100%Implementation schedule 2004
Effect on greenhouse gases Reductions (t/a)
CH4 CO2
29 323 0
Total cost of action($1990)
Capital cost
Annual operating cost
Annualoperatingbenefits
Annual net cost
$2 094 750 000 $152 250 000 $141 400 274 $156 199 325Discount rate Municipal Social
3.00% 3.00%
100

Action summary information sheet
Sources affected Landfill methane emissions Action code land4Action Household yard and food waste compostingType of action Divert DOCs to household compostersDescription Individual household scale composting of yard and foodwasteComments 3,328,716 eligible householdsReferences VHB and ERL, 1992 [383, p. A-171Greenhouse gases Methane and carbon dioxideIndirect impacts Provides soil enhancer, qualifies for landfill diversion credit
Quantity of source 3,328,716 units 0.36 t/a DOC-M SWGreenhouse gas quantity 12.35 per unit (kg/a) 41 093 Total (t/a)
Capital cost of action 572 (1990$)/unitOperating cost of action $0 (1990$)/unit/a
Operating benefits $18 (1990$)/unit/aLifetime of action 10Delay in reduction 1Level of effectiveness 100%Implementation schedule 2004
Effect on greenhouse gases Reductions (t/a)
CH4 CO2
41 093 0
Total cost of action($1990)
Capital cost
Annualoperatingcost
Annualoperatingbenefits
Annual net cost
$239 667 552 $0 $60 444 157 ($33 318 242)Discount rate Municipal Social
3.00% 3.00%
101
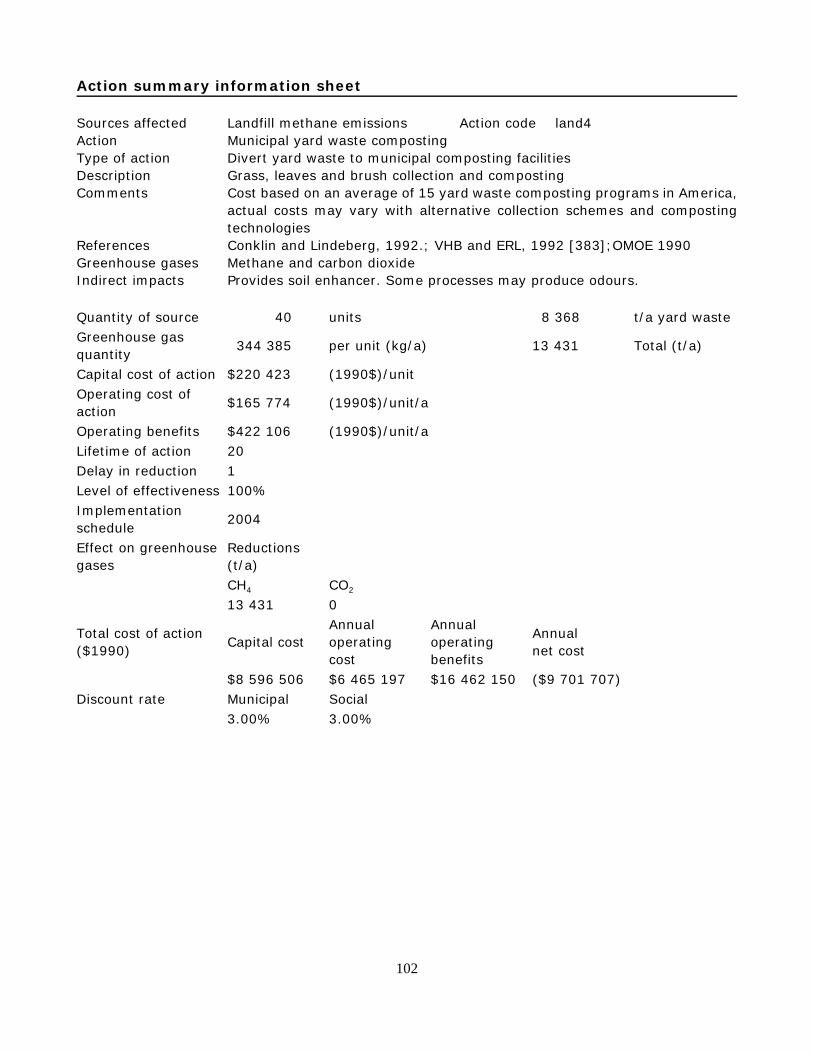
Action summary information sheet
Sources affected Landfill methane emissions Action code land4Action Municipal yard waste compostingType of action Divert yard waste to municipal composting facilitiesDescription Grass, leaves and brush collection and compostingComments Cost based on an average of 15 yard waste composting programs in America,
actual costs may vary with alternative collection schemes and compostingtechnologies
References Conklin and Lindeberg, 1992.; VHB and ERL, 1992 [383];OMOE 1990Greenhouse gases Methane and carbon dioxideIndirect impacts Provides soil enhancer. Some processes may produce odours.
Quantity of source 40 units 8 368 t/a yard wasteGreenhouse gasquantity 344 385 per unit (kg/a) 13 431 Total (t/a)
Capital cost of action $220 423 (1990$)/unitOperating cost ofaction $165 774 (1990$)/unit/a
Operating benefits $422 106 (1990$)/unit/aLifetime of action 20Delay in reduction 1Level of effectiveness 100%Implementationschedule 2004
Effect on greenhousegases
Reductions(t/a)CH4 CO2
13 431 0
Total cost of action($1990) Capital cost
Annualoperatingcost
Annualoperatingbenefits
Annual net cost
$8 596 506 $6 465 197 $16 462 150 ($9 701 707)Discount rate Municipal Social
3.00% 3.00%
102

Action summary information sheet
Sources affected Landfill methane emissions Action code land6Action Municipal DOC compostingType of action Divert food and yard waste to municipal compostersDescription Wet/dry material recovery facility with organic waste compostingComments Cost based on two-stream wet/dry system including organic waste processing
and composting proposed in GuelphReferences VHB and ERL, 1992 [383]; OMOE 1990Greenhouse gases Methane and carbon dioxideIndirect impacts Provides soil enhancer. Some processes may produce odours.
Quantity of source 20 units 44 000 t/a OW-MSWGreenhouse gas quantity 1 736 600 per unit (kg/a) 34 732 Total (t/a)
Capital cost of action $13 999 762 (1990$)/unitOperating cost of action $1 559 716 (1990$)/unit/a
Operating benefits $2 219 360 (1990$)/unit/aLifetime of action 25Delay in reduction 1Level of effectiveness 100%Implementation schedule 2004
Effect on greenhouse gases Reductions (t/a)
CH4 CO2
34 732 0
Total cost of action ($1990)
Capital cost
Annualoperating cost
Annualoperatingbenefits
Annual net cost
$279 995 237 $31 194 323 $44 387 200 $2 973 253Discount rate Municipal Social
3.00% 3.00%
103

Action summary information sheet
Sources affected Landfill methane emissions Action code land13Action MSW incinerationType of action Prevent CH4 emissions by converting to CO2 during combustionDescription Incinerate MSW.Comments Cost based on 364 tonnes per day unit. Benefits include landfill diversion
creditsReferences OMOE 1991 [CH2M]Greenhouse gases Methane and carbon dioxideIndirect impacts Fly-ash and bottom ash (20 to 30 per cent by weight) may be hazardous.
Quantity of source 12 units, each using 100 000 t MSW /aGreenhouse gas quantity 3 129 500 per unit (kg/a) 37 554 Total (t/a)
Capital cost of action $53 206 000 (1990$)/unitOperating cost of action $6 750 000 (1990$)/unit/a
Operating benefits $4 040 008 (1990$)/unit/aLifetime of action 20Delay in reduction 10Level of effectiveness 100%Implementation schedule 1995
Effect on greenhouse gases Reductions (t/a)
CH4 CO2
37 554 0
Total cost of action ($1990)
Capital cost
Annualoperatingcost
Annualoperatingbenefits
Annual net cost
$638 472 000 $81 000 000 $48 480 094 $101 378 673Discount rate Municipal Social
3.00% 3.00%
104

Action summary information sheet
Sources affected Landfill methane emissions Action code land14Action MSW incinerationType of action Prevent CH4 emissions by converting to CO2 during combustionDescription Incinerate MSW.Comments Cost based on 660 tonnes per day unit. Benefits include landfill diversion
creditsReferences OMOE 1991 [CH2M]Greenhouse gases Methane and carbon dioxideIndirect impacts Fly-ash and bottom ash (20 to 30 per cent by weight) may be hazardous.
Quantity of source 0 units, each using 250 000 t MSW /aGreenhouse gas quantity 0 per unit (kg/a) 0 Total (t/a)
Capital cost of action $93 190 000 (1990$)/unitOperating cost of action $15 875 000 (1990$)/unit/a
Operating benefits $10 100 020 (1990$)/unit/aLifetime of action 20Delay in reduction 10Level of effectiveness 100%Implementation schedule 1995
Effect on greenhouse gases
Reductions(t/a)CH4 CO2
0 0
Total cost of action ($1990) Capital cost
Annualoperatingcost
Annualoperatingbenefits
Annual net cost
$0 $0 $0 $0Discount rate Municipal Social
3.00% 3.00%
105

Action summary information sheet
Sources affected Landfill methane emissions Action code land15Action MSW incinerationType of action Prevent CH4 emissions by converting to CO2 during combustionDescription Incinerate MSW.Comments Cost based on 3000 tonnes per day unit. Benefits include landfill diversion
creditsReferences OMOE 1991 [CH2M)Greenhouse gases Methane and carbon dioxideIndirect impacts Fly-ash and bottom ash (20 to 30 per cent by weight) may be hazardous.
Quantity of source 8 units, each using 500 000 t MSW /aGreenhouse gasquantity 16 507 143 per unit (kg/a) 132 057 Total (t/a)
Capital cost of action $299 250 000 (1990$)/unitOperating cost ofaction $21 750 000 (1990$)/unit/a
Operating benefits $20 200 039 (1990$)/unit/aLifetime of action 20Delay in reduction 10Level of 100%effectivenessImplementationschedule 1995
Effect on greenhousegases Reductions (t/a)
CH4 CO2
132 057 0
Total cost of action($1990)
Capital cost
Annual operating cost
Annualoperatingbenefits
Annual net cost
$2 394 000 000 $174 000 000 $161 600 312 $232 919 650Discount rate Municipal Social
3.00% 3.00%
106

Action summary information sheet
Sources affected Landfill methane emissions Action code land16Action Household yard and food waste compostingType of action Divert DOCs to household compostersDescription Individual household scale composting of yard and foodwasteComments 3,328,716 eligible householdsReferences VHB and ERL, 1992 [383, p. A-17)Greenhouse gases Methane and carbon dioxideIndirect impacts Provides soil enhancer, qualifies for landfill diversion credit
Quantity of source 3 328 716 units 0.36 t/a DOC-MSWGreenhouse gas quantity 48.65 per unit (kg/a) 161 928 Total (t/a)Capital cost of action $72 (1990$)/unitOperating cost of action $0 (1990$)/unit/aOperating benefits $18 (1990$)/unit/aLifetime of action 10Delay in reduction 10Level of effectiveness 100%Implementation schedule 1995Effect on greenhouse gases
Reductions (t/a)
CH4 CO2161 928 0
Total cost of action Capital cost
Annual Annual Annual net ($1990) operating cost operating cost
benefits$239 667 552 $0 $60 444 157 ($43 472 749)
Discount rate Municipal Social3.00% 3.00%
107

Action summary information sheet
Sources affected Landfill methane emissions Action code Land17Action Municipal yard waste compostingType of action Divert yard waste to municipal composting facilitiesDescription Grass, leaves and brush collection and compostingComments Cost based on an average of 15 yard waste composting programs in America,
actual costs may vary with alternative collection schemes and compostingtechnologies
References Conklin and Lindeberg, 1992; VHB and ERL, 1992 [383];OMOE 1990Greenhouse gases Methane and carbon dioxideIndirect impacts Provides soil enhancer. Some processes may produce odours.
Quantity of source 40 units 8 368 t/a yardwasteGreenhouse gas quantity 1 357 051 per unit (kg/a) 52 925 Total (t/a)
Capital cost of action $220 423 (1990$)/unitOperating cost of action $165 774 (1990$)/unit/a
Operating benefits $422 106 (1990$)/unit/aLifetime of action 20Delay in reduction 10Level of effectiveness 100%Implementation schedule 1995
Effect on greenhouse gases Reductions (t/a)
CH4 CO2
52 925 0
Total cost of action ($1990)
Capital cost
Annualoperatingcost
Annualoperatingbenefits
Annual net cost
$8 596 506 $6 465 197 $16 462 150 ($12 658 527)Discount rate Municipal Social
3.00% 3.00%
108
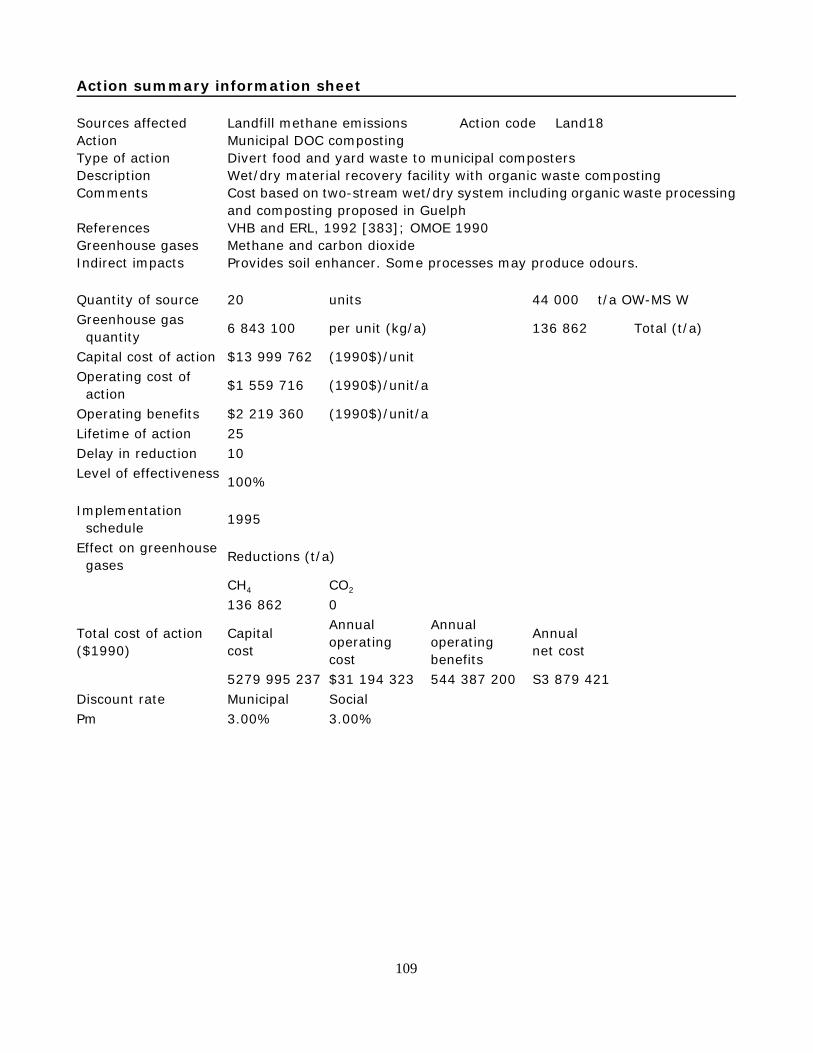
Action summary information sheet
Sources affected Landfill methane emissions Action code Land18Action Municipal DOC compostingType of action Divert food and yard waste to municipal compostersDescription Wet/dry material recovery facility with organic waste compostingComments Cost based on two-stream wet/dry system including organic waste processing
and composting proposed in GuelphReferences VHB and ERL, 1992 [383]; OMOE 1990Greenhouse gases Methane and carbon dioxideIndirect impacts Provides soil enhancer. Some processes may produce odours.
Quantity of source 20 units 44 000 t/a OW-MS WGreenhouse gas quantity 6 843 100 per unit (kg/a) 136 862 Total (t/a)
Capital cost of action $13 999 762 (1990$)/unitOperating cost of action $1 559 716 (1990$)/unit/a
Operating benefits $2 219 360 (1990$)/unit/aLifetime of action 25Delay in reduction 10Level of effectiveness 100%
Implementation schedule 1995
Effect on greenhouse gases Reductions (t/a)
CH4 CO2
136 862 0
Total cost of action($1990)
Capital cost
Annualoperating cost
Annualoperatingbenefits
Annual net cost
5279 995 237 $31 194 323 544 387 200 S3 879 421Discount rate Municipal SocialPm 3.00% 3.00%
109

Action summary information sheet
Sources affected Landfill methane emissions Action code LFG2Action Collect and flare landfill gasType of action Collect landfill gasDescription Install gas collection system and gas burner flare systemComments Cost based on new landfill cost with conservative assumptions .References VHB, 1991 [381].Greenhouse gases Methane and carbon dioxideIndirect impacts
Quantity of source 4 units, each receiving 2 500 t MSW /aGreenhouse gas quantity 96 794 per unit (kg/a) 387 Total (t/a)
Capital cost of action $246 855.97 (1990$)/unitOperating cost of action $11 900.00 (1990$)/unit/a
Operating benefits $0 (1990$)/unit/aLifetime of action 20Delay in reduction 1Level of effectiveness 50% of 8 unitsImplementation schedule 2004
Effect on greenhouse gases Reductions (t/a)
CH4 CO2
387 0
Total cost of action($1990)
Capital cost
Annualoperatingcost
Annualoperatingbenefits
Annual net cost
$987 424 $47 600 $0 $117 390Discount rate Municipal Social
3.00% 3.00%
110

Action summary information sheet
Sources affected Landfill methane emissions Action code LFG3Action Collect and flare landfill gasType of action Collect landfill gasDescription Install gas collection system and gas burner flare systemComments Cost based on new landfill cost with conservative assumptions .References VHB, 1991 [381).Greenhouse gases Methane and carbon dioxideIndirect impacts
Quantity of source 8 units, each receiving 5 000 t MSW /aGreenhouse gas quantity 193 588 per unit (kg/a) 1 549 Total (t/a)
Capital cost of action $290 254.18 (1990$)/unitOperating cost of action $11 900.00 (1990$)/unit/a
Operating benefits $0 (1990$)/unit/aLifetime of action 20Delay in reduction 1Level of effectiveness 50% of 16 unitsImplementation schedule 2004
Effect on greenhouse gases Reduction (t/a)
CH4 CO2
1549 0
Total cost of action($1990)
Capital cost
Annualoperating cost
Annualoperatingbenefits
Annual net cost
$2 322 033 $95 200 $0 $258 815Discount rate Municipal Social
3.00% 3.00%
111
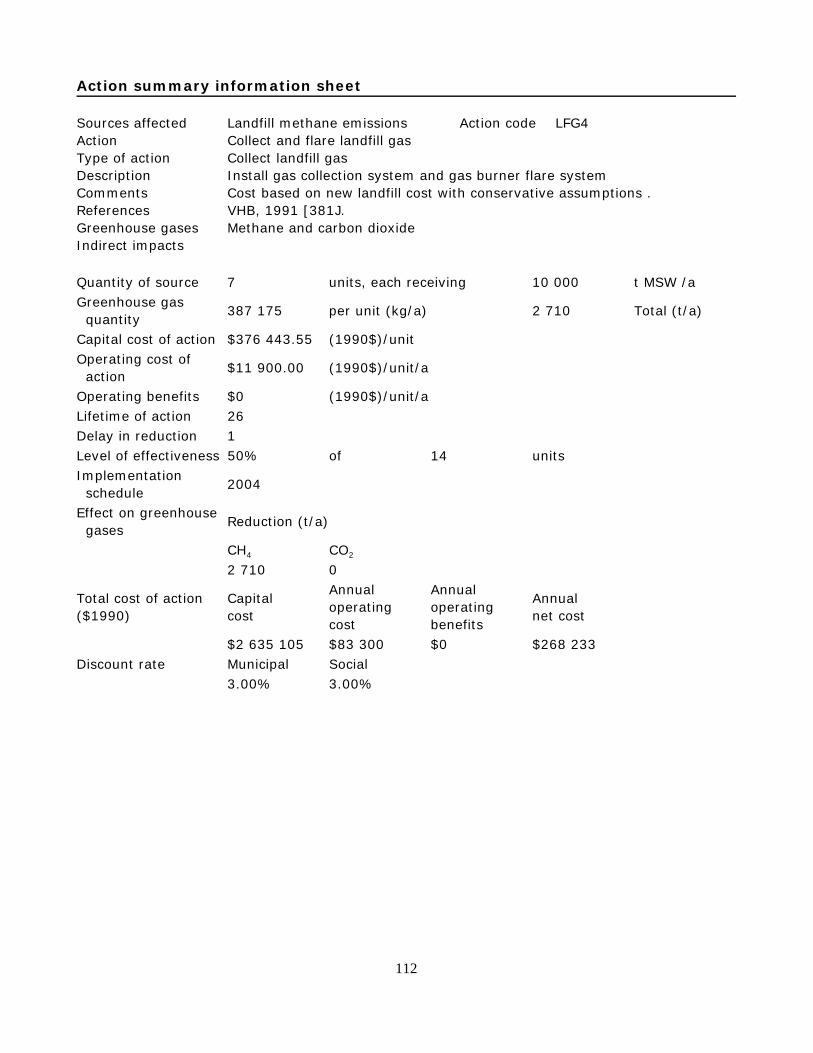
Action summary information sheet
Sources affected Landfill methane emissions Action code LFG4Action Collect and flare landfill gasType of action Collect landfill gasDescription Install gas collection system and gas burner flare systemComments Cost based on new landfill cost with conservative assumptions .References VHB, 1991 [381J.Greenhouse gases Methane and carbon dioxideIndirect impacts
Quantity of source 7 units, each receiving 10 000 t MSW /aGreenhouse gas quantity 387 175 per unit (kg/a) 2 710 Total (t/a)
Capital cost of action $376 443.55 (1990$)/unitOperating cost of action $11 900.00 (1990$)/unit/a
Operating benefits $0 (1990$)/unit/aLifetime of action 26Delay in reduction 1Level of effectiveness 50% of 14 unitsImplementation schedule 2004
Effect on greenhouse gases Reduction (t/a)
CH4 CO2
2 710 0
Total cost of action($1990)
Capital cost
Annualoperatingcost
Annualoperatingbenefits
Annual net cost
$2 635 105 $83 300 $0 $268 233Discount rate Municipal Social
3.00% 3.00%
112
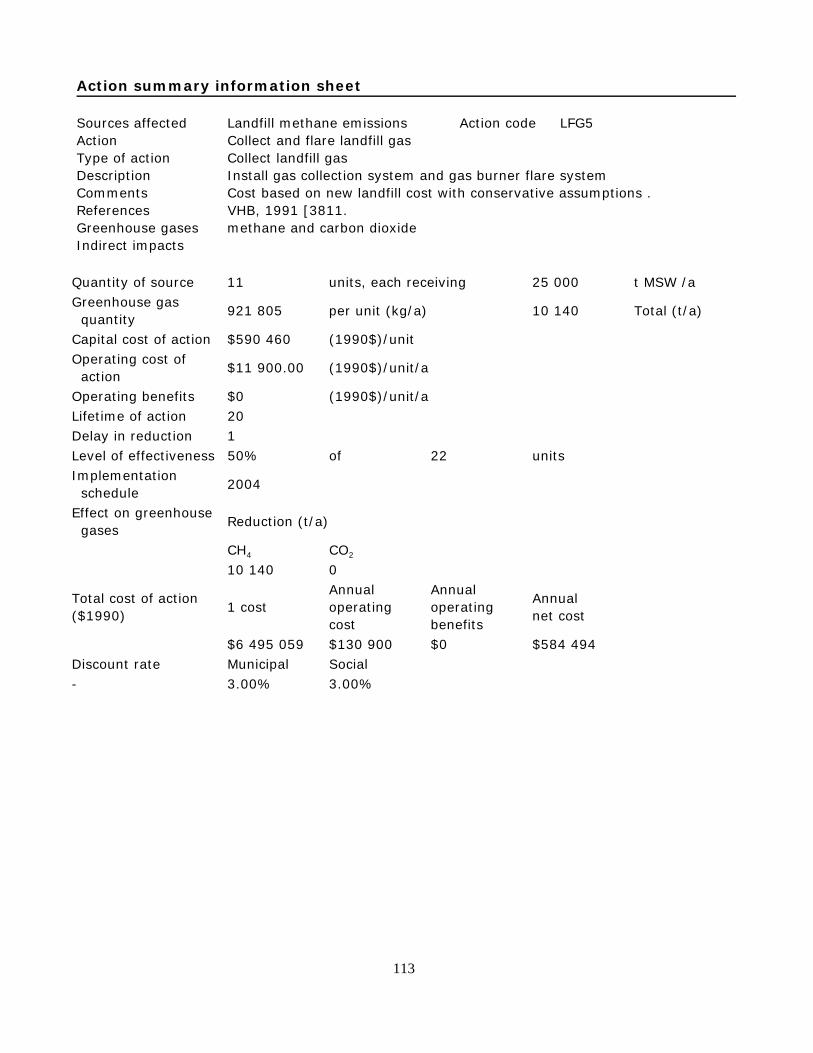
Action summary information sheet
Sources affected Landfill methane emissions Action code LFG5Action Collect and flare landfill gasType of action Collect landfill gasDescription Install gas collection system and gas burner flare systemComments Cost based on new landfill cost with conservative assumptions .References VHB, 1991 [3811.Greenhouse gases methane and carbon dioxideIndirect impacts
Quantity of source 11 units, each receiving 25 000 t MSW /aGreenhouse gas quantity 921 805 per unit (kg/a) 10 140 Total (t/a)
Capital cost of action $590 460 (1990$)/unitOperating cost of action $11 900.00 (1990$)/unit/a
Operating benefits $0 (1990$)/unit/aLifetime of action 20Delay in reduction 1Level of effectiveness 50% of 22 unitsImplementation schedule 2004
Effect on greenhouse gases Reduction (t/a)
CH4 CO2
10 140 0
Total cost of action($1990) 1 cost
Annualoperating cost
Annualoperatingbenefits
Annual net cost
$6 495 059 $130 900 $0 $584 494Discount rate Municipal Social- 3.00% 3.00%
113

Action summary information sheet
Sources affected Landfill methane emissions Action code LFG6Action Collect and flare landfill gasType of action Collect landfill gasDescription Install gas collection system and gas burner flare systemComments Cost based on new landfill cost with conservative assumptions .References VHB, 1991 [381].Greenhouse gases methane and carbon dioxideIndirect impacts
Quantity of source 2 units, each using 50 000 t MSW /aGreenhouse gas quantity 1 935 790 per unit (kg/a) 3 872 Total (t/a)
Capital cost of action $907 040 (1990$)/unitOperating cost of action $11 900 (1990$)/unit/a
Operating benefits $0 (1990$)/unit/aLifetime of action 20Delay in reduction 1Level of effectiveness 20% of 10 unitsImplementation schedule 2004
Effect on greenhouse gases Reduction (t/a)
CH4 CO2
3 872 0
Total cost of action($1990)
Capital cost
Annualoperatingcost
Annualoperatingbenefits
Annual net cost
$1 814 079 $23 800 $0 $150 107Discount rate Municipal Social
3.00% 3.00%
114

Action summary information sheet
Sources affected Landfill methane emissions Action code LFG7Action Collect and flare landfill gasType of action Collect landfill gasDescription Install gas collection system and gas burner flare systemComments Cost based on new landfill cost with conservative assumptions .References VHB, 1991 [381].Greenhouse gases methane and carbon dioxideIndirect impacts
Quantity of source 1 units, each using 100 000 t MSW /aGreenhouse gas quantity 3 871 538 per unit (kg/a) 2 323 Total (t/a)
Capital cost of action $1 426 306 (1990$)/unit .Operating cost of action $13 040 (1990$)/unit/a
Operating benefits $0 (1990$)/unit/aLifetime of action 20Delay in reduction 1Level of effectiveness 15% of 4 unitsImplementation schedule 2004
Effect on greenhouse gases Reduction (t/a)
CH4 CO2
2323 0
Total cost of action ($1990)
Capital cost
Annualoperatingcost
Annualoperatingbenefits
Annual net cost
$855 784 $7 824 $0 $67 306Discount rate Municipal Social
3.00% 3.00%
115

Action summary information sheet
Sources affected Landfill methane emissions Action code LFG8Action Collect and flare landfill gasType of action Collect landfill gasDescription Install gas collection system and gas burner flare systemComments Cost based on new landfill cost with conservative assumptions .References VHB, 1991 13811.Greenhouse gases methane and carbon dioxideIndirect impacts
Quantity of source 1 units, each using 150 000 t MSW /aGreenhouse gas quantity 5 807 342 per unit (kg/a) 3 484 Total (t/a)
Capital cost of action $2 183 482 (1990$)/unitOperating cost of action $14 180 (1990$)/unit/a
Operating benefits $0 (1990$)/unit/aLifetime of action 20Delay in reduction 1Level of effectiveness 10% of 6 unitsImplementation schedule 2004
Effect on greenhouse gases Reduction (t/a)
CH4 CO2
3 484 0
Total cost of action($1990)
Capital cost
Annualoperatingcost
Annualoperatingbenefits
Annual net cost
$1 310 089 $8 508 $0 $99 464Discount rate Municipal Social
3.00% 3.00%
116

Action summary information sheet
Sources affected Landfill methane emissions Action code LFG10Action Collect and flare landfill gasType of action Collect landfill gasDescription Install gas collection system and gas burner flare systemComments Cost based on new landfill cost with conservative assumptions .References VHB, 1991 [3811.Greenhouse gases methane and carbon dioxideIndirect impacts
Quantity of source 1 units, each using 500 000 t MSW /aGreenhouse gas quantity 19 357 688 per unit (kg/a) 15 486 Total (t/a)
Capital cost of action $5 470 780 (1990$)/unitOperating cost of action $21 400 (1990$)/unit/a
Operating benefits $0 (1990$)/unit/aLifetime of action 20Delay in reduction 1Level of effectiveness 10% of 8 unitsImplementation schedule 2004
Effect on greenhouse gases Reductions (t/a)
CH4 CO2
15 486 0
Total cost of action($1990)
Capital cost
Annualoperatingcost
Annualoperatingbenefits
Annual net cost
$4 376 624 $17 120 $0 $320 637Discount rate Municipal Socialhim 3.00% 3.00%
117

Action summary information sheet
Sources affected Landfill methane emissions Action code LFG11Action Recover landfill gas for energyType of action Collect landfill gasDescription Install gas collection system and gas-fired thermal generatorComments Cost based on new landfill cost with conservative assumptions. Benefits include
sale of generated electricity.References VHB, 1991 [381].Greenhouse gases Methane and carbon dioxideIndirect impacts Offsets thermal generation for secondary ghg reductions
Quantity of source 4 units, each using 2 500 t MSW /aGreenhouse gas quantity 96 794 per unit (kg/a) 387 Total (t/a)
Capital cost of action $365 310 (1990$)/unitOperating cost of action $21 771 (1990$)/unit/a
Operating benefits $36 433 (1990$)/unit/aLifetime of action 20Delay in reduction 1Level of effectiveness 50% of 8 unitsImplementation schedule 2004
Effect on greenhouse gases Reductions (t/a)
CH4 CO2
387 0
Total cost of action($1990)
Capital cost
Annualoperatingcost
Annualoperatingbenefits
Annual net cost
$1 4.61 241 $87 085 $145 733 $40 757Discount rate Municipal Social
3.00% 3.00%
118

Action summary information sheet
Sources affected Landfill methane emissions Action code LFG12Action Recover landfill gas for energy .Type of action Collect landfill gasDescription Install gas collection system and gas-fired thermal generatorComments Cost based on new landfill cost with conservative assumptions. Benefits include
sale of generated electricity.References VHB, 1991 [381].Greenhouse gases methane and carbon dioxideIndirect impacts Offsets thermal generation for secondary ghg reductions
Quantity of source 8 units, each using 5 000 t MSW /aGreenhouse gas quantity 258 117 per unit (kg/a) 2 065 Total (t/a)
Capital cost of action $527 163 (1990$)/unitOperating cost of action $31 642 (1990$)/unit/a
Operating benefits $72 867 (1990$)/unit/aLifetime of action 20Delay in reduction 1Level of effectiveness 50% of 16 unitsImplementation schedule 2004
Effect on greenhouse gases Reductions (t/a)
CH4 CO2
2 065 0
Total cost of action(51990)
Capital cost
Annualoperatingcost
Annualoperatingbenefits
Annual net cost
$4 217 300 $253 139 $582 934 ($47 716)Discount rate Municipal Social
3.00% 3.00%
119
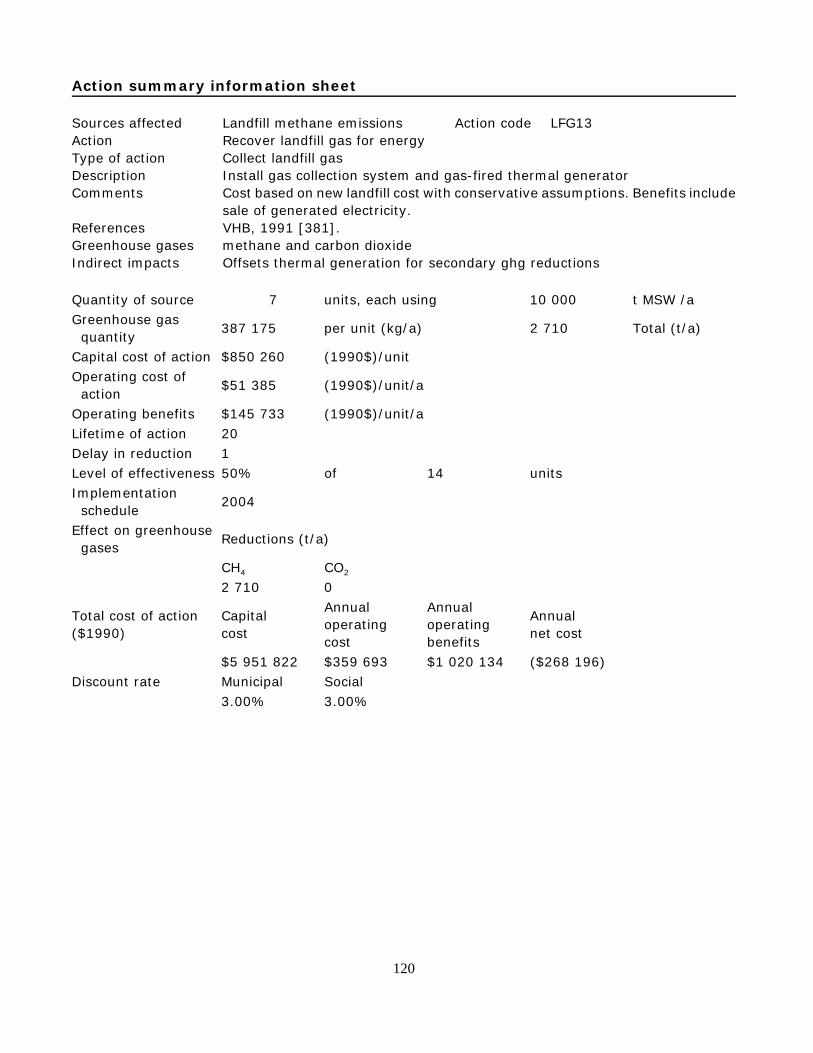
Action summary information sheet
Sources affected Landfill methane emissions Action code LFG13Action Recover landfill gas for energyType of action Collect landfill gasDescription Install gas collection system and gas-fired thermal generatorComments Cost based on new landfill cost with conservative assumptions. Benefits include
sale of generated electricity.References VHB, 1991 [381].Greenhouse gases methane and carbon dioxideIndirect impacts Offsets thermal generation for secondary ghg reductions
Quantity of source 7 units, each using 10 000 t MSW /aGreenhouse gas quantity 387 175 per unit (kg/a) 2 710 Total (t/a)
Capital cost of action $850 260 (1990$)/unitOperating cost of action $51 385 (1990$)/unit/a
Operating benefits $145 733 (1990$)/unit/aLifetime of action 20Delay in reduction 1Level of effectiveness 50% of 14 unitsImplementation schedule 2004
Effect on greenhouse gases Reductions (t/a)
CH4 CO2
2 710 0
Total cost of action($1990)
Capital cost
Annualoperatingcost
Annualoperatingbenefits
Annual net cost
$5 951 822 $359 693 $1 020 134 ($268 196)Discount rate Municipal Social
3.00% 3.00%
120

Action summary information sheet
Sources affected Landfill methane emissions Action code LFG14Action Recover landfill gas for energyType of action Collect landfill gasDescription Install gas collection system and gas-fired thermal generatorComments Cost based on new landfill cost with conservative assumptions. Benefits include
sale of generated electricity.References VHB, 1991 [381].Greenhouse gases methane and carbon dioxideIndirect impacts Offsets thermal generation for secondary ghg reductions
Quantity of source 11 units, each using 25 000 t MSW /aGreenhouse gas quantity 921 805 per unit (kg/a) 10 140 Total (t/a)
Capital cost of action 775 002 (1990$)/unitOperating cost ofaction $110 612 (1990$)/unit/a
Operating benefits $364 333 (1990$)/unit/aLifetime of action 20Delay in reduction 1Level of effectiveness 50% of 22 unitsImplementation schedule 2004
Effect on greenhouse gases Reductions (t/a)
CH4 CO2
10 140 0
Total cost of action($1990)
Capital cost
Annualoperatingcost
Annualoperatingbenefits
Annual net cost
$19 525 020 $1 216 730 $4 007 668 ($1 522 907)Discount rate Municipal Social
3.00% 3.00%
121

Action summary information sheet
Sources affected Landfill methane emissions Action code LFG15Action Recover landfill gas for energyType of action Collect landfill gasDescription Install gas collection system and gas-fired thermal generatorComments Cost based on new landfill cost with conservative assumptions . Benefits
include sale of generated electricity.References VHB, 1991 13811.Greenhouse gases methane and carbon dioxideIndirect impacts Offsets thermal generation for secondary ghg reductions
Quantity of source 8 units, each using 50 000 t MSW /aGreenhouse gas quantity 1 935 790 per unit (kg/a) 15 486 Total (t/a)
Capital cost of action $3 276 123 (1990$)/unitOperating cost of action $209 324 (1990$)/unit/a
Operating benefits $728 667 (1990$)/unit/aLifetime of action 20Delay in reduction 1Level of effectiveness 80% of 10 unitsImplementation schedule 2004
Effect on greenhouse gases Reductions (t/a)
CH4 CO2
15 486 0
Total cost of action($1990)
Capital cost
Annualoperatingcost
Annualoperatingbenefits
Annual net cost
$26 208 987 $1 674 589 $5 829 336 ($2 464 884)Discount rate Municipal Social
3.00% 3.00%
122

Action summary information sheet
Sources affected Landfill methane emissions Action code LFG16Action Recover landfill gas for energyType of action Collect landfill gasDescription Install gas collection system and gas-fired thermal generatorComments Cost based on new landfill cost with conservative assumptions. Benefits include
sale of generated electricity.References VHB, 1991 13811.Greenhouse gases methane and carbon dioxideIndirect impacts Offsets thermal generation for secondary ghg reductions
Quantity of source 3 units, each using 100 000 t MSW /aGreenhouse gas quantity 3 871 538 per unit (kg/a) 13 163 Total (t/a)
Capital cost of action $6 164 474 (1990$)/unitOperating cost of action $407 887 (1990$)/unit/a
Operating benefits $1 457 334 (1990$)/unit/aLifetime of action 20Delay in reduction 1Level of effectiveness 85% of 4 unitsImplementation schedule 2004
Effect on greenhouse gases Reductions (t/a)
CH4 CO2
13 163 0
Total cost of action($1990)
Capital cost
Annualoperatingcost
Annualoperatingbenefits
Annual net cost
$20 959 211 $1 386 817 $4 954 936 ($2 224 110)Discount rate Municipal Social
3.00% 3.00%
123

Action summary information sheet
Sources affected Landfill methane emissions Action code LFG17Action Recover landfill gas for energyType of action Collect landfill gasDescription Install gas collection system and gas-fired thermal generatorComments Cost based on new landfill cost with conservative assumptions. Benefits include
sale of generated electricity.References VHB, 1991 [3811.Greenhouse gases methane and carbon dioxideIndirect impacts Offsets thermal generation for secondary ghg reductions
Quantity of source 5 units, each using 150 000 t MSW /aGreenhouse gas quantity 5 807 342 per unit (kg/a) 31 360 Total (t/a)
Capital cost of action $9 290 733 (1990$)/unitOperating cost of action $606 451 (1990$)/unit/a
Operating benefits $2 186 001 (1990$)/unit/aLifetime of action 20Delay in reduction 1Level of effectiveness 90% of 6 unitsImplementation schedule 2004
Effect on greenhouse gases Reductions (t/a)
CH4 CO2
31 360 0
Total cost of action($1990)
Capital cost
Annualoperatingcost
Annualoperatingbenefits
Annual net cost
$50 169 960 $3 274 835 $11 804 405 ($5 312 082)Discount rate Municipal Social
3.00% 3.00%
124

Action summary information sheet
Sources affected Landfill methane emissions Action code LFG19Action Recover landfill gas for energyType of action Collect landfill gasDescription Install gas collection system and gas-fired thermal generatorComments Cost based on new landfill cost with conservative assumptions . Benefits
include sale of generated electricity.References VHB, 1991 [381].Greenhouse gases methane and carbon dioxideIndirect impacts Offsets thermal generation for secondary ghg reductions
Quantity of source 7 units, each using 500 000 t MSW /aGreenhouse gas quantity 19 357 688 per unit (kg/a) 139 375 Total (t/a)
Capital cost of action $29 161 618 (1990$)/unit 5117 per tonneOperating cost of action $1 995 636 (1990$)/unit/a per tonne
Operating benefits $7 286 670 (1990$)/unit/a $29 per tonneLifetime of action 20Delay in reduction 1Level of effectiveness 90% of 8 unitsImplementation schedule 2004
Effect on greenhouse gases
Reductions(t/a)CH4 CO2
139 375 0
Total cost of action($1990)
Capital cost
Annualoperating cost
Annualoperatingbenefits
Annual net cost
$209 963 650 $14 368 583 $52 464 023 ($24 702 063)Discount rate Municipal Social
3.00% 3.00%
125

Action summary information sheet
Sources affected Livestock methane emissions (1) Action code live1Action Treat dairy cattle with rBSTType of action Increase per animal milk yield and reduce herd size.Description Recombinant bovine somatotropin, used with good producing cows increases
milk productionComments Assuming provincial quotas, producer prices, levies and subsidies remain
unchanged, herd sizes are reduced, variable costs are reducedReferences Deloitte and Touche, 1990, and Agriculture Canada, 1990.Greenhouse gases MethaneIndirect impacts Reduces herd size, energy inputs and land use
Quantity of source 28 168 animals, if 5.60% reduction from 503 000Greenhouse gas quantity 58.47 per animal (kg/a) 1647.11 Total (t/a)
Capital cost of action $0.00 (1990$)/animalOperating cost of action ($1 016.69) (1990$)/animal/a applied total herd
Operating benefits $0.00 (1990$)/unit/aLifetime of action 1 yearsDelay in reduction 0 yearsLevel of effectiveness 100%Implementation schedule 2005
Effect on greenhouse gases
Reduction (t/a)CH4 CO2
1647 0 (t/a)
Total cost of actionCapital cost(1990$)
Annualoperating cost(1990$/a)
Annual operatingbenefits(1990$/a)
Annual net cost(1990$/a)
$0 ($1 017) $0 ($1 017)Discount rate Private Social
6.00% 3.00%
126

Action summary information sheet
Sources affected Methane from livestock manure Action code Live2Action Anaerobically digest manure and collect biogas for energyType of action Biogas collectionDescription Retrofitted manure handling, digester and generatorReferences Ralph G. Winfield, 1986, and NRC, 1982.Greenhouse gases Methane and carbon dioxideIndirect impacts Reduces odours and leachate from manure storage, biogas used for energy
Quantity of source 1 units, each produces 471.17 m3 CH4 /dGreenhouse gas quantity 123 273 per unit(kg/a) 123.27 Total (t/a)
Capital cost of action $258 690.18 (1990$)/unitOperating cost of action $15 328.43 (1990$)/unit/a
Operating benefits $10 572.83Lifetime of action 20 yearsDelay in reduction 0 yearsLevel of effectiveness 100%Implementation schedule 2005
Effect on greenhouse gases
Reduction (t/a)CO2 CH4
123 (322) (t/a)
Total cost of actionCapital cost(1990$)
Annualoperating cost(1990$/a)
Annualoperatingbenefits(1990$/a)
Annual net cost(1990$/a)
$258 690 $15 328 $10 573 $27 309Discount rate private Social
6.00% 3.00%
127

Action summary information sheet
Sources affected Methane from livestock manure Action code Live3Action Anaerobically digest manure, collect biogas for energy, single-cell protein for
dietary supplementType of action Biogas collection and protein recoveryDescription Retrofitted manure handling, digester and generator, protein centrifugeComments Single-cell protein recovery for animal feed supplement is experimentalReferences Ralph G. Winfield, 1986, and NRC, 1982.Greenhouse gases Methane and carbon dioxideIndirect impacts Reduces odours and leachate from manure storage, biogas used for energy
Quantity of source 1 units, each produces 471.17 m3 CH4 /dGreenhouse gas quantity 123 273 per unit (kg/a) 123.27 Total (t/a)
Capital cost of action $358 803.27 (1990$)/unitOperating cost of action $15 328.43 (1990$)/unit/a
Operating benefits $45 372.83 (1990$)/unit/aLifetime of action 20 yearsDelay in reduction 0 yearsLevel of effectiveness 100%Implementation schedule 2005
Effect on greenhouse gases
Reduction (t/a)CH4 CO2
123 (322) (t/a)
Total cost of actionCapital cost(1990$)
Annualoperating cost(1990$/a)
Annualoperatingbenefits(1990$/a)
Annual netcost (1990$/a)
$358 803 $15 328 $45 373 $1 238Discount rate Private Social
6.00% 3.00%
128

Action summary information sheet
Sources affected Livestock methane emissions Action code Live4Action Human diet changeType of action Substitute pork for beefDescription Pigs emit less CH4 per kilo of product than do cows.Comments Assuming provincial quotas, producer prices, levies and subsidies remain
unchanged, herd sizes are reduced, variable costs are reducedReferences OMAF, 1991. Ontario Pork Producers' Marketing Board, 1992.Greenhouse gases Methaneindirect impacts Requires
Quantity of source 1 000 000 units, each comprising 1 kg meatGreenhouse gas quantity 0.0768 per unit (kg/a) 76.80 Total (t/a)
Capital cost of action $0.00 (1990$)/unitOperating cost of action $0.65 (1990$)/unit/a
Operating benefits $0.00 (1990$)/unit/aLifetime of action 1 yearsDelay in reduction 0 yearsLevel of effectiveness 100%Implementation schedule 2005
Effect ongreenhouse gases
Reduction (t/a) CH4
77 (t/a)
Total cost of action Capital cost(1990$)
Annualoperating cost (1990$/a)
Annualoperatingbenefits (1990$)
Annual net cost(1990$/a)
$0 $653 340 $0 $653 340count rate Private Social
6.00% 3.00%
129

Action summary information sheet
Sources affected Mobile air conditioners Action code Mobile1Action Chemical substitutionType of action HFC-134aDescription Refrigerant for mobile air conditioners - new vehiclesComments New vehicles. Currently available. GWP 0.34 relative to CFC-11. Minor
modifications to cooling system required: lubricants and seals, otherwise adrop-in technology.
References Stevenson Kellogg Ernst & Young; ICF 1990; Hoffman 1990; UNEP 1989;Environment Canada 1989. Abt Associates 1989; UNEP 1991; Lashof andTirpak 1990.
Greenhouse gases CFC-12; HCFC-22 (some new vehicles only)Indirect impacts Eliminates ODP. 2% fuel use penalty.
Quantity of source 4 988 993 unitsGreenhouse gas 0.4 per unit (kg/a) 1 996 Total (t/a)Capital cost of action $115 (1990$)/vehicleOperating cost of action $49 (1990$)/vehicle/a
Operating benefits n/aLifetime of action 10 yearsDelay in reduction 10 yearsLevel of effectiveness 100.0%Implementation schedule 1995
Effect ongreenhouse gases
Reduction (t/a)CFC-12 HCFC-22 HFC-134a1996 na 1996
Total net cost of action
Capital cost(1990$)
Operating cost (1990$/a)
Operatingbenefits(1990$/a)
Annual netcost(1990$/a)
* Changes inoperating costexclude costsassociated withincreased fuelconsumption.
$571 638 825 $246 947 972 $0 $581 336 691
Discount rate Private Social6.00% 3.00%
130
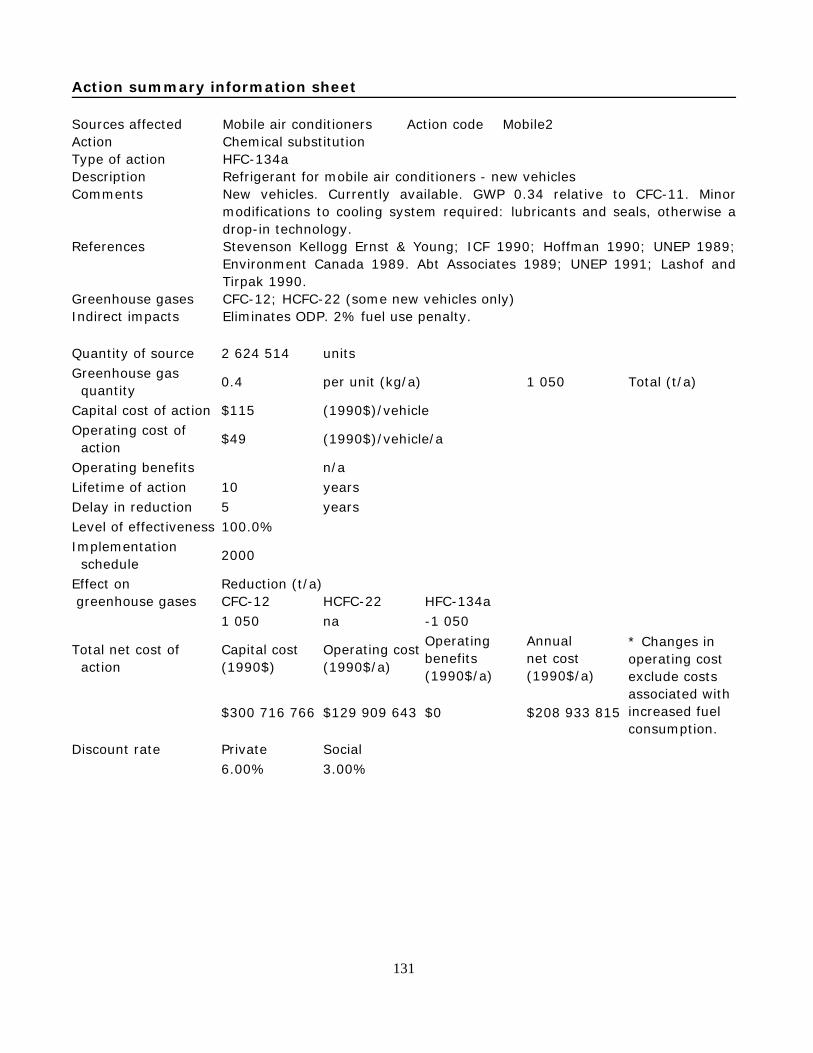
Action summary information sheet
Sources affected Mobile air conditioners Action code Mobile2Action Chemical substitutionType of action HFC-134aDescription Refrigerant for mobile air conditioners - new vehiclesComments New vehicles. Currently available. GWP 0.34 relative to CFC-11. Minor
modifications to cooling system required: lubricants and seals, otherwise adrop-in technology.
References Stevenson Kellogg Ernst & Young; ICF 1990; Hoffman 1990; UNEP 1989;Environment Canada 1989. Abt Associates 1989; UNEP 1991; Lashof andTirpak 1990.
Greenhouse gases CFC-12; HCFC-22 (some new vehicles only)Indirect impacts Eliminates ODP. 2% fuel use penalty.
Quantity of source 2 624 514 unitsGreenhouse gas quantity 0.4 per unit (kg/a) 1 050 Total (t/a)
Capital cost of action $115 (1990$)/vehicleOperating cost of action $49 (1990$)/vehicle/a
Operating benefits n/aLifetime of action 10 yearsDelay in reduction 5 yearsLevel of effectiveness 100.0%Implementation schedule 2000
Effect on greenhouse gases
Reduction (t/a)CFC-12 HCFC-22 HFC-134a1 050 na -1 050
Total net cost of action
Capital cost(1990$)
Operating cost(1990$/a)
Operatingbenefits(1990$/a)
Annual net cost(1990$/a)
* Changes inoperating costexclude costsassociated withincreased fuelconsumption.
$300 716 766 $129 909 643 $0 $208 933 815
Discount rate Private Social6.00% 3.00%
131

Action summary information sheet
Sources affected Mobile air conditioners Action code Mobile3Action Chemical substitutionType of action HFC-134aDescription Refrigerant for mobile air conditioners - new vehiclesComments New vehicles. Currently available. GWP 0.34 relative to CFC-1I. Minor
modifications to cooling system required: lubricants and seals, otherwise adrop-in technology.
References Stevenson Kellogg Ernst & Young; ICF 1990; Hoffman 1990; UNEp 1989;Environment Canada 1989. Abt Associates 1989; UNEP 1991; Lashof andTirpak 1990.
Greenhouse gases CFC-12; HCFC-22 (some new vehicles only)Indirect impacts Eliminates ODP. 2% fuel use penalty.
Quantity of source 530 616 unitsGreenhouse gas quantity 0.4 per unit (kg/a) 212 Total (t/a)
Capital cost of action $115 (1990$)/vehicleOperating cost of action $49 (1990$)/vehicle/a
Operating benefits n/aLifetime of action 10 yearsDelay in reduction 1 yearsLevel of effectiveness 100.0%Implementation schedule 2004
Effect on greenhouse gases
Reduction (t/a)CFC-12 HCFC-22 HFC-134a212 na 212
Total net cost of action
Capital cost(1990$)
Operatingcost(1990$/a)
Operatingbenefits(1990$/a)
Annual net cost(1990$/a)
* Changes inoperating costexclude costsassociated withincreased fuelconsumption.
$60 797 988 $26 264 731 $0 $36 596 743
Discount rate Private Social6.00% 3.00%
132

Action summary information sheet
Sources affected Mobile air conditioners Action code Mobile4Action Chemical substitutionType of action HFC-134aDescription Refrigerant for mobile air conditioners - retrofitted vehicles/ recovery and
disposal of CFC.Comments GWP 0.34 relative to CFC-11. Minor modifications to cooling system required:
lubricants and seals, otherwise a drop-in technology.References Stevenson Kellogg Ernst & Young; ICF 1990; Hoffman 1990; UNEP 1989;
Environment Canada 1989. Abt Associates 1989; UNEP 1991; Lashof andTirpak 1990.
Greenhouse gases CFC-12; HCFC-22 (some new vehicles only)Indirect impacts Eliminates ODP. 2% fuel use penalty.
Quantity of source 3 870 310 unitsGreenhouse gas quantity 0.4 per unit (kg/a) 1 548 Total (t/a)
Capital cost of action $436 (1990$)/vehicleRetrofit and repair cost,including incineration.Operating cost of
action $49 (1990$)/vehicle/a
Operating benefits n/aLifetime of action 10 yearsDelay in reduction 1 yearsLevel of effectiveness 100.0%Implementation schedule 2004
Effect on greenhouse gases
ReductionCFC-12
(tonnes)HCFC-22 HFC-134a
1548 na 1548
Total net cost of action
Capital cost(1990$)
Operating cost (1990$/a)
Operatingbenefits(1990$/a)
Annual netcost(1990$/a)
* Changes inoperating costexclude costsassociated withincreased fuelconsumption.
$1 687 430 441 $194 516 213 $0 $449 210 978
Discount rate Private Social6.00% 3.00%.
133
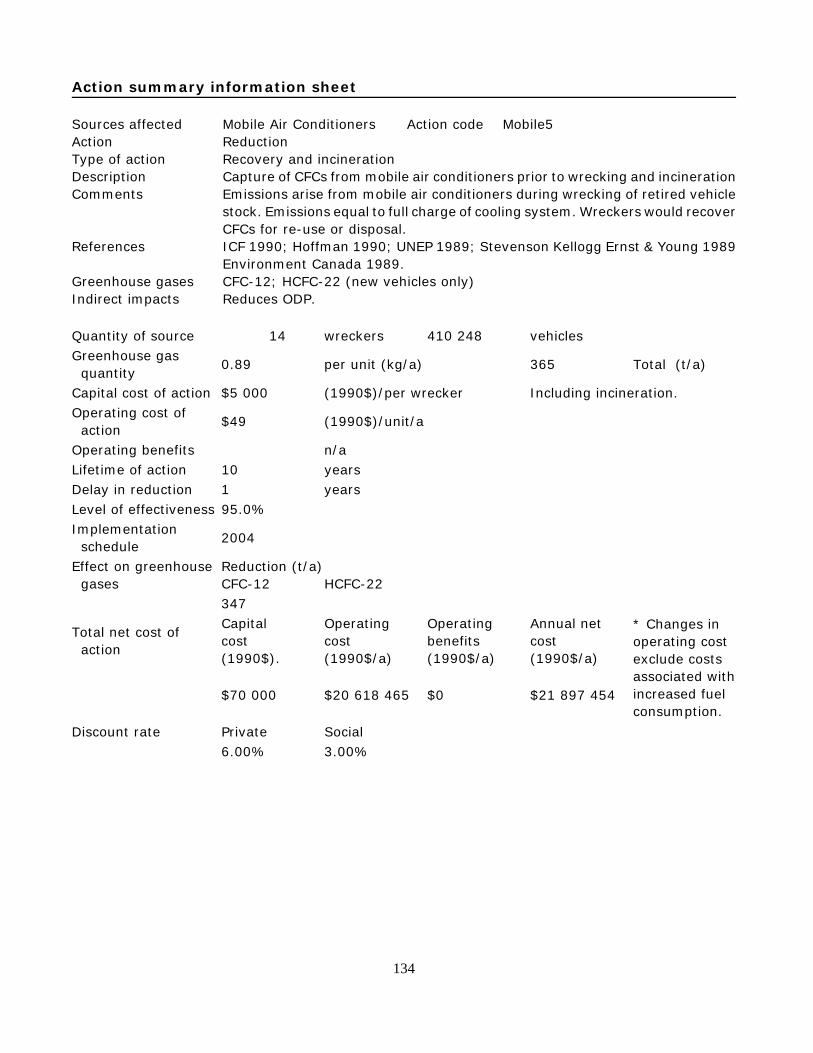
Action summary information sheet
Sources affected Mobile Air Conditioners Action code Mobile5Action ReductionType of action Recovery and incinerationDescription Capture of CFCs from mobile air conditioners prior to wrecking and incinerationComments Emissions arise from mobile air conditioners during wrecking of retired vehicle
stock. Emissions equal to full charge of cooling system. Wreckers would recoverCFCs for re-use or disposal.
References ICF 1990; Hoffman 1990; UNEP 1989; Stevenson Kellogg Ernst & Young 1989Environment Canada 1989.
Greenhouse gases CFC-12; HCFC-22 (new vehicles only)Indirect impacts Reduces ODP.
Quantity of source 14 wreckers 410 248 vehiclesGreenhouse gas quantity 0.89 per unit (kg/a) 365 Total (t/a)
Capital cost of action $5 000 (1990$)/per wrecker Including incineration.Operating cost of action $49 (1990$)/unit/a
Operating benefits n/aLifetime of action 10 yearsDelay in reduction 1 yearsLevel of effectiveness 95.0%Implementation schedule 2004
Effect on greenhouse gases
Reduction (t/a)CFC-12 HCFC-22347
Total net cost of action
Capital cost(1990$).
Operating cost(1990$/a)
Operatingbenefits(1990$/a)
Annual netcost(1990$/a)
* Changes inoperating costexclude costsassociated withincreased fuelconsumption.
$70 000 $20 618 465 $0 $21 897 454
Discount rate Private Social6.00% 3.00%
134

Action summary information sheet
Sources affected Mobile Air Conditioners Action code Mobile6Action ReductionType of action Recovery and incineration/eliminate mobile air conditionersDescription Capture of CFCs from mobile air conditioners at the servicing level.Comments Emissions arise from mobile air conditioners annually, about 0.4 kg/vehicle/a.References ICF 1990; Hoffman 1990; UNEP 1989; Stevenson Kellogg Ernst & Young 1989;
Environment Canada 1989.Greenhouse gases CFC-I2; HCFC-22 (some new vehicles only)Indirect impacts Reduces ODP and vehicle energy use.
Quantity of source 486Air conditioningservicing stationsand garages
3 870 310 vehicles
Greenhouse gas quantity 0.4 per unit (kg/a) 1 548 Total (t/a)
Capital cost of action $5 000 (1990$/service station Including incineration.Operating cost of action $49 (1990$)/vehicle/a
Operating benefits n/aLifetime of action 10 yearsDelay in reduction 1 yearsLevel of effectiveness 95.0%Implementation schedule 2004
Effect on greenhouse gases
Reduction (t/a)
CFC-121 471
Total net cost of action
Capital cost(1990$
Operating cost (1990$/a)
Operatingbenefits(1990$/a)
Annual net cost(1990$/a)
* Changes inoperating costexclude costsincreased increased fuelconsumption.
$2 430 000$206 537 154 $0 $206 537 154
Discount rate Private Social6.00% 3.00%
135
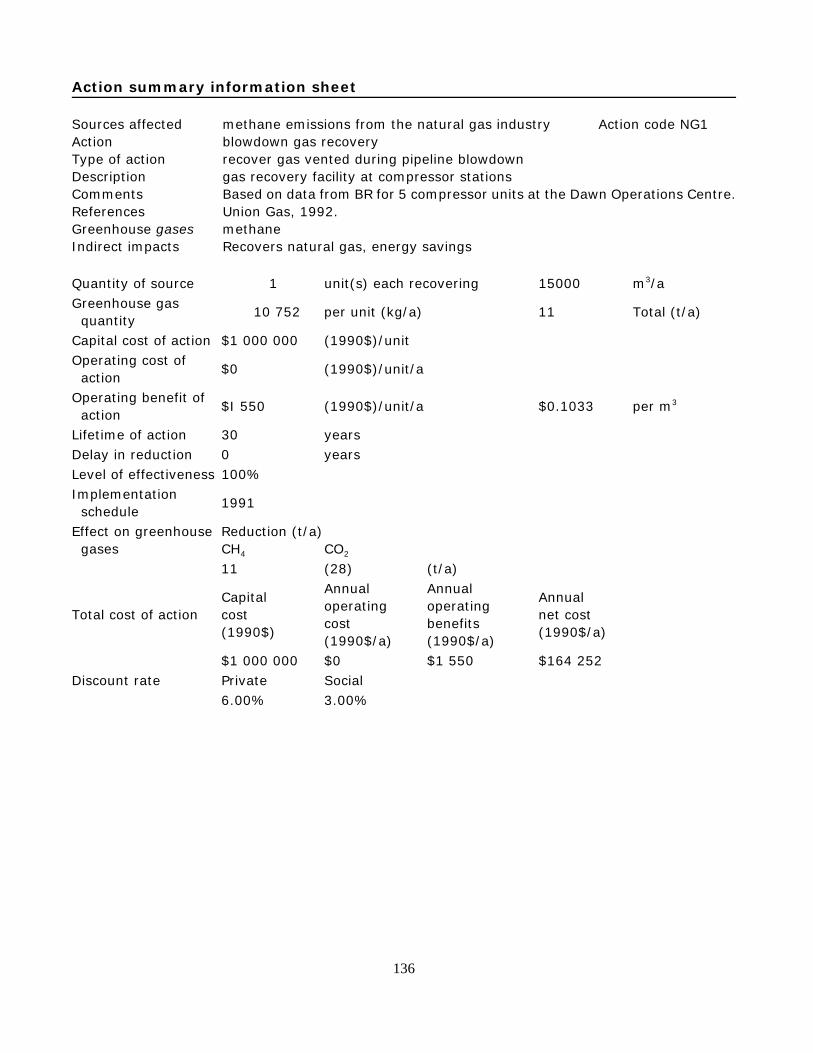
Action summary information sheet
Sources affected methane emissions from the natural gas industry Action code NG1Action blowdown gas recoveryType of action recover gas vented during pipeline blowdownDescription gas recovery facility at compressor stationsComments Based on data from BR for 5 compressor units at the Dawn Operations Centre.References Union Gas, 1992.Greenhouse gases methaneIndirect impacts Recovers natural gas, energy savings
Quantity of source 1 unit(s) each recovering 15000 m3/aGreenhouse gas quantity 10 752 per unit (kg/a) 11 Total (t/a)
Capital cost of action $1 000 000 (1990$)/unitOperating cost of action $0 (1990$)/unit/a
Operating benefit of action $I 550 (1990$)/unit/a $0.1033 per m3
Lifetime of action 30 yearsDelay in reduction 0 yearsLevel of effectiveness 100%Implementation schedule 1991
Effect on greenhouse gases
Reduction (t/a)CH4 CO2
11 (28) (t/a)
Total cost of actionCapital cost(1990$)
Annualoperating cost (1990$/a)
Annualoperatingbenefits(1990$/a)
Annual net cost(1990$/a)
$1 000 000 $0 $1 550 $164 252Discount rate Private Social
6.00% 3.00%
136

Action summary information sheet
Sources affected Rigid foams Action code Rigid1Action ReductionType of action Reduce amount of CFC-11 used in manufacturing polyurethane foams.Description Reduce CFC-11 as an auxiliary blowing agent from 13 to 6.5 per cent.Comments Already in use. Short term solution. Applicable for all rigid foam production.References Stevenson Kellogg Ernst & Whinney 1989; Lashof and Tirpak 1990;
Environment Canada 1989; UNEP 1991.Greenhouse gases CFC-11Indirect impacts None.
Quantity of source 7 185 tonnesGreenhouse gas quantity na per unit (kg/a) 323 Total (t/a)
Capital cost of action $0 (1990$)/unitOperating cost of action $0 (1990$)/unit/a
Operating benefits n/aLifetime of action 20 yearDelay in reduction 1 yearLevel of effectiveness 50.0%Implementation schedule 2004
Effect on greenhouse gases
Reduction (t/a)CFC-11162
Total net cost of action
Capital cost (1990$)
Operating cost(1990$/a)
Operatingbenefits(1990$/a)
Annual netcost(1990$/a)
$0 $0 $0 $0Discount rate Private Social
6.00% 3.00%
137

Action summary information sheet
Sources affected Rigid foams Action code Rigid2Action ReductionType of action Reduce amount of CFC-1I used in manufacturing polyurethane foams.Description Reduce CFC-11 as an auxiliary blowing agent from 13 to 6.5 per cent.Comments Already in use. Short term solution. Applicable for all rigid foam production.References Stevenson Kellogg Ernst & Whinney 1989; Lashof and Tirpak 1990;
Environment Canada 1989; UNEP 1991.Greenhouse gases CFC-11Indirect impacts None.
Quantity of source 7 185 tonnesGreenhouse gas quantity na per unit (kg/a) 1 617 Total (t/a)
Capital cost of action $0 (1990$)/unitOperating cost of action $0 (1990$)/unit/a
Operating benefits n/aLifetime of action 20 yearDelay in reduction 5 yearLevel of effectiveness 50.0%Implementation schedule 2000
Effect on greenhouse gases
Reduction (t/a)CFC-11808
Total net cost of action
Capital cost(1990$)
Operating cost(1990$/a)
Operatingbenefits(1990$/a)
Annual net cost(1990$/a)
$0 $0 $0 $0Discount rate Private Social
6.00% 3.00%
138

Action summary information sheet
Sources affected Rigid foams Action code Rigid3Action ReductionType of action Reduce amount of CFC-11 used in manufacturing polyurethane foams.Description Reduce CFC-11 as an auxiliary blowing agent from 13 to 6.5 per cent.Comments Already in use. Short term solution. Applicable for all rigid foam production.References Stevenson Kellogg Ernst & Whinney 1989; Lashof and Tirpak 1990;
Environment Canada 1989; UNEP 1991.
Greenhouse gases CFC-11Indirect impacts NoneQuantity of source 7 185 tonnesGreenhouse gas quantity na per unit (kg/a) 3 233 Total (t/a)
Capital cost of action $0 (1990$)/unitOperating cost of action $0 (1990$)/unit/a
Operating benefits n/aLifetime of action 20 yearDelay in reduction 10 yearLevel of effectiveness 50.0%Implementation schedule 1995
Effect on greenhouse gases
Reduction (t/a)CFC-111 617
Total net cost of action
Capital cost(1990$)
Operatingcost(1990$/a)
Operatingbenefits(1990$/a)
Annual net cost(1990$/a)
$0 $0 $0 $0Discount rate Private Social
6.00% 3.00%
139

Action summary information sheet
Sources affected Rigid foams Action code Rigid4Action Chemical substitutionType of action HCFC-123Description Rigid polyurethane insulating foams. Drop-in alternative. No capital investment
expected. Operating costa will increase 10 to 20 per cent resulting fromincreased cost of HCFC-123. As HCFC-123 becomes more readily available inthe future,
Comments Increases in operating costa are expected to be minimal. Most rigidpolyurethane foam is imported into Canada. Some R&D costs expected.Commercial use depends on outcome of toxicity tests.
References Abt Associates 1989; Bach and lain 1990; Environment Canada 1989;Stevenson Kellogg Ernst & Young 1989; Jeffs, Rosebotham and Thomas 1990;Jeffs and Sparrow 1990; Cunningham, Rosebotham and Sparrow 1990; Lashofand Tirpak 1990; UNEP 1991.
Greenhouse gases CFC-11 and CFC-12Indirect impacts Reduces ODP.
Quantity of source 7 185 tonnes of foam insulationGreenhouse gas quantity 45 per unit (kg/a) 323 Total (t/a)
Capital cost of action $110 000 (1990$)/unitOperating cost of action $0.00 (1990$)/unit/a
Operating benefits n/aLifetime of action 20 yearsDelay in reduction 1 yearsLevel of effectiveness 100.0%Implementation schedule 2004
Effect on greenhouse gases
Reduction (t/a)CFC-11 HCFC-123323 323
Total net cost of action
Capital cost (1990$)
Operating cost(1990$/a)
Operatingbenefits(1990$/a)
Annual net cost(1990$/a)
$110 000 $0 $0 $10 166Discount rate Private Social
6.00% 3.00%
140

Action summary information sheet
Sources affected Rigid foams Action code Rigid5Action Chemical substitutionType of action HCFC-123Description Rigid polyurethane insulating foams. Drop-in alternative. No capital investment
expected. Operating costs will increase 10 to 20 per cent resulting fromincreased cost of HCFC-123. As HCFC-123 becomes more readily available inthe future,
Comments Increases in operating costs are expected to be minimal. Most rigidpolyurethane foam is imported into Canada. Some R&D costa expected.Commercial use depends on outcome of toxicity tests.
References Abt Associates 1989; Bach and Jain 1990; Environment Canada 1989;Stevenson Kellogg Ernst & Young 1989; Jeffs, Rosebotham and Thomas 1990;Jeffs and Sparrow 1990; Cunningham, Rosebotham and Sparrow 1990; Lashofand Tirpak 1990; UNEP 1991.
Greenhouse gases CFC-H and CFC-12Indirect impacts Reduces ODP.
Quantity of source 7 185 tonnes of foam insulationGreenhouse gas quantity 225 per unit (kg/a) 1 617 Total (t/a)
Capital cost of action $110 000 (1990$)/unitOperating cost of action $0.00 (1990$)/unit/a
Operating benefits n/aLifetime of action 20 yearsDelay in reduction 5 yearsLevel of effectiveness 100.0%Implementation schedule 2000
Effect on greenhousegases
Reduction (t/a)CFC-H HCFC-1231617 1617
Total net cost ofaction
Capital cost(1990$)
Operating cost(1990$/a)
Operatingbenefits(1990$/a)
Annual net cost(1990$/a)
$110 000 $0 $0 $12 834Discount rate Private Social
6.00% 3.00%
141

Action summary information sheet
Sources affected Rigid foams Action code Rigid6Action Chemical substitutionType of action HCFC-123Description Rigid polyurethane insulating foams. Drop-in alternative. No capital investment
expected. Operating coats will increase 10 to 20 per cent resulting fromincreased cost of HCFC-123. As HCFC-123 becomes more readily available inthe future,
Comments Increases in operating costs are expected to be minimal. Most rigidpolyurethane foam is imported into Canada. Some R&D costs expected.Commercial use depends on outcome of toxicity teats.
References Abt Associates 1989; Bach and Jain 1990; Environment Canada 1989;Stevenson Kellog Ernst & Young 1989; Jeffs, Rosebotham and Thomas 1990;Jeffs and Sparrow 1990; Cunningham, Rosebotham and Sparrow 1990; Lashofand Tirpak 1990; UNEP 1991.
Greenhouse gases CFC-11 and CFC-12Indirect impacts Reduces ODP.
Quantity of source 7 185 insulation tonnes of foam insulation
Greenhouse gas quantity 675 per unit (kg/a) 4 850 Total (t/a)
Capital cost of action $110 000 (19905)/unit
Operating cost ofaction $0.00 (1990$)/unit/a
Operating benefits n/a
Lifetime of action 20 years
Delay in reduction 15 years
Level of effectiveness 100.0%
Implementation schedule 1995
Effect on greenhouse gases
Reduction (t/a)CFC-11 HCFC-123
4 850 4 850
Total net cost of action
Capital cost(1990$)
Operating cost (1990$/a)
Operatingbenefits(1990$/a)
Annual net cost(1990$/a)
$110 000 $0 $0 $22 984
Discount rate Private Social
6.00% 3.00%
142
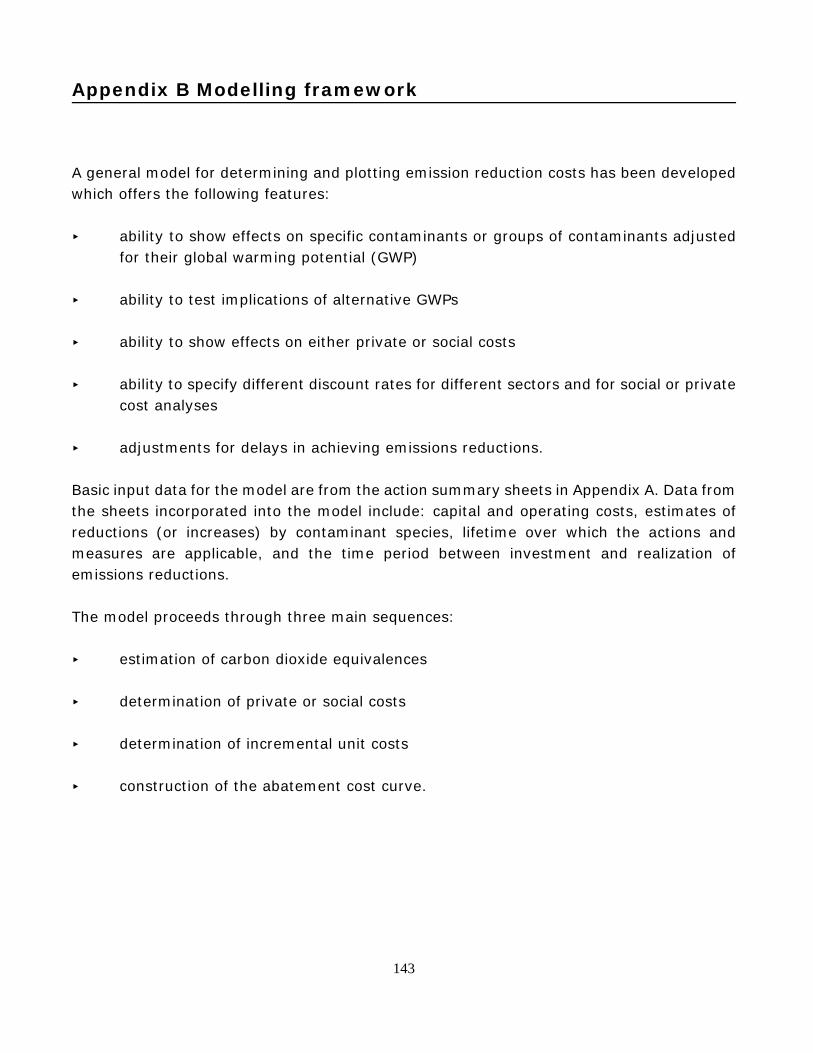
Appendix B Modelling framework
A general model for determining and plotting emission reduction costs has been developedwhich offers the following features:
< ability to show effects on specific contaminants or groups of contaminants adjustedfor their global warming potential (GWP)
< ability to test implications of alternative GWPs
< ability to show effects on either private or social costs
< ability to specify different discount rates for different sectors and for social or privatecost analyses
< adjustments for delays in achieving emissions reductions.
Basic input data for the model are from the action summary sheets in Appendix A. Data fromthe sheets incorporated into the model include: capital and operating costs, estimates ofreductions (or increases) by contaminant species, lifetime over which the actions andmeasures are applicable, and the time period between investment and realization ofemissions reductions.
The model proceeds through three main sequences:
< estimation of carbon dioxide equivalences
< determination of private or social costs
< determination of incremental unit costs
< construction of the abatement cost curve.
143

Each of these steps is described below, and sample calculations are presented.
B.1 Estimation of carbon dioxide equivalence
The format for estimating carbon dioxide equivalences is presented in Table B-1. Somemeasures will result in increases in emissions of some greenhouse gases. For example,substituting HFCs for CFCs will reduce some greenhouse gas emissions (e.g. CFC-12) but willincrease others (e.g. HFC-134a). The effect of different GWPs can be readily assessed, andthe effects of actions or measures on individual compounds can be assessed by setting GWPsto zero for all compounds except those of interest.
Table B-1. Framework for estimating carbon dioxide equivalences.
CO2 CH4 N2O CFC- 11 CFC- 12 HCFC-13 HCFC-22Global warmingpotential(relative to CO2)
1 21 290 3500 7300 1200 1500
Reduction Carbonequivalent
t/aAction/ Levelmeasure
CO2 t/a
CH4 t/a
N2O t/a
CFC- 11t/a
CFC-12t/a
HFC-134at/a
HCFC-22t/a
MOBILE1 1 0 0 0 0 1996 -1996 0 12 175 600MOBILE2 2 0 0 0 0 1050 -1050 0 6 405 000MOBILE3 3 0 0 0 0 212 - 212 0 I 293 200
SOURCE: Global warming potentials (carbon equidioxide valences) of compounds are from IPCC1990.
NOTE: Data are from Appendix A for the indicated actions which correspond to different yearsof introducing HCFCs or HFCs into air conditioners in new vehicles.Carbon dioxide equivalences of actions are the sum of the product of the quantity andthe GWP.Data represent reductions in emissions in year 2005.
144

B.2 Estimation of private or social costs
The model provides for the possibility of estimating private, public and social costs. Privatecosts are the costs borne by private actors to reduce their emissions. These may includecapital expenditures, operating and maintenance costs. In addition, the costs seen by theprivate sector may be increased or decreased as a result of measures adopted. For example,a grant might be provided to offset part of the capital cost associated with investment inequipment that reduces greenhouse gas emissions.
Public costs include capital and operating costs that must be incurred to implement ameasure. These would include, for example, costs associated with inspectors to monitorcompliance with a regulation or to collect a tax. Where the measure involves a transfer offunds between the private and public sectors, the two must be equal. Thus the dollar valueof a subsidy given by the government decreases private costs and increases public costs byexactly the same amount.
Social costs are assumed to be the sum of private and public costs. Other social costs andbenefits (e.g. the value of environmental damage or repair) are not incorporated into theanalyses but are shown on the action and measure summary sheets.
Costs are calculated for the year 2005 by amortizing capital costs over the lifetime of theaction (or measure) and adding the operating costs. If there is a subsidy, it is subtractedwhen calculating private costs and added when calculating public costs. The discount rateused for annualizing capital costs is chosen depending on sectoral considerations, or whetherprivate or social costs are being calculated. The discount rates used real rates of three percent for the municipal sector and social cost estimates, and six per cent for the privatesector.
For some actions, implementation will have to occur in advance of 2005 in order to effectreductions in that year. For these actions, costs are increased to reflect the opportunity costof these funds between implementation and realized emissions reductions in 2005. Theoverall equations are as follows:
S = Pu + Pr
where: S is the social costs ($1990 dollars in 2005)Pu is the public costs ($1990 dollars in 2005) Pr is the private costs ($1990 dollars in 2005)
145
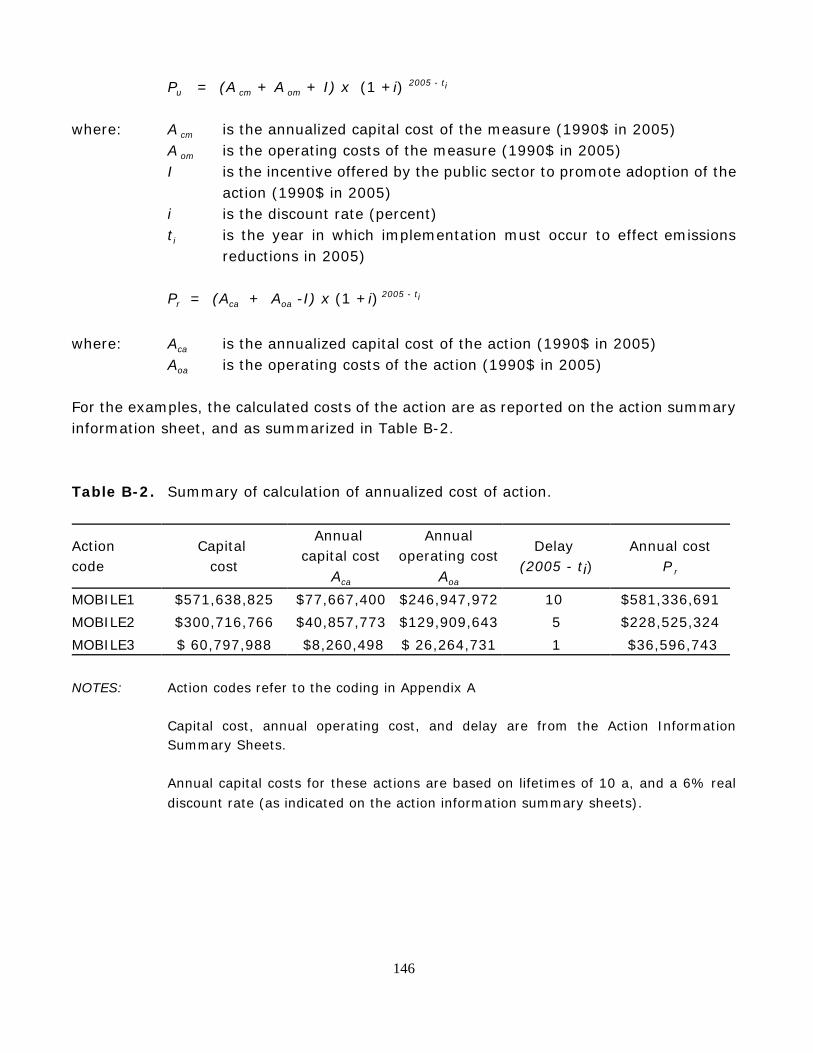
Pu = (A cm + A om + I) x (1 +i) 2005 - ti
where: A cm is the annualized capital cost of the measure (1990$ in 2005) A om is the operating costs of the measure (1990$ in 2005)I is the incentive offered by the public sector to promote adoption of the
action (1990$ in 2005)i is the discount rate (percent)ti is the year in which implementation must occur to effect emissions
reductions in 2005)
Pr = (Aca + Aoa -I) x (1 +i) 2005 - ti
where: Aca is the annualized capital cost of the action (1990$ in 2005)Aoa is the operating costs of the action (1990$ in 2005)
For the examples, the calculated costs of the action are as reported on the action summaryinformation sheet, and as summarized in Table B-2.
Table B-2. Summary of calculation of annualized cost of action.
Actioncode
Capital cost
Annual capital cost
Aca
Annualoperating cost
Aoa
Delay (2005 - ti)
Annual costP r
MOBILE1 $571,638,825 $77,667,400 $246,947,972 10 $581,336,691MOBILE2 $300,716,766 $40,857,773 $129,909,643 5 $228,525,324MOBILE3 $ 60,797,988 $8,260,498 $ 26,264,731 1 $36,596,743
NOTES: Action codes refer to the coding in Appendix A
Capital cost, annual operating cost, and delay are from the Action InformationSummary Sheets.
Annual capital costs for these actions are based on lifetimes of 10 a, and a 6% realdiscount rate (as indicated on the action information summary sheets).
146

B.3 Determination of incremental unit costs
For a number of emission sources, there may be multiple actions or multiple ways ofimplementation. Once annualized costs are calculated for each measure, incremental unitcosts are calculated. Before this can be done, it is necessary to determine whether the actionand measure combination applies uniquely to a particular emissions source. If it does, thenthe incremental unit cost is the same as the average cost, or total cost divided by totaltonnes.
In many cases, we have attempted to estimate cost for more than one action, or more thanone level of an action that apply to an individual emissions source. In these cases, it isnecessary to calculate the incremental unit costs as one steps from the action with the leastemissions reduction to the action with the greatest emissions reduction. For example, withrigid foams made using CFC-12, it is possible to cut CFC use in half with reduction measures,or a substitute blowing agent—HCFC-22—may be used. The first action will halve CFC use(and hence emissions), where as the second eliminates all CFC-12 use; the first action isfree, the second involves a modest equipment cost. Similarly, for some actions, includingchemical substitution of HCFCs it is possible to achieve greater reductions with earlierimplementation, but at a greater cost. The costs and incremental costs of such an exampleare indicated in Table B-3. 14
B.4 Construction of the abatement cost curve
The abatement cost curve is constructed by plotting the sorted incremental unit costs, (andthe average unit costs) against the cumulative reductions. Data from the action summaryinformation sheets in Appendix A, sorted in this way, are presented in Table 16, (page 77).
__________________14 In some cases, it was necessary to sub-divide some of the actions so that they could match
comparable actions. Specifically, landfill methane recovery costs vary with scale and theavailability of markets for energy recovered, as reflected in actions LFG2 through LFG19. Theother waste management actions were sub-divided to correspond to these different landfill gasrecovery situations. For example, the incineration action (LAND15) is made up of large scaleunits that are applicable in communities with large landfills. For estimating incremental costs,it was thus necessary to sub-divide LAND15 into LAND15a and LANDI5b that corresponds tothe large (500,000 t/a) landfills in LFG10 and LFG19 respectively. Actions LAND1 throughLAND6, LAND 13 and LAND15 through LAND 18 were sub-divided in a comparable way.
147

Table B-3. Example of estimating incremental unit costs where there are differentimplementation timetables.
Action code
Reductionkt-CE/a
CostM$/a
Incrementalreductionkt-CE/a
IncrementalcostM$/a
Incrementalunit cost$/t-CE
MOBILES 1,293 36.6 1,293 36.6 S28.30MOBILE2 6,405 208.9 5,112 a 172.3 b 533.71MOBILE! 12,176 581.3 5,771 372.4 564.53
NOTES: a The incremental reduction from implementing in 2000 rather than 2004 is (6405 - 1293 =)
5112 kt/a. The reduction is greater because more vehicles are affected.
b The incremental cost of implementing in 2000 rather than 2004 is ($208.9 - $36.6 =) 172.3M$/a, reflecting both the number of vehicles and interest costs on earlier vehicles. Theincremental unit cost is the incremental cost divided by the incremental reduction.
148

Appendix C Measures applicable to specific emission types
This appendix reviews the major sources of greenhouse gas emissions and the actions thatare applicable to them, and considers measures that might be applicable to them, based onthe general categories of measures and the criteria outlined in Section 7.2. The review ofmeasures is necessarily qualitative, and further research will be required to quantify thespecific costs and effects of identified measures.
C.1 CFC emissions
The most pressing environmental justification for reducing production and emissions of CFCsis to protect the stratospheric ozone layer as a filter of ultraviolet radiation. In this regard,the main additional concern introduced by global warming considerations is to ensure thatany substitutes for CFCs contribute minimally to global warming. Apart from this, themeasures for decreasing emissions of CFCs are the same for protection of the ozone layeror global warming.
Table C-1. Measures for CFCs.
Control factor Economic instruments Regulatory measures Information measuresEmissionsInputs ban and sunset uses research on alternativesOutputs deposit-refund systems
subsidize CFC recoveryprograms to encourageCFC recovery
Technology tax incentives forconversion to non-CFCtechnologies
upgrade technologystandards
R&D on improvedtechnologies
Operation performance bondsagainst major leaks
operating standardsrequire maintenance toavoid leaks/losses
industry consultations onmeans to reduce losses
Situation require specialmeasures in situationsvulnerable to spills/leaks
149

The long term solution for CFCs is to phase out their production and use, to be replacedwith substitutes with much less ozone-depleting and global warming potential. This is aprocess that is already well under way. The phasing out of CFC use in plastic foam is arelatively costless first step.
CFCs in use must also be recovered and recycled or destroyed. The destruction of the CFCswould be the preferable option, if there are less harmful substitutes at acceptable costs. Ingeneral, it would be very difficult to enforce a simple requirement that CFCs andCFC-containing materials and equipment should be returned for CFC destruction, becauseof the difficulty of monitoring disposal. This suggests that there must be no cost and possiblya refund for CFC recovery. In the case of CFCs already in use, this calls for a subsidy of CFCrecovery. In the case of CFCs to be produced and put into use before they are phased out,a deposit-refund system is a possible measure. It would likely be simpler, however, for asimple tax or charge to be applied to CFCs, and have the subsidy for the recovery of "new"CFCs the same as that for "old" CFCs.
For large-volume uses of CFCs (e.g. industrial refrigeration), it is likely to be more feasibleto monitor use, and therefore to require replacement and destruction of CFCs. At least, if itis possible to detect major leaks, performance bonds against such leaks may be a policyoption. Even in the race of large-volume uses, however, compliance would likely be betterensured if there was an incentive for CFC recovery and destruction, such as a deposit-refundor tax-subsidy system. These incentives could also include tax-based incentives to phase outCFCs, and materials and equipment that require them.
Although these economic instruments should address the main elements of a program torecover and destroy CFCs, they might also be supplemented by regulatory and informationmeasures.
C.1.1 Applicability
Of the principal proposed measures, subsidization of CFC recovery and destruction in thecase of those already in use would require a reliable means of auditing the quantitiesrecovered and destroyed. A deposit-refund or tax-subsidy system for "new" CFCs wouldpresent the additional complication of having to collect (at either the wholesale or retaillevel) the deposit or tax on CFCs in equipment or materials that are manufactured orimported into the jurisdiction. Requirement of a substantial deposit or tax may promptpurchasers of such equipment or materials to attempt to evade the deposit by importingthem from outside the jurisdiction. If. this is the case, compliance might be more reliably andefficiently ensured by instituting the deposit-refund or tax-subsidy system at the national,rather than provincial level, because of the greater capacity on the part of the federal tax
150

and excise system to collect the deposit on both domestic products and imports.
C.1.2 Effectiveness
The effectiveness of the measures will depend on how many uses of CFCs they can beefficiently applied to, and the degree of compliance for each of these uses.
C.1.3 Efficiency
It should be possible to implement measures to phase out the uses of CFCs in plastic foamsat relatively small administrative cost by voluntary industry compliance, and possiblyinformation measures aimed at industry to secure compliance and at consumers toencourage purchase of non-CFC products. Developments in these areas are already takingplace at the federal and provincial levels.
The efficiency of the measures will depend on the costs of administering and implementingCFC recovery and destruction, whether with a tax-subsidy or deposit-refund system. It wouldgenerally be more efficient to apply a uniform subsidization system for CFC recovery,whether or not a "tax" is also imposed on new CFCs. The tax would also contribute toefficiency by discouraging dispersive uses of CFCs. Such a tax is also likely to be generallyacceptable, especially if its proceeds are allocated to CFC recovery or reduction.
The effect of administrative costs on the overall costs of measures can be illustrated by thecase of recovery and destruction of CFCs prior to disposal of a motor vehicle (MOBILES). Thismeasure would need to be applied to only an estimated 14 wrecking yards in Ontario. Theadministrative costs of this measure could include:
< initial costs of requiring wrecking yards to install CFC recovery equipment,< initial and ongoing costs of training wrecking yard personnel to recover CFCs,< costs of monitoring performance.
Of these costs, the last is likely to predominate. Assume that these administrative functionscould be performed by a government staff of at most 4 people with appropriate office supportat a cost of roughly $400,000 per annum. These administrative costs would addapproximately 2% to the incremental unit cost of the action of $8.64 per tonne to give anincremental unit cost of the measure of $8.81 per tonne. Therefore, the ranking of thismeasure should not be affected by these administrative costs, because the incremental unitcost of the next action (LFG8) is $9.49 per tonne.
151

C.1.4 Equity
In general, the subsidization of CFC recovery and destruction is contrary to the polluter paysprinciple. Nevertheless, considering that most people in Canada have benefitted from CFCuse, at least in refrigeration, the equity aspect of the polluter pays principle should not beviolated substantially by the subsidization measure. Given what is now understood about theenvironmental effects of CFCs, and the existence of alternatives, it would accord with thepolluter pays principle if future production and use of CFCs is subject to a charge or tax.
As in previous cases, the allocation of joint costs and benefits is not an issue for CFCs,because the polluter pays principle would apply to all of the benefits of reducing losses,including the ozone protection benefits, as well as the GHG reduction benefits.
C.2 Livestock emissions
Methane is produced both from the flatulence and manure of livestock (especially cattle). Themeasures for these emissions are discussed together here, because some changes (e.g.modifying livestock diets, or encouraging less human consumption of meat and dairyproducts) could affect both. Measures for livestock emissions are suggested in Table C-7.
As with landfill emissions, it is impractical to monitor livestock methane emissions directly.Nevertheless, these emissions can be expected to be directly related to numbers of livestockand their diets. This suggests three actions that measures could promote to reduce livestockemissions:
< reducing the numbers of livestock (especially cattle);
< changing the diets (or supplements) of livestock; and
< reducing or recovering methane emissions from livestock manure.
The latter two actions are also areas for research and development (e.g. for reducing ormodifying the microorganisms in the digestive systems of livestock that are responsible forthe generation of methane).
152

Table C-2. Measures applicable to livestock emissions.
Control factor Economic instruments Regulatory measures Information measuresEmissionsInputs head tax on cattle R&D and advice on
livestock supplementsOutputs tax meat and dairy/
incentives for manuretanks and gas recovery/revise NUG rates
require manure tanksand gas recovery
reduce meat and dairyconsumption/ promotegas recovery
Technology require gas recoverysystems
training and R&D for gasrecovery systems/ R&D ofother methods
Operation operation standards forgas recovery systems
Situation
Numbers of livestock
The numbers of livestock depend on the demand for meat and dairy products, and the pricesat which these products are available to consumers. Even ignoring the unaccounted costs ofGHG emissions (and other externalities), it can be argued that the prices of these productsare artificially low (and consumption too high) because of agricultural subsidies. However,this is offset to some degree by supply management programs that restrict supply, andtherefore raise prices. Nevertheless, the elasticities of demand for these products aregenerally accounted to be quite low, so that relatively large increases in prices would berequired to reduce consumption significantly.
The other means of reducing consumption of meat and dairy products is by lesseningdemand for these products by encouraging consumers to change their diets. There is alreadysome basis for such changes on the basis of health. Nevertheless, there is also considerableadvertising effort in Canada, sponsored by the supply industries, to increase demand forthese products. Policies to change demand are outside the usual scope of economic analysiswhere consumer demand is assumed as given. Without a given level of consumer demandthe basis for evaluating costs and benefits in economics is indeterminate.
Policies to influence demand also have to be evaluated on a broader basis than theireconomic benefits (e.g. their contributions to sustainability) or by applying some othermeasure of benefits than consumer demand (and consumer surplus). In the case of changes
153

in diet, these benefits might include health benefits and other environmental benefits, as wellas changes in GHG emissions.
Changes in livestock diet
The second possible approach to reducing livestock emissions is by changes in livestock diet.Reducing emissions could involve substantial changes in livestock diets that wouldconsiderably affect the-economics of livestock production. The exception to this generalproposition is specific injections or diet components that directly affect livestock metabolism(e.g. rBST for cattle) or the activity of the microflora in livestock digestive systems thatgenerate methane. Those compounds that are not already in use are under research orreview for other intended benefits. In this context, the most appropriate measure could bemerely to suggest that GHG reduction benefits should be taken into account with otherbenefits in evaluating livestock supplements. This measure could also encompass supportfor research to evaluate supplements in this regard, and even to develop new supplementsspecially for this purpose.
Emissions from livestock manure
The action that could contribute most immediately to reducing livestock methane emissionswould be to reduce or recover these emissions from livestock manure. The policyconsiderations for this option are similar to those for landfills. In the case of livestockmethane sources, however, it would likely be much more difficult to require gas recoverysystems and monitor their efficient operation because there are many more of these sourcesthan landfills, and the factors that affect efficiency of gas recovery are more difficult tomonitor. This suggests greater reliance in this case on measures to strengthen incentives forgas recovery for energy. Again, this would mainly be through the provision of capital for gasrecovery systems at the low interest rates paid by energy utilities, and rebates per unit ofenergy generated from gas recovery of the difference between the true cost and the ratescharged for delivered energy from utilities. Apart from livestock manure gas recovery, whichmay be too costly in many situations, means could be investigated for reducing emissionsfrom livestock manure, such as spreading the manure to encourage aerobic, rather thananaerobic, decomposition. Other considerations, such as odour, may be important here,however.
In summary, this analysis suggests three broad measures for reducing livestock emissions:
< collaboration with health and environmental organizations to influence consumptionof meat and dairy products;
154
< considering GHG reduction benefits in directing agricultural research and extensionwith regard to livestock feed and supplements; and
< instituting incentives for gas recovery for energy that are correct in terms of the trueopportunity costs of provision of this energy by utilities.
Evaluations of these measures in terms of the criteria are as follows.
C.2.1 Applicability
Each of the measures could be implemented both by the federal and provincial governments.For the last measure, however, there is greater scope within provincial jurisdiction formeasures directed through, or compensating for, the policies of the energy utilities.
All of the measures should be easy to administer, because they merely involve modificationsof the direction of policy in the public sector.
C.2.2 Effectiveness
The only measure with potential for identifiable GHG reductions in the short term is the measure for livestock gas recovery. The other measures are intended to modify the longerterm direction of agricultural production. The potential effectiveness of gas recovery isindicated by the amount of gas that would be recovered if pricing incentives were correct:this addresses only methane from manure and not methane from gastric fermentation.
C.2.3 Efficiency
As already indicated, measures to reduce the consumption of meat and dairy productscannot be evaluated in the usual terms of economic efficiency, that take consumerpreferences as given. Rather, some other basis of economic efficiency that modifiesconsumer demand, perhaps based on a rationale of imperfect consumer information, wouldhave to be applied.
Measures to encourage consideration of methane emissions in the development and use oflivestock feed and supplements is directed to a kind of dynamic efficiency. Among someresearchers, there is believed to be a good prospect of practically eliminating the rumenmicroflora that generate methane by replacing them with other, possibly geneticallyengineered, microorganisms that generate little or no methane. If this is the case, such a
155

development could practically eliminate livestock methane production and obviate the needfor the other measures.
The efficiency of the measure to encourage recovery of gas from manure would depend onthe successfulness in getting correct incentives for gas recovery, given the opportunity costsof providing energy from utilities. Given the current incorrect incentives, there is scope forcorrective policies that could both increase economic efficiency and reduce livestock methaneemissions.
C.2.4 Equity
Reductions in consumer demand for meat and dairy products could be expected to decreaseincomes of producers of these commodities. If this was a result of a deliberate governmentpolicy, there could be some expectation of redress on the part of these producers. Such anexpectation would be more difficult to maintain if government policy was instead directed toreducing market distortions from present policies that result in excessive production of meatand dairy products.
Changes in agricultural technology, such as new livestock feed and supplements or gasrecovery systems, can put small farms at a further competitive disadvantage against larger,capital intensive farms. This issue of equity may also arise with regard to policies to reduceor recover livestock methane. Therefore, some attention may need to be given to ensure thatprograms and new technologies are made available to all sizes of farms.
A head tax on cattle or taxes on meat and dairy products would likely be regarded as'regressive (inequitable) since consumers or producers are asked to pay a fixed amount perpurchase or sale regardless of income.
C.3 Natural gas utility emissions
The analysis of actions suggested that methane emissions from natural gas utilities derivedfrom small equipment leakages, losses during maintenance, and accidental rupture ofpipelines (often by parties digging without checking for the presence of pipelines). Measuresto support actions to reduce these emissions are suggested in Table C-7.
156

Table C-3. Measures for natural gas utilities.
Control factor Economic instruments Regulatory measures Information measuresEmissionsInputs require lower pressure
in pipelinesOutputs gas demand side
managementgas demand-sidemanagement
Technology allow pipeline upgradingto be added to rate base
revise/raise standardsban pneumatic valves
R&D on improvedtechnologies
Operation performance bondsagainst major leaksincrease liability
require maintenance toavoid leaks/losses
promote industryconsultations on means toreduce lossesprograms to reduceaccidental ruptures
Situation require specialmeasures in situationsvulnerable to spills/leaks
Although it is impractical to measure pipeline losses directly, gas utilities record"unaccounted losses" as the difference between the quantities of gas input and output froma pipeline. It is not always clear, however, that these unaccounted losses result fromleakages. Therefore, imposing charges on unaccounted losses may be inappropriate intargeting leakages, and they may also have an effect of distorting the way that pipelineoperators record and report unaccounted losses.
To the degree that the frequency of major leaks and explosions is an indication of continuousgas losses, then enhanced liability for leaks and explosions may increase the incentives forreducing gas leaks. If liability in common law is insufficiently effective, a system ofperformance bonds may provide more effective incentives. Performance bonds generallyaccord with a legal regime of strict liability, but additional liability may be warranted in casesof negligence.
Policy development for natural gas utility leakages can begin by acknowledging that thereis already an incentive for utilities to avoid losses of gas (before it reaches the consumers'meters), because such losses result directly in losses of revenues. Nevertheless, to theextent that the profitability of utilities depends more on the rate base assessed by regulatorsthan on short-term revenues, this incentive may be ineffective. Then, as indicated in the
157
table, allowing pipeline upgrading to be added to the rate base may provide a more effectiveincentive. Pipeline upgrading could also include improvement of equipment to detect andrepair leaks.
Especially if there has been inadequate incentive to reduce gas losses, there may also havebeen insufficient investment in information activities, such as research, development,consultations and training. These deficiencies may be addressed directly by governmentsthrough policies to encourage such activities. In particular, consultations among the partiesresponsible in industry and governments could help to better identify the causes of gaslosses, and define the best technical and operational means of avoiding such losses.
These industry consultations could also lead to new technological and operating standardsfor the natural gas utilities. If deemed appropriate within the context of these continuingconsultations, such standards could also be supported in part by regulation and by economicinstruments to encourage compliance.
To enhance sharing of information and technology, consultations could be carried out atnational and international levels, as well as at the provincial level. This would be helpful notonly in reducing emissions within Ontario, but also in reducing emissions in otherjurisdictions, that are often a larger fraction of the gas transported, and that contribute toglobal warming equally on a unit basis to emissions from Ontario. To add to thecomprehensiveness and prestige of this undertaking, engineering professors andrepresentatives of standards organizations could also be requested to participate in theconsultations, along with industry and government representatives.
C.3.1 Applicability
The measures for the natural gas utility emissions are somewhat broader and moreintegrative than those for other emissions. This reflects the more uncertain and tenuousincentive and information structures of a regulated public utility.
Regulation and the application of economic instruments to reduce methane emissions fromgas utilities is within provincial jurisdiction. In practice, it will be necessary to delimit whatkinds of pipeline upgrading could be added to the utility rate base, and this could be donetogether with standard-setting to provide a means for verifying the upgrading.
Although information measures, particularly industry consultations, could be sponsored atthe provincial level, there would also be advantages, as suggested previously, in institutingthem at the national and international levels.
158
Both economic and information measures should be easy to administer with few majorcompanies subject to the measures. Some consideration would be required as to whetherthe measures should apply only to pipeline distributors of gas, or also to bulk distributors.Changes in the capital expenditures that qualify for addition to the rate base would requireapproval of the Ontario Energy Board. The other economic and regulatory measures couldbe implemented on the basis of relatively minor changes and extensions of current policyinstruments.
C.3.2 Effectiveness
The effectiveness of measures to reduce natural gas leakages will depend on the fractionsof the total leakages attributable to different causes. The major causes of gas emissions (notnecessarily in order of magnitude) are:
< leakages from failures in equipment used in the pipeline system;
< venting during routine maintenance; and
< accidental pipeline ruptures.
This suggests that the most effective measures will be those that affect the upgrading ofequipment directly, and those that encourage good operations and maintenance practices.
C.3.3 Efficiency
In principle, if it is assumed that the marginal cost of reducing leakages increases withoutlimit as leakages are reduced to zero, allowing pipeline upgrading to be added to the ratebase would be efficient only up to some "optimal" level of leakages at which the marginalcost is equal to the (marginal) benefit of methane emissions reduction (or the optimal taxrate for methane). Then, standards should be set at this level, and adding of costs to therate base should only be allowed up to the level necessary to meet these standards.Determining the appropriate levels of these standards would call for cost-benefit analysis (orrisk-benefit analysis), in which the cost of the contribution of methane leakages to globalwarming would be included (among other potential costs of leakages). The measure ofallowing the costs of meeting these higher standards to be added to the rate base shouldhave little or no administrative cost because it is a minor change within the regulatoryregime, and would not require more extensive regulation.
Performance bonds could also be an efficient policy measure to the extent that major
159

leakages are detectable. The costs of administering a performance bond system should alsobe low, but there could be substantial costs in the event of disputes over failures ofperformance. Therefore, efficiency, as well as the other criteria, require that the conditionof failure of performance be clear and indisputable.
The efficiencies of the other measures are more difficult to assess in the absence of a morethorough assessment of the actions that they are intended to induce. In particular, theefficiency of information measures will depend on the scope for improved information,technologies and management practices to reduce emissions.
With regard to dynamic efficiency, there is no incentive to improve technologies withregulations or economic instruments (such as allowing costs to be added to the rate base)that are based on meeting current standards. Only measures that create incentives toimprove on the current standards, such as performance bonds or strict liability, contributeto technological improvement and dynamic efficiency. Dynamic efficiency may also bepromoted by the information measures, especially the industry consultations, to the extentthat these increase the effectiveness of response to any measures, by helping to poolresources and knowledge toward improvements in technologies and practices. The industryconsultations could even be guided to lead to formation of an industry consortium to supportR&D.
C.3.4 Equity
The equity of measures will depend on the efficient operation (efficient operation means afirm which profit maximizes or cost minimizes) of the regulated gas utility. Simply, regulatedgas utilities possess some monopolistic market powers. Thus the efficient operation of thegas utility cannot be assumed to be the same as for a firm in a perfectly competitive market.In particular, utilities may not minimize their costs in responding to incentives or complyingwith regulations if they can simply pass on all costs in higher rates to consumers. Incentivesmust bear on profitability if they are to be effective. Regulated gas utilities profits are oftenfixed by government regulation and thus unaffected by such incentives.
As such, the equity properties of the polluter pays principle may be compromised to thedegree that utilities (individual firms) are not induced to behave efficiently by the regulatoryregime, resulting in an inequitable distribution of the costs of the measure.
Similarly, the funding of information measures should ultimately be borne by the utilitiesrather than be drawn from governments' general revenues in order to meet the terms of thepolluter pays principle. This addresses the equity consideration that gas producers and usersshould bear all costs, rather than leaving some to be borne by the general public.
160

As in previous cases, the allocation of joint costs and benefits is not an issue for natural gaslosses, because the polluter pays principle would apply to all of the benefits of reducinglosses, including the safety benefits, as well as the GHG reduction benefits.
C.4 Landfill methane emissions
Table C-7 indicates some of the policy measures that appear applicable to landfill methaneemissions. Note that if landfill gas is released it is an "emission"; if it is captured it is an"output".
For landfill gases, as for most GHG sources, it is difficult to monitor emissions directly.Nevertheless, the emissions can be expected to be an increasing function of the quantity oforganic material in the landfill. As already noted, it is often economical to recover landfill gasfor energy on sufficiently large landfills, and it may otherwise be needed to avoid safety orodour problems. This suggests that the main line of direct measures that can be adopted forlandfill gas is to encourage, or even require gas recovery on sufficiently large landfills. Thispolicy might be supported by an economic incentive in the form of a charge (tax) on fugitivemethane emissions from landfills as inferred from the quantities of organic waste in thelandfills and any direct measurements.
Table C-4. Measures applicable to landfill methane emissions.
Control factor Economic instruments Regulatory measures Information measuresEmissions
Inputs organics tipping chargefoster compost market
ban organics fromlandfillsrequire composting
demonstrate alternatives(e.g. composting)
Outputs charge unrecovered gasrevise NUG rates
require gas recovery encourage uses of landfillgas
Technology require recoverysystems
training and R&D for gasrecovery systems
Operation monitor gas recovery
Situation
161

If this charge is set at the level of the optimal tax, it should provide the appropriate incentiveto consider GHG contributions in decisions on whether to install gas recovery systems, andto raise tipping fees for organic wastes. The raising of tipping fees for organic wastes shoulddiscourage their disposal with other wastes at landfills, Eland thereby encourage other meansof managing them, such as composting.
The analysis of actions indicated that if charges (e.g. tipping fees) were to be set to reflecttrue social costs, composting (whether home composting or municipal composting) wouldbe the least cost method of reducing methane emissions from landfills. Composting has anet benefit per unit of methane emission avoided even greater than the net benefit per unitfrom recovery of landfill methane. Furthermore, this benefit can be realized at practically anyscale of composting, unlike the case of landfill gas recovery where net benefits require aminimum scale. If this is the case, the current minor role of composting can be attributedto one or more of:
< incorrect pricing (e.g. tipping fees), not reflecting real social costs;
< lack of information about composting on the part of municipal officials and the public;
< absence of, or imperfections in, markets for compost from municipal waste; and
< incorrect assumptions about the time and effort of the waste generator to compost orsource separate.
All of these considerations suggest that effective and efficient measures for landfill methaneemissions should induce the result that would be achieved if an optimal tax on methaneemissions from landfills were imposed. The two essential complementary measures for thisare:
< a requirement for gas recovery on landfills where the net social benefits are positive(taking into account the social costs of methane emissions at the optimal GHG taxrate); and
< tipping fees set at the true social cost of landfilling, including the social costs of anyfugitive methane emissions (at the optimal GHG tax rate) in the case of organicwastes.
The effectiveness of these measures could be further enhanced by measures to encourageefficient alternatives to landfilling of organic wastes. In particular, in the case of composting,this could include fostering greater awareness of composting techniques, and strengtheningmarkets for compost from municipal waste. These latter measures could be funded in part
162

by the additional revenues from increased tipping fees.
Similarly, an economic incentive for landfill gas recovery could be provided by revision ofnon-utility generation rates to better reflect the value of this energy source in terms of theopportunity cost of providing the energy to users from other sources. In particular, capitalfor gas recovery systems could be made available at the same low interest rates as thoseavailable to utilities.
Results from application of the evaluation criteria to the two essential measures for landfillsare as follows.
C.4.1 Applicability
Both measures are within provincial jurisdiction, but would be facilitated by cooperation frommunicipalities and landfill operators. The increase in tipping fees might induce illegal disposalor diversion of wastes to other jurisdictions. Illegal disposal can be addressed by othermeasures or enforcement, but diversion of wastes would be difficult to control.
Both measures should be easy to administer, because there are relatively few major landfills.In the case of the gas recovery requirement, it is easy to monitor installation of the gasrecovery systems, but continuing monitoring will be required to ensure their efficientoperation. In the case of raising tipping fees, a formula will need to be devised, and itsapplication monitored, to collect the increased revenue and divide it appropriately betweenthe landfill operator and the Province, according to the fraction of gas recovered, in order toprovide the correct incentive to landfill operators for gas recovery.
C.4.2 Effectiveness
The potential reduction in emissions by means of landfill gas recovery is limited by thequantity of emissions that can be recovered from those landfills that are sufficiently large orhave other characteristics for gas recovery to be economical. The potential reduction inemissions by diversion of organic waste from landfills to uses or disposal that do notgenerate methane is the amount of methane that would be generated in a landfill from whichthe waste is diverted. In the long term, diversion of organic wastes from landfills couldeliminate this source of methane.
The technology for landfill gas recovery is readily available and effective. Nevertheless, someplanning is generally required for efficient use of the recovered gas for energy. This raisesissues of non-utility energy generation and the rates that should apply to these energy
163

sources.
The effectiveness of increasing tipping fees for organic wastes will depend on the responseto this incentive for separating and diverting these wastes. This will largely be determinedby the intermediate role of municipalities. The Province can adjust its transfer payments andother programs to encourage municipalities to try innovative programs for wastemanagement that address landfill methane emissions among the many other aspects of thisissue. For the same reasons that little difficulty was found in the applicability of thesemeasures, their enforceability should also be quite straightforward.
C.4.3 Efficiency
The private costs of the gas recovery requirement consist mainly of the initial capital costsand operating costs of the gas recovery systems, borne by landfill operators. If these costsare not recovered from energy generation, they will need to be recovered from othersources. Under a generalized "polluter pays principle", these costs should be recovered fromthose who contributed organic wastes to the landfill, in proportion to their contribution. Sincesuch a system would be difficult to administer and enforce, any cost recovery is more likelyto come from the successor population of current contributors to the landfill, in the form ofhigher tipping fees that would be financed either by higher taxes or a "pay by the bag" wastecollection system.
The analysis of actions indicated that there are net benefits to the municipalities fromseparating organic waste for composting, either in home composters or municipal facilities.
The public, administrative costs of both measures should be low because both were foundto be easily applicable and enforceable. These costs should be negligible compared with thecosts of the actions in determining the overall efficiency of these measures.
With regard to dynamic efficiency, the requirement to recover landfill gas will not of itselfprovide an incentive for the improvement of gas recovery technologies and methods. Therewill only be such an incentive if there is a benefit from energy recovery directly related to thegas recovery. Thus, energy recovery contributes to dynamic efficiency. It could also help toreduce the costs of public monitoring and enforcement, since the incentive for the gasrecovery system to be operated efficiently could be assumed.
164

C.4.4 Equity
Both measures are broadly consistent with the "polluter pays principle", which can beconsidered to be one of the criteria of equity, as well as of efficiency. The only departurefrom this principle occurs if current contributors of waste to landfills bear the costs (orbenefits) in tipping fees of gas recovery from waste from previous contributors.
The costs of both measures would ultimately be born by landfill operators and wastegenerators, except possibly for the costs of monitoring and enforcement and any costs ofinformation activities conducted by the public sector. The costs of monitoring andenforcement might be recovered, at least in part, by the public sector through administrativecharges or user charges.
These measures to reduce landfill methane emissions would be equitable with measures topromote other actions if the increase in tipping fee to reflect the cost of the contribution ofmethane emissions to global warming was commensurate with the same implicit "optimaltax" rate that would be applicable to other methane emissions. or GHG emissions generally.
C.5 Adipic acid
Since adipic acid production is already being phased out in Ontario, and no action were foundnecessary, no measures are considered.
C.6 N2O anaesthetic
Since no actions were deemed appropriate in the case of N2O as an anaesthetic, no measuresare considered.
165

C.7 Nitrogenous fertilizer.
The means for reducing N2O emissions from the use of nitrogenous fertilizer apply to thetypes and amounts of fertilizer used and the method of application. Potential measures areindicated in Table C-7. In some situations, these measures could also have substantialenvironmental benefits in reducing nitrification of surface and ground waters.
Table C-5. Measures applicable to nitrogenous fertilizers.
Control factor Economic instruments Regulatory measures Information measuresEmissionsInputs tax fertilizers per their
likely emissionsban high emittingfertilizers (e.g.anhydrous ammonia) ifthis reduces emissions
encourage less use ofnitrogenous fertilizersencourage rotations withnitrogen-fixing crops asalternative
Outputs promote production andconsumption of leguminouscrops
TechnologyOperation restrict inefficient or
polluting fertilizerapplication
encourage efficient fertilizerapplication
Situation discourage fertilizerapplication where it mostcontributes to N2O or otherpollution
C.7.1 Applicability
There are special product charges (taxes) on nitrogen and phosphorus fertilizers in Norwayand Sweden, intended to raise revenues for environmental programmes in the agriculturalsector, and in Sweden also to act as an incentive to reduce fertilizers use (Opshoor and Vos1989). The Swedish tax raised the prices of fertilizers by 5 per cent on average, but has notsignificantly affected their use, so the elasticity of demand appears to be low (Opshoor andVos 1989).
166

Accordingly, although the revenue-raising potential of charges should not be ignored, itappears that in terms of reducing fertilizers use and N2O emissions, the focus should be onthe information and regulatory measures.
C.7.2 Effectiveness
In terms of reducing N2O emissions from fertilizers, the most effective measure might be toban high-emitting types of fertilizer, especially anhydrous ammonia. The costs and the likelybehaviour of farmers in response to a ban would need to be carefully researched. The costsmight be onerous in some situations where these fertilizers are especially suitable.Furthermore, the banning of these fertilizers may induce greater use of other fertilizers assubstitutes which could largely reduce or offset the intended reductions in emissions.
This leaves information measures to reduce nitrogenous fertilizer use providing the mainscope for emissions reduction. These measures are already being pursued to reduce costs,and alleviate soil degradation and nitrification of surface and ground waters. Reduction ofN2O emissions adds one more reason to pursue these measures. The effectiveness of thesemeasures need to be assessed, however, especially with regard to their potential contributionto N2O emissions reduction.
C.7.3 Efficiency
The tax on fertilizers at a rate related to the marginal cost imposed by emissions istheoretically consistent with economic efficiency. The experience of Norway and Swedensuggests that the administrative costs of such a tax need not be high, if they are applied ata national level. Theoretically, in the absence of administrative costs, bans are less efficientthan taxes, but a ban may be easier and less costly to apply for the amount of productinvolved.
The efficiency of information measures depends on the degree to which farmers areencouraged to reduce nitrogenous fertilizer use by greater knowledge of consequences andalternatives. Trends toward reduced fertilizer use and organic agriculture are propitious inthis regard.
C.7.4 Equity
Most of the potential measures are consistent with the Polluter-Pays Principle, althoughapplication of the tax, at least to raise revenues for the other measures, would enhance
167

consistency with this principle. The ban on high-emitting fertilizers may raise other concernswith regard to equity, if some farmers are particularly inconvenienced by this measure. Inmost cases, however, it should be possible to substitute low-emitting for high-emittingfertilizers without imposing any special burdens.
C.8 Ammonia
As indicated in the section on actions for ammonia, 78% of ammonia production in Ontariois for manufacture of nitrogenous fertilizers. Therefore, reduction in use of nitrogenousfertilizers would not only decrease N2O emissions from these fertilizers themselves, but alsodecrease N2O and CO2 emissions from ammonia production. Measures to reduce nitrogenousfertilizer use can be effective in both regards. Several other potential measures aresuggested in Table C-7.
C.8.1 Applicability
All of the indicated measures could be applied within provincial jurisdiction, but a tax onammonia or nitrogenous fertilizers might have negative impacts on the competitiveness forproducers within the Province if the tax could not also be imposed on imports.
Encouraging less use of nitrogenous fertilizer would be an easy measure to administer, andto assess in terms of effectiveness. This is discussed more fully in the section on measuresfor nitrogenous fertilizers.
168
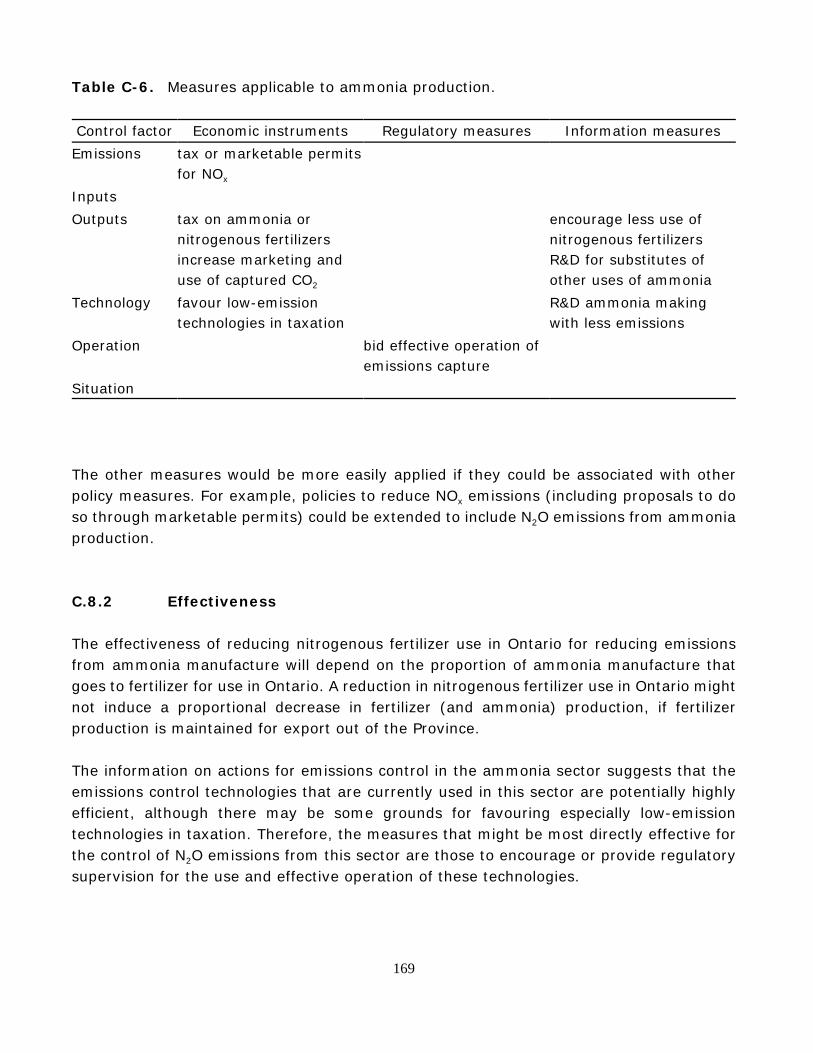
Table C-6. Measures applicable to ammonia production.
Control factor Economic instruments Regulatory measures Information measuresEmissions tax or marketable permits
for NOx
InputsOutputs tax on ammonia or
nitrogenous fertilizersincrease marketing anduse of captured CO2
encourage less use ofnitrogenous fertilizersR&D for substitutes ofother uses of ammonia
Technology favour low-emissiontechnologies in taxation
R&D ammonia makingwith less emissions
Operation bid effective operation ofemissions capture
Situation
The other measures would be more easily applied if they could be associated with otherpolicy measures. For example, policies to reduce NOx emissions (including proposals to doso through marketable permits) could be extended to include N2O emissions from ammoniaproduction.
C.8.2 Effectiveness
The effectiveness of reducing nitrogenous fertilizer use in Ontario for reducing emissionsfrom ammonia manufacture will depend on the proportion of ammonia manufacture thatgoes to fertilizer for use in Ontario. A reduction in nitrogenous fertilizer use in Ontario mightnot induce a proportional decrease in fertilizer (and ammonia) production, if fertilizerproduction is maintained for export out of the Province.
The information on actions for emissions control in the ammonia sector suggests that theemissions control technologies that are currently used in this sector are potentially highlyefficient, although there may be some grounds for favouring especially low-emissiontechnologies in taxation. Therefore, the measures that might be most directly effective forthe control of N2O emissions from this sector are those to encourage or provide regulatorysupervision for the use and effective operation of these technologies.
169

C.8.3 Efficiency
Encouraging alternatives to nitrogenous fertilizer use could have other benefits for soilquality, reduction of soil erosion, and protection of groundwater. If these factors are takeninto account, measures to reduce fertilizer use are likely to be generally efficient. Thisdepends on a more detailed analysis of the use and alternatives to nitrogenous fertilizer use,which is beyond the scope of this study. Similarly, the efficiency of finding substitutes forother uses of ammonia needs to be examined.
On the basis of economic principles, a tax or marketable permits for NOx emissions is likelyto be efficient for reducing NOx emissions generally. The implications for N2O specifically needto be determined.
C.8.4 Equity
The equity considerations for increasing the costs or decreasing the output of ammoniaproduction apply mainly to the few companies and communities involved in this industry. Themeans for reducing ammonia production and transitions to other economic activities needto be considered for these companies and communities.
C.9 Cement and lime manufacturing
The main actions for reducing non-energy carbon-dioxide emissions from cement and limemanufacturing are reducing the need for producing new calcium (or magnesium) oxide fromcarbonate by the calcining process. This can be accomplished by making use of groundgranulated blast furnace (GGBF) slag and cement kiln dust, and by reducing the need fornew concrete by extending the life, and reusing and recycling, the existing stock.
The potential measures for encouraging this, indicated in Table C-7, apply mainly to inputsand outputs. The most direct measures apply specifically to the calcination process. A tax oncalcium carbonate used in calcination, or on the calcium oxide produced, could be set at alevel that would conform to the tax on carbon dioxide from other sources. Such a tax wouldencourage the use of input substitutes, such as GGBF and CKD, and raise the price of cementand lime produced from carbonates, thereby encouraging the recycling of existing stocks.
If it is believed that the barriers to these changes are not just a problem of incentivesaddressed by economic instruments, but also a problem of lack of information or markets(e.g. with regard to substitutes), then regulatory and information measures may also beappropriate.
170

Table C-7. Measures applicable to cement and lime manufacturing.
Control factor Economic instruments Regulatory measures Information measuresEmissionsInputs tax calcium carbonates
for use in calcination;form market for GGBF,CKD and used concrete
encourage use of GGBFand CKD as inputsubstitutes
Outputs tax virgin lime/concreteincrease charges fordisposal of concrete toincrease reuse/recycling
improve standards forlife of concrete
promote reuse/recycling ofconcrete
TechnologyOperationSituation
C.9.1 Applicability
It appears that the measures that would be easiest to apply would be to promote use ofGGBF, CKD and used concrete by one or more of:
< creation or support of markets for these materials (e.g. with quality standards orgrading)
< dissemination of information (and support of research) on the use of these materials
< increasing charges for their disposal
Taxing virgin lime/concrete or inputs to their manufacture might be difficult to administer,and the effects on the volumes of production might be minimal or uncertain. Nevertheless,although this might have minimal incentive effects, it could offer an acceptable means ofraising funding to help to support the measures indicated above.
C.9.2 Effectiveness
The effectiveness of these measures derive from the potential calcination avoided.
171

C.9.3 Efficiency
It is difficult to assess the efficiency of these measures without greater knowledge of thecurrent barriers to use of GGBF, CKD and used concrete. If these barriers could be overcomeat modest expense for the calcination that could be avoided, then the suggested measurescould be efficient.
The effects of taxes are at least as uncertain as the effects of the other measures, withoutknowledge of the elasticity of demand and long-term potential for substitution or avoidanceof concrete in structures. Nevertheless, the tax options provide greater incentive for on-goingimprovements in techniques and practices to reduce the requirements for calcination.
C.9.4 Equity
The measures are generally consistent with the Polluter-Pays Principle, especially if a meanscan be established to recover the administrative costs of the measures from those engagedin calcination in proportion to the magnitudes of their production.
C.10 Pulp and paper
In the absence of definitive technical process changes for reducing CO2 emissions from pulpand paper production, discussion of measures is premature. Support for R&D of such optionsmay be warranted. Apart from technical process changes, CO2 emissions from pulp and paperproduction could be reduced by greater recycling of paper to reduce the requirements forprocessing virgin timber. The efficiency of measures in this regard depends on the overalleconomics of recycling, which is beyond the scope of this study.
C.11 Raw CO2
Since no actions were deemed appropriate in the dace of raw CO2 use, no measures areconsidered.
172

References
Abt Associates of Canada. 1989a. An Assessment of the Economic Impacts of a Ban on theUse of Chlorofluorocarbons in Car and Light Truck Air Conditioners. Ottawa:Environment Canada.
Abt Associates of Canada. 1989b. An Assessment of the Economic Impacts of a Ban on theUse of Rigid Foams Containing Chlorofluorocarbons. Ottawa: Environment Canada.
AGA. 1989. Natural gas transmission and distribution methane emissions. American GasAssociation (Engineering Technical Note SS-89-4-1): Arlington, VA.
American Concrete Institute. 1987). Ground Granulated Blast - Furnace Slag as aCementatious Constituent in Concrete. ACI Material Journal July-August 1987.327-342.
American Concrete Institute. 1987. Ground granulated blast -- furnace slag as acementatious constituent in concrete. ACI material journal. Committee report 226July-August. 327-342.
Austin, G.T. 1984. Shreve's chemical process industries. 5th Edition. New York: McGraw-HillBook Company.
Azarniouch. 1991. Energy conservation measures and the potential CO, emissions reductionin the Canadian pulp and paper industry. Internal report for Canadian Pulp and PaperAssociation.
Bach W. and A. K. Jain. 1990. The CFC Greenhouse Potential of Scenarios Possible Under theMontreal Protocol. International Journal of Climatology 10:: 439 - 450.
Badr, O., S. D. Probert and P. W. O'Callaghan. 1990. Chlorofluorocarbons and theEnvironment: Scientific, Economic, Social and Political Issues. Applied Energy 37:247-327.
Benzing-Purdie, L., Research Coordinator, Environment, Agriculture Canada, Ottawa.Personal communication with A. S. White, 25 March 1992.
California Energy Commission. 1991. 1988 inventory of California greenhouse gas emissions.Principal Authors Goodin, M., Grandmaison, L., Raitt, H., Robel, R. and Smith, K.
173

Canada Gazette. Ministry of Supply and Services. 1989. Ozone—Depleting SubstancesRegulation No. 1 (Chlorofluorocarbons). Canada Gazette, Part I1. Ottawa: Queen'sPrinter for Canada. 3425-3445.
Canadian Energy Research Institute. 1989. Industrial Natural Gas Demand. Study No. 30 byMerete Heggelund. ISBN 0-920522-55-6. Chapter 2 The Pulp and Paper Industry.
Canadian Council of Ministers of the Environment. 1992 Communique. Accelerated ControlProgram for CFCs. CCME: Vancouver.
Canadian Portland Cement Association. 1989. Resource recovery: the cement kiln solution.Toronto: Canadian Portland Cement Association.
Canadian Portland Cement Association. 1991. The cement industry's contribution to Canada'sGreen Plan. Ottawa: Canadian Portland Cement Association.
Canadian Portland Cement Association. 1992. A Monthly Analysis of Trends in theConstruction and Cement Industries. The Monitor. Canadian Edition. December. 1991.Toronto: Canadian Portland Cement Association.
Canadian Pulp and Paper Association. 1991. Global climate change: A statement by the pulpand paper Industry. Montreal: Canadian Pulp and Paper Association.
Chang, K. J., Ruminant Microbiologist, Lethbridge Research Station, Agriculture Canada.Personal communication with A. S. White, 27 March 1992.
City of Guelph. 1991. Application for Certificate of Approval. under the EnvironmentalProtection Act - Wet/Dry Recycling Plant. Prepared by R. Cave and Associates Ltd.,Guelph, Ontario.
Concord Environmental and The ARA Consulting Group. 1991. British Columbia emissioninventory of nitrogen oxides, volatile organic compounds and ozone (NOx/ VOC/O3) asgreenhouse gases. Victoria: British Columbia Ministry of the Environment.
Conklin, C. L. and J. D. Lindeberg. 1992. Composting makes clean communities in Michigan.Resource Recycling, April: 50-62.
Consumers Gas. 1991a. Methane emissions due to company operations. OperationsEngineering, Toronto.
174
Consumers Gas. 1991b. Initiatives to reduce methane emissions at Consumers Gas.Operations Engineering, Toronto.
Deloitte and Touche. 1990. An economic assessment of the prospective introduction andadoption of bovine somatotropin in Canada. Prepared for the Canadian Animal HealthInstitute, Guelph, Ontario.
Environment Canada. 1982. Review of the Canadian Fertilizer Industry and Evaluation ofControl Technologies. Report EPS 2/AG/1.
Environment Canada. 1990a. Canadian Use Pattern of Chlorofluorocarbons (CFCs) andBromofluorocarbons,(Halons) 1988. Ottawa: Environment Canada.
Environment Canada. 1990b. News Release. New Bans on CFC Use in Canada will Step UpDomestic Phase-Out Program. Ottawa: Environment Canada.
EPA. 1989. Reducing methane emissions from livestock: opportunities and issues. [EPA400/1-89/002], Office of Air and Radiation: Washington, DC.
F-P-T Task Force. 1989. Report on reducing greenhouse gas emissions. Federal - Provincial- Territorial Task Force on Energy and the Environment, Ottawa.
Hare, M., Environmental Director, Consumers Gas. 1992. Personal communication with A.White, 25 March 1992.
Heggelund, Merete. 1989. Chapter 2. The pulp and paper industry. Industrial natural gasdemand. Study No. 30. Canadian Energy Research Institute.
Herzog, H. J. and J. W. Tester, 1990. Energy Management and Conservation in the. Pulp andPaper Industry. Energy and the Environment in the 21st Century. MIT.
Hilborn, D., 1992. By-product/Waste Management Specialist, Ontario Ministry of Agricultureand Food. Personal communication with A. W. White, 25 May 1992.
IPCC. 1990. Methane emissions and opportunities for control: workshop results of theIntergovernmental Panel on Climate Change Response Strategies Working Group.Japan Environmental Agency and the U.S. Environmental Protection Agency,Washington, DC.
Jaques, A. P. 1992. Canada's greenhouse gas emissions estimates for 1990. EnvironmentCanada, Conservation and protection Branch, Ottawa.
175

Johnson, D. E., Branine, M. and G. M. Ward. 1991. Methane emissions from livestock.Metabolic Laboratory, Colorado State University, Fort Collins, CO.
Juskevich, J. C. and C. G. Guyer. 1990. Bovine growth hormone: human food safetyevaluation. Science (249) August 1990.
Kennedy Van Saun Corporation. 1992. Communication with Concord EnvironmentalKirk-Othmer. 1985. Coal conversion process. Concise encyclopedia of chemicaltechnology. New York: John Wiley & Sons. 288-289.
Kock Minerals Company. Introducing gran cem. water-granulated blast furnace slag cement.Brochure provided to Concord Environmental.
Lashof, D.A. and D.A. Tirpak. eds. 1990. Policy options for stabilizing global climate. NewYork: Hemisphere Publishing Corporation.
LeFarge Canada. March 1992. Communication with Concord Environmental.
Lelieveld, Jos and Paul J. Crutzen. 1992. Indirect Chemical Effects of Methane on ClimateWarming. Nature 355. 339-342.
Leslie, S., Ontario Cattlemen's Association. 1992. Personal communication with A. S. White,28 May 1992.
MacDonald, M. R., Coordinator, Environmental Analysis, Union Gas Ltd. Personalcommunication with A. S. White, 25 May 1992.
MacViro Consultants Inc. 1991. An action plan for energy recovery from landfill gas inOntario. Prepared for Ontario Ministry of Energy, Toronto.
Madill, K., Industrial Waste Policy Officer, Ontario Ministry of the Environment. Personalcommunication with D. W. Heeney, 3 November 1992.
McBeath, I. 1987. Review of the Canadian fertilizer industry and evaluation of controltechnologies. Ottawa: Environment Canada.
McCutcheon, M., Ontario Pork Producer's Marketing Board. 1992. Personal communicationwith A. S. White, 28 May 1992.
Miller, M. Michael. 1991. Annual report on lime. Bureau of Mines.
176

Notorfonzo, R. 1992. Ontario Waste Management Corporation. Personal correspondence.
OECD. 1975. The Polluter Pays Principle. Paris: OECD.
OECD. 1991. Environmental policy: how to apply economic instruments. Paris: OECD.
OMAF. 1991. Agricultural statistics for Ontario. Prepared by Statistical Services. Unit, PolicyAnalysis Branch, Ontario Ministry of Agriculture and Food, Toronto.
OMOE. 1991. The physical and economic dimensions of municipal solid waste managementin Ontario. Ontario Ministry of the Environment, Fiscal Planning and Economic AnalysisBranch, Toronto.
OMOE. 1990. Composting: a literature study - 1989. Prepared by M.M. Dillon Ltd. and CalRecovery Systems Inc. Ontario Ministry of the Environment, Toronto.
Ontario Ministry of Energy. 1990. Energy Demand Model. Toronto: MENY.
ORTECH International. 1991. Compilation of Ontario gridded carbon dioxide and nitrousoxide emission inventory. Toronto: Ontario Ministry of the Environment.
OTA. 1991. U.S. dairy industry at a crossroad: biotechnology and policy choices. Office ofTechnology Assessment, Washington, DC.
OTA. 1990. Changing by degrees - steps to reduce greenhouse gases. Office of TechnologyAssessment, Washington, DC.
Patni, N. K. and P. Y. Jui. 1987. Changes in solids and carbon content of dairy-cattle slurryin farm tanks. Biological Wastes 20: 11-34.
Portland Cement Association. 1990. U.S. and Canadian portland cement industry: plantinformation summary. Skokie, Illinois: Portland Cement Association.
Ralph G. Winfield and Associates. 1986. Biogas production facilities on farms: a 1985 lookat the recent experience. Prepared for the Agricultural Energy Centre, Ontario Ministryof Agriculture and Food, the Ontario Ministry of Energy, Toronto, and the Engineeringand Statistical Research Institute, Research Branch, Agriculture Canada, Ottawa.
Ramaswamy, V., M. D. Schwarzkopf and K. P. Shine. 1992. Radiative Forcing of Climatefrom Halocarbon-Induced Global Stratospheric Ozone Loss. Nature 355. 810-812.
177

SENES Consultants Limited. 1992. A global warming inventory for the province of Ontario.Toronto: Ontario Ministry of Energy.
Sherville, P., Environmental Manager, Union Gas. 1992. Personal communication with A. S.White, 8 April 1992.
Stanley Associates Engineering Ltd. 1988. Sanitary landfill and waste treatment - anintegration strategy. Prepared for the Edmonton-Strathfort Regional Solid WasteManagement Steering Committee, Edmonton.
Statistics Canada. 1990. Quarterly report on energy supply and demand in Canada. StatisticsCanada, Cat. 57-003, Ottawa.
Stennes, B. K., R. R. Barichello and J. D. Graham. 1991. Bovine somatotropin and theCanadian dairy industry: an economic analysis. Prepared for Policy Branch, AgricultureCanada, Ottawa.
Stevenson Kellogg Ernst and Young. 1988a. Commercial Analysis of ChlorofluorocarbonApplication in Canada. Ottawa: Environment Canada.
Stevenson Kellogg Ernst and Young. 1988b. CFC—Halon Control Options: Phase II. Ottawa:Environment Canada.
Stewart, J. 1991. PEI Dept. of Environment. Personal communication with A. White.
The ARA Consulting Group Inc and IBI Group. 1991. Evaluation of CO2 managementmeasures. Victoria: British Columbia Ministry of the Environment.
U.S. EPA. 1989. Reducing methane emissions from livestock: opportunities and issues. [EPA400/1-89/0021, Office of Air and Radiation: Washington, DC.
U.S. EPA 1991. Air Emissions from Municipal Solid Waste Landfills. Background Informationfor Proposed Standards and Guidelines. U.S. EPA Office of Air Quality Planning andStandards, Rese2rch Triangle Park, NC 27711. EPA Publication EPA-45C/3-90-011a.NTIS Publication PB91-197061.
U.S. EPA 1990. Reduction of CFC Usage in U.S. Exempted and Excluded Aerosols. ResearchTriangle Park, North Carolina, USEPA# PB90-246323.
U.S. EPA. 1991. Air emissions from municipal solid waste landfills background informationfor proposed standards and guidelines. Washington: U.S. EPA Office of Air Quality
178

Planning and Standards, Research Triangle Park, NC 27711. EPA PublicationEPA-45C/3-90-011a.
U.S. EPA 1990. Recycle and Disposal for CFC's and Halons. Research Triangle Park, NorthCarolina, USEPA# PB90-246356.
Union Gas. 1992. Union Gas methane emissions control program - fiscal year 1991. UnionGas, Chatham, Ontario.
United Nations Environment Programme. 1991a. Refrigeration, Air Conditioning and HeatPumps Technical Options Committee.
United Nations Environment Programme. 1991b. Flexible and Rigid Foams Technical OptionsCommittee.
United Nations Environment Programme. 1991c. Aerosol Products, Sterilants MiscellaneousUses and Carbon Tetrachloride Technical Options Committee.
Van Die, P. 1987. An assessment of Agriculture Canada's anaerobic digestion program.Engineering and Statistical Research Centre, Research Branch, Agriculture Canada,Ottawa.
VHB Research and Consulting Inc., and MacLaren Engineers Inc. 1991. Cost accountingmethods for landfill. Prepared for the Waste Reduction Advisory Committee.
VHB Research and Consulting Inc. and Econometrics Research Ltd. 1992. A socioeconomicassessment of Ontario waste management alternatives. Prepared for the OntarioMinistry of the Environment, Toronto.
VHB Research and Consulting, Inc. and MacLaren Engineering Inc. 1991. True costs ofmunicipal waste management. Prepared for the Ontario Ministry of the Environment,Toronto.
World Bank. 1985. China, the energy sector. Annex 3 to China, long-term developmentissues and options, a World Bank country study. Washington, DC.
179