GREENHOUSE GAS MITIGATION MEASURES FOR …
43
GREENHOUSE GAS MITIGATION MEASURES FOR TRANSPORTATION CONSTRUCTION, MAINTENANCE, AND OPERATIONS ACTIVITIES Requested by: American Association of State Highway and Transportation Officials (AASHTO) Standing Committee on the Environment Prepared by: Frank Gallivan, Jeff Ang-Olson, and Andrew Papson ICF International 620 Folsom Street, 2 nd Floor San Francisco, CA Marie Venner Venner Consulting 9947 W. Oregon Place Lakewood, CO August 2010 The information contained in this report was prepared as part of NCHRP Project 25-25, Task 58, National Cooperative Highway Research Program, Transportation Research Board. SPECIAL NOTE : This report IS NOT an official publication of the National Cooperative Highway Research Program, Transportation Research Board, National Research Council, or The National Academies.
Transcript of GREENHOUSE GAS MITIGATION MEASURES FOR …
GREENHOUSE GAS MITIGATION MEASURES FOR TRANSPORTATION CONSTRUCTION, MAINTENANCE,
AND OPERATIONS ACTIVITIES
Requested by:
American Association of State Highway and Transportation Officials (AASHTO)
Standing Committee on the Environment
Prepared by:
Frank Gallivan, Jeff Ang-Olson, and Andrew Papson ICF International
620 Folsom Street, 2nd Floor San Francisco, CA
Marie Venner Venner Consulting
9947 W. Oregon Place Lakewood, CO
August 2010
The information contained in this report was prepared as part of NCHRP Project 25-25, Task 58, National Cooperative Highway Research Program, Transportation Research Board.
SPECIAL NOTE: This report IS NOT an official publication of the National Cooperative Highway
Research Program, Transportation Research Board, National Research Council, or The National Academies.
Acknowledgements
This study was requested by the American Association of State Highway and Transportation Officials (AASHTO), and conducted as part of the National Cooperative Highway Research Program (NCHRP) Project 25-25. The NCHRP is supported by annual voluntary contributions from the state Departments of Transportation. Project 25-25 is intended to fund quick response studies on behalf of the AASHTO Standing Committee on the Environment. The report was prepared by Frank Gallivan, Jeff Ang-Olson, and Andrew Papson of ICF International and Marie Venner of Venner Consulting. The work was guided by a task group chaired by John Zamurs and Mia Waters, which included Pete Conn, Thomas Koos, Karin Landsberg, Phil Peevy, Virginia Porta, and Constance Ruth. The project was managed by Nanda Srinivasan, NCHRP Senior Program Officer.
Disclaimer
The opinions and conclusions expressed or implied are those of the research agency that performed the research and are not necessarily those of the Transportation Research Board or its sponsors. The information contained in this document was taken directly from the submission of the author(s). This document is not a report of the Transportation Research Board or of the National Research Council.
Table of Contents 1. Introduction ........................................................................................................................... 1 2. Electricity Use in Roadways ................................................................................................ 3
2.1. Efficient Lighting Technologies ..................................................................................... 3 2.2. Reduce the Amount of Lighting .................................................................................... 4 2.3. Electricity from Renewable Sources ............................................................................. 6 2.4. Research Gaps ............................................................................................................. 6
3. On-Road Vehicles ................................................................................................................. 8 3.1. Reduce VMT ................................................................................................................. 8 3.2. Improve Vehicle Fuel Economy .................................................................................. 10 3.3. Use Alternative Vehicle Technologies and Fuels ....................................................... 12 3.4. Research Gaps ........................................................................................................... 13
4. Off-Road Equipment ........................................................................................................... 14 4.1. Reduce Equipment Activity ......................................................................................... 14 4.2. Improve Equipment Fuel Economy ............................................................................ 15 4.3. Use Alternative Equipment Technologies and Fuels .................................................. 16 4.4. Research Gaps ........................................................................................................... 17
5. Materials............................................................................................................................... 20 5.1. Reduce Volume of Materials Used ............................................................................. 20 5.2. Recycled and Alternative Materials ............................................................................ 20 5.3. Warm Mix Asphalt ...................................................................................................... 22 5.4. Research Gaps ........................................................................................................... 22
6. Traffic Management ............................................................................................................ 24 7. Summary of Research Findings and Knowledge Gaps ................................................... 26 8. Appendix: Quick Reference Tables ................................................................................... 30
8.1. Electricity .................................................................................................................... 30 8.2. On-Road Vehicles ...................................................................................................... 31 8.3. Off-Road Equipment ................................................................................................... 32 8.4. Materials ..................................................................................................................... 36 8.5. Traffic Management .................................................................................................... 38
ICF International iii July 2010
ICF International iv July 2010
List of Tables Table 1. Street Lamps: Comparison of CO2 Emissions Rates ................................................................... 30 Table 2. Traffic Signals: Comparison of CO2 Emissions Rates .................................................................. 30 Table 3. Changeable Message Signs: Comparison of CO2 Emissions Rates ............................................ 30 Table 4. Light Duty Vehicles by Model Year: CO2 Emissions (kg) per 100 miles of travel ......................... 31 Table 5. Vehicle Technology Types: CO2 Emissions (kg) per 100 miles of travel ...................................... 31 Table 6. Biofuels: CO2 Emissions (kg) per 100 miles of travel ................................................................... 32 Table 7. Off-Road Equipment Types: CO2 Emissions (kg) per 100 hours operation ................................. 32 Table 8. Off-Road Equipment Types: Comparison of Emission Factors by Engine/Fuel Type (g CO2
per horsepower-hour) ................................................................................................................. 34 Table 9. Comparison of Conventional and Alternative Fuels: CO2 Emissions (kg) from 100 Gasoline
Gallons Equivalent ...................................................................................................................... 35 Table 10. Finished Roadway Materials: kg CO2 embodied per 100 metric tons ........................................ 36 Table 11. Concrete Panels: Emissions saved (kg CO2) from substituting 1 ton of recycled materials ...... 36 Table 12. Asphalt: Emissions saved (kg CO2) from substituting 1 ton of recycled materials ..................... 37 Table 13. Cement Treated Aggregate: Emissions saved (kg CO2) from substituting 1 ton of recycled
materials ..................................................................................................................................... 37 Table 14. Base Aggregate: Emissions saved (kg CO2) from substituting 1 ton of recycled materials ....... 38 Table 15. Hot Mix Asphalt vs. Warm Mix Asphalt: kg CO2 embodied per 100 metric tons ........................ 38 Table 16. Comparison of Vehicle Emissions by Average Travel Speed on Urban Freeways .................... 38
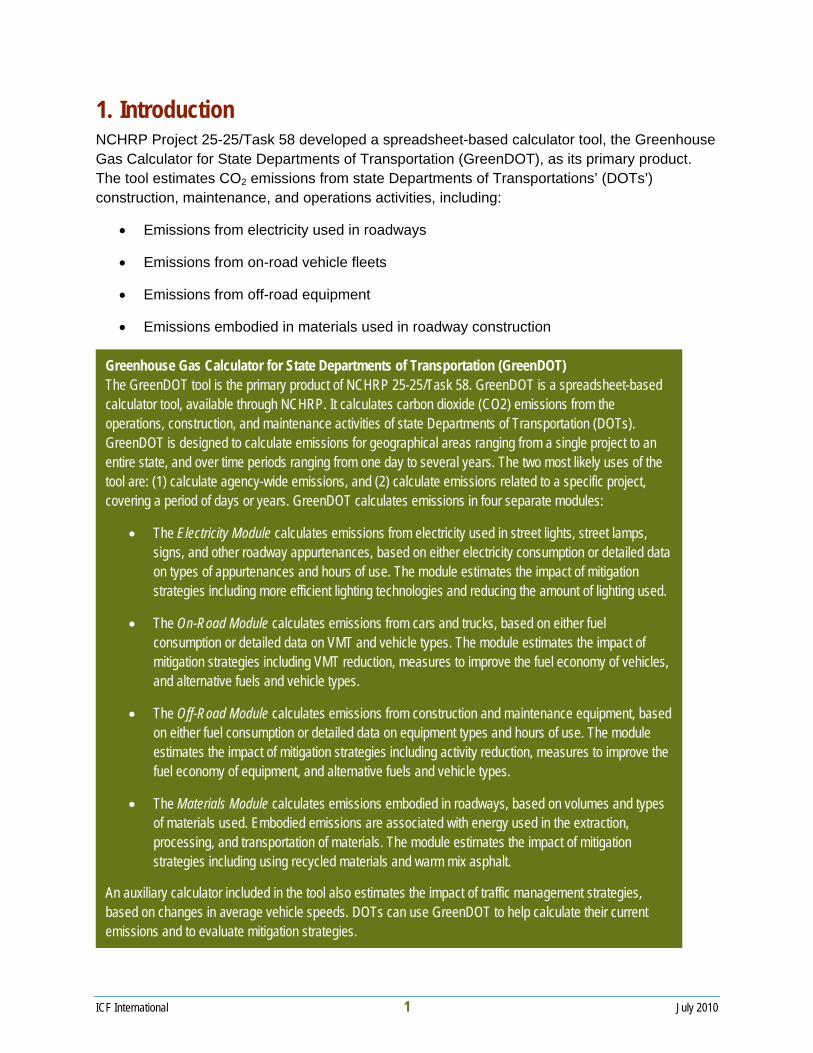
1. Introduction NCHRP Project 25-25/Task 58 developed a spreadsheet-based calculator tool, the Greenhouse Gas Calculator for State Departments of Transportation (GreenDOT), as its primary product. The tool estimates CO2 emissions from state Departments of Transportations’ (DOTs’) construction, maintenance, and operations activities, including:
• Emissions from electricity used in roadways
• Emissions from on-road vehicle fleets
• Emissions from off-road equipment
• Emissions embodied in materials used in roadway construction
Greenhouse Gas Calculator for State Departments of Transportation (GreenDOT) The GreenDOT tool is the primary product of NCHRP 25-25/Task 58. GreenDOT is a spreadsheet-based calculator tool, available through NCHRP. It calculates carbon dioxide (CO2) emissions from the operations, construction, and maintenance activities of state Departments of Transportation (DOTs). GreenDOT is designed to calculate emissions for geographical areas ranging from a single project to an entire state, and over time periods ranging from one day to several years. The two most likely uses of the tool are: (1) calculate agency-wide emissions, and (2) calculate emissions related to a specific project, covering a period of days or years. GreenDOT calculates emissions in four separate modules:
• The Electricity Module calculates emissions from electricity used in street lights, street lamps, signs, and other roadway appurtenances, based on either electricity consumption or detailed data on types of appurtenances and hours of use. The module estimates the impact of mitigation strategies including more efficient lighting technologies and reducing the amount of lighting used.
• The On-Road Module calculates emissions from cars and trucks, based on either fuel consumption or detailed data on VMT and vehicle types. The module estimates the impact of mitigation strategies including VMT reduction, measures to improve the fuel economy of vehicles, and alternative fuels and vehicle types.
• The Off-Road Module calculates emissions from construction and maintenance equipment, based on either fuel consumption or detailed data on equipment types and hours of use. The module estimates the impact of mitigation strategies including activity reduction, measures to improve the fuel economy of equipment, and alternative fuels and vehicle types.
• The Materials Module calculates emissions embodied in roadways, based on volumes and types of materials used. Embodied emissions are associated with energy used in the extraction, processing, and transportation of materials. The module estimates the impact of mitigation strategies including using recycled materials and warm mix asphalt.
An auxiliary calculator included in the tool also estimates the impact of traffic management strategies, based on changes in average vehicle speeds. DOTs can use GreenDOT to help calculate their current emissions and to evaluate mitigation strategies.
ICF International 1 July 2010
Introduction
To support and complement the development of the tool, the project team researched techniques that state DOTs can use to mitigate CO2 emissions from sources covered by the tool. Research included a literature review and a survey of state DOT staff. The collection of quantitative information on strategy results was emphasized, in order to both inform the calculation structure of the tool and to provide a reference for DOTs to compare the benefits of potential mitigation strategies. This report describes the mitigation strategies discovered and provides examples of their implementation at state DOTs.
In addition to the strategy examples, quick reference emissions factors are presented in supplementary tables. These tables allow for a direct comparison of the emissions impacts of different technologies and practices. In most cases, an experienced practitioner should determine whether and when one technology or practice can be substituted for another. Figures in the quick reference tables were calculated using GreenDOT.
The research largely confirmed that very few DOTs have estimated the impact of mitigation strategies on CO2 emissions. While DOTs are increasingly exploring mitigation strategies, most have not conducted an evaluation of those strategies. Other interested parties including the U.S. Environmental Protection Agency (EPA), the Federal Highway Administration (FHWA), and private contractors have also produced very few quantitative evaluations of CO2 reduction strategies that are relevant to DOTs’ operations, maintenance, and construction activities.
GreenDOT provides a robust tool for DOTs to estimate the impact of many of these strategies, especially strategies that change vehicle engine or fuel technologies, lighting technologies, and roadway materials types. Additional research is needed to help DOTs estimate the ability of strategies to reduce activity levels of on-road vehicles and off-road equipment. Provided estimates of changes in vehicle or equipment activity, GreenDOT can evaluate impacts on CO2 emissions.
The following sections provide an overview of each major category of emissions, along with a description of mitigation strategies and key examples from the literature. Strategies that reduce congestion are also briefly discussed. Quantified impacts of strategies are provided wherever possible. In each section, links to Quick Reference Tables are provided. Quick Reference Tables compare emissions across vehicle, technology, and material types. Research gaps and recommendations for additional research projects are included under each emissions category. Overarching research gaps are discussed in the final section of the report.
ICF International 2 July 2010
Electricity Use in Roadways
2. Electricity Use in Roadways Most of the electricity used in roadway infrastructure powers lighting in various applications. Roadway lighting is found in:
• Street lights
• Traffic signals
• Changeable message signs
Electricity is also used to power some fans, pumps, and other appurtenances.
Electricity use results in indirect CO2 emissions at power plants, which typically burn fossil fuels. DOTs have three primary ways to reduce CO2 emissions from lighting, all of which reduce the amount of electricity drawn from the grid:
1. Use more efficient lighting technologies, providing the same amount of light with less energy
2. Reduce the amount of lighting (in hours or intensity of light)
3. Power lighting with electricity generated from carbon-free renewable sources such as solar cells and wind turbines
2.1. Efficient Lighting Technologies Many DOTs have already upgraded to more efficient lighting types for street lights, traffic signals, and message signs. For example, low pressure sodium (LPS) street lights have replaced some high pressure sodium (HPS) street lights. LED traffic signals and message boards have replaced incandescent ones. Estimating the carbon impact of switching from one technology to another is straightforward. The reduction in watts of installed lighting determines the impact on emissions. Table 1 in the Quick Reference section compares the average electricity consumption and carbon emissions of different lighting types relative to light output. Tables 2 and 3 compare the average electricity consumption and carbon emissions of different technologies for traffic signals and changeable message signs.
See Quick Reference Section 8.1 for a comparison of carbon emissions by lighting type
Because different lighting technologies produce light of different qualities, a lighting technician should determine in which contexts different lighting technologies can substitute for one another. Some lighting technologies are still in the early stages of development and have not been fully tested in all possible highway applications. This is particularly true in the case of streetlights. For example, the I-35W bridge in Minneapolis is the first major interstate lighting project to use LEDs. The lighting will be monitored over a period of several years to determine its overall performance in terms of cost, light output, energy use, and maintenance
ICF International 3 July 2010
Electricity Use in Roadways
ICF International 4 July 2010
requirements.1 LEDs are considered a proven technology for traffic signals and changeable message signs.
Examples of DOTs using more efficient street lights include the following:
• Arizona DOT researched the agency’s ability to substitute different lighting types along highways. To light one mile of highway, the agency determined the following possible lighting configurations:
o Nineteen 400 watt high pressure sodium (HPS) lamps, emitting 25,267 kg CO2 per year
o Thirty 180 watt low pressure sodium (LPS) lamps, emitting 21,550 kg CO2 per year
o Twenty-one 400 watt metal halide (MH) lamps, emitting 26,633 kg CO2 per year2
• MnDOT reduced electricity consumption for street lighting on the I-35W bridge in Minneapolis by 13% by using LED lighting instead of HPS.3
• The Virginia Department of Transportation found that converting 4,752 interstate system luminaires from mercury vapor lighting to high pressure sodium lighting could yield a net present value savings of $1.2 million over the average remaining service life of the various installations, assuming the use of available Federal participation. The conversion would require less than 10 years to break even on the total investment.4
• As of 2004, Caltrans estimated that their LED traffic signals save 78 million kWh per year compared to conventional incandescent signals.
High efficiency light fixtures typically cost more than their conventional counterparts, but often pay for themselves in energy savings in the long run.
2.2. Reduce the Amount of Lighting DOTs can also save electricity and carbon emissions by reducing the amount of lighting used, by turning off lights at certain times of day, reducing the brightness of lights, or in some cases eliminating lighting altogether.
Examples of DOTs reducing street lighting include:
1 “I-35W bridge LED lighting described in DOE Gateway report,” 28 Aug 2009. http://www.ledsmagazine.com/news/6/8/17 2 Environmental Stewardship Practices, Procedures, and Policies for Highway Construction. AASHTO Center for Environemtanl
Excellence. http://environment.transportation.org/environmental_issues/construct_maint_prac/compendium/manual/3_14.aspx. CO2 estimates from GreenDOT.
3 “I-35W bridge LED lighting described in DOE Gateway report,” 28 Aug 2009. http://www.ledsmagazine.com/news/6/8/17 4 Energy Conservation in Transportation in Virginia. Alternatives for Energy Conservation in Roadway Lighting CITATION: M. H.
Hilton, 1979. Virginia Highway & Transportation Research; Federal Highway Administration. Pg. 24-p.
Electricity Use in Roadways
ICF International 5 July 2010
• NYSDOT has experimented with using vegetation at roundabouts as visual signals and concomitantly reducing the amount of lighting provided. The agency found that using this “ecoluminance” approach saved 4,000 kWh of electricity per year per roundabout. That translates to $300 in savings and 1,589 kg of CO2 emissions reduced.5
• Illinois DOT is changing to retroreflective overhead signs. The highly reflective signs allow the removal of overhead lighting. Removing all overhead sign lighting statewide will save about 8,250 MWh of electricity per year or 6.4 million kg CO2, and save $1M in electricity and maintenance costs per year. The agency estimated that all signs in the state can be replaced over a period of 10 years for about $75,000 per year. Additional savings are expected in construction projects in the future, since retroreflective signs will not need light fixtures or power supplies installed.6
• NYSDOT and TxDOT are also using retroreflective overhead signs.7
Some guidance is available to help DOTs reduce the amount of lighting used in roadway applications. Oregon DOT has produced a traffic lighting design manual to determine when light removal may be possible. AASHTO and the Illuminating Engineering Society of North America (IESNA) have promulgated new lighting standards to reduce lighting levels. WSDOT uses a lighting design software package called AGi32 to minimize the amount of lighting needed in different contexts. The analysis capability of AGi32 allows WSDOT to design illumination systems with the least number of luminaires possible to meet design and construction lighting constraints.
DOTs may also have opportunities to reduce the number of hours that traffic signals are used. For example, NYSDOT researched the possibility of placing approximately 600 regional traffic signals on flash at night. This strategy would reduce electricity consumption in traffic signals by reducing the amount of time signals are illuminated.8
Other ideas for reducing unnecessary lighting include using internally illuminated pavement markers and using motion sensors to turn on lighting only when needed.
DOTs save on electricity by reducing lighting. Illinois DOT found that retroreflective overhead signs pay for themselves in savings on electricity and maintenance in the first year of installation. Other strategies that reduce lighting are likely to produce long term cost savings, unless they include substantial capital or programmatic costs.
5 Bullough, John and Mark Rea, “Lighting and Vegetation for Energy Efficient and Safe Roadway Travel.” Prepared for
NYSERDA and NYSDOT, April 2009. CO2 impact calculated by GreenDOT. 6 “Green Friendly”. Illinois Department of Transportation. www.dot.state.il.us/Green%20Friendly%20Presentation2.ppsx. kWh
calculation assumes 8 cents per kWh. CO2 impact calculated by GreenDOT. 7 Texas Department of Transportation, “Energy Conservation Plan”, 2005; NYSDOT, “Climate Change and Energy Efficiency
Annual Report,” 2009. 8 NYSDOT, “Climate Change and Energy Efficiency Annual Report,” 2009.
Electricity Use in Roadways
ICF International 6 July 2010
2.3. Electricity from Renewable Sources DOTs can reduce the carbon intensity of the electricity they use by drawing more energy from renewable sources. The most direct way to do that is to install wind turbines, solar cells, or other sources of renewable electricity to reduce the amount of electricity drawn from the grid. A number of state DOTs already use solar cells to power lighting or message boards. Oregon DOT has a particularly ambitious solar program. In 2008, the agency completed the nation’s first installation of solar cells in a highway right of way. The solar array provides 104 kW of generation capacity to power lighting for a nearby interchange. The system is expected to reduce electricity consumption by 111,100 kWh in its first year of operation, saving nearly 48 metric tons of CO2 emissions. ODOT plans to expand its solar generation capacity substantially in the coming years.9 The recently renamed MassDOT also selected a test site for their solar covered park-n-ride area in Rockland and is currently awaiting proposals. Several DOTs including Illinois, Texas, and Massachusetts have piloted wind power at rest areas.
The impact of these strategies on CO2 emissions can be easily estimated if the amount of grid electricity offset is known. Carbon emissions associated with renewable energy are effectively zero.
In contrast to installing more efficient lighting types or reducing the amount of lighting on roadways, installing solar cells and wind turbines is less likely to produce cost savings in the long term. These strategies involve large upfront capital costs, which often exceed the cost savings on grid electricity accrued during the lifetime of the installation. For example, ODOT’s solar installation cost $1.28 million. At 10 cents per kWh for electricity from the grid, over a lifetime of 60 years, the installation will generate just $667,000 worth of electricity. In this particular case there is no cost impact to the DOT; the solar array is funded, owned, and operated by a private company, and ODOT purchases the electricity for the same rate it pays for grid electricity. For similar solar and wind power projects at other DOTs, specific cost implications for the agencies will depend on how projects are financed.
2.4. Research Gaps The main knowledge gaps in this area concern what changes in lighting applications can feasibly be made within the constraints of highway operations. Expertise in lighting design and highway operations is needed to propose safe and effective strategies to reduce highway electricity use.
While there are many options for efficient lighting technologies, not all are appropriate for a given application. Some lighting technologies, including LED, induction lighting, and plasma lighting, are evolving rapidly and have yet to be thoroughly tested in highway applications. More research is needed on these technologies to guide DOTs on how best to select efficient lighting types for a given context. 9 ODOT, “Oregon Solar Highway,” Sep 2009. http://www.obop.net/ODOT/HWY/OIPP/docs/Solar_Next.pdf; Advanced Energy
Systems, “Oregon Department of Transportation 104 kW Demonstration Project.” http://www.aesrenew.com/odot104kw.html. CO2 impact calculated by GreenDOT.
Electricity Use in Roadways
More research is also needed on the extent to which lighting can safely be reduced or eliminated.
More quantitative information is needed on other types of strategies as well. DOTs can estimate the amount of electricity savings available from making changes to the installation and operations of street lights, traffic signals, and message boards. For example, by how much can setting traffic signals to flash during nighttime hours reduce electricity consumption? If the impact on electricity consumption is known, the impact on carbon emissions is easily estimated using the GreenDOT tool.
ICF International 7 July 2010
On-Road Vehicles
ICF International 8 July 2010
3. On-Road Vehicles DOTs use on-road vehicles for three primary purposes:
• Passenger travel (mostly cars and light duty trucks)
• Roadway maintenance, including mowing and snow plowing (mostly light duty and medium duty trucks)
• Hauling materials and equipment (mostly medium duty and heavy duty trucks)
On-road vehicles emit CO2 from their tailpipes from the combustion of fossil fuels. If vehicles are powered by grid-electricity, they are responsible for some emissions from the generation of electricity.
Three ways that DOTs can reduce CO2 emissions from the use of on-road vehicles are:
1. Reduce vehicle miles traveled (VMT)
2. Improve the fuel economy of vehicles, either by replacing vehicles or by operating vehicles more efficiently
3. Use alternative vehicle technologies and fuels that emit less CO2 per mile
3.1. Reduce VMT Reducing vehicle activity, or the distance that vehicles are driven, is a simple way to reduce CO2 emissions. DOTs can reduce VMT by changing their operations in a number of ways.
To reduce VMT in passenger vehicles, NYSDOT instituted carpooling to project sites. NYSDOT also shared datasets with the Adirondack Park Agency to reduce the need for field trips by both Park Agency staff and NYSDOT staff.10 Providing teleconferencing capabilities can also reduce the need for staff to travel to meetings.
To reduce VMT in maintenance vehicles, DOTs can make changes to landscaping and snow removal procedures. For example, an Oregon State University study showed that adding a simple spray skirt on the rear of a de-icer truck’s spray bar improves application rates for the de-icer/anti-icer chemicals by 30 percent or more. This improvement may translate to a reduction in the number of passes needed to coat a roadway.11 Example strategies that DOTs are implementing or considering include:
• Iowa DOT has explored methods to improve the efficiency of de-icer trucks in order to reduce the number of passes needed. Methods include carrying both anti-icing and de-
10 NYSDOT, “Climate Change and Energy Efficiency Annual Report,” 2009. 11 Bruce Erickson, Oregon DOT Fleet Services Manager (Nov. 17, 2009)
On-Road Vehicles
ICF International 9 July 2010
icing materials on the same truck and fitting trucks with more precise spraying equipment.12
• Wyoming DOT reported that with the installation of snow fences, which reduce the amount of snow that collects on roadways, snow removal costs dropped by up to 50 percent along Interstate 80.13
• NYSDOT reduced miles driven on its large dump fleet 11.6% from its three year average by changing their snow and ice patrol procedures. Smaller, more fuel efficient vehicles were used for patrol.14
• Alaska DOT is designing a best management practice for snow site management. Locating snow sites closer to roads or adding additional snow sites would reduce the trip distance of snow removal trucks, saving fuel.15
Most materials hauling is associated with DOTs’ maintenance and construction activities. The simplest way to reduce VMT in materials hauling is to reduce the distances traveled, by sourcing and disposing of materials closer to construction sites. For example, an analysis of PennDOT road construction activities and materials source sites in the Pittsburgh area found that using locally sourced recycled materials (including coal ash, foundry sand, and slag) instead of virgin materials would reduce energy used in transportation by about 50%. Transferring soil from cut and fill areas is also a source of emissions. Sometimes DOTs can select pit-borrow sites that are closer to construction projects in order to minimize the distance that soil is hauled. Designing projects to minimize the amount of soil imported or exported will also help to reduce emissions from soil hauling and is usually in the DOT’s and the contractor’s best interest. Examples of DOTs reducing VMT in materials hauling include:
• NYSDOT Design and Construction staff are working together to identify waste disposal sites during design, in and near the Adirondack Northway (I-87) corridor, to help reduce trucking costs (and permits) for contractors.16
• NYSDOT is considering using salt water from a naturally occurring aquifer under the City of Syracuse as an anti-icer. Utilizing the natural salt aquifer to reduce the amount of salt purchased and shipped into Syracuse each winter will directly result in the saving of energy used to produce and ship the salt that would normally be used.17
Strategies that reduce VMT will typically save money for DOTs by reducing their fuel costs. 12 Dennis Burkheimer, Iowa DOT Snow & Ice Expert and Bob Younie, State Maintenance Engineers (Nov 19, 2009) 13 NCHRP 25-25(04): Compendium of Environmental Stewardship Practices in Construction and Maintenance http://onlinepubs.trb.org/onlinepubs/archive/NotesDocs/25-25(4)_FR.pdf 14 NYSDOT, “Climate Change and Energy Efficiency Annual Report,” 2009. 15 NCHRP 25-25(04): Compendium of Environmental Stewardship Practices in Construction and Maintenance http://onlinepubs.trb.org/onlinepubs/archive/NotesDocs/25-25(4)_FR.pdf page 3-115 16 NYSDOT, “Climate Change and Energy Efficiency Annual Report,” 2009. 17 NYSDOT, “Climate Change and Energy Efficiency Annual Report,” 2009.
On-Road Vehicles
ICF International 10 July 2010
3.2. Improve Vehicle Fuel Economy DOTs can improve the fuel economy of all on-road vehicle types by replacing existing vehicles with more fuel efficient ones, selecting smaller vehicles for individual applications, improving the maintenance of vehicles, and training drivers to operate vehicles more efficiently.
Newer vehicles are typically more fuel efficient that older ones. Smaller vehicles are typically more fuel efficient than larger ones. One strategy to improve the average fuel economy of DOTs’ fleets is to reduce the size of the fleet by getting rid of less fuel efficient vehicles. Procurement policies can be designed to maximize the fuel economy of new vehicles purchased.
Table 4 in the Quick Reference section compares the emissions of typical cars and light duty trucks by model year. While the fuel economy of the average conventional car and light duty truck has improved very little over the last two decades, new federal Corporate Average Fuel Economy (CAFE) standards will require substantial improvements in future model years. Some individual vehicle models available on the market today have much higher than average fuel economy.
Another strategy for improving the fuel economy of vehicles driven is to select the smallest and most fuel efficient vehicle for each application. Both Maryland SHA and Iowa DOT have policies to do just that. Implementing the policy might include choosing to drive a car instead of a light truck, or selecting the smallest possible maintenance vehicle or dump truck needed for a job. On the other hand, a larger vehicle can sometimes complete a job more efficiently than a smaller vehicle. For example, New Mexico DOT saved money and fuel using 10 cubic-yard dump trucks instead of 5 cubic-yard dump trucks, thereby reducing the number of trips needed for hauling jobs (and reducing VMT).18
Several types of maintenance practices can improve the fuel economy of existing vehicles. The impact of practices on fuel economy depends on the type of vehicles as well as on how vehicles were maintained previously. Specific practices include installing fuel efficient tires and maintaining tires properly inflated in order to maximize fuel economy. Tennessee DOT has considered inflating tires with nitrogen. Tires filled with nitrogen maintain tire pressure better than tires filled with conventional pumps.19 Changing vehicles’ oil regularly also helps to maintain fuel economy. Aerodynamic improvements can increase fuel economy on some larger vehicle types. Some DOTs use software to track preventative maintenance schedules for vehicles. For example, TxDOT uses FleetTrackS to forecast, plan, and record maintenance activities.20
18 Source: project survey 19 Source: project survey 20 Texas Department of Transportation, “Energy Conservation Plan”, 2005; NYSDOT, “Climate Change and Energy Efficiency
Annual Report,” 2009.
See Quick Reference Section 8.2 for a comparison of carbon emissions by vehicle model years, technology, and fuel types
On-Road Vehicles
ICF International 11 July 2010
DOTs can also improve average fuel economy by reducing vehicle idling. As a general rule of thumb, idling vehicles consume about one gallon of fuel per hour. DOTs can establish policies and procedures to reduce idling. For some vehicle types and applications, there are also technological solutions to reduce idling. Examples of DOTs reducing vehicle idling include:
• Oregon DOT incorporated anti idling technology into all new 3/4 ton,1-ton, 5 yd and 10 yd trucks.21
• Both WSDOT and NYSDOT use LED lights on trucks. The lights draw less electricity than conventional lamps so that trucks don't need to idle to keep their batteries charged.22
DOTs can train drivers to idle vehicles less, and to improve the fuel economy of vehicles by accelerating and decelerating more smoothly. Such practices are collectively known as eco-driving. Examples of DOTs implementing driver training programs include:
• Arizona DOT piloted a driver training program for snow-plow drivers to improve fuel economy. The project attempted to measure fuel performance in a real-world driving environment by establishing a 168-mile round-trip test route between two maintenance yards, on a winding route with many steep grades. The agency conducted test runs with five newly-hired drivers, both before and after the fuel training, in both automatic and manual-shift plow trucks. The driver training produced a 4.5% improvement in fuel economy for the manual transmission vehicles.23
• TxDOT educates its employees on eco-driving and energy saving maintenance practices including keeping engines properly tuned, checking and replacing air filters, keeping tires properly inflated, using the motor oil recommended by the manufacturer of the vehicle, driving at moderate speeds, accelerating and decelerating smoothly, and planning trips to minimize unnecessary mileage. 24
• Nevada DOT conducted a pilot project in 2010 on monitoring and improvement of driver behavior. The agency contracted with SmartDrive Systems to install monitoring equipment on cars, pickup trucks, plow trucks, and other medium duty vehicles. The equipment records driver behavior and uploads data to a central system. Reports on individual drivers are then provided to the DOT, so that remedial training of individual drivers can be conducted. SmartDrive has plans to develop a module that specifically analyzes the fuel savings potential of improved driving habits. Nevada DOT has decided not to renew the program, due to a lack of resources at the agency to implement driver training.
21 Bruce Ericdson, Oregon DOT Fleet Services Manager (Nov. 17, 2009) 22 NYSDOT, “Climate Change and Energy Efficiency Annual Report,” 2009. 23 ADOT,”Snowplow Simulator Training Evaluation: Potential Fuel & Drivetrain Maintenance Cost Reduction,” Final Report 635.
December 2007. 24 TxDOT Energy Conservation Plan
On-Road Vehicles
Strategies that use existing vehicles more efficiently will typically produce cost savings for DOTs. These include policies to select the most fuel efficient vehicle for each job, and many maintenance and training strategies. Anti-idling policies can reduce fuel consumption, and save on fuel costs, with very little upfront investment. Strategies that have significant capital or programmatic costs will have a longer payback period. Purchasing new vehicles is likely the most expensive way for DOTs to improve the fuel economy of vehicle fleets.
3.3. Use Alternative Vehicle Technologies and Fuels Alternative vehicle and fuel types can reduce CO2 emissions from DOTs’ on-road fleets by reducing emissions per mile. A number of alternatives to conventional gasoline and diesel-fired vehicles are available for passenger vehicles, maintenance vehicles, and heavy duty vehicles used for hauling. These include:
• Gasoline/Ethanol Flex Fuel Vehicles (FFV) – Currently available in light-duty models. These vehicles can use an ethanol/gasoline blend of up to 85% ethanol (E85).
• Hybrid Electric Vehicles (HEV) – Currently available in light-duty models. These vehicles combine a conventional combustion engine with an electric motor and battery that recovers energy normally lost in braking.
• Plug-in Hybrid Electric Vehicles (PHEV) – Previously available only as after-market conversions, the first commercial light-duty models will be available later this year. These hybrids allow for supplementary charging of the electric battery with grid electricity.
• Electric Vehicles (EV) – Electric light-duty vehicles have not been commercially available for several years. A new model be available this year.
• Compressed Natural Gas (CNG) Vehicles – Light-duty and heavy-duty vehicles powered by CNG are already part of many state DOTs’ fleets. These vehicles have typically been used for their low emissions of criteria pollutants.
In addition to these alternative vehicle types, DOTs can also use biofuels in conventional vehicles to reduce CO2 emissions. Low level blends of ethanol (with gasoline) and biodiesel (with conventional diesel) can be used in conventional vehicles with no modification to vehicle engines. Higher level blends can also be used, but may require engine modifications.
See Table 5 and Table 6 in the Quick Reference section for a comparison of CO2 emissions per mile for various alternative vehicle technology and fuel types.
Unlike strategies that reduce VMT and most strategies that improve fuel economy, strategies that use alternative vehicle technologies and fuels may not save money for DOTs in the long run. Alternative vehicles often come at a significant cost premium over conventional vehicles. For alternative fuels, the cost impact of strategies depends on the relative prices of alternative
ICF International 12 July 2010
On-Road Vehicles
ICF International 13 July 2010
and conventional fuels, which can fluctuate substantially. For example, Alabama DOT canceled its use of biodiesel because of the high cost of the fuel.25
3.4. Research Gaps The main research gaps in this area concern the degree to which VMT can be reduced through changes to operations. By how much can alternative landscaping and snow removal practices reduce miles traveled by maintenance vehicles? By how much can alternative materials management strategies reduce miles traveled by heavy duty vehicles? By how much can carpooling and other operational changes reduce passenger VMT? How widespread are opportunities to use smaller, more efficient vehicles? When these results are known, the CO2 emissions impacts of strategies can be easily estimated.
In addition, DOTs could benefit from more specific research on the potential for improving the fuel economy of their existing vehicle fleets. Individual maintenance measures, such as tire inflation, and driver training measures can improve the fuel economy of an average vehicle by several percent. For DOTs, implementing such measures means establishing new policies and procedures, as well as programs capable of tracking and enforcing their application fleet-wide. New software programs or management structures may be required to implement changes in vehicle maintenance practices. Some strategies may not be practical or cost effective to implement for particular vehicle types. In addition, implementing several measures together will likely produce different results than implementing measures separately. Further research on the fleet management efforts of DOTs would shed more light on the best ways to improve fuel economy. The SmartDrive system provides one opportunity to conduct a monitoring and training program with robust empirical data collection.
Policies and procedures that reduce idling of vehicles produce a clear fuel savings of about one gallon of fuel per hour. More research is needed to determine how much “excess” idling of DOT vehicles occurs, and by how many hours idling can be reduced. Idling is probably more common in maintenance and construction vehicles than in passenger vehicles. An inventory of vehicle idling could determine why different vehicles idle and for how long they idle on average. For example, how many hours per year are the lights on a typical DOT maintenance truck needed to illuminate worksites? The answer to that question would provide an estimate of the fuel and CO2 emissions saved from installing LED lights on trucks, thereby reducing the need for trucks to idle.
25 Source: project survey
Off-Road Equipment
ICF International 14 July 2010
4. Off-Road Equipment DOTs and their contractors use off-road equipment for roadway construction and repair, and for some routine maintenance activities such as mowing. Equipment types vary widely from handheld machinery to heavy-duty bulldozers. Off-road equipment emit CO2 from the internal combustion of liquid or gaseous fuels or, in the case of equipment powered by the electrical grid, from the off-site generation of electricity.
Three ways that DOTs can reduce CO2 emissions from the use of off-road equipment are:
1. Reduce the amount of equipment activity
2. Improve the fuel economy of equipment, either by changing equipment types or by operating equipment more efficiently
3. Use alternative engine technologies and fuels that emit less CO2 per horsepower-hour
4.1. Reduce Equipment Activity In some cases, alternative practices can reduce the need to use mechanical equipment. In landscaping, alternatives to mechanical mowing include management with herbicides (chemical management), choosing low maintenance plants that reduce the need to mow (cultural management), or introducing organisms that prey on unwanted plants (biological management).26 For example, NYSDOT modified herbicide application trucks to more efficiently spray herbicide around guide rails, reducing the need for mowing operations.27 While the use of herbicides can have other environmental consequences, this measure reduces CO2 emissions from mowers. DOTs can also change mowing practices to reduce the frequency of mowing or reduce the number of passes needed to mow a given area.
WSDOT has conducted case study research on the cost and viability of different vegetation management practices. Approaches considered include managed vegetation up to the edge of pavement, pavement edge design, cultivation, weed barriers, and non-selective herbicides. The study did not record fuel used in the various approaches.28
NYSDOT is completing a comparison of energy use in two types of roadway vegetation management: mowing and herbicide application. (The agency considers other approaches, such as “low-mow” and “no mow” vegetation not practical for right of way management).The project recorded actual fuel burned in case study applications. In addition to fuel burned in mowers and herbicide application trucks, the research also incorporated estimates of upstream energy use in vehicle and herbicide manufacture. On a lifecycle basis, herbicide application is more energy intensive per square foot of land than mowing, largely due to the energy required
26 Venner, “Draft DOT Project Descriptions for Endangered Species Act Section 7 Consultations,” unpublished. 27 NYSDOT, “Climate Change and Energy Efficiency Annual Report,” 2009. 28 Willard, Raymond et al, “Assessment of Alternatives in Vegetation Management at the Edge of Pavement,” WSDOT Research
Report WA-RD 736.1, May 2010.
Off-Road Equipment
ICF International 15 July 2010
to produce herbicide. The agency has not completed a comparison based on vehicle energy use only. The full research report is expected in the summer of 2010.29
Table 7 in the Quick Reference section provides emission rates per 100 hours of operation for the most common types of off-road equipment.
Strategies that reduce equipment activity also save on fuel costs. These strategies are likely to produce long term cost savings for DOTs.
4.2. Improve Equipment Fuel Economy DOTs and their contractors can improve the fuel economy of off-road equipment types by improving the maintenance of vehicles and by training operators to use equipment more efficiently. Improving equipment fuel economy both reduces emissions of CO2 and saves on fuel costs.
Anti-idling policies and training reduce unnecessary emissions from equipment idling. For example, NYSDOT implemented a limitation of three minutes on unnecessary idling of diesel powered construction equipment.30 A typical idling diesel engine in an onroad tractor consumes 1.2 gallons of fuel per hour at high idle and 0.6 gallons per hour at low idle.31
Training operators to use equipment more efficiently can also reduce fuel consumption. Publications from the construction industry suggest that operator training programs can reduce fuel consumption by 5% or more.32 Some specific changes to construction practices offer even larger gains in fuel economy. For example, “slot dozing”, a practice in which material is moved through trenches, can improve machine productivity by as much as 20% over conventional methods.33
Conducting regular maintenance of machinery can also improve fuel economy by several percent. Changing oil and oil filters regularly saves fuel by keeping engine parts properly lubricated, thereby improving fuel economy and reducing engine wear. Fuel economy improvements of 2 to 3 percent due to improved oil filters have been recorded in highway tests. Over-extended oil changes can cause power losses, which translate into fuel economy losses. Power losses of 18 percent due to overextended oil changes have been shown in tests of
29 Conversation with Mary O’Reilly, NYSDOT, 6/29/10. Project C-07-13: Modeling Air Quality and Energy of NYSDOT Highway
ROW Practices 30 NYSDOT, “Climate Change and Energy Efficiency Annual Report,” 2009. 31 U.S. EPA Cleaner Diesels; U.S. EPA. Study of Exhaust Emissions from Idling Heavy-Duty Diesel Trucks and Commercially
Available Idle-Reducing Devices. October 2002. http://www.epa.gov/otaq/smartway/documents/epaidlingtesting.pdf. 32 Stewart, Larry. “Production Heroes: Take the Textbook to the Trench.” Construction Equipment. April 23, 2003. Vol. 106, Iss. 4. 33 Stewart, Larry. Construction Equipment. June 2000. Vol. 101, Iss. 6.
See Quick Reference Section 8.3 for a comparison of CO2 emissions by equipment and fuel types.
Off-Road Equipment
ICF International 16 July 2010
Cummins engines.34 Likely fuel economy improvements vary by equipment type, and depend on current maintenance practices. Fleet managers can implement software tracking solutions to ensure that equipment is regularly maintained.
Finally, replacing older equipment may help to reduce CO2 emissions. Manufacturers of construction equipment report some improvements in fuel economy in newer engines, on the order of 5%.35
As with on-road vehicles, strategies that use existing equipment more efficiently will typically produce cost savings for DOTs and contractors. These include maintenance and training strategies, as well as anti-idling strategies. Purchasing new equipment is likely the most expensive way to improve fuel economy.
4.3. Use Alternative Equipment Technologies and Fuels For most equipment types, the most common engine type is either diesel or gasoline. Many equipment types are also available with engines fired by propane (or liquefied petroleum gas, LPG) or compressed natural gas (CNG). These are considered alternative fuels. The primary benefit of these equipment types is generally a reduction in emissions of criteria pollutants, with little to no benefit to reducing CO2 emissions. In fact, most LPG- and CNG-fired equipment types actually emit more CO2 per horsepower-hour than their diesel alternatives. (See Table 8 in the Quick Reference section for a comparison of emissions by engine type).
Two alternative technologies offer some CO2 reductions for specific equipment types. Hybrid diesel-electric equipment is just beginning to come to market for larger equipment types such as bulldozers and tractors. A 25% improvement in fuel economy can reasonably be expected from diesel hybrid models. Some manufacturers predict up to a 35% improvement in fuel economy.36 For smaller equipment types such as saws, pumps, and welders, grid electricity is a viable alternative energy source. Based on a national average generation mix, grid electricity emits less CO2 per horsepower-hour than liquid or gaseous fuels.
Ultimately, selection of equipment engine types depends as much on the type of job as on environmental preferences for a particular fuel type. Since diesel is the most energy-dense fuel available for off-road equipment, the largest and most powerful pieces of equipment are generally diesel-fired.
Using biofuels in construction equipment can reduce CO2 emissions without the need to change engine types. Low-level blends of ethanol with gasoline can be used in many gasoline engines, although not all engines have been thoroughly tested for compatibility. Low level blends of biodiesel with conventional diesel can be used in diesel engines. Higher level blends of biofuels, particularly E85 and B100, may require that engines be modified. Generally biofuels reduce CO2
34 U.S. EPA Cleaner Diesels; Fitch, Jim. “Clean Oil Reduces Engine Fuel Consumption.” Maintenance World. December 13,
2004. http://www.maintenanceworld.com/Articles/noria/clean-oil-fuel-consumption-poa2.htm. 35 Power Source. John Deere. Vol 4, 2005. 36 USEPA: Cleaner Diesels: Low Cost Ways to Reduce Emissions from Construction Equipment, March 2007.
Off-Road Equipment
ICF International 17 July 2010
emissions on a lifecycle basis compared to their conventional counterparts, but results vary depending on the source of the fuel. See Table 9 in the Quick Reference section for a comparison of national average CO2 emissions for biofuels versus conventional fuels.
As with on road vehicles, alternative fuels and engine technologies for off-road equipment may not save money in the long run. Hybrid engines often come at a significant cost premium over conventional engines. For alternative fuels, the cost impact of strategies depends on the relative prices of alternative and conventional fuels, which can fluctuate substantially.
4.4. Research Gaps CO2 emissions from off-road equipment are likely to be the most challenging for DOTs to estimate. Baseline emissions are typically difficult to estimate due to a lack of input data. The best available estimation method requires a level of detail on equipment operation that DOTs rarely have access to on either a pre-project or post-project basis. There is potential to develop a simpler estimation method by conducting additional research. In addition, while the range of potential mitigation measures is known, there has been little research on the impact of specific mitigation measures. Most mitigation practices to date have focused on reducing emissions of criteria pollutants.
The GreenDOT tool’s estimation methodology for off-road emissions requires that the user have one of two possible inputs: (1) total fuel consumed in construction or (2) detailed data on hours of operation by equipment type. DOTs typically do not have this information during the project design and environmental review phase. Because most construction projects are undertaken by contractors, DOTs generally do not have this information after projects are constructed either. Contractors do not report fuel consumption and activity to DOTs.
Many DOTs would like to see the development of an alternative estimation methodology based on inputs like project type, size, and duration. These factors are readily available to DOTs at the project design stage. One existing tool, the Road Construction Model, does just that. At present, DOTs can use the model to estimate the amount and type of equipment activity associated with a given construction project. The Road Construction Model’s activity estimates can then be input to GreenDOT.
The Road Construction Model is a spreadsheet model developed by the Sacramento Metropolitan Air Quality Management District (SMAQMD).37 Its primary use is to estimate construction-related air pollution emissions (criteria pollutants and CO2) associated with road and bridge projects subject to the California Environmental Quality Act (CEQA) and/or the National Environmental Policy Act (NEPA). The user inputs variables including project type, duration, size, soil type, and start year, from which the model estimates off-road emissions from operation of heavy-duty construction equipment. The Road Construction Model also estimates on-road emissions from employee trips, and from the import and/or export of fill material.
37 The Road Construction Model is free and can be downloaded at http://www.airquality.org/ceqa/index.shtml.
Off-Road Equipment
ICF International 18 July 2010
The Road Construction Model is likely to overestimate off-road emissions for many projects. The model assumes that each piece of equipment operating during a given phase of construction operates every day for eight hours. In practice, some equipment is likely used less. On the other hand, the model probably underestimates the total equipment fleet used in bridge and interchange projects. No detailed information on the scale of these discrepancies is currently available.
The Road Construction Model estimates equipment use based on data from only a handful of actual projects. The accuracy and reliability of this approach could be improved by expanding the number of sample projects and potentially developing new estimation algorithms. Equipment activity details from project records are one potential information source. A 2004 masters thesis from the University of California at Davis collected detailed equipment activity data for 30 Caltrans construction projects, sampling 6 typical project types, from engineering diaries kept by Caltrans staff; however, the hours of operation recorded in the Caltrans diaries typically reflected hours on site rather than hours of operation. Still, this data could inform an update of the model’s assumptions.
Another potential method for estimating carbon emissions from construction projects is to use fuel price adjustment factors. These are estimates of the amount of fuel used per unit of construction activity. DOTs use fuel adjustment factors for contract pricing purposes, especially when increases in fuel prices are a particular source of risk for contractors. Most states use factors originally proposed by FHWA in 1980, with some adjustments for inflation; however, the original research on volumes of fuel used has not been updated since 1974.38 While DOTs’ fuel price adjustment factors do provide some cost relief for contractors in the face of rising fuel prices, they are probably not an accurate basis for estimating actual fuel used for emissions purposes. A current NCHRP research project, NCHRP 10-81, is conducting research to update fuel usage factors. This research will likely prove useful in developing simpler methods for estimating CO2 emissions from highway construction.39
Another important knowledge gap in the estimation of emissions from construction equipment is the actual emissions per hour of operation. Emission factors in GreenDOT are derived from EPA’s NONROAD model, which is the industry standard for air quality analyses. (The Road Construction Model also uses these emissions factors). However, the load factors incorporated in NONROAD are a significant source of uncertainty. Load factors represent the average amount of engine power that a piece of equipment uses over the course of a working day, including periods of idling and inactivity. Load factors included in the NONROAD model are based on very limited empirical research.40 EPA is currently updating its research on load factors. The new load factors can be integrated into GreenDOT when they are available.
38 Holmgren, Mark et al, Evaluation Of Fuel Usage Factors In Highway Construction In Oregon, Oregon Department of
Transportation, SPR 668, May 2010. 39 Transportation Research Board, Research In Progress.
http://144.171.11.40/cmsfeed/TRBNetProjectDisplay.asp?ProjectID=2712 40 EPA (2004e). Median Life, Annual Activity, and Load Factor Values for Nonroad Engine Emissions Modeling, Retrieved March
22, 2006 from, http://www.epa.gov/otaq/models/nonrdmdl/nonrdmdl2004/420p04005.pdf
Off-Road Equipment
DOTs and their contractors could also benefit from additional research on the impact of specific mitigation measures on emissions from off-road equipment. There has been little detailed research on the impact of alternative construction and maintenance practices on equipment activity. NYSDOT’s comparison of the energy used in mowing and herbicide application is a prime example of the empirical research needed to determine the CO2 emissions associated with alternative practices. WSDOT’s parallel study could be expanded to incorporate fuel used in management of roadside vegetation. For construction activity, a survey of construction companies could produce a compendium of alternative construction techniques that reduce fuel use, such as slot dozing.
In addition, DOTs and contractors could benefit from more specific research on the potential for improving the fuel economy of their existing equipment fleets. Individual maintenance measures, such as regular oil changes, and operator training measures can improve the fuel economy of equipment by several percent. For DOTs and contractors, implementing such measures means establishing new policies and procedures, as well as programs capable of tracking and enforcing their application fleet-wide. New software programs or management structures may be required to implement changes in maintenance practices. A study evaluating the fuel economy of an equipment fleet pre- and post-implementation of a suite of strategies could establish the aggregate potential for improvements in fuel economy. Further study on the potential for reducing equipment idling, in terms of hours of excess idling in typical work applications, is also needed. Forthcoming research from EPA on typical equipment load factors may include an inventory of equipment idling patterns.
ICF International 19 July 2010
Materials
ICF International 20 July 2010
5. Materials Roadway construction is responsible for CO2 emissions not just from the equipment used in the construction process, but also in emissions embodied in the materials used. Energy used to extract, process, and transport materials results in CO2 emissions. The primary types of finished materials that make up roadways are:
• Concrete Panels – principally composed of cement, aggregate, steel, and water
• Asphalt – principally composed of bitumen and aggregate
• Cement Treated Aggregate – principally composed of cement, aggregate, and water
• Base Aggregate – composted of aggregate only
Three ways that DOTs can reduce CO2 emissions from materials used in roadway construction and repair are:
1. Reduce the volume of materials used
2. Use recycled materials that require less energy to produce than virgin materials
3. Alternative preparation practices that reduce energy use, such as warm mix asphalt
5.1. Reduce Volume of Materials Used Reducing the volume of materials used in highway construction and maintenance will reduce emissions embodied in the roadway. One technique to reduce the volume of materials used over the lifetime of the roadway is to extend the life of pavements by using longer lasting materials in initial construction or conducting timely maintenance to ensure that existing pavements will last longer. For example, WSDOT uses dowel bar retrofits to extend the life of its jointed concrete panel (JCP) roadway surfaces.41
See Table 10 in the Quick Reference Section for a comparison of average embodied emissions by type of finished material.
5.2. Recycled and Alternative Materials Recycled or waste materials can be partially or wholly substituted for most raw materials used in roadway construction, including aggregate, cement, and bitumen. (There is already a robust steel recycling industry, and most steel used in construction has some recycled content.) When compared to virgin materials, recycled materials can reduce embodied emissions in two ways. First, recycled materials require less energy to produce than virgin materials. Some recycled materials are waste products from industrial processes that would otherwise be discarded. The emissions embodied in their production for construction applications are therefore effectively 41 Source: project survey.
See Quick Reference Section 8.4 for a comparison of embodied carbon emissions for various roadway materials.
Materials
zero. Other recycled materials require some minimum processing, such as crushing, to prepare them for use in construction. Second, recycled materials may be sourced closer to construction sites than virgin materials. Reducing transportation distances cuts down on energy used in transportation of materials to the construction site. Recycling these materials also eliminates the need to transport them to a waste disposal site. In some cases, recycled materials can be sourced from the construction site itself, if the project involves decommissioning an older roadway surface or structure.
Common types of recycled and alternative materials used in roadway surfaces include:
• Recycled Concrete Material (RCM) – decommissioned concrete panels or other structures can be crushed and reused as aggregate. Some energy is expended in crushing the concrete for reuse.
• Recycled Asphalt Pavement (RAP) – decommissioned asphalt surfaces can also be crushed and reused as aggregate. In addition, the bitumen inherent in the RAP can be partially substituted for virgin bitumen when RAP is used in asphalt surfaces. Some energy is expended in crushing the old asphalt for reuse.
• Foundry Sand – waste sand used to make metal castings can be used as a fine aggregate. Because foundry sand is a waste product, there are no additional emissions from production attributed to its use in roadways.
• Blast Furnace Slag – a waste product from the production of steel in blast furnaces can be used as an aggregate substitute. There are no additional emissions from production attributed to its use in roadways.
• Coal Bottom Ash – a waste product from the combustion of coal can be used as an aggregate substitute. There are no additional emissions from production attributed to its use in roadways.
• Glass Cullet – crushed waste glass can be used as an aggregate substitute. Some energy is expended in crushing the glass.
• Recycled Tires/Crumb Rubber – waste tires and other rubber products can be substituted for aggregate and for bitumen in asphalt surfaces. Some energy is expended in shredding and granulating tires.
• Coal Fly Ash – a waste product from the combustion of coal can be partially substituted for cement in the production of concrete. Because it is a waste product, there are no additional emissions from production attributed to its use in roadways.
• Ground Granulated Blast Furnace Slag (GGBFS) – Blast furnace slag that has been ground into a powder can also be partially substituted for cement in concrete. Some additional energy is expended in grinding the slag.
ICF International 21 July 2010
Materials
ICF International 22 July 2010
• Ground Limestone – Although not a recycled material, ground limestone can also be partially substituted for cement in concrete. Ground limestone is less energy intensive to produce than cement.
Various other waste products can also be substituted for aggregate and cement in roadway construction. If products are usable in roadway construction with no additional processing, embodied emissions from production are generally considered to be zero.
Individual DOTs have various guidelines about the amount of recycled materials that can be substituted for virgin materials in roadway surfaces.
In addition to reducing embodied CO2 emissions, the use of recycled materials can also reduce costs for DOTs. Because many recycled materials would otherwise be discarded, they are typically available more cheaply than virgin materials. For example, Michigan DOT saved $115,000 on a $3 million project by using recycled aggregate.42 Arizona DOT saved $18 million on a highway construction project by incorporating scrap rubber.43
See Table 11-Table 14 in the Quick Reference Section for a comparison of the emissions reduction potential of different recycled materials when used in roadway construction.
5.3. Warm Mix Asphalt Warm mix asphalt (WMA) is an alternative means of preparing asphalt materials with less energy than is required for hot mix asphalt (HMA). WMA technologies reduce the viscosity of the asphalt, and thereby allow for asphalt production at lower temperatures. WMA is an accepted technology in many European countries. In the United States it is less commonly, though increasingly, used. WMA reduces energy used in the asphalt batch plant by about 30% compared to HMA.44
Cold mix asphalt (CMA) is another emerging technology that may offer additional energy savings. At present, CMA is used primarily in patching applications rather than in laying new roadway surface.
See Table 15 in the Quick Reference section for a comparison of embodied emissions in HMA and WMA pavement.
5.4. Research Gaps DOTs have many options for recycled materials and alternative preparation practices that can reduce CO2 emissions. To date, few if any DOTs have evaluated the embodied emission
42 NCHRP 25-25(04): Compendium of Environmental Stewardship Practices in Construction and Maintenance http://onlinepubs.trb.org/onlinepubs/archive/NotesDocs/25-25(4)_FR.pdf 43 NCHRP 25-25(04): Compendium of Environmental Stewardship Practices in Construction and Maintenance http://onlinepubs.trb.org/onlinepubs/archive/NotesDocs/25-25(4)_FR.pdf 44 FHWA, "Warm Mix Asphalt Technologies and Research.” http://www.fhwa.dot.gov/pavement/asphalt/wma.cfm
Materials
reduction potential of different options for roadway design. Two primary factors define viable materials strategies for DOTs:
• Engineering specifications (and physical properties of materials) – DOTs have different guidelines about which types of materials can be used, and in what proportions, in roadway materials. For emerging material types, additional research on the physical properties in different roadway applications and in different climatic conditions may help DOTs to liberalize specifications.
• Cost of materials – The cost of recycled and alternative materials determines their financial viability for use in roadway applications. In many cases, waste materials and other recycled materials are available more cheaply than virgin materials. Individual sources for materials in each state, including transportation distances, will determine the specific cost of materials.
The GreenDOT tool equips individual state DOTs to evaluate the embodied emission reduction potential of different options for materials used in roadway design. Evaluations of alternative designs according to engineering specifications in different states could inform a broader analysis of the potential for emission reductions.
Materials strategies that reduce embodied emissions across the entire lifecycle of the roadway are another potential area for research. GreenDOT’s materials module accounts for emissions embodied up to the point of materials production. The on-road and off-road modules can be used to calculate emissions through the stage of installation. Emissions from maintenance, repair, and decommissioning of roadways are not explicitly included in the model; however, the user can add additional quantities of materials and estimates of on-road and off-road vehicle activity to account for these lifecycle stages. In general, more research is needed on the ability of long-life pavement designs to minimize the amount of maintenance, repair, and reconstruction needed over long periods of time on roadway segments. While some DOTs are already exploring long-life pavement designs, there has been little research to date on the quantitative impact of these on materials and energy used in constructing and maintaining roadways.
ICF International 23 July 2010
Traffic Management
ICF International 24 July 2010
6. Traffic Management DOTs are generally not held responsible for emissions from private vehicles traveling on their facilities, but they can help to reduce those emissions by implementing congestion reduction measures. Vehicles driving under severe start-stop cycles in congested traffic use more fuel (and generate more CO2 emissions) than vehicles traveling at a steady, moderate speed.
The impact of congestion reduction strategies on CO2 emissions depends on the second-by-second changes to vehicle engine cycles. EPA’s new MOVES model includes 40 driving cycles, mapped to specific vehicle types and roadway types. The average speed of a driving cycle is used to determine the weighting of that cycle for a given road type and vehicle type, based on the average speed distribution. As a result, a user can input vehicle type, road type, and average speed, and MOVES selects a combination of default driving cycles that most closely represents the associated driving patterns.
Incident management programs are one way to reduce recurring congestion. Incident management programs work to clear traffic incidents from roadways as quickly as possible, thereby restoring the flow of traffic and reducing roadway congestion. Incident management programs may include improvements to the way that incidents are both detected and cleared. The resources required typically include service patrol fleets, towing and recovery vehicles, law enforcement fleets, and fire, medical, and HAZMAT response units. Intelligent transportation systems, such as changeable message signs that direct drivers to alternative routes, can also be used in incident management.
The impact of incident management programs on CO2 emissions can be estimated based on reductions in hours of vehicle delay and improvements in average travel speeds. In Hayward, California, an incident management program on a 9 mile stretch of I-880 saves 31 gallons of fuel and reduces 275 kg of CO2 emissions for every incident, according to estimates from the California Center for Innovative Transportation. The program costs $295,500 per year.45 In Los Angeles, an incident management program was proposed for heavy duty trucks on I-710. That program would save about 11 metric tons of CO2 per incident, according to evaluations by the University of California at Berkeley and ICF International.46 The GHG savings from individual incident management programs will vary based on traffic flow patterns, vehicle mix, and improvements in response time.
Strategies that can reduce recurring congestion include road pricing, ridesharing programs, road capacity expansions, intersection improvements, reversible lanes, HOV lanes, intelligent transportation systems, and ramp metering.
45 ITS Decision, California Center for Innovative Transportation.
http://www.calccit.org/itsdecision/serv_and_tech/Incident_management/Incident_clearance/clearance_report.htm 46 Mauch M., Ahn S., Chung K., Skabardonis A., Baseline evaluation of the Freeway Service Patrol (FSP) I-710 Big-Rig
Demonstration Program. ITS Working Paper, University of California, Berkeley. (2005). CO2 emissions from unpublished ICF analysis.
Traffic Management
ICF International 25 July 2010
Operational strategies that improve traffic flow do not always reduce GHG emissions. Emission rates for CO2 can increase at speeds above 60 mph, so strategies that result in higher freeflow highway speeds can actually increase GHG emissions. For light duty cars and trucks, CO2 emission rates MOVES reach their lowest point around 60 mph and then increase with higher speeds. Light duty vehicle CO2 emissions at 75 mph are 10-13% higher than at 60 mph, according to MOVES. CO2 emissions at high speeds are more uncertain for diesel vehicles. MOVES assumes heavy-duty vehicle CO2 emission rates decline with increasing speed, up to 75 mph. However, recent research suggests that diesel emissions can increase sharply at higher speeds.47
See Table 16 in the Quick Reference section for a comparison of average CO2 emissions per mile by average traffic speed for an urban freeway.
47 Choi, Hyung-Wook; Frey, H. Christopher, “Estimating Diesel Vehicle Emission Factors at Constant and High Speeds for Short
Road Segments,” Presentation at the 89 Annual Meeting of the Transportation Research Board, Paper #10-0382; Farzaneh, Mohamadreza; Schneider, William; Zietsman, Josias, “Field Evaluation of Carbon Dioxide Emissions at High Speeds”, Presentation at the 89 Annual Meeting of the Transportation Research Board, Paper #10-3166
Summary of Research Findings and Knowledge Gaps
7. Summary of Research Findings and Knowledge Gaps DOTs have a number of options to reduce CO2 emissions from their construction, operations, and maintenance practices. To reduce emissions from electricity used in roadways, DOTs can use more efficient lighting, reduce the amount of lighting used, or use electricity from renewable sources. To reduce emissions from on-road vehicles, DOTs can reduce VMT, improve vehicle fuel economy, or use alternative propulsion technologies. To reduce emissions from off-road vehicles, DOTs can reduce equipment activity, improve fuel economy, or use alternative fuels and technologies. To reduce emissions embodied in roadway materials, DOTs can reduce the volume of materials used, use recycled and other alternative materials, and use alternative preparation practices such as warm mix asphalt.
The survey and literature review found examples of most mitigation strategies being implemented or explored by state DOTs; however, few agencies have evaluated the fuel or emissions savings potential of these measures. The table below provides major outstanding research questions in evaluating mitigation opportunities for each source of emissions.
Emissions Source
Mitigation Approach Research Needs
Electricity Efficient lighting technologies
The energy savings benefits of particular technologies are known, but the applicability of technologies in different settings is not thoroughly understood, with a few exceptions.
Reduce the amount of lighting
Some concepts, such as retroreflective signage, are well understood, but guidelines for safe reduction of lighting are generally still under development. Specific studies are needed to determine how much “excess” lighting is in the system and what are the best approaches to eliminating it.
On-Road Vehicles
Reduce VMT The principles of reducing VMT are clear, but research is needed to determine how much VMT DOTs can potentially eliminate.
Improve Vehicle Fuel Economy
Research is needed to establish the total potential fuel savings from implementation of improved fleet management programs, including driver training and improved maintenance. Research is needed to determine the amount of “excess” idling that can be reduced in on-road vehicles.
Off-Road Vehicles
Reduce Equipment Activity
More research is needed to determine how much fuel alternative landscaping practices can save. Research is needed to determine the full range of alternative construction practices that can reduce equipment activity.
ICF International 26 July 2010
Summary of Research Findings and Knowledge Gaps
ICF International 27 July 2010
Emissions Source
Mitigation Approach Research Needs
Improve Equipment Fuel Economy
Research is needed to establish the total potential fuel savings from implementation of improved fleet management programs, including operator training and improved maintenance. Research is needed to determine the amount of “excess” idling that can be reduced in off-road equipment.
Materials Reduce Volume of Materials Used
Research is needed to determine whether alternative roadway designs can reduce the volume of materials used in roadway construction. More research is needed to determine the potential lifecycle materials savings from long-life pavement designs.
Recycled and Alternative Materials
Research is needed to determine what specific mixing ratios and roadway designs that are feasible within engineering specifications minimize embodied emissions.
In addition to research questions about mitigation measures, there are also substantial research gaps surrounding the estimation of baseline emission from off-road equipment. The most pressing requirement is the development of a simple estimation methodology using basic inputs available during project design. DOTs could use such a methodology to inform the design of projects and to produce CO2 emissions estimates for environmental documents. The building blocks of the methodology already exist in the Road Construction Model, a tool produced for the Sacramento Air Quality Management District. An additional research project should collect and analyze more empirical data from construction projects to update the algorithms in the model. More accurate load factor estimates are also needed for off-road equipment. Some improved estimates are forthcoming from EPA.
The GreenDOT tool provides a solid basis for research into the CO2 emissions impacts of actual DOT strategies and practices. This project has uncovered many practices at state DOTs that are ripe for evaluation. Individual agencies implementing those strategies are in the best position to evaluate them using GreenDOT. In some cases, the data needed to calculate CO2 emissions may already be available. For example, agencies installing retroreflective signage have probably already calculated the amount of lamp wattage that can be removed from each sign. In other cases, some additional research may be required. For example, NYSDOT researched the possibility of placing approximately 600 regional traffic signals on flash at night, but the agency may not have estimated the amount of time that each signal would be unlit, and therefore how much electricity would be saved. Presumably a lighting or traffic engineer could estimate that impact with little additional effort. NCHRP could fund a follow on study to evaluate these and other strategy examples discussed in this report.
Summary of Research Findings and Knowledge Gaps
An evaluation study would best focus on strategies that change DOT practices in terms of lighting fixtures and amount of lighting, vehicle and equipment activity, and materials strategies. Strategies that affect vehicle and equipment fuel economy should be a lower priority. To improve on current estimates of the impact of vehicle maintenance and operator training strategies would require very detailed research efforts, including a robust methodology for collecting pre- and post-strategy fuel economy information. For example, Arizona DOT conducted a multi-year evaluation effort to estimate the fuel savings from its training program for operators of snow plows. While this information should be incorporated in any future examination of mitigation strategies, DOTs are unlikely to conduct such robust evaluations solely for the purpose of CO2 mitigation. For vehicle technology options, there is already reliable information available about the impact of strategies on a per vehicle or per mile basis. No additional research is needed to establish the potential of these strategies to reduce CO2 emissions. Still, a study to compare the potential emissions reductions from implementation of technology options versus other strategies would be useful.
In that regard, a single DOT could sponsor a comprehensive study of its available CO2 mitigation options. This research approach would help to ensure comparability of strategies, since each strategy could be evaluated on the basis of systemwide implementation within a single state. Other transportation agencies have sponsored similar studies. For example, both the Bay Area Rapid Transit District (BART) and the Los Angeles County Metropolitan Transportation Authority (Metro) have commissioned studies of GHG reduction strategies in the past several years. The Metro study covers a full range of strategies including VMT reduction, vehicle technology strategies, and energy efficiency strategies. The study will be used as a decision-making aid by the agency.
Cost-effectiveness is a key output of such studies. The cost of a strategy often determines how readily it can be implemented. A solid cost basis is important to help DOTs compare and plan for GHG mitigation strategies. Many DOTs have already estimated cost savings in terms of fuel or electricity for some strategies, but the cost data currently available for mitigation strategies does not allow for a comparison of strategies. Some costs can be judged qualitatively. Most strategies that reduce energy use will save money, but strategies that require investments in new technologies may have long payback periods or may never achieve net cost savings. Still, a comprehensive evaluation of strategies’ costs is needed. Ideally, the study would calculate the cost-effectiveness of each strategy to reduce GHG emissions.
To conduct a robust cost evaluation of each strategy, the following cost elements should be estimated:
• Capital cost of equipment
• Fuel
• Electricity
• Materials
ICF International 28 July 2010

Summary of Research Findings and Knowledge Gaps
• Labor
In addition to CO2 emissions impact and cost, future studies should consider any co-benefits or unintended negative consequences of strategies that reduce CO2 emissions. For example, the use of herbicides in vegetation management may reduce the amount of mowing needed, thereby reducing costs and CO2 emissions. But herbicides also have potential negative environmental consequences, including ecosystem disruption and water pollution, which must be balanced with these effects and their role in controlling invasive species. These effects should be considered in evaluating potential strategies.
ICF International 29 July 2010
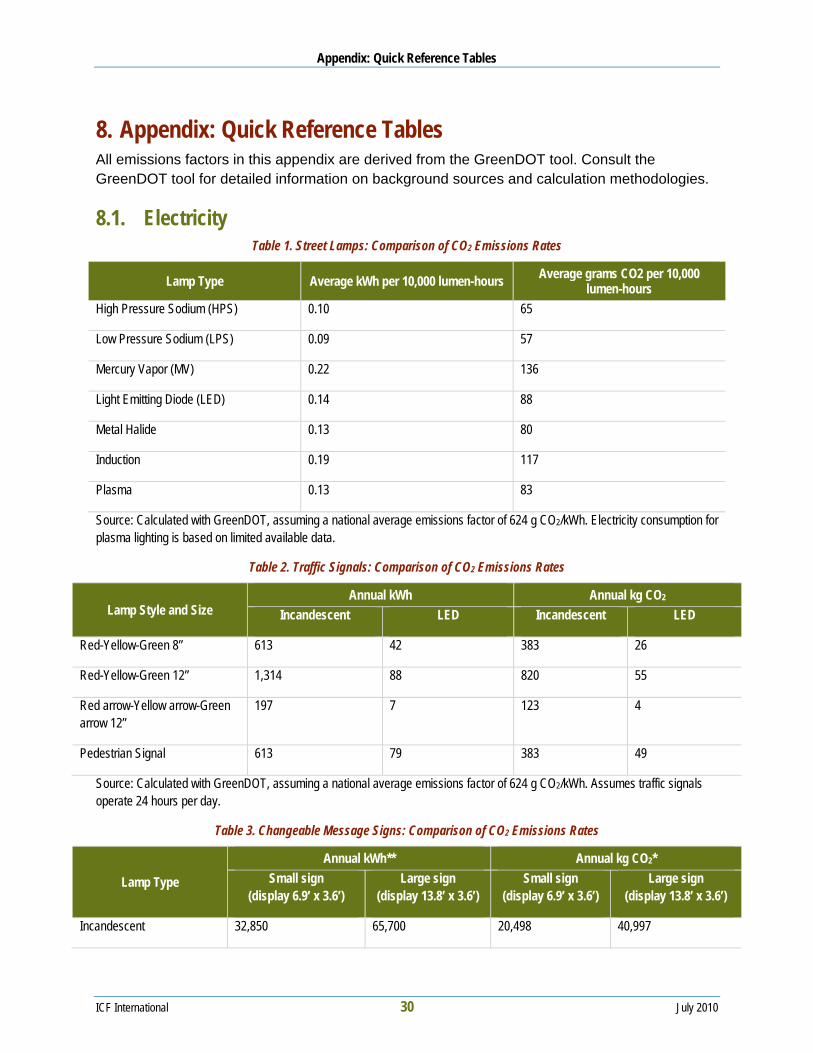
Appendix: Quick Reference Tables
8. Appendix: Quick Reference Tables All emissions factors in this appendix are derived from the GreenDOT tool. Consult the GreenDOT tool for detailed information on background sources and calculation methodologies.
8.1. Electricity Table 1. Street Lamps: Comparison of CO2 Emissions Rates
Lamp Type Average kWh per 10,000 lumen-hours Average grams CO2 per 10,000 lumen-hours
High Pressure Sodium (HPS) 0.10 65
Low Pressure Sodium (LPS) 0.09 57
Mercury Vapor (MV) 0.22 136
Light Emitting Diode (LED) 0.14 88
Metal Halide 0.13 80
Induction 0.19 117
Plasma 0.13 83
Source: Calculated with GreenDOT, assuming a national average emissions factor of 624 g CO2/kWh. Electricity consumption for plasma lighting is based on limited available data.
Table 2. Traffic Signals: Comparison of CO2 Emissions Rates
Lamp Style and Size Annual kWh Annual kg CO2
Incandescent LED Incandescent LED
Red-Yellow-Green 8” 613 42 383 26
Red-Yellow-Green 12” 1,314 88 820 55
Red arrow-Yellow arrow-Green arrow 12”
197 7 123 4
Pedestrian Signal 613 79 383 49
Source: Calculated with GreenDOT, assuming a national average emissions factor of 624 g CO2/kWh. Assumes traffic signals operate 24 hours per day.
Table 3. Changeable Message Signs: Comparison of CO2 Emissions Rates
Lamp Type
Annual kWh** Annual kg CO2* Small sign
(display 6.9’ x 3.6’) Large sign
(display 13.8’ x 3.6’) Small sign
(display 6.9’ x 3.6’) Large sign
(display 13.8’ x 3.6’)
Incandescent 32,850 65,700 20,498 40,997
ICF International 30 July 2010
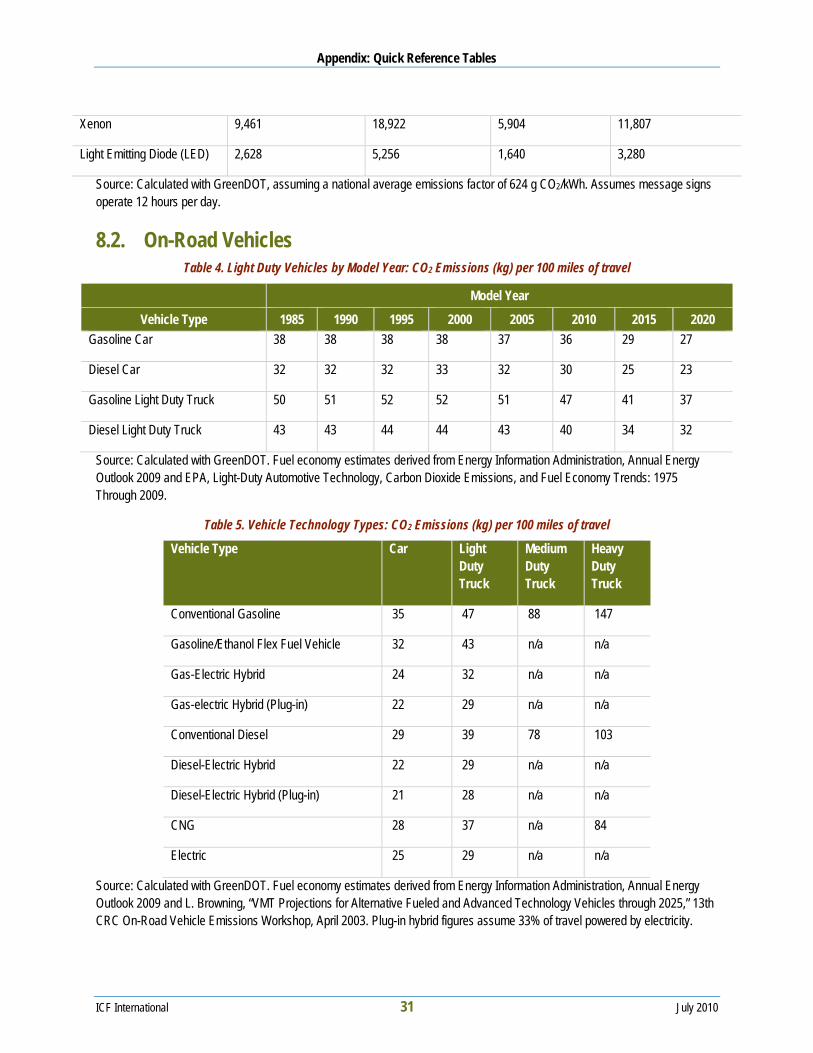
Appendix: Quick Reference Tables
Xenon 9,461 18,922 5,904 11,807
Light Emitting Diode (LED) 2,628 5,256 1,640 3,280
Source: Calculated with GreenDOT, assuming a national average emissions factor of 624 g CO2/kWh. Assumes message signs operate 12 hours per day.
8.2. On-Road Vehicles Table 4. Light Duty Vehicles by Model Year: CO2 Emissions (kg) per 100 miles of travel
Model Year
Vehicle Type 1985 1990 1995 2000 2005 2010 2015 2020 Gasoline Car 38 38 38 38 37 36 29 27
Diesel Car 32 32 32 33 32 30 25 23
Gasoline Light Duty Truck 50 51 52 52 51 47 41 37
Diesel Light Duty Truck 43 43 44 44 43 40 34 32
Source: Calculated with GreenDOT. Fuel economy estimates derived from Energy Information Administration, Annual Energy Outlook 2009 and EPA, Light-Duty Automotive Technology, Carbon Dioxide Emissions, and Fuel Economy Trends: 1975 Through 2009.
Table 5. Vehicle Technology Types: CO2 Emissions (kg) per 100 miles of travel
Vehicle Type Car Light Duty Truck
Medium Duty Truck
Heavy Duty Truck
Conventional Gasoline 35 47 88 147
Gasoline/Ethanol Flex Fuel Vehicle 32 43 n/a n/a
Gas-Electric Hybrid 24 32 n/a n/a
Gas-electric Hybrid (Plug-in) 22 29 n/a n/a
Conventional Diesel 29 39 78 103
Diesel-Electric Hybrid 22 29 n/a n/a
Diesel-Electric Hybrid (Plug-in) 21 28 n/a n/a
CNG 28 37 n/a 84
Electric 25 29 n/a n/a
Source: Calculated with GreenDOT. Fuel economy estimates derived from Energy Information Administration, Annual Energy Outlook 2009 and L. Browning, “VMT Projections for Alternative Fueled and Advanced Technology Vehicles through 2025,” 13th CRC On-Road Vehicle Emissions Workshop, April 2003. Plug-in hybrid figures assume 33% of travel powered by electricity.
ICF International 31 July 2010
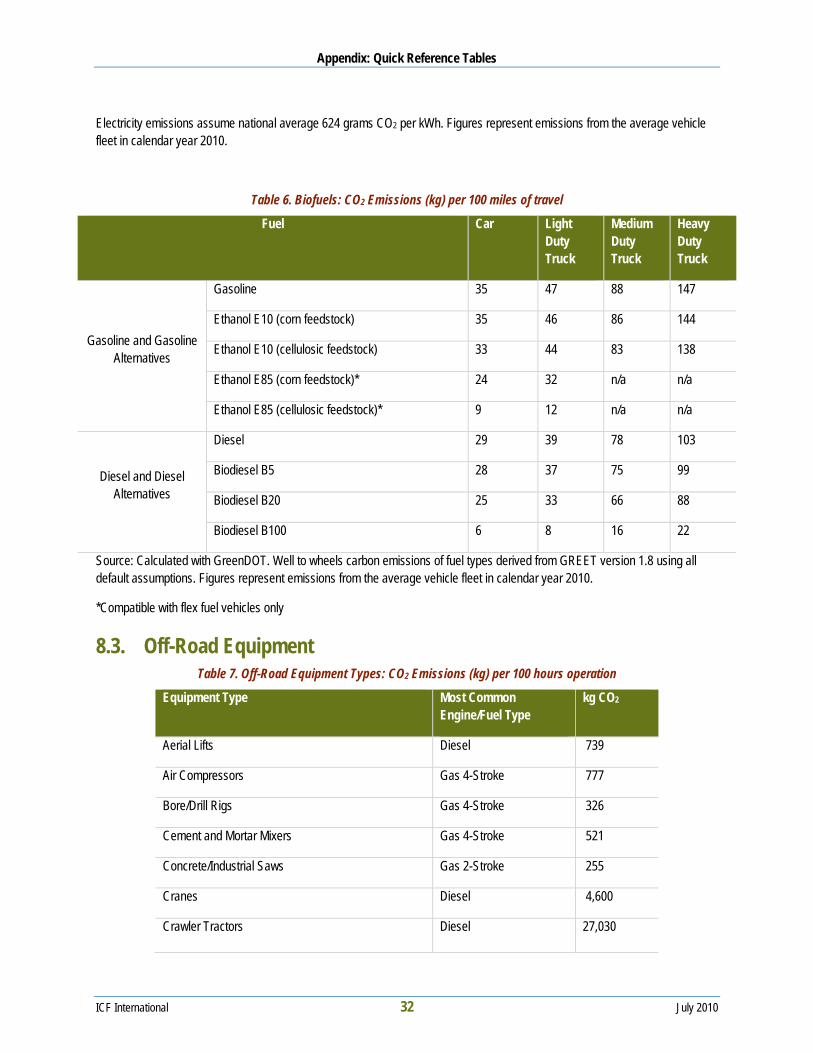
Appendix: Quick Reference Tables
Electricity emissions assume national average 624 grams CO2 per kWh. Figures represent emissions from the average vehicle fleet in calendar year 2010.
Table 6. Biofuels: CO2 Emissions (kg) per 100 miles of travel
Fuel Car Light Duty Truck
Medium Duty Truck
Heavy Duty Truck
Gasoline and Gasoline Alternatives
Gasoline 35 47 88 147
Ethanol E10 (corn feedstock) 35 46 86 144
Ethanol E10 (cellulosic feedstock) 33 44 83 138
Ethanol E85 (corn feedstock)* 24 32 n/a n/a
Ethanol E85 (cellulosic feedstock)* 9 12 n/a n/a
Diesel and Diesel Alternatives
Diesel 29 39 78 103
Biodiesel B5 28 37 75 99
Biodiesel B20 25 33 66 88
Biodiesel B100 6 8 16 22
Source: Calculated with GreenDOT. Well to wheels carbon emissions of fuel types derived from GREET version 1.8 using all default assumptions. Figures represent emissions from the average vehicle fleet in calendar year 2010.
*Compatible with flex fuel vehicles only
8.3. Off-Road Equipment Table 7. Off-Road Equipment Types: CO2 Emissions (kg) per 100 hours operation
Equipment Type Most Common Engine/Fuel Type
kg CO2
Aerial Lifts Diesel 739
Air Compressors Gas 4-Stroke 777
Bore/Drill Rigs Gas 4-Stroke 326
Cement and Mortar Mixers Gas 4-Stroke 521
Concrete/Industrial Saws Gas 2-Stroke 255
Cranes Diesel 4,600
Crawler Tractors Diesel 27,030
ICF International 32 July 2010
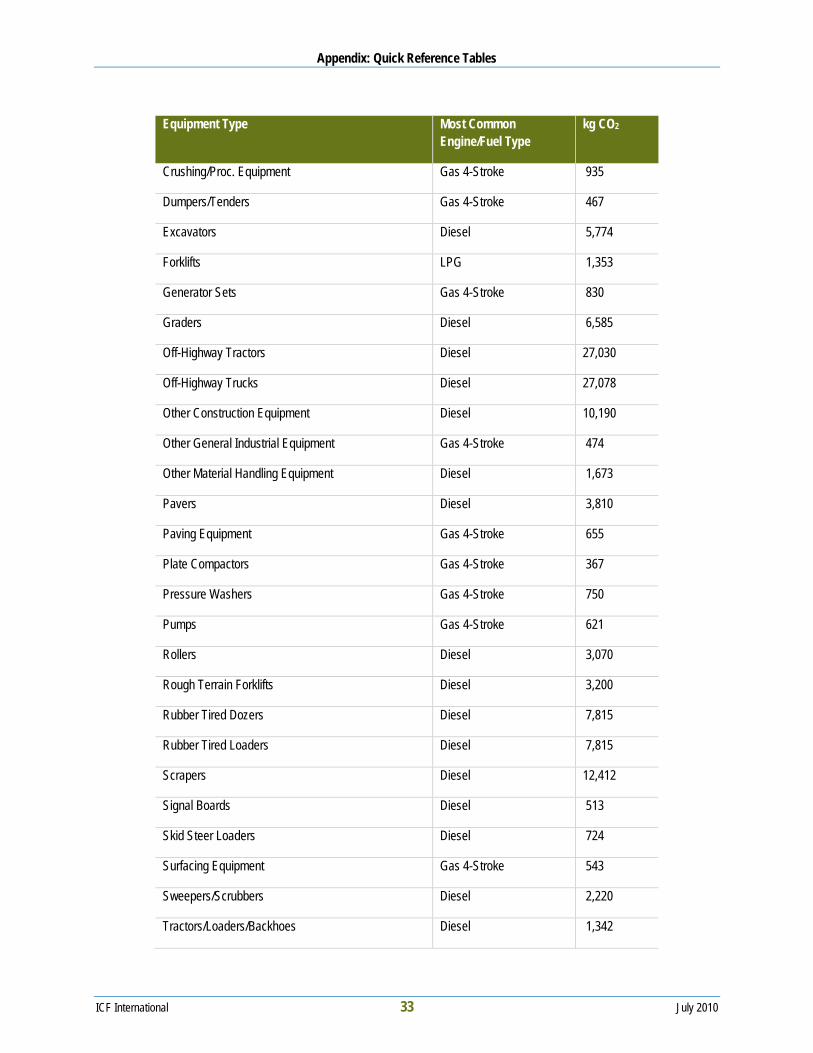
Appendix: Quick Reference Tables
ICF International 33 July 2010
Equipment Type Most Common Engine/Fuel Type
kg CO2
Crushing/Proc. Equipment Gas 4-Stroke 935
Dumpers/Tenders Gas 4-Stroke 467
Excavators Diesel 5,774
Forklifts LPG 1,353
Generator Sets Gas 4-Stroke 830
Graders Diesel 6,585
Off-Highway Tractors Diesel 27,030
Off-Highway Trucks Diesel 27,078
Other Construction Equipment Diesel 10,190
Other General Industrial Equipment Gas 4-Stroke 474
Other Material Handling Equipment Diesel 1,673
Pavers Diesel 3,810
Paving Equipment Gas 4-Stroke 655
Plate Compactors Gas 4-Stroke 367
Pressure Washers Gas 4-Stroke 750
Pumps Gas 4-Stroke 621
Rollers Diesel 3,070
Rough Terrain Forklifts Diesel 3,200
Rubber Tired Dozers Diesel 7,815
Rubber Tired Loaders Diesel 7,815
Scrapers Diesel 12,412
Signal Boards Diesel 513
Skid Steer Loaders Diesel 724
Surfacing Equipment Gas 4-Stroke 543
Sweepers/Scrubbers Diesel 2,220
Tractors/Loaders/Backhoes Diesel 1,342
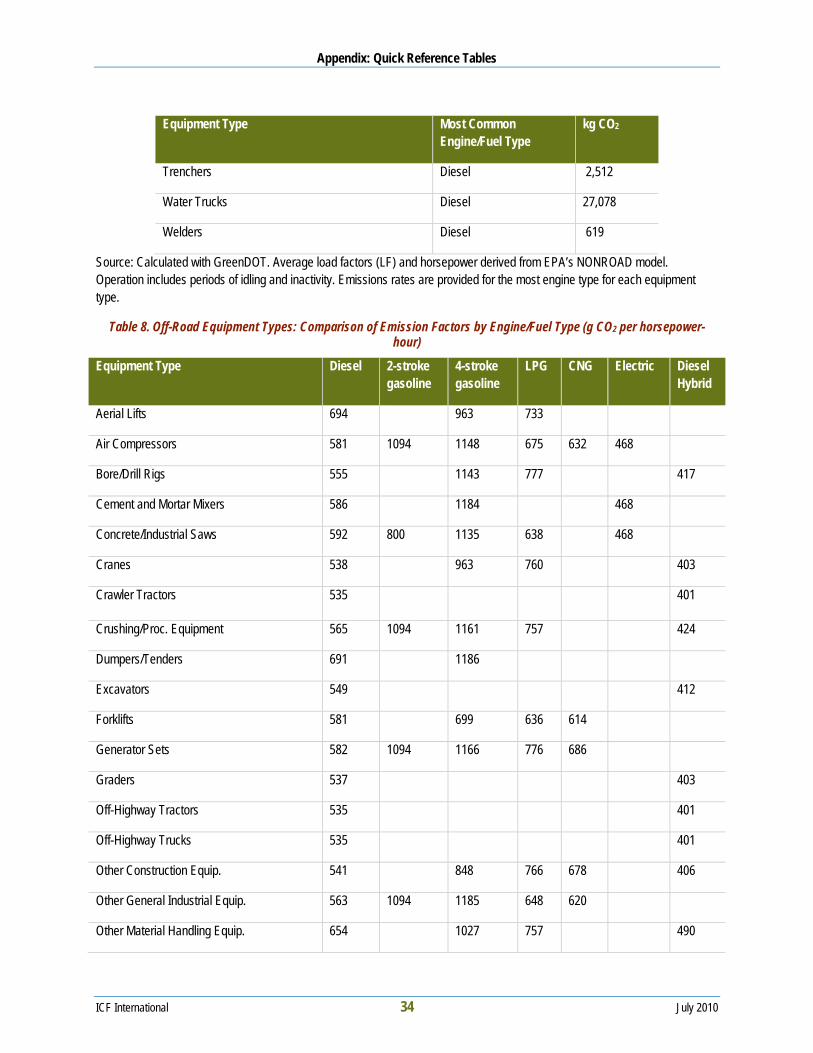
Appendix: Quick Reference Tables
ICF International 34 July 2010
Equipment Type Most Common Engine/Fuel Type
kg CO2
Trenchers Diesel 2,512
Water Trucks Diesel 27,078
Welders Diesel 619
Source: Calculated with GreenDOT. Average load factors (LF) and horsepower derived from EPA’s NONROAD model. Operation includes periods of idling and inactivity. Emissions rates are provided for the most engine type for each equipment type.
Table 8. Off-Road Equipment Types: Comparison of Emission Factors by Engine/Fuel Type (g CO2 per horsepower-hour)
Equipment Type Diesel 2-stroke gasoline
4-stroke gasoline
LPG CNG Electric Diesel Hybrid
Aerial Lifts 694 963 733
Air Compressors 581 1094 1148 675 632 468
Bore/Drill Rigs 555 1143 777 417
Cement and Mortar Mixers 586 1184 468
Concrete/Industrial Saws 592 800 1135 638 468
Cranes 538 963 760 403
Crawler Tractors 535 401
Crushing/Proc. Equipment 565 1094 1161 757 424
Dumpers/Tenders 691 1186
Excavators 549 412
Forklifts 581 699 636 614
Generator Sets 582 1094 1166 776 686
Graders 537 403
Off-Highway Tractors 535 401
Off-Highway Trucks 535 401
Other Construction Equip. 541 848 766 678 406
Other General Industrial Equip. 563 1094 1185 648 620
Other Material Handling Equip. 654 1027 757 490
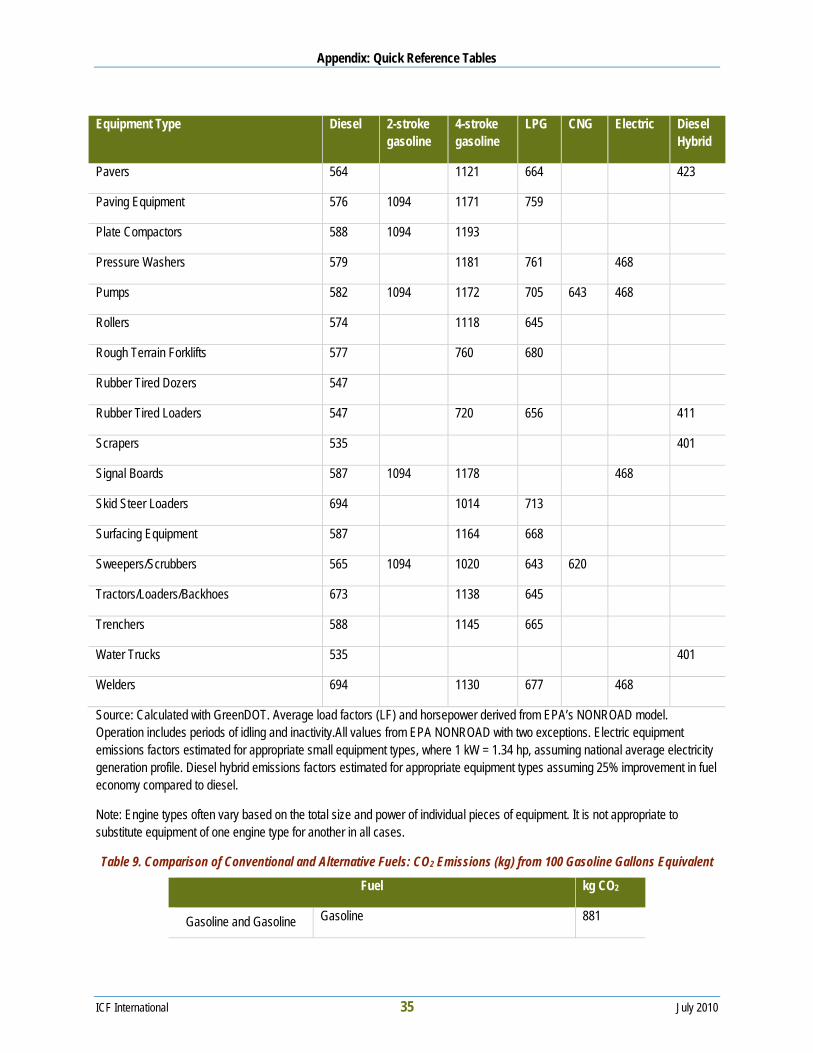
Appendix: Quick Reference Tables
ICF International 35 July 2010
Equipment Type Diesel 2-stroke gasoline
4-stroke gasoline
LPG CNG Electric Diesel Hybrid
Pavers 564 1121 664 423
Paving Equipment 576 1094 1171 759
Plate Compactors 588 1094 1193
Pressure Washers 579 1181 761 468
Pumps 582 1094 1172 705 643 468
Rollers 574 1118 645
Rough Terrain Forklifts 577 760 680
Rubber Tired Dozers 547
Rubber Tired Loaders 547 720 656 411
Scrapers 535 401
Signal Boards 587 1094 1178 468
Skid Steer Loaders 694 1014 713
Surfacing Equipment 587 1164 668
Sweepers/Scrubbers 565 1094 1020 643 620
Tractors/Loaders/Backhoes 673 1138 645
Trenchers 588 1145 665
Water Trucks 535 401
Welders 694 1130 677 468
Source: Calculated with GreenDOT. Average load factors (LF) and horsepower derived from EPA’s NONROAD model. Operation includes periods of idling and inactivity.All values from EPA NONROAD with two exceptions. Electric equipment emissions factors estimated for appropriate small equipment types, where 1 kW = 1.34 hp, assuming national average electricity generation profile. Diesel hybrid emissions factors estimated for appropriate equipment types assuming 25% improvement in fuel economy compared to diesel.
Note: Engine types often vary based on the total size and power of individual pieces of equipment. It is not appropriate to substitute equipment of one engine type for another in all cases.
Table 9. Comparison of Conventional and Alternative Fuels: CO2 Emissions (kg) from 100 Gasoline Gallons Equivalent
Fuel kg CO2
Gasoline and Gasoline Gasoline 881
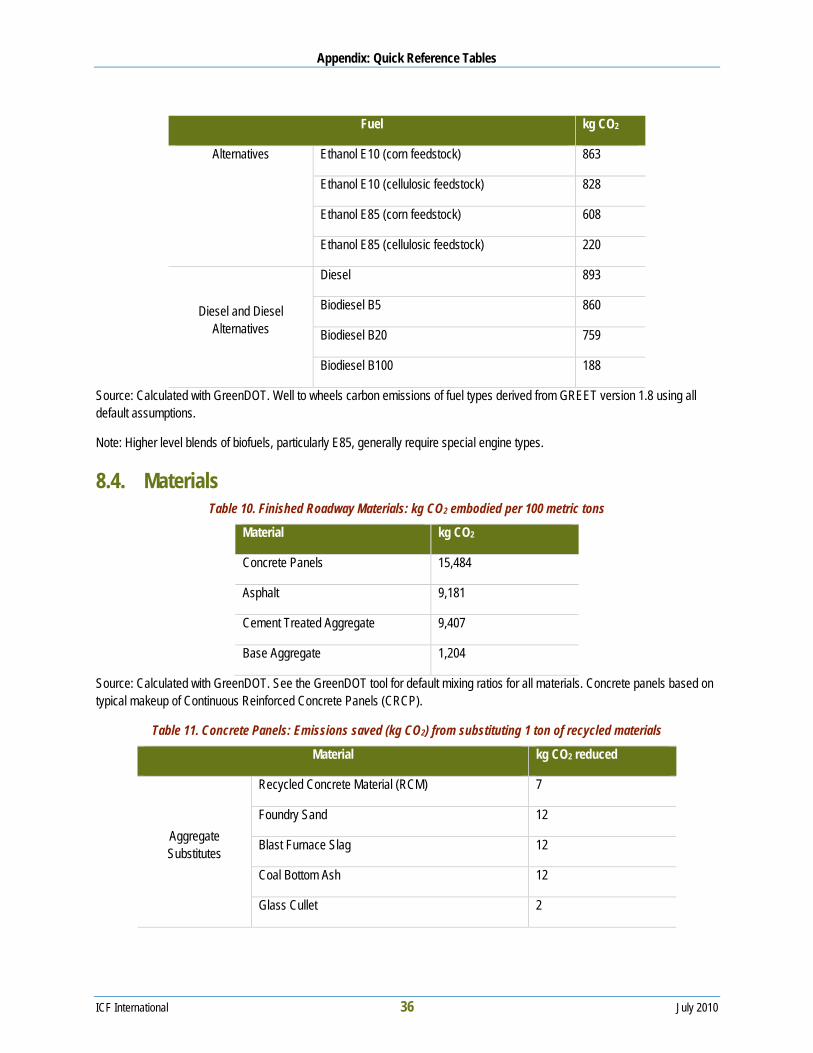
Appendix: Quick Reference Tables
ICF International 36 July 2010
Fuel kg CO2
Alternatives Ethanol E10 (corn feedstock) 863
Ethanol E10 (cellulosic feedstock) 828
Ethanol E85 (corn feedstock) 608
Ethanol E85 (cellulosic feedstock) 220
Diesel and Diesel Alternatives
Diesel 893
Biodiesel B5 860
Biodiesel B20 759
Biodiesel B100 188
Source: Calculated with GreenDOT. Well to wheels carbon emissions of fuel types derived from GREET version 1.8 using all default assumptions.
Note: Higher level blends of biofuels, particularly E85, generally require special engine types.
8.4. Materials Table 10. Finished Roadway Materials: kg CO2 embodied per 100 metric tons
Material kg CO2
Concrete Panels 15,484
Asphalt 9,181
Cement Treated Aggregate 9,407
Base Aggregate 1,204
Source: Calculated with GreenDOT. See the GreenDOT tool for default mixing ratios for all materials. Concrete panels based on typical makeup of Continuous Reinforced Concrete Panels (CRCP).
Table 11. Concrete Panels: Emissions saved (kg CO2) from substituting 1 ton of recycled materials
Material kg CO2 reduced
Aggregate Substitutes
Recycled Concrete Material (RCM) 7
Foundry Sand 12
Blast Furnace Slag 12
Coal Bottom Ash 12
Glass Cullet 2
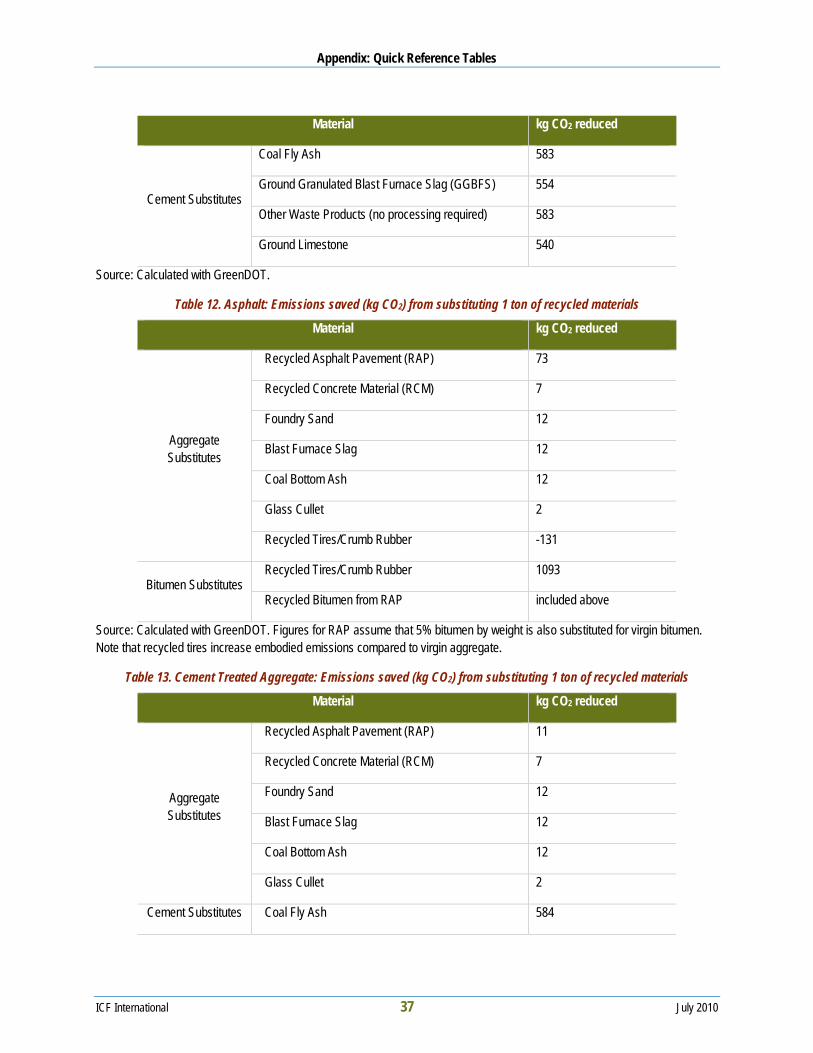
Appendix: Quick Reference Tables
ICF International 37 July 2010
Material kg CO2 reduced
Cement Substitutes
Coal Fly Ash 583
Ground Granulated Blast Furnace Slag (GGBFS) 554
Other Waste Products (no processing required) 583
Ground Limestone 540
Source: Calculated with GreenDOT.
Table 12. Asphalt: Emissions saved (kg CO2) from substituting 1 ton of recycled materials
Material kg CO2 reduced
Aggregate Substitutes
Recycled Asphalt Pavement (RAP) 73
Recycled Concrete Material (RCM) 7
Foundry Sand 12
Blast Furnace Slag 12
Coal Bottom Ash 12
Glass Cullet 2
Recycled Tires/Crumb Rubber -131
Bitumen Substitutes Recycled Tires/Crumb Rubber 1093
Recycled Bitumen from RAP included above
Source: Calculated with GreenDOT. Figures for RAP assume that 5% bitumen by weight is also substituted for virgin bitumen. Note that recycled tires increase embodied emissions compared to virgin aggregate.
Table 13. Cement Treated Aggregate: Emissions saved (kg CO2) from substituting 1 ton of recycled materials
Material kg CO2 reduced
Aggregate Substitutes
Recycled Asphalt Pavement (RAP) 11
Recycled Concrete Material (RCM) 7
Foundry Sand 12
Blast Furnace Slag 12
Coal Bottom Ash 12
Glass Cullet 2
Cement Substitutes Coal Fly Ash 584
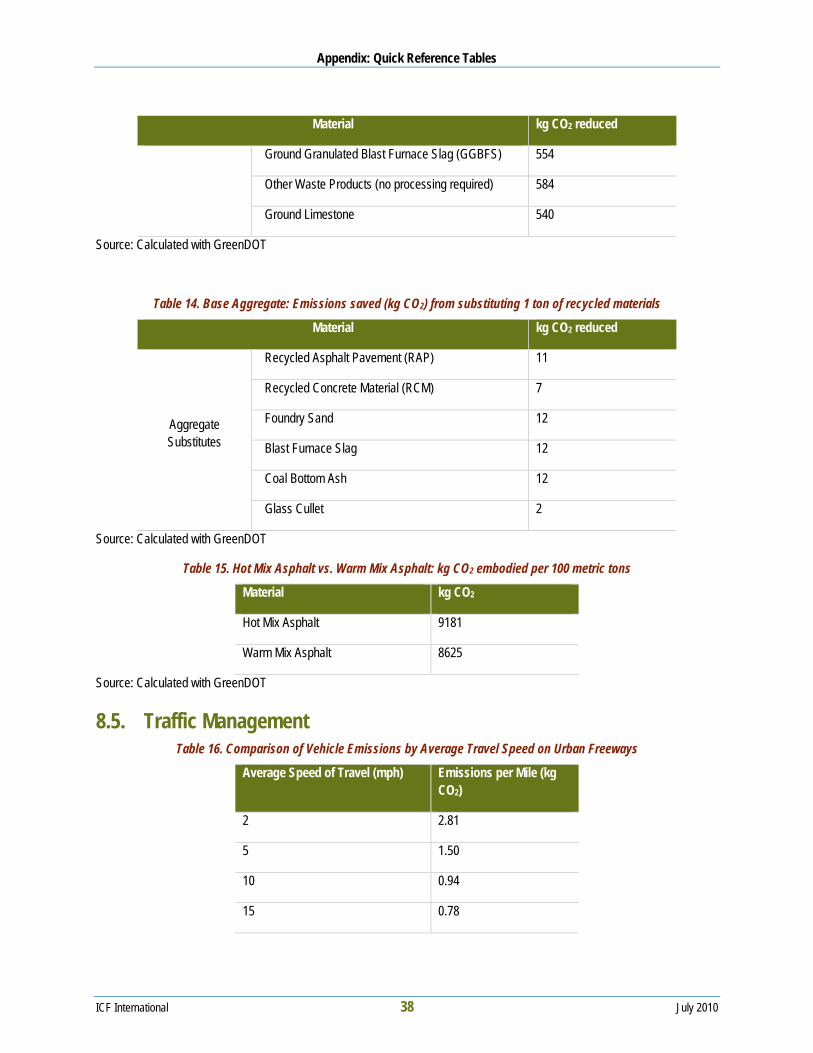
Appendix: Quick Reference Tables
ICF International 38 July 2010
Material kg CO2 reduced
Ground Granulated Blast Furnace Slag (GGBFS) 554
Other Waste Products (no processing required) 584
Ground Limestone 540
Source: Calculated with GreenDOT
Table 14. Base Aggregate: Emissions saved (kg CO2) from substituting 1 ton of recycled materials
Material kg CO2 reduced
Aggregate Substitutes
Recycled Asphalt Pavement (RAP) 11
Recycled Concrete Material (RCM) 7
Foundry Sand 12
Blast Furnace Slag 12
Coal Bottom Ash 12
Glass Cullet 2
Source: Calculated with GreenDOT
Table 15. Hot Mix Asphalt vs. Warm Mix Asphalt: kg CO2 embodied per 100 metric tons
Material kg CO2
Hot Mix Asphalt 9181
Warm Mix Asphalt 8625
Source: Calculated with GreenDOT
8.5. Traffic Management Table 16. Comparison of Vehicle Emissions by Average Travel Speed on Urban Freeways
Average Speed of Travel (mph) Emissions per Mile (kg CO2)
2 2.81
5 1.50
10 0.94
15 0.78
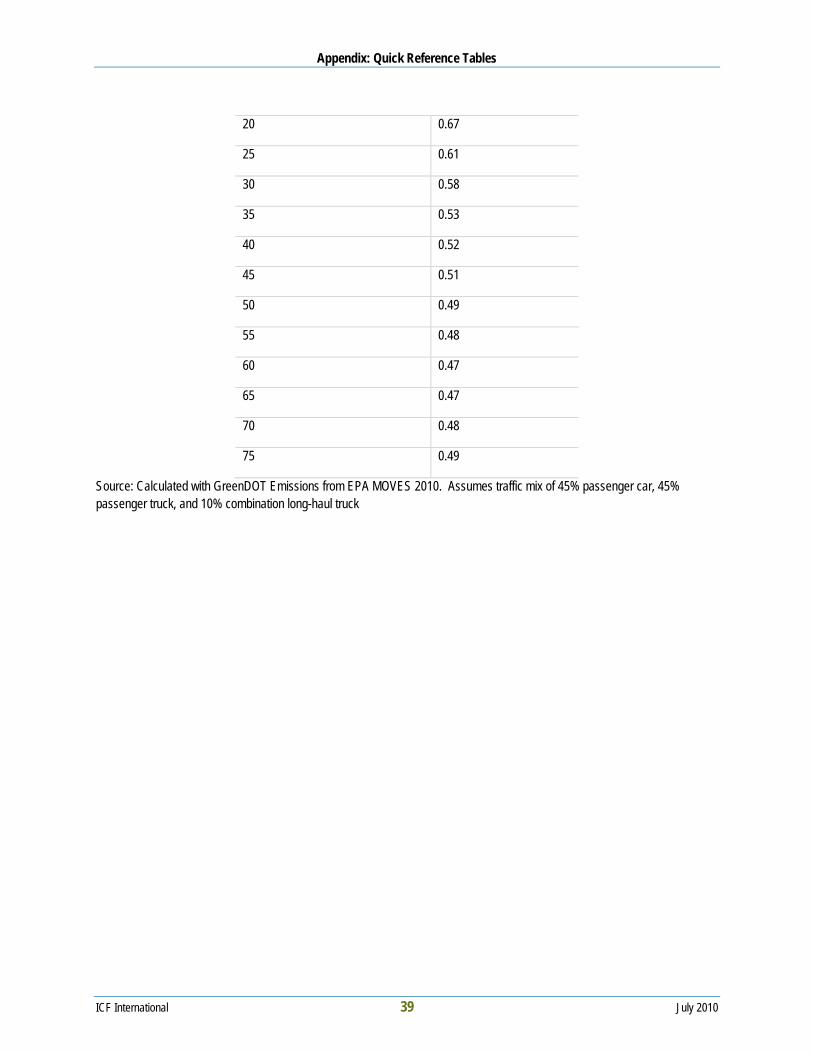
Appendix: Quick Reference Tables
ICF International 39 July 2010
20 0.67
25 0.61
30 0.58
35 0.53
40 0.52
45 0.51
50 0.49
55 0.48
60 0.47
65 0.47
70 0.48
75 0.49
Source: Calculated with GreenDOT Emissions from EPA MOVES 2010. Assumes traffic mix of 45% passenger car, 45% passenger truck, and 10% combination long-haul truck