
Grediac_Pierron_Vautrin_1994_The Iosipescu in-plane Shear Test Applied to Composites_ a New Approach...
9
ELSEVIER Composites Science and Technology 51 (1994) 409-417 ~) 1994 Elsevier Science Limited Printed in Northern Ireland. All rights reserved 0266-3538/94/$07.00 THE IOSIPESCU IN-PLANE SHEAR TEST APPLIED TO COMPOSITES: A NEW APPROACH BASED ON DISPLACEMENT FIELD PROCESSING M. GrEdiac, F. Pierron & A. Vautrin Ddpartement M~canique et Mat&iaux, Ecole Nationale Supdrieure des Mines de Saint-Etienne, 158 cours Fauriel, 42023 St-Etienne Cedex 2, France (Received 5 April 1993; revised version received 20 September 1993; accepted 18 October 1993) AImtmct A new approach to the losipescu in-plane shear test is presented. By using the principle of virtual work, a formula is derived that links the in-plane shear mod- ulus to the global applied load, geometric parameters and a contour integral of a function of the longitudinal and transverse displacements. Numerical simulations based on finite element calculations are performed in order to validate the process. The results in terms of shear moduli are better than 1% for different composite materials and coupon geometries. A numerical error simulation perturbing the displacement values dem- onstrates the stability and therefore the viability of the method. Keywords: Iosipescu test, principle of virtual work, shear modulus, finite elements, moir~ INTRODUCTION The accurate determination of the in-plane shear properties of fibre-reinforced plastics has given rise to considerable efforts on the part of the composites research community for the last twenty years. The fact that the shear behaviour of anisotropic materials in general and laminated composites in particular is independent of the tensile properties raises the need for a specific shear test. Yet, practically, a state of pure shear is very difficult to achieve, and the best that can be obtained at the present time is predominant shear, hence the great amount of effort put into the development and understanding of shear tests. The Iosipescu in-plane shear test, first developed for measuring the shear strength of metal rods, 1 has been revived by Walrath and Adams whose 'Modified Wyoming Fixture '2-6 has been the most widely studied of the Iosipescu designs. The test consists in applying a set of counteracting displace- ments on a notched coupon (Fig. 1) in order to create a state of predominant shear stress in the central area of the specimen. 409 This paper presents a numerical simulation of a new approach to Iosipescu data processing based on displacement field measurements obtained by molt6 methods. It includes a brief literature review, a theoretical part describing the method and a finite element simulation validating it for different compos- ite materials. An investigation of the stability of the method is also presented. REVIEW The classical approach to Iosipescu test strain measurements is to use 5:45 ° rosettes positioned at the specimen mid-point O. Thus, y~v = e+4s + e-4s (1) gives the value of the engineering shear strain averaged over the area of the gauge grid. The shear modulus is then calculated as follows: with Gxy = CG~PPS (2) C ~ ~s P/A P/A Gapp = xy .yav S . av/ S= ys ys where ~ and y~ are the shear stress and strain at O, P is the global force applied to the mobile part of the fixture (algebraic), A is the specimen cross-section between the notches, and Ox app is the 'apparent' modulus, that is the modulus actually measured in a test. C is the classical stress correction factor that takes into account the non-uniformity of the shear stress distribution between the notches, and S is the less classical strain correction factor that incorporates the difference between the pinpoint shear stress at O and the strain gauge reading obtained over the area of the grid.
-
Upload
rodrigo-lameiras -
Category
Documents
-
view
10 -
download
2
Transcript of Grediac_Pierron_Vautrin_1994_The Iosipescu in-plane Shear Test Applied to Composites_ a New Approach...

ELSEVIER
Composites Science and Technology 51 (1994) 409-417 ~) 1994 Elsevier Science Limited
Printed in Northern Ireland. All rights reserved 0266-3538/94/$07.00
THE IOSIPESCU IN-PLANE SHEAR TEST APPLIED TO COMPOSITES: A NEW APPROACH BASED ON
DISPLACEMENT FIELD PROCESSING
M. GrEdiac, F. Pierron & A. Vautrin Ddpartement M~canique et Mat&iaux, Ecole Nationale Supdrieure des Mines de Saint-Etienne, 158 cours Fauriel, 42023
St-Etienne Cedex 2, France
(Received 5 April 1993; revised version received 20 September 1993; accepted 18 October 1993)
AImtmct A new approach to the losipescu in-plane shear test is presented. By using the principle of virtual work, a formula is derived that links the in-plane shear mod- ulus to the global applied load, geometric parameters and a contour integral o f a function of the longitudinal and transverse displacements. Numerical simulations based on finite element calculations are performed in order to validate the process. The results in terms of shear moduli are better than 1% for different composite materials and coupon geometries. A numerical error simulation perturbing the displacement values dem- onstrates the stability and therefore the viability of the method.
Keywords: Iosipescu test, principle of virtual work, shear modulus, finite elements, moir~
INTRODUCTION
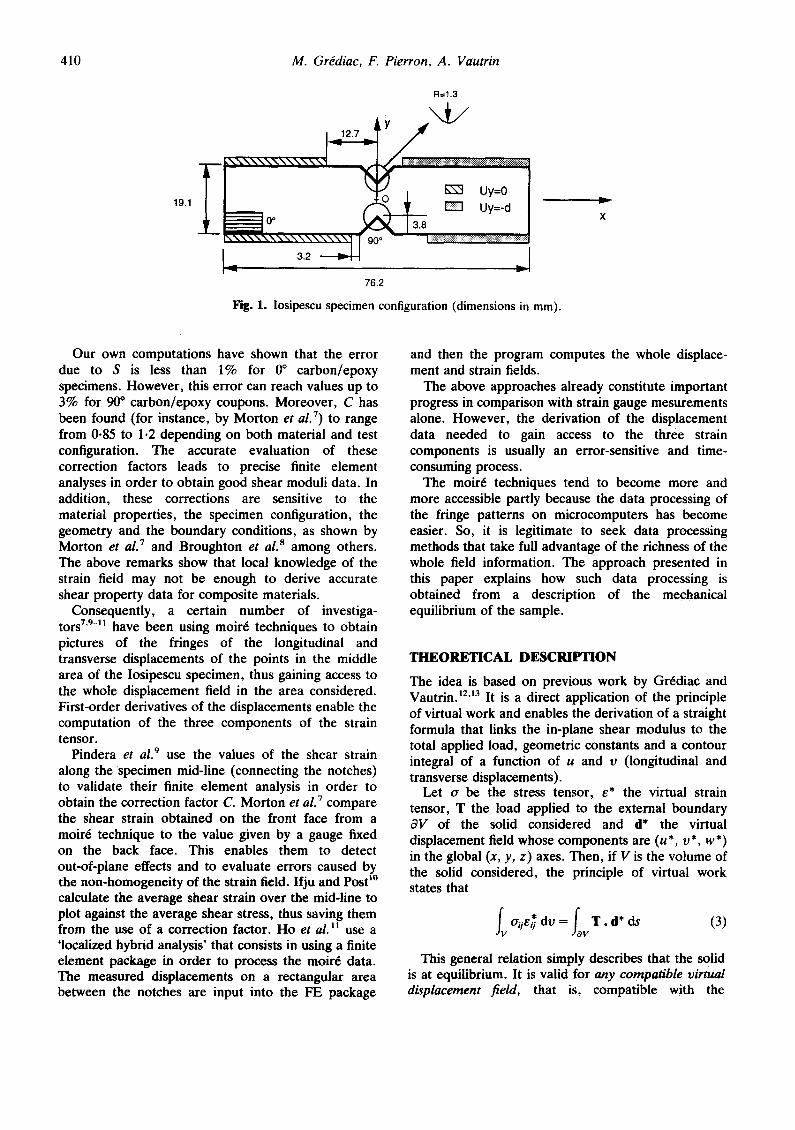
The accurate determination of the in-plane shear properties of fibre-reinforced plastics has given rise to considerable efforts on the part of the composites research community for the last twenty years. The fact that the shear behaviour of anisotropic materials in general and laminated composites in particular is independent of the tensile properties raises the need for a specific shear test. Yet, practically, a state of pure shear is very difficult to achieve, and the best that can be obtained at the present time is predominant shear, hence the great amount of effort put into the development and understanding of shear tests. The Iosipescu in-plane shear test, first developed for measuring the shear strength of metal rods, 1 has been revived by Walrath and Adams whose 'Modified Wyoming Fixture '2-6 has been the most widely studied of the Iosipescu designs. The test consists in applying a set of counteracting displace- ments on a notched coupon (Fig. 1) in order to create a state of predominant shear stress in the central area of the specimen.
409
This paper presents a numerical simulation of a new approach to Iosipescu data processing based on displacement field measurements obtained by molt6 methods. It includes a brief literature review, a theoretical part describing the method and a finite element simulation validating it for different compos- ite materials. An investigation of the stability of the method is also presented.
REVIEW
The classical approach to Iosipescu test strain measurements is to use 5:45 ° rosettes positioned at the specimen mid-point O. Thus,
y~v = e+4s + e-4s (1)
gives the value of the engineering shear strain averaged over the area of the gauge grid. The shear modulus is then calculated as follows:
with
Gxy = CG~PPS (2)
C ~ ~s P/A
P/A Gapp = xy .yav S
. av/ S = ys ys
where ~ and y~ are the shear stress and strain at O, P is the global force applied to the mobile part of the fixture (algebraic), A is the specimen cross-section between the notches, and Ox app is the 'apparent' modulus, that is the modulus actually measured in a test. C is the classical stress correction factor that takes into account the non-uniformity of the shear stress distribution between the notches, and S is the less classical strain correction factor that incorporates the difference between the pinpoint shear stress at O and the strain gauge reading obtained over the area of the grid.
410 M. Gr~diac, F. Pierron, A . Vautrin
R=1.3
19.1
i TM
0 °
3.2
90 °
3.8
Uy=O Uy=-d
_1 v l
76.2
Fig. 1. Iosipescu specimen configuration (dimensions in mm).
X
Our own computations have shown that the error due to S is less than 1% for 0 ° carbon/epoxy specimens. However, this error can reach values up to 3% for 90 ° carbon/epoxy coupons. Moreover, C has been found (for instance, by Morton et al.7) to range from 0.85 to 1.2 depending on both material and test configuration. The accurate evaluation of these correction factors leads to precise finite element analyses in order to obtain good shear moduli data. In addition, these corrections are sensitive to the material properties, the specimen configuration, the geometry and the boundary conditions, as shown by Morton et al. 7 and Broughton et al. s among others. The above remarks show that local knowledge of the strain field may not be enough to derive accurate shear property data for composite materials.
Consequently, a certain number of investiga- tors 7'9-11 have been using moir6 techniques to obtain pictures of the fringes of the longitudinal and transverse displacements of the points in the middle area of the Iosipescu specimen, thus gaining access to the whole displacement field in the area considered. First-order derivatives of the displacements enable the computation of the three components of the strain tensor.
Pindera et al. 9 use the values of the shear strain along the specimen mid-line (connecting the notches) to validate their finite element analysis in order to obtain the correction factor C. Morton et al. 7 compare the shear strain obtained on the front face from a moir6 technique to the value given by a gauge fixed on the back face. This enables them to detect out-of-plane effects and to evaluate errors caused by the non-homogeneity of the strain field. Ifju and Post TM
calculate the average shear strain over the mid-line to plot against the average shear stress, thus saving them from the use of a correction factor. Ho et al. ~1 use a 'localized hybrid analysis' that consists in using a finite element package in order to process the moir6 data. The measured displacements on a rectangular area between the notches are input into the FE package
and then the program computes the whole displace- ment and strain fields.
The above approaches already constitute important progress in comparison with strain gauge mesurements alone. However, the derivation of the displacement data needed to gain access to the three strain components is usually an error-sensitive and time- consuming process.
The moir6 techniques tend to become more and more accessible partly because the data processing of the fringe patterns on microcomputers has become easier. So, it is legitimate to seek data processing methods that take full advantage of the richness of the whole field information. The approach presented in this paper explains how such data processing is obtained from a description of the mechanical equilibrium of the sample.
THEORETICAL DESCRIPTION
The idea is based on previous work by Gr~diac and Vautrin. 12a3 It is a direct application of the principle of virtual work and enables the derivation of a straight formula that links the in-plane shear modulus to the total applied load, geometric constants and a contour integral of a function of u and v (longitudinal and transverse displacements).
Let a be the stress tensor, e* the virtual strain tensor, T the load applied to the external boundary c~V of the solid considered and d* the virtual displacement field whose components are (u*, v*, w*) in the global (x, y, z) axes. Then, if V is the volume of the solid considered, the principle of virtual work states that
oqe o dv = T . d* ds (3) V
This general relation simply describes that the solid is at equilibrium. It is valid for any compatible virtual displacement field, that is, compatible with the

The losipescu in-plane shear test applied to composites 411
v * = O
1 v* = - ( x + a )
v* = -2a
Fig. 2. Iosipescu coupon undertaking the virtual 'shearing' displacement field.
boundary conditions, and independent of any constitutive law. It is also obviously valid for the experimentally measured or 'true' displacement field. In order to underline the influence of shear, the following virtual field is chosen:
u*(x, y)=w*(x, y)=O
v*(x, y) = 0 if x -- - a
v* (x , y )=- (x +a) if - a < x < a (4)
v*(x, y) = -2a if x -> a
with a > 0. An Iosipescu coupon undertaking such a field is
shown in Fig. 2. This field is clearly compatible with the boundary conditions. All strains are zero except the shear strain in the middle region which is equal to - 1 . This corresponds to a state of pure shear.
If this virtual field is injected into eqn (3), then the right-hand side term becomes -2aP. Indeed, in the left region, the virtual displacement field is zero and in the middle region, no external load is applied.
For an orthotropic material in the orthotropy axes (x, y), % = G~yy, where Gxy is constant if elastic linear behaviour and homogeneity are assumed and ys is the true shear strain. Moreover, y* = - 1 for the virtual displacement field (eqn (4)). So, as the problem is a plane stress one, relation (3) becomes
G,,ye ~ y~ ds = 2aP (5) J S
where e is the specimen thickness and S the area of the middle section of the coupon, the only one where y, is not zero.
So, if the average shear strain ?, over S is introduced,
~q=-~ y~ dx dy (6)
then
GxyeS~s = 2ae (7)
This formula requires the somewhat laborious computing of the average of the shear strain over the area considered. This average can be advantageously transformed using Green's formula:
fa Fdl = fsdiVF dS (8) S
If we choose F = ( v , u ) , then d i v F = a v / a x + au/ay = ys where (u, v) is the true displacement field.
As d / = nd/ , where n is the vector normal to the considered path, then
l f~ (av au) ~,s = ~ -~x + --~y dx dy
1 fas ( -u sin 0 + v cos 0) dl (9) S
where 0 is the angle between n and the (O, X) axis. This can also be expressed as below:
~s = ~ s (u cos(n, y) + v cos(n, x) dl = ~ 1 (10)
So, the computing of the shear modulus now requires only the knowledge of the global load P, the thickness e, the length 2a of the region considered and the calculation of a .contour integral I of a function of the longitudinal and transverse displacements. That is:
2aP Gxy = el (11)
It is important to note that not only the amount of data to process has been considerably reduced with the introduction of this contour integral, but also that only the u and v displacements are required for its computation, thus avoiding the troublesome and rather unstable process of derivation. However, the requirements of this technique should be clearly underlined:
--homogeneity of the shear properties over the area considered
--mechanical behaviour known a priori --homogeneity of the load repartition through the
thickness
The last point is particularly important as the authors have experienced differences between the shear strains measured on the two faces of Iosipescu samples, especially with samples exhibiting large surface hardness (90 ° or cross-ply laminates, for instance), t4 However, several measurements on the two faces of the sample, even if not simultaneous, should overcome this particular problem, as addressed in Ref. 14.

412 M . G r d d i a c , F. P i e r r o n , A . V a u t r i n
~ " ~ y : t " ' r - ~ " ~ " x x - ,:: [ k J.'.,.'~ ~71 k L ~.~i k i'.,.'
i i i ! i i ! <L.;:: ' ,:~.m~;::":i i =:
...... :------i .............. ~ ..................... ~ ....../." "', " ~ ~ , - - . - . ; - - - - - i .......
....... i " T - r . ' " ' i T ~ - ' i " '~ ; ~ : ~ , ~ : ~ :,.,: Y T - ~ ..... .... ..~ ,~ - . ~ . _ . . . - _
i i ~ i i ! :: . ; , ~ . . ' ~ " % ' ~ ~ , , i !
....... i " - ~ " - - ? - ! - - ~ - - ~ i .... .- . . . . . , - . - ~ - -
-;~';~,~:~;.~:'X-z-,~:~"~," .~:x:~~t:x;~ • . . . . . . . . . . . . . . . . . . . . . . . . . . . . . . . . . . x;.~',
F i g . 3 . M e s h e d I o p e s c u s p e c i m e n .
: '~. ' -x '" ,-;.~";w" , - ' . " x " ~ " " : , g " ~ ( : ' ; g K ' ;
3 II L] LilI ] TL]L i ~ i " "
........ i...-.-.-~ ... . . . . . . . . . . . . i...-...~-....-+,-..,,., .......
i .... y--.~ ............ - ...............................
i))))ii: :::i ....... 4
~ti.~.i.!:
The rest of this paper consists of a numerical simulation of this method, together with proofs of the stability of the data processing for different composites.
NUMERICAL SIMULATION
Finite element model The model has been built using ANSYS 4.4A and is composed of 1014 quadratic plane stress bricks and triangles. The mesh is shown in Fig. 3. The boundary conditions are similar to those in Fig. 1, that is, imposed zero vertical displacements on the fixed half and constant vertical displacements on the mobile half. The mesh density is such that convergence has been reached.
Contour integral computation The contour used for the computing of the integral is shown in Fig. 4, together with representations of the
vectors on each section of the path; u cos(n, y) + v cos(n, x), and I = . f a s f d l .
normal f(u, v)=
P a t h 1: f(u, v)
Path 2:
f(u, v)
= - - U
V~ (--U + U) = y
Path 5: f ( u , v ) = v
Path 6: v~(+u -v)
f(u, v) = T
Path 7: f ( u , v ) = - u sin 0
+ v cos 0 0 between - 135 °
and - 4 5 °
Path 8: v~
f ( u , v ) = ~ - (u + v )
for this model is the
Path 3: f ( u , v ) = - u sin 0
+ v cos 0 0 between 45 °
and 135 °
Path 4: V 2 . u
f(u, v) =-- f t - - ~)
The material chosen o
unidirectional carbon/epoxy (see Table 1). Function f ( u , v ) is plotted against distance in Fig. 5,
starting from the upper left point A of the contour--see Fig. ~ and turning anticlockwise. The shear modulus is inversely proportional to the area
under the curve. The discontinuity of the normal vector between, for instance, paths 1 and 2 induces a discontinuity of the curve that appears clearly on the plot.
The load P is the sum of the reaction forces on one half of the rig. Here , P = - 2 0 0 4 N (a prescribed displacement of -0 -5 mm has been applied). The thickness e is 2.5 mm and the length 2a is 7.6 ram.
The calculated contour integral was I = - 1 - 5 1 3 x 1 0 - 6 , SO
GCaJc _ 4.027 GPa X y - -
showing a difference of about 1% from the input value of 4-0 GPa.
Path 7
Path 8
Path 1N )
P a t h 2
J
Path 6
~~Path 5
S P a t h 4
Path 3
F2• A E
Fi B . 4 . P a t h s ( a b o v e ) a n d n o r m a l v e c t o r s ( b e l o w ) .

The losipescu in-plane shear test applied to composites
Table 1. EImtk properties: inpms used for §nite dement modelling
413
Materials Lay-up Exx E , vxy Gxy (GPa) (GPa) (GPa)
Carbon/epoxy 00 135.0 9.2 0.37 4.0 " Carbon/epoxy 90 ° 9-2 135-0 0.37 4-0 " Carbon/epoxy [0, 90]s 72-3 72.3 0-007 4.0 " Glass/epoxy 0 ° 38-6 8.27 0-26 4.14 PMMA Isotropic 3-3 3.3 0-37 1.204"
" C a l c u l a t e d from E and v.
Influence of the material In order to observe the influence of the degree of anisotropy on this result, the same calculation has been performed with different materials. Only P and 1 change as the geometry of both sample and contour remains unchanged. The input elastic properties of the materials used in this study are reported in Table 1.
Table 2 gives the results of the calculations in terms of contour integral values and shear moduli. It can be seen from these results that the material does not have a significant influence on the shear modulus calculation process. This is supported by the fact that the f(u, v) plots are all very similar. As an illustration, the f(u, v) plots for the 90* carbon/epoxy and PMMA coupons are also plotted in Fig. 5. Interestingly, the calculated shear moduli are always very slightly superior to the input values. This is
certainly due to the displacement formulation of the elements used in the finite element model.
Inlluence of the geometry The validity of formula (11) does not depend on the geometry of the sample in the middle region. So, two other geometries have been tried. The idea could be to use simpler coupons, as with this method a homogeneous stress state is not necessary. This is not an attempt to change the design of the Iosipescu test, but to underline that tests designed for local strain measurements may not be the most relevant when field measurements are available.
The two geometries modelled for this study are presented in Fig. 6. For coupon 1, 2a = 14.29mm (distance between the inner loading points) and for coupon 2, 2a = 9.55 mm; the thickness is still 2-5 ram.
0,0004
E 0,0002
~ , o
~ -0,0002
-0,0004
l os lpescu 0 ° c a r b o n / e p o x y
J
0,01
D
o,o.o, i:,:.o,
Distance In m
los lpescu P M M A
0,0004
E 0,0002 _= ~ , o
~ -0,0002
-0,0004
, ,
0,01 3 0,04
Distance In m
Fig. 5. Plots off(u, v) for 0 ° carbon/epoxy and PMMA specimens (points A, B, etc., refer to Fig. 4).
414 M. Gr~diac, F. Pierron, A. Vautrin
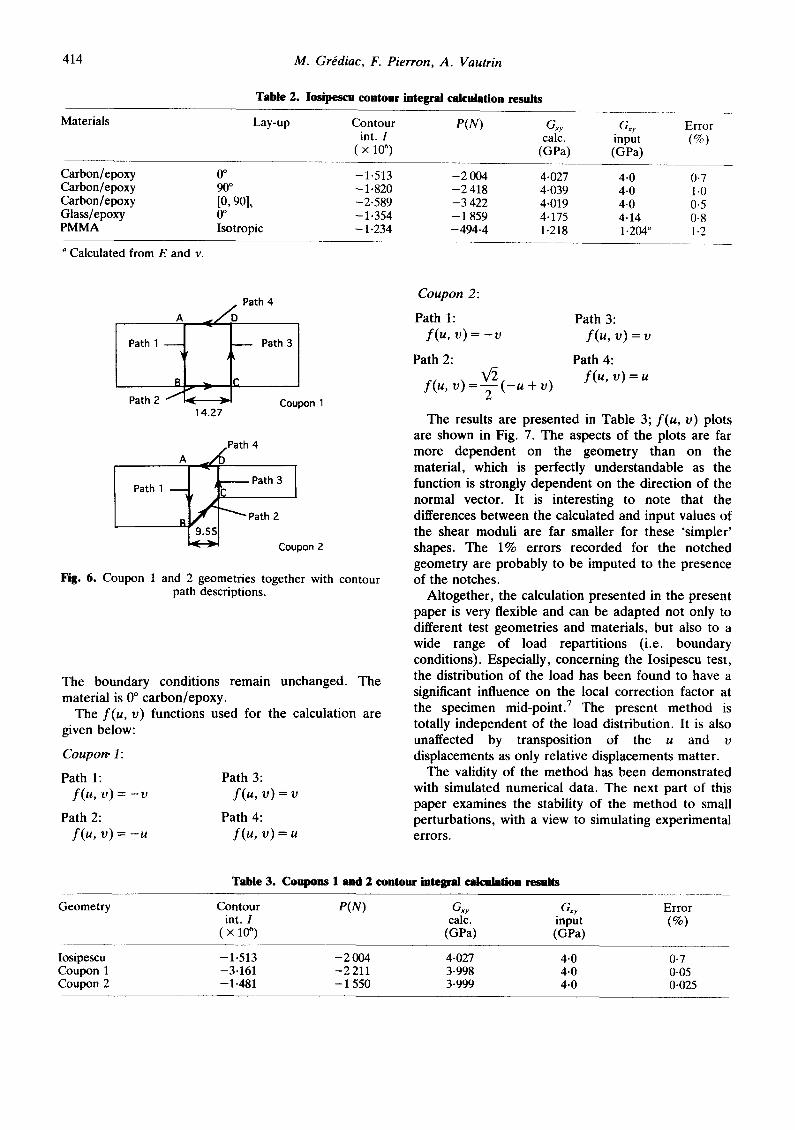
Table 2. iosil~seu contour integnd eaicallalion results Materials Lay-up Contour P( N) Gxy Gxy Error
int. I calc. input (%) ( x 10 6) (GPa) (GPa)
Carbon/epoxy Carbon/epoxy Carbon/epoxy Glass/epoxy PMMA
0 °
90 ° [0,901~ 0 o Isotropic
- 1.513 - 2 004 4.027 4-0 0.7 - 1-820 - 2 418 4.039 4-0 1.0 -2-589 - 3 422 4.019 4.0 0-5 -1-354 -1 859 4.175 4.14 0-8 - 1-234 -494.4 1.218 1.204" 1-2
"Calculated from E and v.
_ Path 4 A D _ __
~ Path 3
Path 2 f Coupon 1 14.27
Path 4
Path I
9 ~ . 5 5 -'~'Path 2
Coupon 2
Fig. 6. Coupon 1 and 2 geometries together with contour path descriptions.
The boundary conditions remain unchanged. The material is 0 ° carbon/epoxy.
The f(u, v) functions used for the calculation are given below:
Coupon, 1:
Path 1: Path 3: f(u, v) = - v f(u, v) = v
Path 2: Path 4: f ( u , v ) = - u f ( u , v ) = u
Coupon 2:
Path 1: Path 3: f ( u , v ) = - v f ( u , v ) = v
Path 2: Path 4:
f ( u , v ) = f ( u , v ) = u
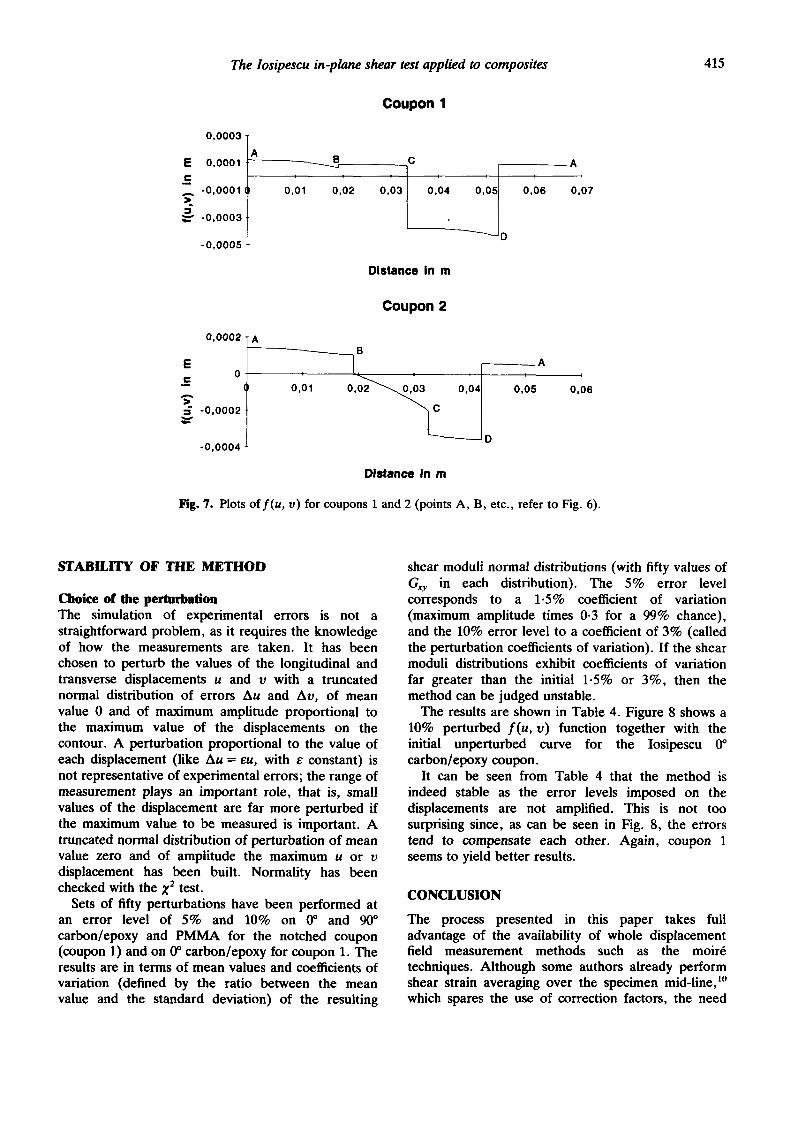
The results are presented in Table 3; f(u, v) plots are shown in Fig. 7. The aspects of the plots are far more dependent on the geometry than on the material, which is perfectly understandable as the function is strongly dependent on the direction of the normal vector. It is interesting to note that the differences between the calculated and input values of the shear moduli are far smaller for these 'simpler' shapes. The 1% errors recorded for the notched geometry are probably to be imputed to the presence of the notches.
Altogether, the calculation presented in the present paper is very flexible and can be adapted not only to different test geometries and materials, but also to a wide range of load repartitions (i.e. boundary conditions). Especially, concerning the Iosipescu test, the distribution of the load has been found to have a significant influence on the local correction factor at the specimen mid-point. 7 The present method is totally independent of the load distribution. It is also unaffected by transposition of the u and v displacements as only relative displacements matter.
The validity of the method has been demonstrated with simulated numerical data. The next part of this paper examines the stability of the method to small perturbations, with a view to simulating experimental errors.
Table 3. Coupons 1 and 2 contour integral calculation results Geometry Contour P(N) Gxy Gxy
int. I caic. input ( x 106) (GVa) (Gaa)
Error (%)
Iosipescu - 1.513 - 2 004 4.027 4-0 0-7 Coupon 1 -3.161 - 2 211 3.998 4.0 0-05 Coupon 2 -1.481 -1 550 3.999 4-0 0-025
The losipescu in-plane shear test applied to composites 415
Coupon 1
0,0003
E 0,0001 c A -0,0001 >
~" -0,0003
-0,0005
C /
i , i i i |
0,01 0,02 0,03 0,04 0,051
D
A
0,06 0,07
Distance in m
Coupon 2
0,0002
E 0 c
m
A > -0,0002
q , .
- 0 , 0 0 0 4
A . . . . . a
o
A
0,05 0,06
Distance in m
Fig. 7. Plots off(u, v) for coupons 1 and 2 (points A, B, etc., refer to Fig, 6).
STABILITY OF THE METHOD
Choice of the perturbation The simulation of experimental errors is not a straightforward problem, as it requires the knowledge of how the measurements are taken. It has been chosen to perturb the values of the longitudinal and transverse displacements u and v with a truncated normal distribution of errors Au and Av, of mean value 0 and of maximum amplitude proportional to the maximum value of the displacements on the contour. A perturbation proportional to the value of each displacement (like Au = eu, with e constant) is not representative of experimental errors; the range of measurement plays an important role, that is, small values of the displacement are far more perturbed if the maximum value to be measured is important. A truncated normal distribution of perturbation of mean value zero and of amplitude the maximum u or v displacement has been built. Normality has been checked with the X 2 test.
Sets of fiRy perturbations have been performed at an error level of 5% and 10% on 0 ° and 90 ° carbon/epoxy and PMMA for the notched coupon (coupon 1) and on 0 ° carbon/epoxy for coupon 1. The results are in terms of mean values and coefficients of variation (defined by the ratio between the mean value and the standard deviation) of the resulting
shear moduli normal distributions (with fifty values of Gxy in each distribution). The 5% error level corresponds to a 1.5% coefficient of variation (maximum amplitude times 0.3 for a 99% chance), and the 10% error level to a coefficient of 3% (called the perturbation coefficients of variation). If the shear moduli distributions exhibit coefficients of variation far greater than the initial 1-5% or 3%, then the method can be judged unstable.
The results are shown in Table 4. Figure 8 shows a 10% perturbed f(u, v) function together with the initial unperturbed curve for the Iosipescu 0 ° carbon/epoxy coupon.
It can be seen from Table 4 that the method is indeed stable as the error levels imposed on the displacements are not amplified. This is not too surprising since, as can be seen in Fig. 8, the errors tend to compensate each other. Again, coupon 1 seems to yield better results.
CONCLUSION
The process presented in this paper takes full advantage of the availability of whole displacement field measurement methods such as the moir6 techniques. Although some authors already perform shear strain averaging over the specimen mid-line, 10 which spares the use of correction factors, the need

416 M. Gr~diac, F. Pierron, A. Vautrin
Table 4. Perturbed contour integral calculation results
Materials Coupon Error G~y Gxy Coef. Pert. type level mean calc. of coeff.
(GPa) (GPa) var. of var. (%) (%)
Carbon/epoxy 0 o
Carbon/epoxy 90 °
PMMA
Carbon/epoxy 0 o
Iosipescu 5 % 4.028 4- 027 2.17 l- 5 10% 4-014 3.68 3.0
I osipescu 5 % 4.059 4.039 I. 86 1.5 10% 4-073 3.23 3-0
Iosipescu 5% 1.210 1.218 2.72 1-5 10% 1.217 5-03 3.0
Coupon 1 5% 4.004 3.998 1.74 1-5 10% 4-041 2-72 3-0
Iosipescu 0 ° carbon/epoxy
E
A >
0.0004
0.0002
-0,0002
-0,0004
J
03 0,04 .06
Distance in m
Fig. 8. 10% perturbed f(u, v) plot for 0 ° carbon/epoxy Iosipescu coupon.
for the time-consuming and error-sensitive derivation process is still present. With the technique of the boundary integral, only the displacements, that is the raw moir6 data, on a comparatively small domain are needed,, and the fewer manipulations on the data, the smaller the error levels. Moreover , the method presents the important advantage of averaging the shear properties over an area that is large compared to the scale of heterogeneity of the material, hence its advantage over the method consisting of measuring the average shear strain in the mid-section.l° It should be underlined that the approach presented here can be applied to many different test configurations.
The present paper demonstrates that the process presented is stable to measurement errors and therefore is applicable to real-life data. It is important to note that the method presented here is quite feasible as long as moir6 techniques are available. It will allow better use of molt6 data and thus more precise measurements of in-plane shear moduli.
R E F E R E N C E S
1. Iosipescu, N., New accurate procedure for single shear testing of metals, J. Mater., 2 (1967) 537-66.
2. Wairath, D. E. & Adams, D. F., The Iosipescu shear test as applied to composite materials, Exp. Mech., 23 (1983) 105-10.
3. Walrath, D. E. & Adams, D. F., Analysis of the stress state in an losipescu shear test specimen, Report No. UWME-DR-301-102-1, Department of Mechanical Engineering, University of Wyoming, 1983.
4. Walrath, D. E. & Adams, D. F., Verification and application of the losipescu shear test method, Report No. UWME-DR-401-103-1, Department of Mechanical Engineering, University of Wyoming, 1984.
5. Walrath, D. E. & Adams, D. F., Further development of the Iosipescu shear test method, Exp, Mech., 27 (1987) 113-19.
6. Wairath, D. E. & Adams, D. F,, Current status of the Iosipesco shear test method, J. Comp. Mater., 21 (1987) 494-507.
7. Morton, J., Ho, H., Tsai, M. Y. & Farley, G. L., An evaluation of the Iosipescu specimen for composite

The losipescu in-plane shear test applied to composites 417
materials shear property measurement, J. Comp. Mater., ?,6 (1992) 708-50.
8. Broughton, W., Kumosa, M. & Hull, D., Analysis of the Iosipescu shear test as applied to unidirectional carbon-fibre reinforced composites, Comp. Sci. Technol., 38 (1990) 299-325.
9. Pindera, M.-J., Ifju, P. & Post, D., Iosipescu shear characterization of polymeric and metal matrix compos- ites, Exp. Mech., 30(1), (1990) 101-8.
10. Ifju, P. & Post, D., A compact double-notched specimen for in-plane shear testing, Proc. SEM Conf., Cambridge, MA, 1989, pp. 337-42.
11. Ho, H., Tsai, M. Y., Morton, J. & Farley, G. L., An
experimental investigation of Iosipescu specimen for composite materials, Exp. Mech. (1991) 328-36.
12. Gr6diac, M. & Vautrin, A., A new method for determination of bending rigidities of thin anisotropic plates, ASME J. Appl. Mech., 57 (1990) 964-8.
13. Gr6diac, M. & Vautrin, A., Mechanical characteriza- tion of anisotropic plates: experiments and results, Europ. J. Mech. ]A Solids, 12(6), (1993) 819-38.
14. Pierron, F. & Vautrin, A., Accurate comparative determination of the in-plane shear modulus of T300/914 using the Iosipescu and 45 ° ,off-axis tests, submitted to Composites Science and Technology.


![A comparison between the Iosipescu and off-axis shear test ... · grain deviations or knots [4,5]. ... geometry but with a different load-introduction system, ... For the 60-deg-delta](https://static.fdocuments.in/doc/165x107/5feea86f34de4c64990aff51/a-comparison-between-the-iosipescu-and-off-axis-shear-test-grain-deviations.jpg)


