Great Recession of 2008 Effects on Consumer … Recession of 2008 Effects on...1 The Great Recession...
23
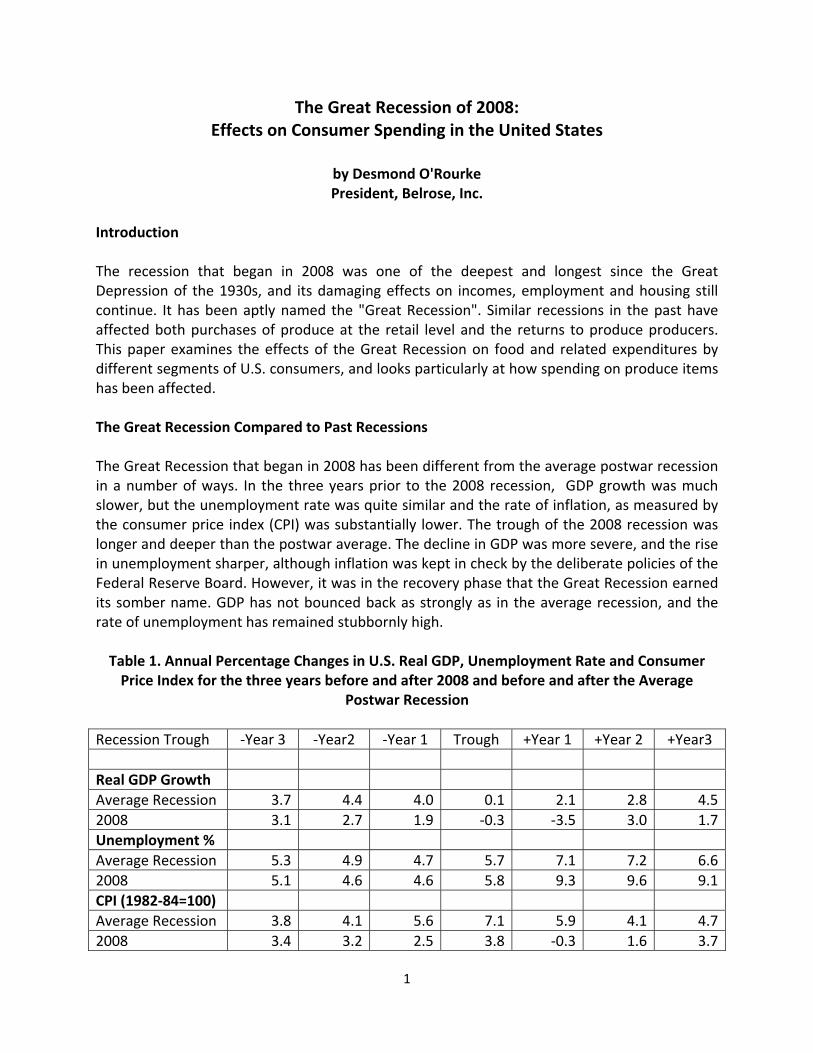
1 The Great Recession of 2008: Effects on Consumer Spending in the United States by Desmond O'Rourke President, Belrose, Inc. Introduction The recession that began in 2008 was one of the deepest and longest since the Great Depression of the 1930s, and its damaging effects on incomes, employment and housing still continue. It has been aptly named the "Great Recession". Similar recessions in the past have affected both purchases of produce at the retail level and the returns to produce producers. This paper examines the effects of the Great Recession on food and related expenditures by different segments of U.S. consumers, and looks particularly at how spending on produce items has been affected. The Great Recession Compared to Past Recessions The Great Recession that began in 2008 has been different from the average postwar recession in a number of ways. In the three years prior to the 2008 recession, GDP growth was much slower, but the unemployment rate was quite similar and the rate of inflation, as measured by the consumer price index (CPI) was substantially lower. The trough of the 2008 recession was longer and deeper than the postwar average. The decline in GDP was more severe, and the rise in unemployment sharper, although inflation was kept in check by the deliberate policies of the Federal Reserve Board. However, it was in the recovery phase that the Great Recession earned its somber name. GDP has not bounced back as strongly as in the average recession, and the rate of unemployment has remained stubbornly high. Table 1. Annual Percentage Changes in U.S. Real GDP, Unemployment Rate and Consumer Price Index for the three years before and after 2008 and before and after the Average Postwar Recession Recession Trough ‐Year 3 ‐Year2 ‐Year 1 Trough +Year 1 +Year 2 +Year3 Real GDP Growth Average Recession 3.7 4.4 4.0 0.1 2.1 2.8 4.5 2008 3.1 2.7 1.9 ‐0.3 ‐3.5 3.0 1.7 Unemployment % Average Recession 5.3 4.9 4.7 5.7 7.1 7.2 6.6 2008 5.1 4.6 4.6 5.8 9.3 9.6 9.1 CPI (1982‐84=100) Average Recession 3.8 4.1 5.6 7.1 5.9 4.1 4.7 2008 3.4 3.2 2.5 3.8 ‐0.3 1.6 3.7
-
Upload
truonghanh -
Category
Documents
-
view
215 -
download
0
Transcript of Great Recession of 2008 Effects on Consumer … Recession of 2008 Effects on...1 The Great Recession...
1
The Great Recession of 2008: Effects on Consumer Spending in the United States
by Desmond O'Rourke President, Belrose, Inc.
Introduction The recession that began in 2008 was one of the deepest and longest since the Great Depression of the 1930s, and its damaging effects on incomes, employment and housing still continue. It has been aptly named the "Great Recession". Similar recessions in the past have affected both purchases of produce at the retail level and the returns to produce producers. This paper examines the effects of the Great Recession on food and related expenditures by different segments of U.S. consumers, and looks particularly at how spending on produce items has been affected. The Great Recession Compared to Past Recessions The Great Recession that began in 2008 has been different from the average postwar recession in a number of ways. In the three years prior to the 2008 recession, GDP growth was much slower, but the unemployment rate was quite similar and the rate of inflation, as measured by the consumer price index (CPI) was substantially lower. The trough of the 2008 recession was longer and deeper than the postwar average. The decline in GDP was more severe, and the rise in unemployment sharper, although inflation was kept in check by the deliberate policies of the Federal Reserve Board. However, it was in the recovery phase that the Great Recession earned its somber name. GDP has not bounced back as strongly as in the average recession, and the rate of unemployment has remained stubbornly high. Table 1. Annual Percentage Changes in U.S. Real GDP, Unemployment Rate and Consumer Price Index for the three years before and after 2008 and before and after the Average
Postwar Recession
Recession Trough ‐Year 3 ‐Year2 ‐Year 1 Trough +Year 1 +Year 2 +Year3
Real GDP Growth
Average Recession 3.7 4.4 4.0 0.1 2.1 2.8 4.5
2008 3.1 2.7 1.9 ‐0.3 ‐3.5 3.0 1.7
Unemployment %
Average Recession 5.3 4.9 4.7 5.7 7.1 7.2 6.6
2008 5.1 4.6 4.6 5.8 9.3 9.6 9.1
CPI (1982‐84=100)
Average Recession 3.8 4.1 5.6 7.1 5.9 4.1 4.7
2008 3.4 3.2 2.5 3.8 ‐0.3 1.6 3.7
2
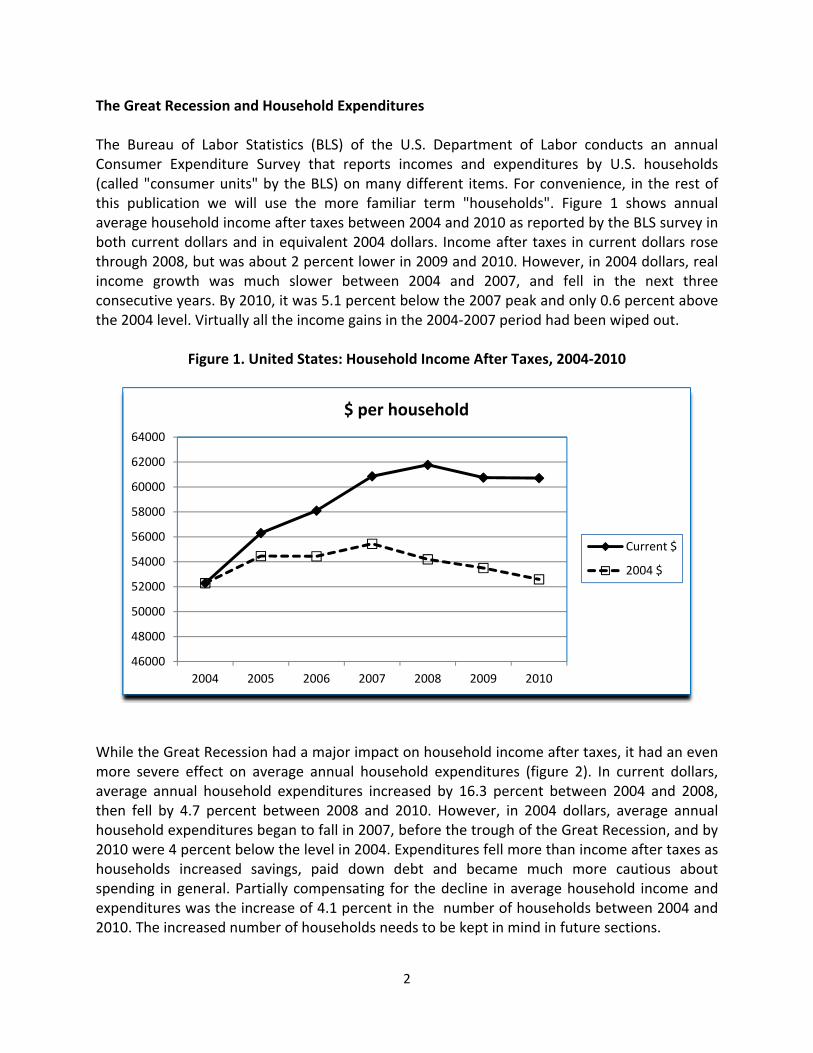
The Great Recession and Household Expenditures The Bureau of Labor Statistics (BLS) of the U.S. Department of Labor conducts an annual Consumer Expenditure Survey that reports incomes and expenditures by U.S. households (called "consumer units" by the BLS) on many different items. For convenience, in the rest of this publication we will use the more familiar term "households". Figure 1 shows annual average household income after taxes between 2004 and 2010 as reported by the BLS survey in both current dollars and in equivalent 2004 dollars. Income after taxes in current dollars rose through 2008, but was about 2 percent lower in 2009 and 2010. However, in 2004 dollars, real income growth was much slower between 2004 and 2007, and fell in the next three consecutive years. By 2010, it was 5.1 percent below the 2007 peak and only 0.6 percent above the 2004 level. Virtually all the income gains in the 2004‐2007 period had been wiped out.
Figure 1. United States: Household Income After Taxes, 2004‐2010
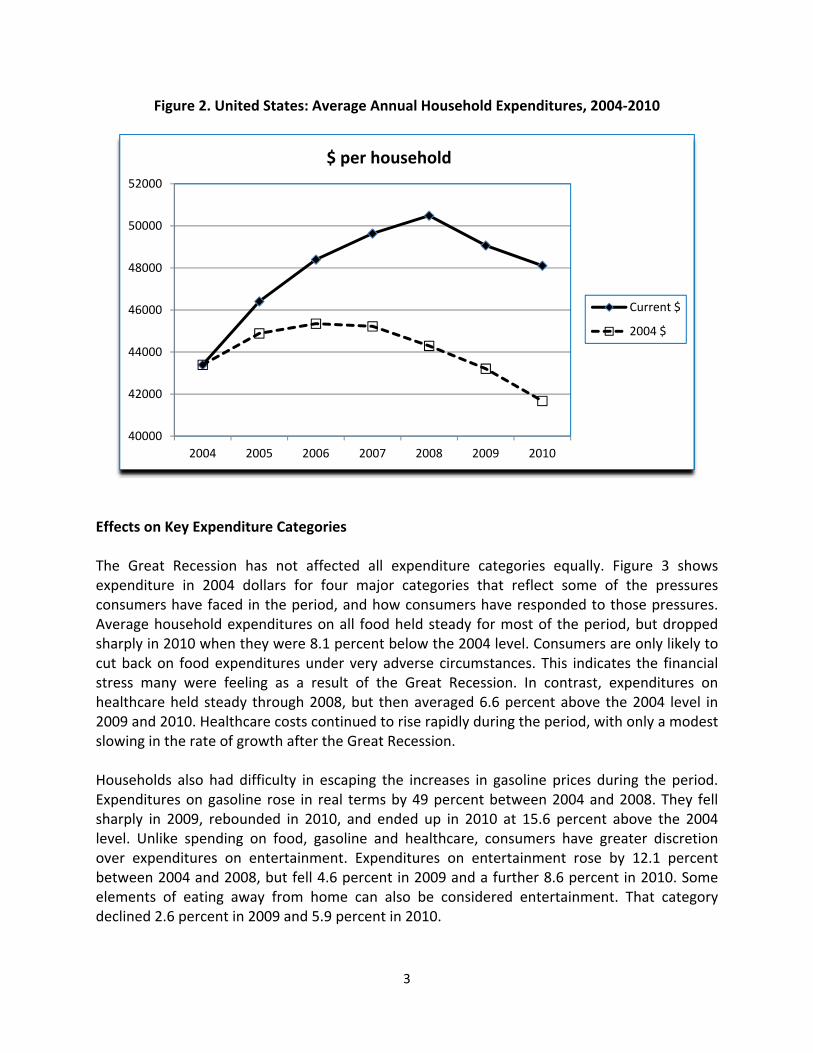
While the Great Recession had a major impact on household income after taxes, it had an even more severe effect on average annual household expenditures (figure 2). In current dollars, average annual household expenditures increased by 16.3 percent between 2004 and 2008, then fell by 4.7 percent between 2008 and 2010. However, in 2004 dollars, average annual household expenditures began to fall in 2007, before the trough of the Great Recession, and by 2010 were 4 percent below the level in 2004. Expenditures fell more than income after taxes as households increased savings, paid down debt and became much more cautious about spending in general. Partially compensating for the decline in average household income and expenditures was the increase of 4.1 percent in the number of households between 2004 and 2010. The increased number of households needs to be kept in mind in future sections.
46000
48000
50000
52000
54000
56000
58000
60000
62000
64000
2004 2005 2006 2007 2008 2009 2010
$ per household
Current $
2004 $
3
Figure 2. United States: Average Annual Household Expenditures, 2004‐2010
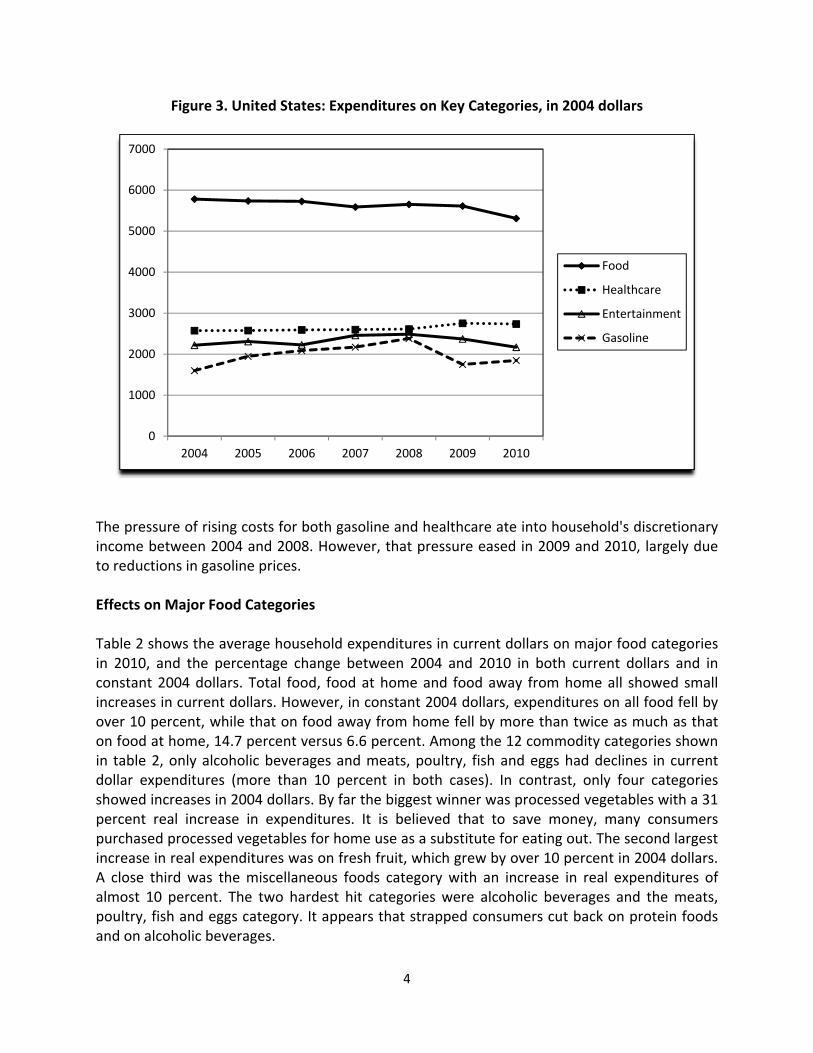
Effects on Key Expenditure Categories The Great Recession has not affected all expenditure categories equally. Figure 3 shows expenditure in 2004 dollars for four major categories that reflect some of the pressures consumers have faced in the period, and how consumers have responded to those pressures. Average household expenditures on all food held steady for most of the period, but dropped sharply in 2010 when they were 8.1 percent below the 2004 level. Consumers are only likely to cut back on food expenditures under very adverse circumstances. This indicates the financial stress many were feeling as a result of the Great Recession. In contrast, expenditures on healthcare held steady through 2008, but then averaged 6.6 percent above the 2004 level in 2009 and 2010. Healthcare costs continued to rise rapidly during the period, with only a modest slowing in the rate of growth after the Great Recession. Households also had difficulty in escaping the increases in gasoline prices during the period. Expenditures on gasoline rose in real terms by 49 percent between 2004 and 2008. They fell sharply in 2009, rebounded in 2010, and ended up in 2010 at 15.6 percent above the 2004 level. Unlike spending on food, gasoline and healthcare, consumers have greater discretion over expenditures on entertainment. Expenditures on entertainment rose by 12.1 percent between 2004 and 2008, but fell 4.6 percent in 2009 and a further 8.6 percent in 2010. Some elements of eating away from home can also be considered entertainment. That category declined 2.6 percent in 2009 and 5.9 percent in 2010.
40000
42000
44000
46000
48000
50000
52000
2004 2005 2006 2007 2008 2009 2010
$ per household
Current $
2004 $
4
Figure 3. United States: Expenditures on Key Categories, in 2004 dollars
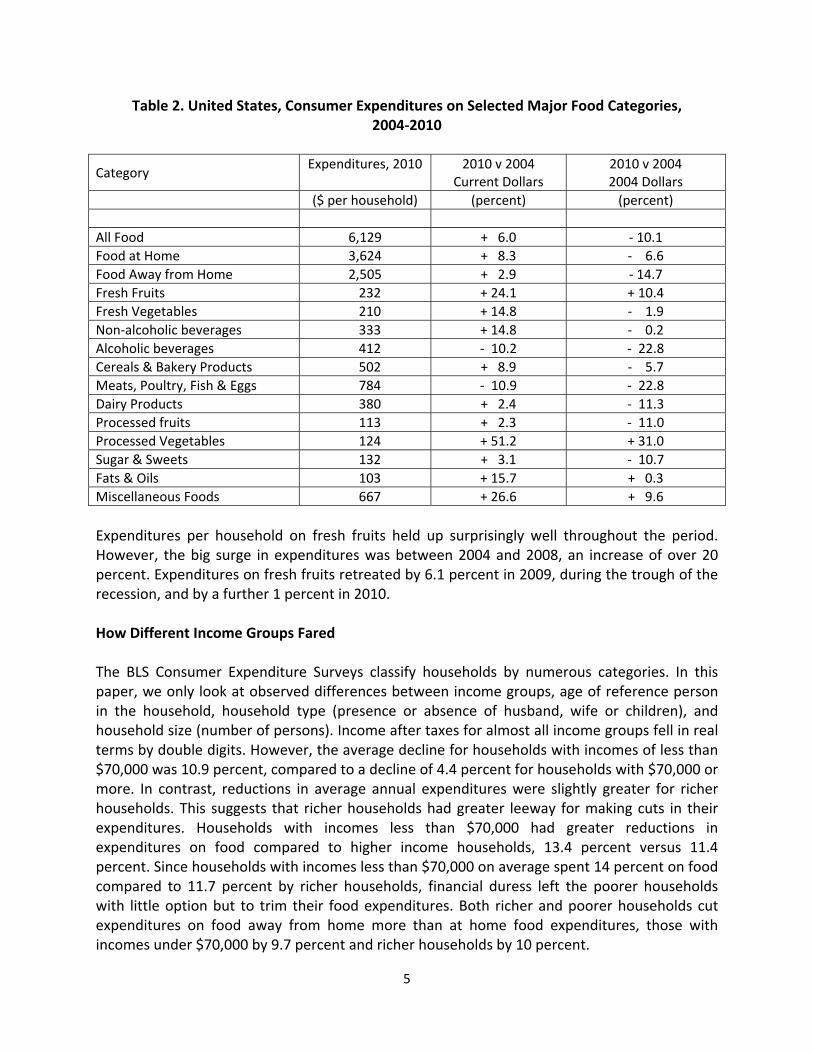
The pressure of rising costs for both gasoline and healthcare ate into household's discretionary income between 2004 and 2008. However, that pressure eased in 2009 and 2010, largely due to reductions in gasoline prices. Effects on Major Food Categories Table 2 shows the average household expenditures in current dollars on major food categories in 2010, and the percentage change between 2004 and 2010 in both current dollars and in constant 2004 dollars. Total food, food at home and food away from home all showed small increases in current dollars. However, in constant 2004 dollars, expenditures on all food fell by over 10 percent, while that on food away from home fell by more than twice as much as that on food at home, 14.7 percent versus 6.6 percent. Among the 12 commodity categories shown in table 2, only alcoholic beverages and meats, poultry, fish and eggs had declines in current dollar expenditures (more than 10 percent in both cases). In contrast, only four categories showed increases in 2004 dollars. By far the biggest winner was processed vegetables with a 31 percent real increase in expenditures. It is believed that to save money, many consumers purchased processed vegetables for home use as a substitute for eating out. The second largest increase in real expenditures was on fresh fruit, which grew by over 10 percent in 2004 dollars. A close third was the miscellaneous foods category with an increase in real expenditures of almost 10 percent. The two hardest hit categories were alcoholic beverages and the meats, poultry, fish and eggs category. It appears that strapped consumers cut back on protein foods and on alcoholic beverages.
0
1000
2000
3000
4000
5000
6000
7000
2004 2005 2006 2007 2008 2009 2010
Food
Healthcare
Entertainment
Gasoline
5
Table 2. United States, Consumer Expenditures on Selected Major Food Categories, 2004‐2010
Category Expenditures, 2010 2010 v 2004
Current Dollars 2010 v 2004 2004 Dollars
($ per household) (percent) (percent)
All Food 6,129 + 6.0 ‐ 10.1
Food at Home 3,624 + 8.3 ‐ 6.6
Food Away from Home 2,505 + 2.9 ‐ 14.7
Fresh Fruits 232 + 24.1 + 10.4
Fresh Vegetables 210 + 14.8 ‐ 1.9
Non‐alcoholic beverages 333 + 14.8 ‐ 0.2
Alcoholic beverages 412 ‐ 10.2 ‐ 22.8
Cereals & Bakery Products 502 + 8.9 ‐ 5.7
Meats, Poultry, Fish & Eggs 784 ‐ 10.9 ‐ 22.8
Dairy Products 380 + 2.4 ‐ 11.3
Processed fruits 113 + 2.3 ‐ 11.0
Processed Vegetables 124 + 51.2 + 31.0
Sugar & Sweets 132 + 3.1 ‐ 10.7
Fats & Oils 103 + 15.7 + 0.3
Miscellaneous Foods 667 + 26.6 + 9.6
Expenditures per household on fresh fruits held up surprisingly well throughout the period. However, the big surge in expenditures was between 2004 and 2008, an increase of over 20 percent. Expenditures on fresh fruits retreated by 6.1 percent in 2009, during the trough of the recession, and by a further 1 percent in 2010. How Different Income Groups Fared The BLS Consumer Expenditure Surveys classify households by numerous categories. In this paper, we only look at observed differences between income groups, age of reference person in the household, household type (presence or absence of husband, wife or children), and household size (number of persons). Income after taxes for almost all income groups fell in real terms by double digits. However, the average decline for households with incomes of less than $70,000 was 10.9 percent, compared to a decline of 4.4 percent for households with $70,000 or more. In contrast, reductions in average annual expenditures were slightly greater for richer households. This suggests that richer households had greater leeway for making cuts in their expenditures. Households with incomes less than $70,000 had greater reductions in expenditures on food compared to higher income households, 13.4 percent versus 11.4 percent. Since households with incomes less than $70,000 on average spent 14 percent on food compared to 11.7 percent by richer households, financial duress left the poorer households with little option but to trim their food expenditures. Both richer and poorer households cut expenditures on food away from home more than at home food expenditures, those with incomes under $70,000 by 9.7 percent and richer households by 10 percent.
6
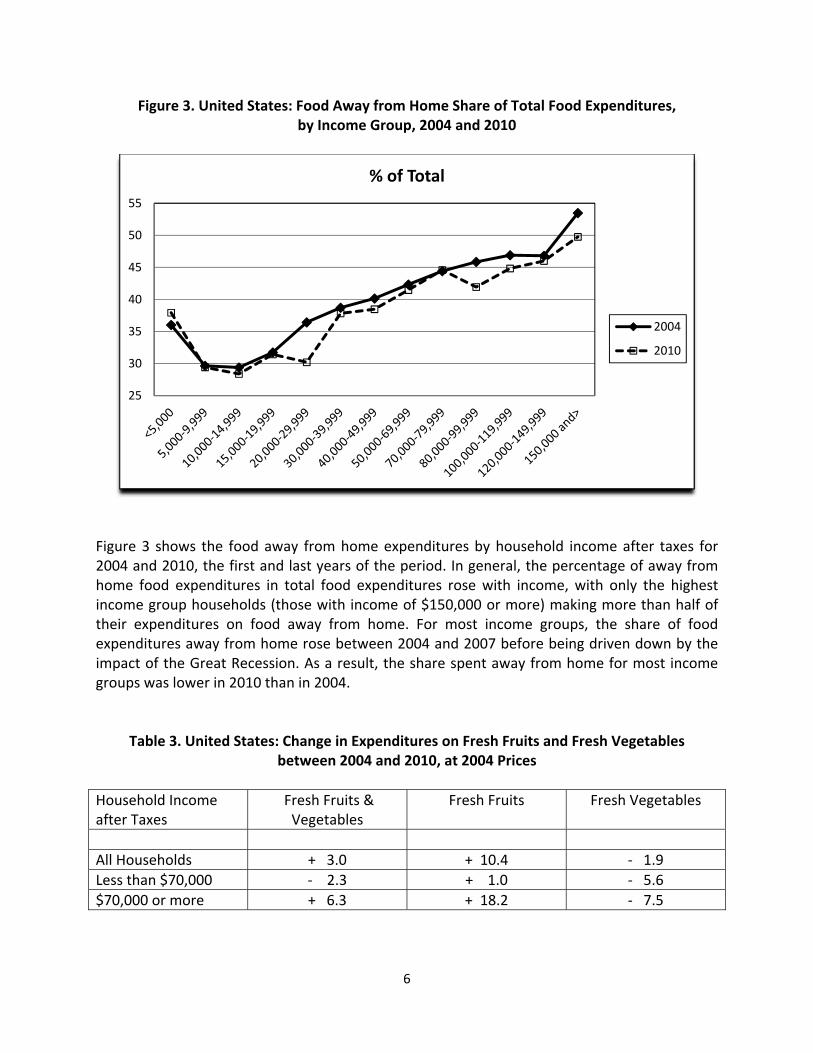
Figure 3. United States: Food Away from Home Share of Total Food Expenditures, by Income Group, 2004 and 2010
Figure 3 shows the food away from home expenditures by household income after taxes for 2004 and 2010, the first and last years of the period. In general, the percentage of away from home food expenditures in total food expenditures rose with income, with only the highest income group households (those with income of $150,000 or more) making more than half of their expenditures on food away from home. For most income groups, the share of food expenditures away from home rose between 2004 and 2007 before being driven down by the impact of the Great Recession. As a result, the share spent away from home for most income groups was lower in 2010 than in 2004.
Table 3. United States: Change in Expenditures on Fresh Fruits and Fresh Vegetables between 2004 and 2010, at 2004 Prices
Household Income after Taxes
Fresh Fruits & Vegetables
Fresh Fruits Fresh Vegetables
All Households + 3.0 + 10.4 ‐ 1.9
Less than $70,000 ‐ 2.3 + 1.0 ‐ 5.6
$70,000 or more + 6.3 + 18.2 ‐ 7.5
25
30
35
40
45
50
55
% of Total
2004
2010
7
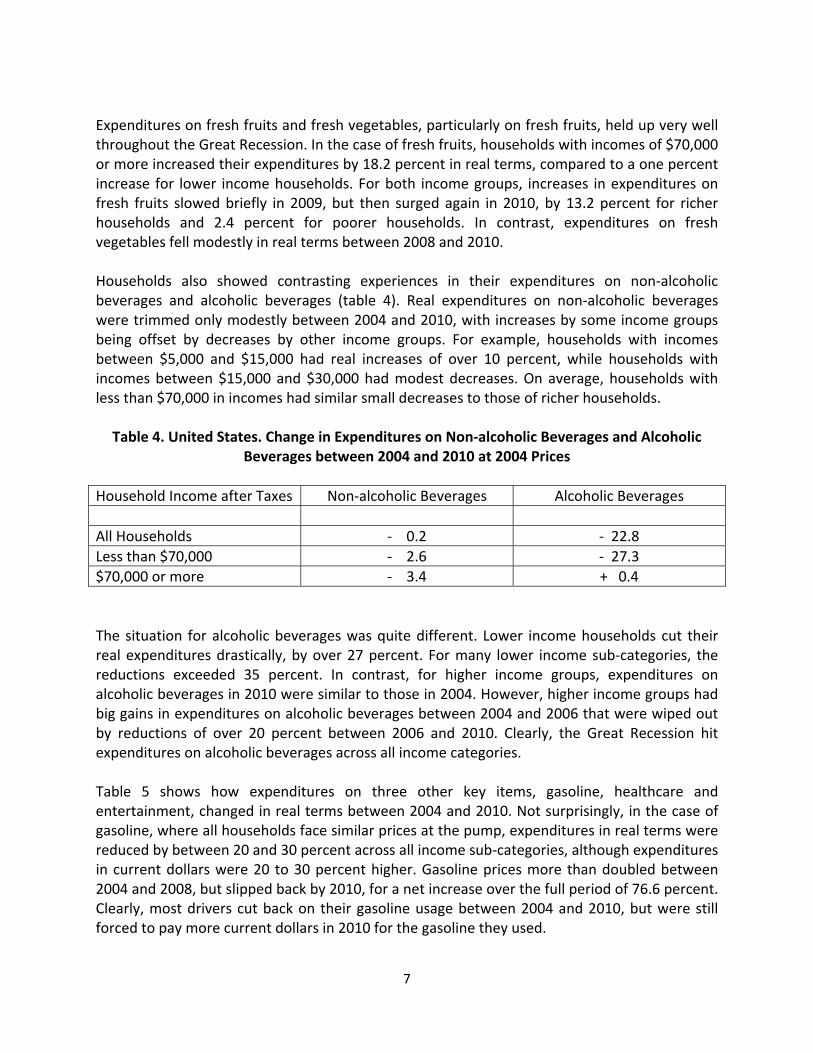
Expenditures on fresh fruits and fresh vegetables, particularly on fresh fruits, held up very well throughout the Great Recession. In the case of fresh fruits, households with incomes of $70,000 or more increased their expenditures by 18.2 percent in real terms, compared to a one percent increase for lower income households. For both income groups, increases in expenditures on fresh fruits slowed briefly in 2009, but then surged again in 2010, by 13.2 percent for richer households and 2.4 percent for poorer households. In contrast, expenditures on fresh vegetables fell modestly in real terms between 2008 and 2010. Households also showed contrasting experiences in their expenditures on non‐alcoholic beverages and alcoholic beverages (table 4). Real expenditures on non‐alcoholic beverages were trimmed only modestly between 2004 and 2010, with increases by some income groups being offset by decreases by other income groups. For example, households with incomes between $5,000 and $15,000 had real increases of over 10 percent, while households with incomes between $15,000 and $30,000 had modest decreases. On average, households with less than $70,000 in incomes had similar small decreases to those of richer households.
Table 4. United States. Change in Expenditures on Non‐alcoholic Beverages and Alcoholic Beverages between 2004 and 2010 at 2004 Prices
Household Income after Taxes Non‐alcoholic Beverages Alcoholic Beverages
All Households ‐ 0.2 ‐ 22.8
Less than $70,000 ‐ 2.6 ‐ 27.3
$70,000 or more ‐ 3.4 + 0.4
The situation for alcoholic beverages was quite different. Lower income households cut their real expenditures drastically, by over 27 percent. For many lower income sub‐categories, the reductions exceeded 35 percent. In contrast, for higher income groups, expenditures on alcoholic beverages in 2010 were similar to those in 2004. However, higher income groups had big gains in expenditures on alcoholic beverages between 2004 and 2006 that were wiped out by reductions of over 20 percent between 2006 and 2010. Clearly, the Great Recession hit expenditures on alcoholic beverages across all income categories. Table 5 shows how expenditures on three other key items, gasoline, healthcare and entertainment, changed in real terms between 2004 and 2010. Not surprisingly, in the case of gasoline, where all households face similar prices at the pump, expenditures in real terms were reduced by between 20 and 30 percent across all income sub‐categories, although expenditures in current dollars were 20 to 30 percent higher. Gasoline prices more than doubled between 2004 and 2008, but slipped back by 2010, for a net increase over the full period of 76.6 percent. Clearly, most drivers cut back on their gasoline usage between 2004 and 2010, but were still forced to pay more current dollars in 2010 for the gasoline they used.

8
Table 5. United States. Change in Expenditures on Gasoline, Healthcare and Entertainment between 2004 and 2010, at 2004 Prices
Household Income after Taxes Gasoline Healthcare Entertainment
All Households ‐ 24.5 ‐ 2.1 + 8.2
Less than $70,000 ‐ 26.0 ‐ 7.1 + 1.7
$70,000 or more ‐ 28.3 ‐ 1.7 + 3.3
While gasoline prices have been quite volatile between 2004 and 2010, the average index of prices for healthcare rose more steadily during the period, for a (still substantial) overall increase of 25.3 percent. Despite that price increase, expenditures on healthcare by all households fell by just 2.1 percent. The decline for households with incomes less than $70,000 was over 7 percent, while that for richer households was less than 2 percent. Households with incomes less than $20,000 cut their healthcare expenditures by over 18 percent. Clearly, poorer households were less able to maintain their real spending on healthcare. In contrast to healthcare, the price index for entertainment rose by only 4.4 percent between 2004 and 2010, and actually declined slightly between 2009 and 2010. Unlike the healthcare industry, the entertainment industry adapted its prices to recessionary conditions. Between 2004 and 2010, real spending on entertainment rose modestly. However, most of the increase occurred between 2004 and 2008. Average household expenditures on entertainment fell by 6 percent in both 2009 and 2010. Clearly, households sharply curbed their expenditures on entertainment as a result of the Great Recession. Income Effect Summary: 1. Average household income after taxes and average expenditures were affected across all income sub‐categories by the Great Recession. 2. Households with incomes of less than $70,000 had bigger percentage reductions in their expenditures on most items than did richer households. 3. Households in almost all income sub‐categories lowered the percentage of their food expenditures made away from home and made large percentage cuts in real dollars spent on food away from home. 4. Expenditures on fresh fruits continued higher despite the recession, especially among higher income households, while real expenditures on fresh vegetables declined across the board. 5. Expenditures on non‐alcoholic beverages held stable despite the recession. For alcoholic beverages, poorer households sharply reduced spending, but richer households did not. 6. While current dollar expenditures on gasoline soared by over 33 percent, the sharp rise in gasoline prices led to across the board cuts in real expenditures. 7. Declines in real expenditures on healthcare were most severe among the poorest households, but modest overall as those who could, maintained their healthcare coverage. 8. Expenditures on entertainment soared between 2004 and 2008, but were cut back severely after the Great Recession hit.
9
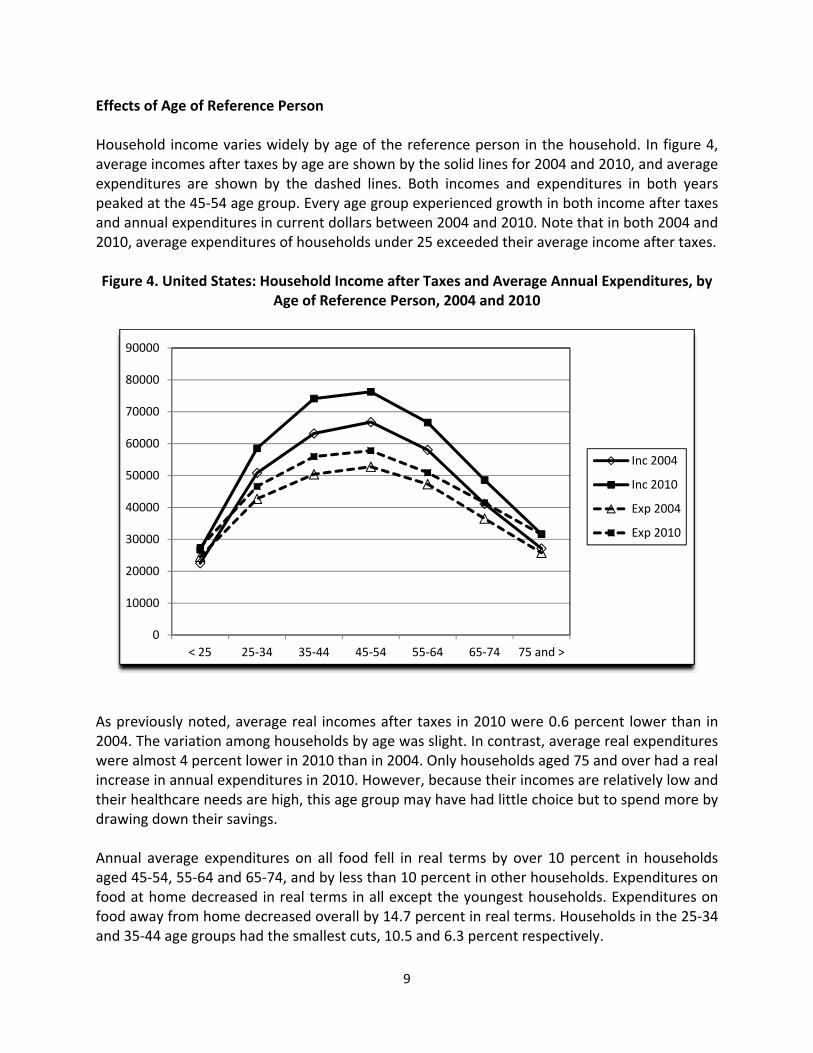
Effects of Age of Reference Person Household income varies widely by age of the reference person in the household. In figure 4, average incomes after taxes by age are shown by the solid lines for 2004 and 2010, and average expenditures are shown by the dashed lines. Both incomes and expenditures in both years peaked at the 45‐54 age group. Every age group experienced growth in both income after taxes and annual expenditures in current dollars between 2004 and 2010. Note that in both 2004 and 2010, average expenditures of households under 25 exceeded their average income after taxes. Figure 4. United States: Household Income after Taxes and Average Annual Expenditures, by
Age of Reference Person, 2004 and 2010
As previously noted, average real incomes after taxes in 2010 were 0.6 percent lower than in 2004. The variation among households by age was slight. In contrast, average real expenditures were almost 4 percent lower in 2010 than in 2004. Only households aged 75 and over had a real increase in annual expenditures in 2010. However, because their incomes are relatively low and their healthcare needs are high, this age group may have had little choice but to spend more by drawing down their savings. Annual average expenditures on all food fell in real terms by over 10 percent in households aged 45‐54, 55‐64 and 65‐74, and by less than 10 percent in other households. Expenditures on food at home decreased in real terms in all except the youngest households. Expenditures on food away from home decreased overall by 14.7 percent in real terms. Households in the 25‐34 and 35‐44 age groups had the smallest cuts, 10.5 and 6.3 percent respectively.
0
10000
20000
30000
40000
50000
60000
70000
80000
90000
< 25 25‐34 35‐44 45‐54 55‐64 65‐74 75 and >
Inc 2004
Inc 2010
Exp 2004
Exp 2010
10
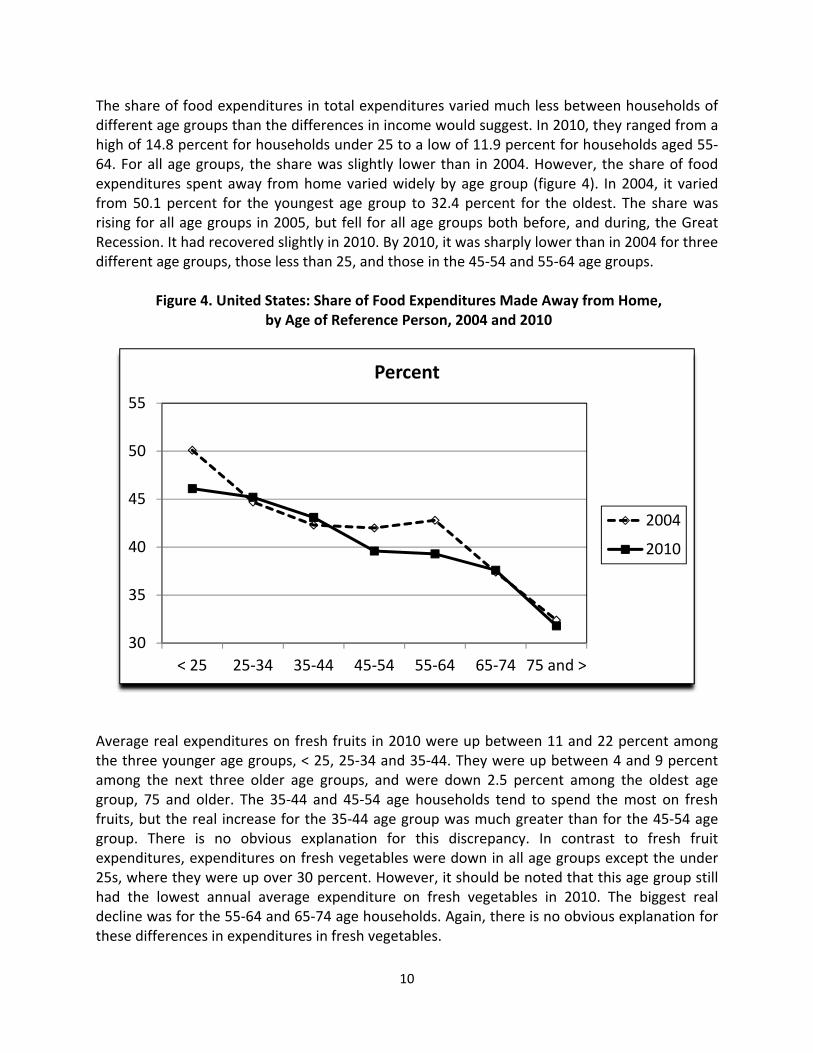
The share of food expenditures in total expenditures varied much less between households of different age groups than the differences in income would suggest. In 2010, they ranged from a high of 14.8 percent for households under 25 to a low of 11.9 percent for households aged 55‐64. For all age groups, the share was slightly lower than in 2004. However, the share of food expenditures spent away from home varied widely by age group (figure 4). In 2004, it varied from 50.1 percent for the youngest age group to 32.4 percent for the oldest. The share was rising for all age groups in 2005, but fell for all age groups both before, and during, the Great Recession. It had recovered slightly in 2010. By 2010, it was sharply lower than in 2004 for three different age groups, those less than 25, and those in the 45‐54 and 55‐64 age groups.
Figure 4. United States: Share of Food Expenditures Made Away from Home, by Age of Reference Person, 2004 and 2010
Average real expenditures on fresh fruits in 2010 were up between 11 and 22 percent among the three younger age groups, < 25, 25‐34 and 35‐44. They were up between 4 and 9 percent among the next three older age groups, and were down 2.5 percent among the oldest age group, 75 and older. The 35‐44 and 45‐54 age households tend to spend the most on fresh fruits, but the real increase for the 35‐44 age group was much greater than for the 45‐54 age group. There is no obvious explanation for this discrepancy. In contrast to fresh fruit expenditures, expenditures on fresh vegetables were down in all age groups except the under 25s, where they were up over 30 percent. However, it should be noted that this age group still had the lowest annual average expenditure on fresh vegetables in 2010. The biggest real decline was for the 55‐64 and 65‐74 age households. Again, there is no obvious explanation for these differences in expenditures in fresh vegetables.
30
35
40
45
50
55
< 25 25‐34 35‐44 45‐54 55‐64 65‐74 75 and >
Percent
2004
2010
11
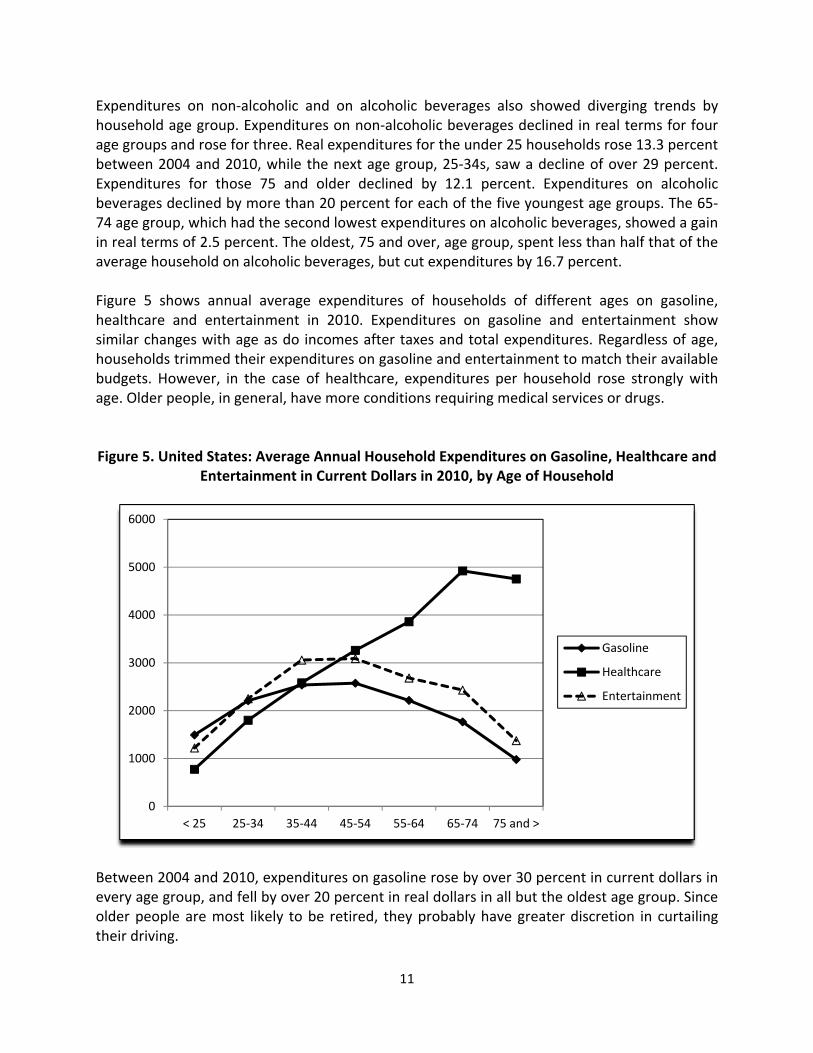
Expenditures on non‐alcoholic and on alcoholic beverages also showed diverging trends by household age group. Expenditures on non‐alcoholic beverages declined in real terms for four age groups and rose for three. Real expenditures for the under 25 households rose 13.3 percent between 2004 and 2010, while the next age group, 25‐34s, saw a decline of over 29 percent. Expenditures for those 75 and older declined by 12.1 percent. Expenditures on alcoholic beverages declined by more than 20 percent for each of the five youngest age groups. The 65‐74 age group, which had the second lowest expenditures on alcoholic beverages, showed a gain in real terms of 2.5 percent. The oldest, 75 and over, age group, spent less than half that of the average household on alcoholic beverages, but cut expenditures by 16.7 percent. Figure 5 shows annual average expenditures of households of different ages on gasoline, healthcare and entertainment in 2010. Expenditures on gasoline and entertainment show similar changes with age as do incomes after taxes and total expenditures. Regardless of age, households trimmed their expenditures on gasoline and entertainment to match their available budgets. However, in the case of healthcare, expenditures per household rose strongly with age. Older people, in general, have more conditions requiring medical services or drugs. Figure 5. United States: Average Annual Household Expenditures on Gasoline, Healthcare and
Entertainment in Current Dollars in 2010, by Age of Household
Between 2004 and 2010, expenditures on gasoline rose by over 30 percent in current dollars in every age group, and fell by over 20 percent in real dollars in all but the oldest age group. Since older people are most likely to be retired, they probably have greater discretion in curtailing their driving.
0
1000
2000
3000
4000
5000
6000
< 25 25‐34 35‐44 45‐54 55‐64 65‐74 75 and >
Gasoline
Healthcare
Entertainment
12
For entertainment, household expenditures rose in real terms in every age group except the 55‐64 age group, which recorded an almost 9 percent decline. However, the increases were negligible for households in the two youngest age groups, < 25 and 25‐34, but were 17.1 percent for the 35‐44 age group, 9.2 percent for the 45‐54 age group, 19.4 percent for the 65‐74 age group, and 33 percent for the group aged 75 and over. However, households in all age groups reduced their real expenditures on entertainment between 2008 and 2010, after the Great Recession hit. Expenditures on healthcare increased by over 14 percent in current dollar terms for every age group and decreased in real terms for every age group except those aged 65‐74. It appears that even expenditures on healthcare were trimmed somewhat as a result of the Great Recession. Households were buying less healthcare services in 2010 than in 2004, but were paying more in current dollars. Age Effect Summary: 1. Income after taxes and total expenditures by age of household tend to follow a parabola with the peak in the 45‐54 age group. 2. All age categories of households had lower income after taxes and lower total expenditures in real terms in 2010 than in 2004. 3. The share of total expenditures spent on food varied modestly between different age groups, with younger age groups tending to spend more. 4. The share of food expenditures spent on food away from home varied markedly by age group, with the share being highest for younger households and lowest for older households. 5. All age groups saw a decline in the percentage of food expenditures spent on food away from home between 2004 and 2010. 6. Average household expenditures on fresh fruits increased most for the younger age groups and least for the older age groups. 7. The trend in expenditures on fresh vegetables was down for households in all age groups except those under 25. 8. Households were more persistent in maintaining their levels of expenditures on non‐alcoholic beverages than on alcoholic beverages, which declined across the board. 9. Households of all ages increased their expenditures on gasoline substantially in current dollar terms, but cut them back substantially in real terms as gasoline prices soared. 10. Expenditures on healthcare rose linearly with age of household. Real expenditures fell in all age groups while healthcare costs were rising, indicating that households were able to purchase less healthcare services in 2010 than in 2004. 11. Real expenditures on entertainment were rising rapidly prior to the Great Recession, but slipped thereafter.
13
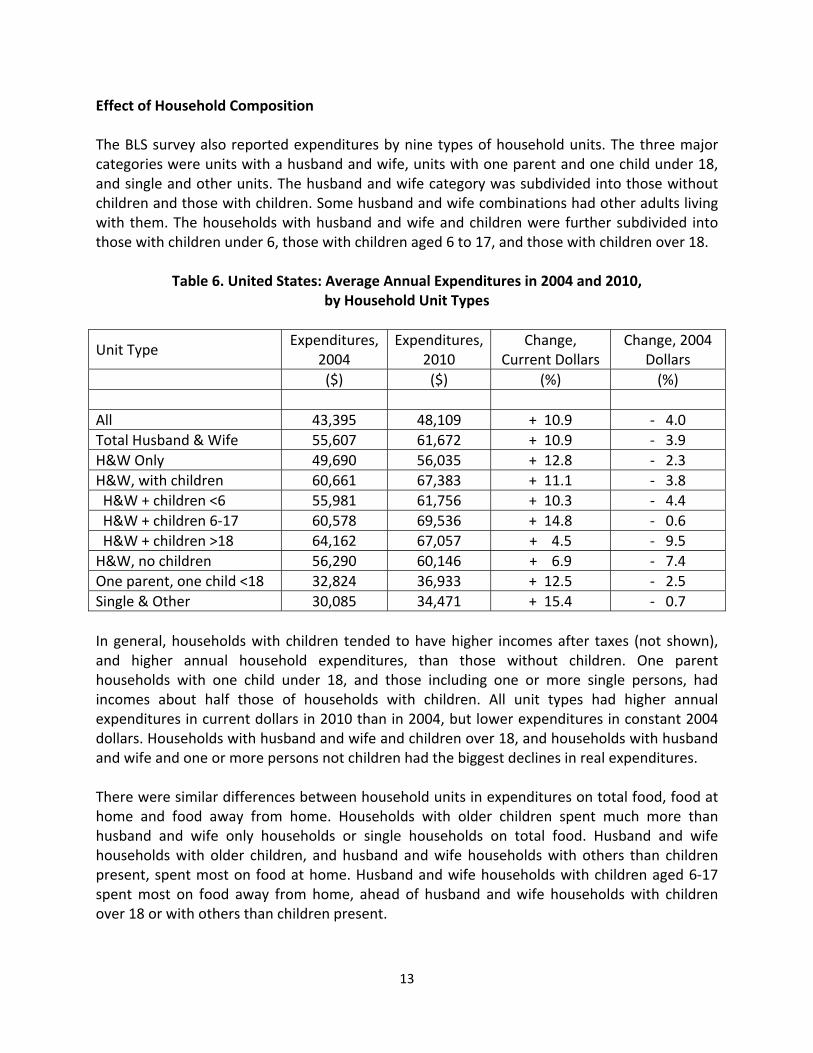
Effect of Household Composition The BLS survey also reported expenditures by nine types of household units. The three major categories were units with a husband and wife, units with one parent and one child under 18, and single and other units. The husband and wife category was subdivided into those without children and those with children. Some husband and wife combinations had other adults living with them. The households with husband and wife and children were further subdivided into those with children under 6, those with children aged 6 to 17, and those with children over 18.
Table 6. United States: Average Annual Expenditures in 2004 and 2010, by Household Unit Types
Unit Type Expenditures,
2004 Expenditures,
2010 Change,
Current Dollars Change, 2004
Dollars
($) ($) (%) (%)
All 43,395 48,109 + 10.9 ‐ 4.0
Total Husband & Wife 55,607 61,672 + 10.9 ‐ 3.9
H&W Only 49,690 56,035 + 12.8 ‐ 2.3
H&W, with children 60,661 67,383 + 11.1 ‐ 3.8
H&W + children <6 55,981 61,756 + 10.3 ‐ 4.4
H&W + children 6‐17 60,578 69,536 + 14.8 ‐ 0.6
H&W + children >18 64,162 67,057 + 4.5 ‐ 9.5
H&W, no children 56,290 60,146 + 6.9 ‐ 7.4
One parent, one child <18 32,824 36,933 + 12.5 ‐ 2.5
Single & Other 30,085 34,471 + 15.4 ‐ 0.7
In general, households with children tended to have higher incomes after taxes (not shown), and higher annual household expenditures, than those without children. One parent households with one child under 18, and those including one or more single persons, had incomes about half those of households with children. All unit types had higher annual expenditures in current dollars in 2010 than in 2004, but lower expenditures in constant 2004 dollars. Households with husband and wife and children over 18, and households with husband and wife and one or more persons not children had the biggest declines in real expenditures. There were similar differences between household units in expenditures on total food, food at home and food away from home. Households with older children spent much more than husband and wife only households or single households on total food. Husband and wife households with older children, and husband and wife households with others than children present, spent most on food at home. Husband and wife households with children aged 6‐17 spent most on food away from home, ahead of husband and wife households with children over 18 or with others than children present.
14
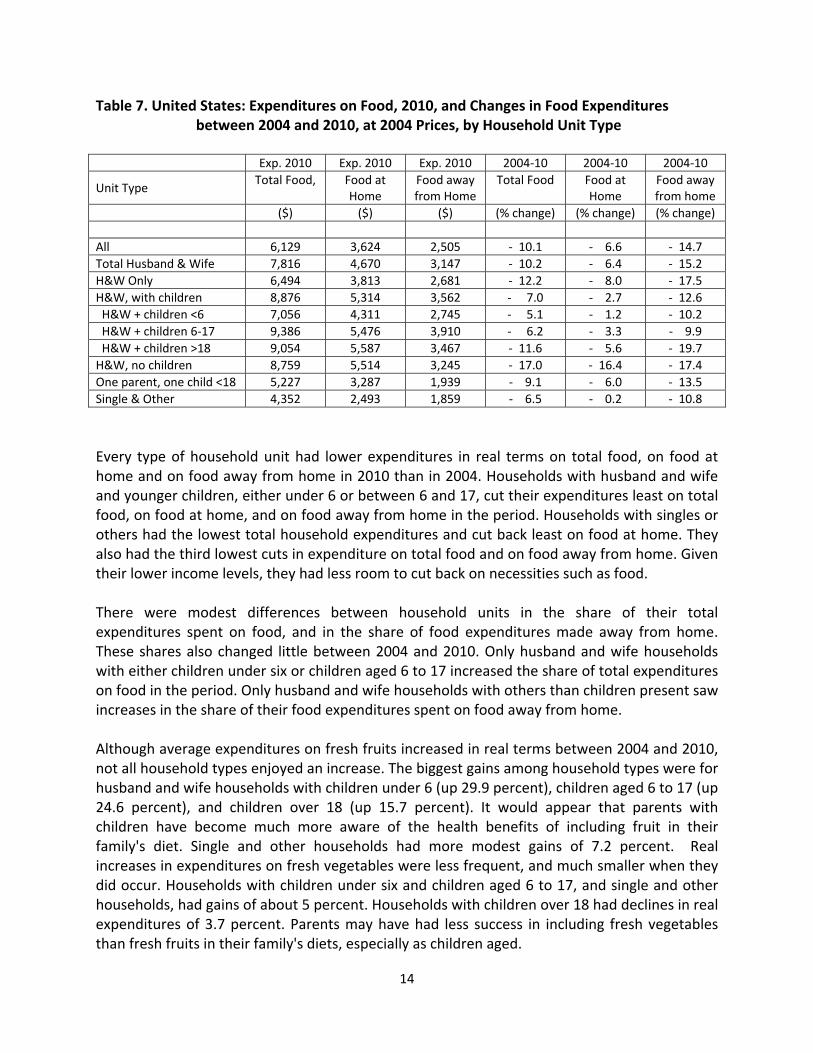
Table 7. United States: Expenditures on Food, 2010, and Changes in Food Expenditures between 2004 and 2010, at 2004 Prices, by Household Unit Type
Exp. 2010 Exp. 2010 Exp. 2010 2004‐10 2004‐10 2004‐10
Unit Type Total Food, Food at
Home Food away from Home
Total Food Food at Home
Food away from home
($) ($) ($) (% change) (% change) (% change)
All 6,129 3,624 2,505 ‐ 10.1 ‐ 6.6 ‐ 14.7
Total Husband & Wife 7,816 4,670 3,147 ‐ 10.2 ‐ 6.4 ‐ 15.2
H&W Only 6,494 3,813 2,681 ‐ 12.2 ‐ 8.0 ‐ 17.5
H&W, with children 8,876 5,314 3,562 ‐ 7.0 ‐ 2.7 ‐ 12.6
H&W + children <6 7,056 4,311 2,745 ‐ 5.1 ‐ 1.2 ‐ 10.2
H&W + children 6‐17 9,386 5,476 3,910 ‐ 6.2 ‐ 3.3 ‐ 9.9
H&W + children >18 9,054 5,587 3,467 ‐ 11.6 ‐ 5.6 ‐ 19.7
H&W, no children 8,759 5,514 3,245 ‐ 17.0 ‐ 16.4 ‐ 17.4
One parent, one child <18 5,227 3,287 1,939 ‐ 9.1 ‐ 6.0 ‐ 13.5
Single & Other 4,352 2,493 1,859 ‐ 6.5 ‐ 0.2 ‐ 10.8
Every type of household unit had lower expenditures in real terms on total food, on food at home and on food away from home in 2010 than in 2004. Households with husband and wife and younger children, either under 6 or between 6 and 17, cut their expenditures least on total food, on food at home, and on food away from home in the period. Households with singles or others had the lowest total household expenditures and cut back least on food at home. They also had the third lowest cuts in expenditure on total food and on food away from home. Given their lower income levels, they had less room to cut back on necessities such as food. There were modest differences between household units in the share of their total expenditures spent on food, and in the share of food expenditures made away from home. These shares also changed little between 2004 and 2010. Only husband and wife households with either children under six or children aged 6 to 17 increased the share of total expenditures on food in the period. Only husband and wife households with others than children present saw increases in the share of their food expenditures spent on food away from home. Although average expenditures on fresh fruits increased in real terms between 2004 and 2010, not all household types enjoyed an increase. The biggest gains among household types were for husband and wife households with children under 6 (up 29.9 percent), children aged 6 to 17 (up 24.6 percent), and children over 18 (up 15.7 percent). It would appear that parents with children have become much more aware of the health benefits of including fruit in their family's diet. Single and other households had more modest gains of 7.2 percent. Real increases in expenditures on fresh vegetables were less frequent, and much smaller when they did occur. Households with children under six and children aged 6 to 17, and single and other households, had gains of about 5 percent. Households with children over 18 had declines in real expenditures of 3.7 percent. Parents may have had less success in including fresh vegetables than fresh fruits in their family's diets, especially as children aged.
15
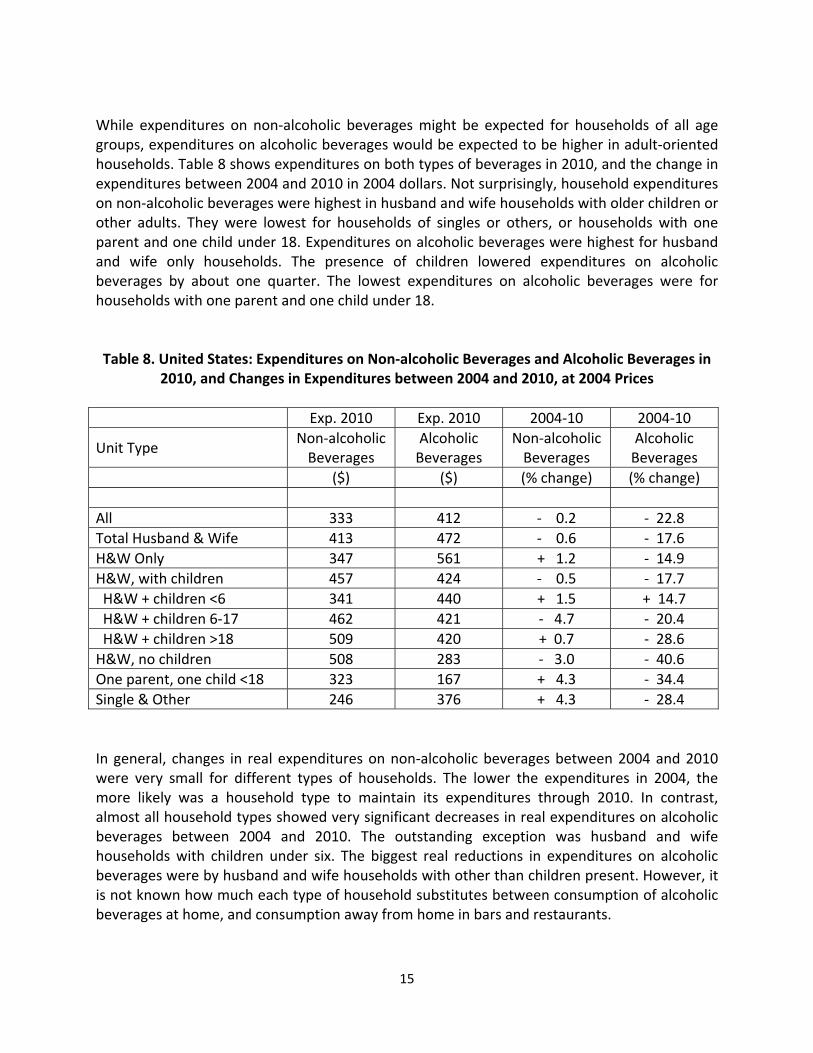
While expenditures on non‐alcoholic beverages might be expected for households of all age groups, expenditures on alcoholic beverages would be expected to be higher in adult‐oriented households. Table 8 shows expenditures on both types of beverages in 2010, and the change in expenditures between 2004 and 2010 in 2004 dollars. Not surprisingly, household expenditures on non‐alcoholic beverages were highest in husband and wife households with older children or other adults. They were lowest for households of singles or others, or households with one parent and one child under 18. Expenditures on alcoholic beverages were highest for husband and wife only households. The presence of children lowered expenditures on alcoholic beverages by about one quarter. The lowest expenditures on alcoholic beverages were for households with one parent and one child under 18. Table 8. United States: Expenditures on Non‐alcoholic Beverages and Alcoholic Beverages in
2010, and Changes in Expenditures between 2004 and 2010, at 2004 Prices
Exp. 2010 Exp. 2010 2004‐10 2004‐10
Unit Type Non‐alcoholic Beverages
Alcoholic Beverages
Non‐alcoholic Beverages
Alcoholic Beverages
($) ($) (% change) (% change)
All 333 412 ‐ 0.2 ‐ 22.8
Total Husband & Wife 413 472 ‐ 0.6 ‐ 17.6
H&W Only 347 561 + 1.2 ‐ 14.9
H&W, with children 457 424 ‐ 0.5 ‐ 17.7
H&W + children <6 341 440 + 1.5 + 14.7
H&W + children 6‐17 462 421 ‐ 4.7 ‐ 20.4
H&W + children >18 509 420 + 0.7 ‐ 28.6
H&W, no children 508 283 ‐ 3.0 ‐ 40.6
One parent, one child <18 323 167 + 4.3 ‐ 34.4
Single & Other 246 376 + 4.3 ‐ 28.4
In general, changes in real expenditures on non‐alcoholic beverages between 2004 and 2010 were very small for different types of households. The lower the expenditures in 2004, the more likely was a household type to maintain its expenditures through 2010. In contrast, almost all household types showed very significant decreases in real expenditures on alcoholic beverages between 2004 and 2010. The outstanding exception was husband and wife households with children under six. The biggest real reductions in expenditures on alcoholic beverages were by husband and wife households with other than children present. However, it is not known how much each type of household substitutes between consumption of alcoholic beverages at home, and consumption away from home in bars and restaurants.
16
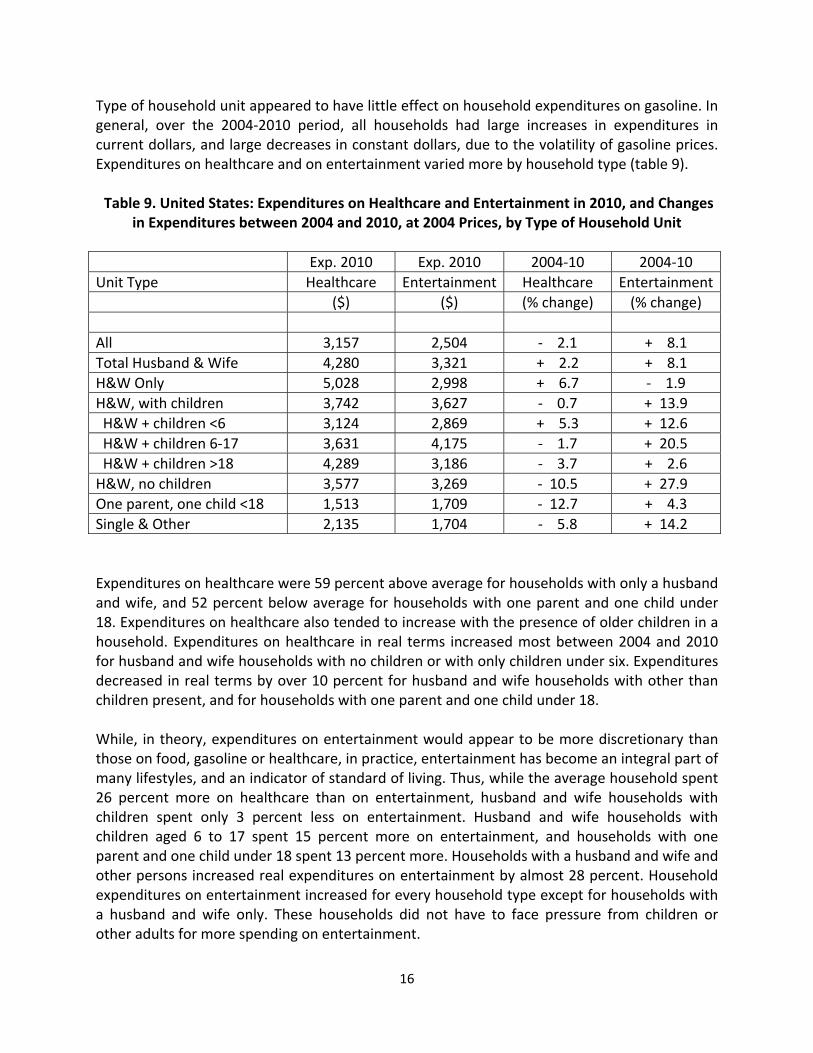
Type of household unit appeared to have little effect on household expenditures on gasoline. In general, over the 2004‐2010 period, all households had large increases in expenditures in current dollars, and large decreases in constant dollars, due to the volatility of gasoline prices. Expenditures on healthcare and on entertainment varied more by household type (table 9). Table 9. United States: Expenditures on Healthcare and Entertainment in 2010, and Changes
in Expenditures between 2004 and 2010, at 2004 Prices, by Type of Household Unit
Exp. 2010 Exp. 2010 2004‐10 2004‐10
Unit Type Healthcare Entertainment Healthcare Entertainment
($) ($) (% change) (% change)
All 3,157 2,504 ‐ 2.1 + 8.1
Total Husband & Wife 4,280 3,321 + 2.2 + 8.1
H&W Only 5,028 2,998 + 6.7 ‐ 1.9
H&W, with children 3,742 3,627 ‐ 0.7 + 13.9
H&W + children <6 3,124 2,869 + 5.3 + 12.6
H&W + children 6‐17 3,631 4,175 ‐ 1.7 + 20.5
H&W + children >18 4,289 3,186 ‐ 3.7 + 2.6
H&W, no children 3,577 3,269 ‐ 10.5 + 27.9
One parent, one child <18 1,513 1,709 ‐ 12.7 + 4.3
Single & Other 2,135 1,704 ‐ 5.8 + 14.2
Expenditures on healthcare were 59 percent above average for households with only a husband and wife, and 52 percent below average for households with one parent and one child under 18. Expenditures on healthcare also tended to increase with the presence of older children in a household. Expenditures on healthcare in real terms increased most between 2004 and 2010 for husband and wife households with no children or with only children under six. Expenditures decreased in real terms by over 10 percent for husband and wife households with other than children present, and for households with one parent and one child under 18. While, in theory, expenditures on entertainment would appear to be more discretionary than those on food, gasoline or healthcare, in practice, entertainment has become an integral part of many lifestyles, and an indicator of standard of living. Thus, while the average household spent 26 percent more on healthcare than on entertainment, husband and wife households with children spent only 3 percent less on entertainment. Husband and wife households with children aged 6 to 17 spent 15 percent more on entertainment, and households with one parent and one child under 18 spent 13 percent more. Households with a husband and wife and other persons increased real expenditures on entertainment by almost 28 percent. Household expenditures on entertainment increased for every household type except for households with a husband and wife only. These households did not have to face pressure from children or other adults for more spending on entertainment.
17
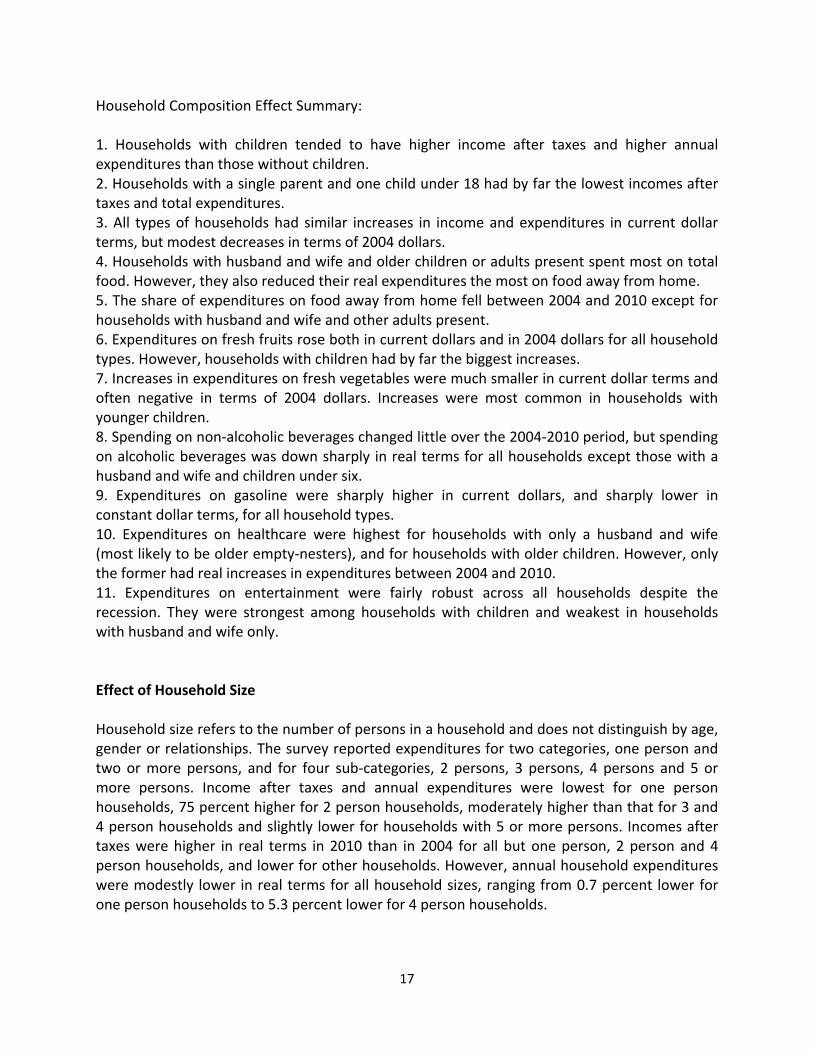
Household Composition Effect Summary: 1. Households with children tended to have higher income after taxes and higher annual expenditures than those without children. 2. Households with a single parent and one child under 18 had by far the lowest incomes after taxes and total expenditures. 3. All types of households had similar increases in income and expenditures in current dollar terms, but modest decreases in terms of 2004 dollars. 4. Households with husband and wife and older children or adults present spent most on total food. However, they also reduced their real expenditures the most on food away from home. 5. The share of expenditures on food away from home fell between 2004 and 2010 except for households with husband and wife and other adults present. 6. Expenditures on fresh fruits rose both in current dollars and in 2004 dollars for all household types. However, households with children had by far the biggest increases. 7. Increases in expenditures on fresh vegetables were much smaller in current dollar terms and often negative in terms of 2004 dollars. Increases were most common in households with younger children. 8. Spending on non‐alcoholic beverages changed little over the 2004‐2010 period, but spending on alcoholic beverages was down sharply in real terms for all households except those with a husband and wife and children under six. 9. Expenditures on gasoline were sharply higher in current dollars, and sharply lower in constant dollar terms, for all household types. 10. Expenditures on healthcare were highest for households with only a husband and wife (most likely to be older empty‐nesters), and for households with older children. However, only the former had real increases in expenditures between 2004 and 2010. 11. Expenditures on entertainment were fairly robust across all households despite the recession. They were strongest among households with children and weakest in households with husband and wife only. Effect of Household Size Household size refers to the number of persons in a household and does not distinguish by age, gender or relationships. The survey reported expenditures for two categories, one person and two or more persons, and for four sub‐categories, 2 persons, 3 persons, 4 persons and 5 or more persons. Income after taxes and annual expenditures were lowest for one person households, 75 percent higher for 2 person households, moderately higher than that for 3 and 4 person households and slightly lower for households with 5 or more persons. Incomes after taxes were higher in real terms in 2010 than in 2004 for all but one person, 2 person and 4 person households, and lower for other households. However, annual household expenditures were modestly lower in real terms for all household sizes, ranging from 0.7 percent lower for one person households to 5.3 percent lower for 4 person households.
18
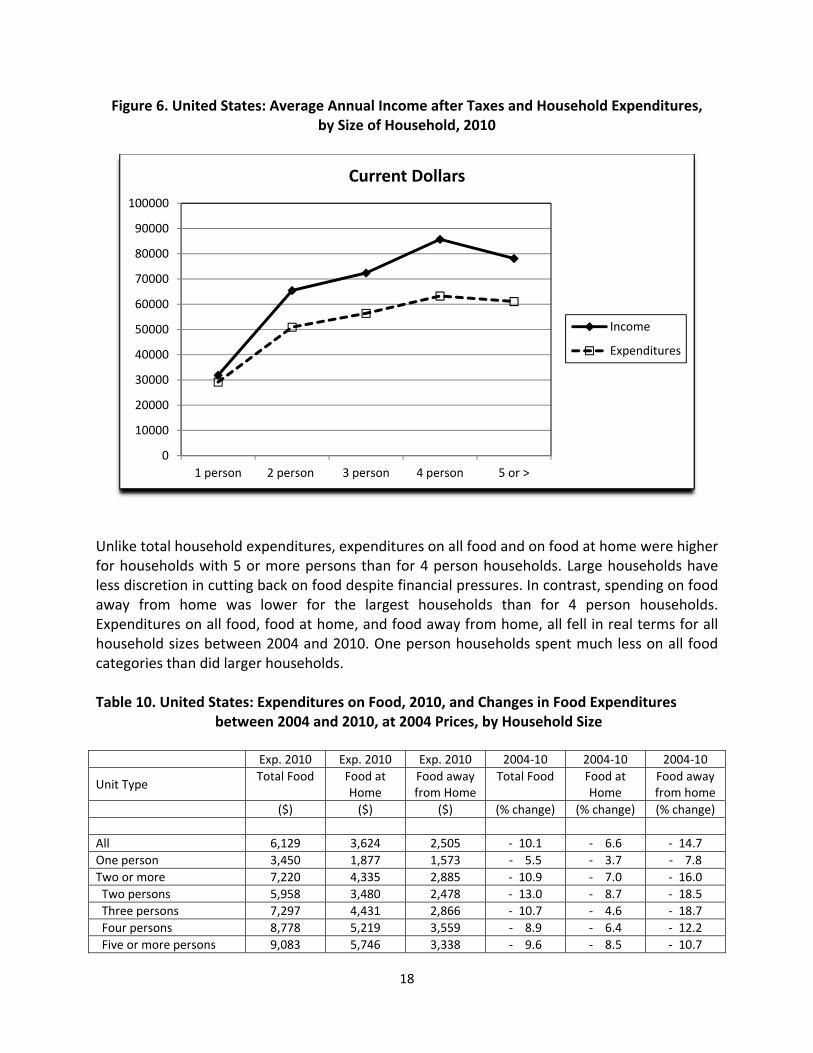
Figure 6. United States: Average Annual Income after Taxes and Household Expenditures, by Size of Household, 2010
Unlike total household expenditures, expenditures on all food and on food at home were higher for households with 5 or more persons than for 4 person households. Large households have less discretion in cutting back on food despite financial pressures. In contrast, spending on food away from home was lower for the largest households than for 4 person households. Expenditures on all food, food at home, and food away from home, all fell in real terms for all household sizes between 2004 and 2010. One person households spent much less on all food categories than did larger households. Table 10. United States: Expenditures on Food, 2010, and Changes in Food Expenditures
between 2004 and 2010, at 2004 Prices, by Household Size
Exp. 2010 Exp. 2010 Exp. 2010 2004‐10 2004‐10 2004‐10
Unit Type Total Food Food at
Home Food away from Home
Total Food Food at Home
Food away from home
($) ($) ($) (% change) (% change) (% change)
All 6,129 3,624 2,505 ‐ 10.1 ‐ 6.6 ‐ 14.7
One person 3,450 1,877 1,573 ‐ 5.5 ‐ 3.7 ‐ 7.8
Two or more 7,220 4,335 2,885 ‐ 10.9 ‐ 7.0 ‐ 16.0
Two persons 5,958 3,480 2,478 ‐ 13.0 ‐ 8.7 ‐ 18.5
Three persons 7,297 4,431 2,866 ‐ 10.7 ‐ 4.6 ‐ 18.7
Four persons 8,778 5,219 3,559 ‐ 8.9 ‐ 6.4 ‐ 12.2
Five or more persons 9,083 5,746 3,338 ‐ 9.6 ‐ 8.5 ‐ 10.7
0
10000
20000
30000
40000
50000
60000
70000
80000
90000
100000
1 person 2 person 3 person 4 person 5 or >
Current Dollars
Income
Expenditures
19
The largest households devoted 14.9 percent of all expenditures to spending on food. This was more than 3 percentage points greater than the 11.8 percent spent by one person households. One person households also spent a much higher share of their food expenditures on food away from home than did two or more person households (45.6 percent versus 40.0 percent). Households with 5 or more persons spent the smallest share (36.8 percent) on food away from home. The share of food expenditures spent on food away from home for one person households and for households with 5 or more persons was about the same in 2010 as in 2004, rising before the recession hit, and falling back as a result of the recession. For other household sizes, the rise was more than wiped out by the post‐recession decline. Expenditures for both fresh fruits and fresh vegetables rose linearly with household size during the period. However, expenditures on fresh fruits rose fastest in real terms for 3 person and 4 person households (17.3 percent and 25.6 percent increases respectively) and fell by 0.2 percent for two person households. In contrast, real expenditures on fresh vegetables only increased for one person households and 4 person households. Table 11. United States: Expenditures on Non‐alcoholic Beverages and Alcoholic Beverages in 2010, and Changes in Expenditures between 2004 and 2010, at 2004 Prices, by Household Size
Exp. 2010 Exp. 2010 2004‐10 2004‐10
Unit Type Non‐alcoholic Beverages
Alcoholic Beverages
Non‐alcoholic Beverages
Alcoholic Beverages
($) ($) (% change) (% change)
All 333 412 ‐ 0.2 ‐ 22.8 One person 181 322 ‐ 1.5 ‐ 22.8 Two or more 395 449 ‐ 0.2 ‐ 22.7 Two persons 326 545 ‐ 1.0 ‐ 17.6 Three persons 419 388 + 4.3 ‐ 28.7 Four persons 464 441 ‐ 5.6 ‐ 20.6 Five or more persons 491 248 + 2.8 ‐ 38.2
Expenditures on non‐alcoholic beverages rose linearly with household size, whereas expenditures on alcoholic beverages were highest for 2 person households and lowest for households with 5 persons or more. The changes in real expenditures on non‐alcoholic beverages were small, whether negative or positive. In contrast, the changes in real expenditures on alcoholic beverages were all large and negative, with the biggest decline occurring for the largest households with 5 or more persons. These households again evidenced the greatest response to recession conditions. Expenditures on gasoline also increased linearly with household size. The changes over the period were similar to those for other household categories, with large increase in current dollars, but large decreases in real dollars. No household size was able to avoid the impact of volatile gasoline prices.
20
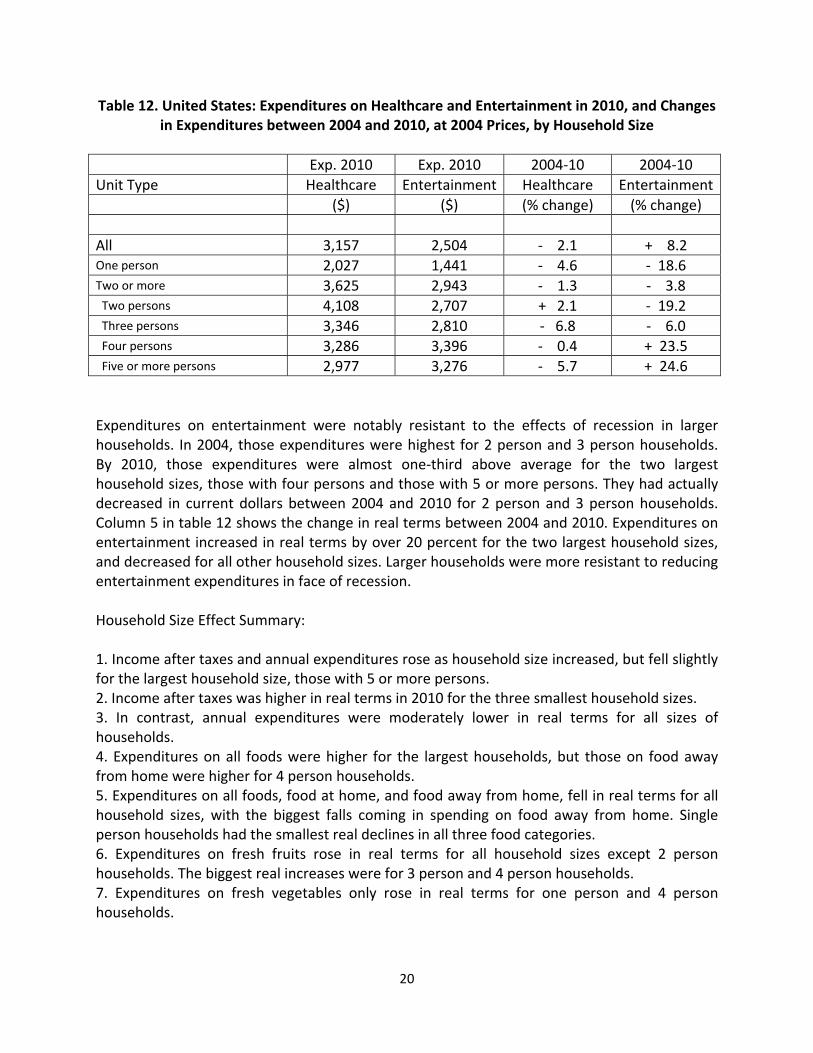
Table 12. United States: Expenditures on Healthcare and Entertainment in 2010, and Changes in Expenditures between 2004 and 2010, at 2004 Prices, by Household Size
Exp. 2010 Exp. 2010 2004‐10 2004‐10
Unit Type Healthcare Entertainment Healthcare Entertainment
($) ($) (% change) (% change)
All 3,157 2,504 ‐ 2.1 + 8.2 One person 2,027 1,441 ‐ 4.6 ‐ 18.6 Two or more 3,625 2,943 ‐ 1.3 ‐ 3.8 Two persons 4,108 2,707 + 2.1 ‐ 19.2 Three persons 3,346 2,810 ‐ 6.8 ‐ 6.0 Four persons 3,286 3,396 ‐ 0.4 + 23.5 Five or more persons 2,977 3,276 ‐ 5.7 + 24.6
Expenditures on entertainment were notably resistant to the effects of recession in larger households. In 2004, those expenditures were highest for 2 person and 3 person households. By 2010, those expenditures were almost one‐third above average for the two largest household sizes, those with four persons and those with 5 or more persons. They had actually decreased in current dollars between 2004 and 2010 for 2 person and 3 person households. Column 5 in table 12 shows the change in real terms between 2004 and 2010. Expenditures on entertainment increased in real terms by over 20 percent for the two largest household sizes, and decreased for all other household sizes. Larger households were more resistant to reducing entertainment expenditures in face of recession. Household Size Effect Summary: 1. Income after taxes and annual expenditures rose as household size increased, but fell slightly for the largest household size, those with 5 or more persons. 2. Income after taxes was higher in real terms in 2010 for the three smallest household sizes. 3. In contrast, annual expenditures were moderately lower in real terms for all sizes of households. 4. Expenditures on all foods were higher for the largest households, but those on food away from home were higher for 4 person households. 5. Expenditures on all foods, food at home, and food away from home, fell in real terms for all household sizes, with the biggest falls coming in spending on food away from home. Single person households had the smallest real declines in all three food categories. 6. Expenditures on fresh fruits rose in real terms for all household sizes except 2 person households. The biggest real increases were for 3 person and 4 person households. 7. Expenditures on fresh vegetables only rose in real terms for one person and 4 person households.
21
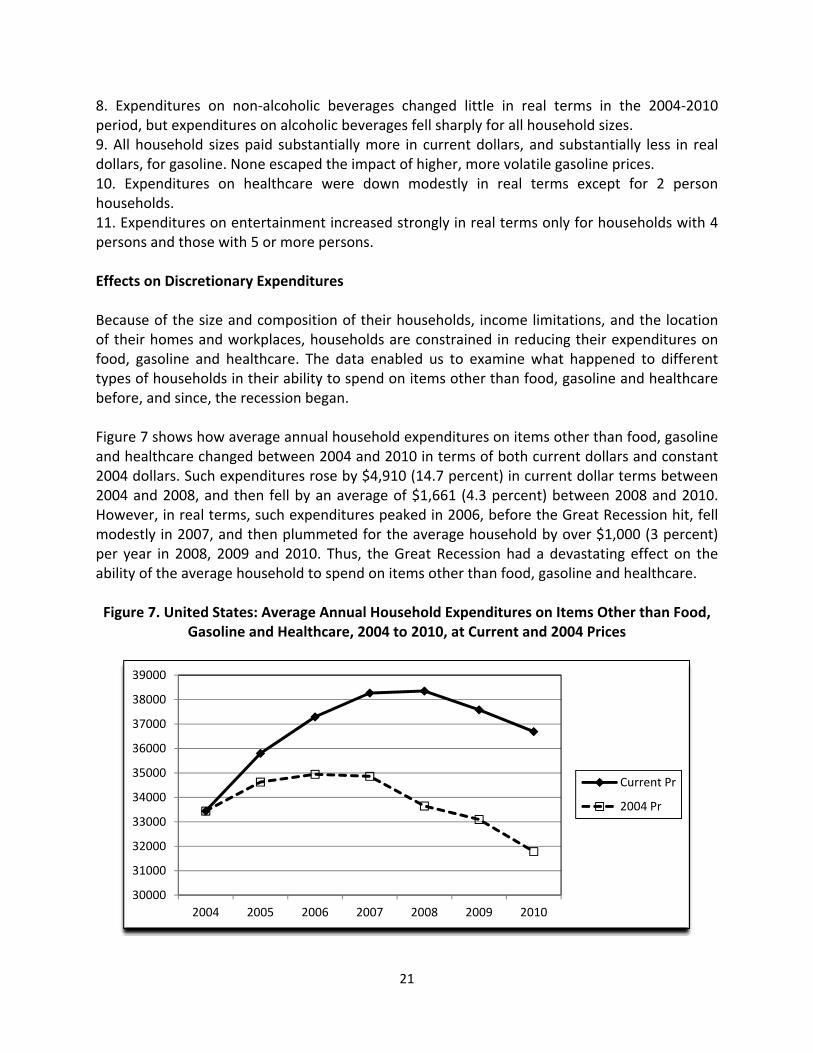
8. Expenditures on non‐alcoholic beverages changed little in real terms in the 2004‐2010 period, but expenditures on alcoholic beverages fell sharply for all household sizes. 9. All household sizes paid substantially more in current dollars, and substantially less in real dollars, for gasoline. None escaped the impact of higher, more volatile gasoline prices. 10. Expenditures on healthcare were down modestly in real terms except for 2 person households. 11. Expenditures on entertainment increased strongly in real terms only for households with 4 persons and those with 5 or more persons. Effects on Discretionary Expenditures Because of the size and composition of their households, income limitations, and the location of their homes and workplaces, households are constrained in reducing their expenditures on food, gasoline and healthcare. The data enabled us to examine what happened to different types of households in their ability to spend on items other than food, gasoline and healthcare before, and since, the recession began. Figure 7 shows how average annual household expenditures on items other than food, gasoline and healthcare changed between 2004 and 2010 in terms of both current dollars and constant 2004 dollars. Such expenditures rose by $4,910 (14.7 percent) in current dollar terms between 2004 and 2008, and then fell by an average of $1,661 (4.3 percent) between 2008 and 2010. However, in real terms, such expenditures peaked in 2006, before the Great Recession hit, fell modestly in 2007, and then plummeted for the average household by over $1,000 (3 percent) per year in 2008, 2009 and 2010. Thus, the Great Recession had a devastating effect on the ability of the average household to spend on items other than food, gasoline and healthcare. Figure 7. United States: Average Annual Household Expenditures on Items Other than Food,
Gasoline and Healthcare, 2004 to 2010, at Current and 2004 Prices
30000
31000
32000
33000
34000
35000
36000
37000
38000
39000
2004 2005 2006 2007 2008 2009 2010
Current Pr
2004 Pr
22
Between 2007 and 2010, the average household expenditures on items other than food, gasoline and healthcare fell by 8.8 percent in real terms. Households with income after taxes of less than $70,000 suffered an 8.3 percent decline, while those with incomes of $70,000 or more suffered a 9.8 percent decline. The lower income group saw expenditures in current dollars fall by only $884, while the higher income group saw expenditures fall in current dollars by $3,465. Only one income sub‐category, households with income after taxes of $5,000‐$9,999, saw those discretionary expenditures increase. This income group may have benefited from government transfers. However, the biggest percentage declines (all over 10 percent) were for three higher income categories, $50,000‐$69,999, $80,000‐$99,999 and $100,000 to $119,999. Surprisingly, the Great Recession appears to have had the biggest absolute and relative impact on higher income households. No obvious patterns emerged in terms of age of reference person in the household. Three age categories, < 25, 35‐44 and 55‐64 saw real expenditures on items other than food, gasoline and healthcare fall by over 11 percent. Three age categories, 25‐34, 45‐54 and 65‐74, had declines of between 6 and 7 percent. Only the oldest households, 75 and >, broke this norm with a decline of only 2.4 percent. The biggest decline in expenditures in current dollars between 2007 and 2010 was $3,013 for households aged 35‐44, usually considered the core spending group with established families. An analysis of expenditures by household composition showed that the decline in expenditures in real terms between 2007 and 2010 for different household units was close to the 8.8 percent recorded by the average household. Two unit types had declines above 10 percent, those with husband and wife only, and those with husband and wife and children over 18. In contrast, the lowest declines (of about 6 percent) were for husband and wife households with children < 6, and for single and other households. The biggest decline in expenditures in current dollar terms was a decline of $3,332 for husband and wife households with children over 18. Declines of over $2,200 were suffered by households with husband and wife only, and by households with husband and wife and other persons. These tend to be more mature households. In general, the declines in expenditures on items other than food, gasoline and healthcare between 2007 and 2010 rose with the number of people in the household. In real terms, the declines were 6.5 percent for one person households, and 11.7 percent for 5 person households. One person households saw a decline between 2007 and 2010 in current dollars of only $383, while 4 person households saw a decline of $3,016 and households with 5 or more persons a decline of $3,540. Clearly, the larger households were hardest hit in absolute and relative terms by the Great Recession. In general, households with higher incomes, older households, and larger households suffered the largest absolute and relative declines in expenditures on items other than food, gasoline and healthcare. Thus, the households with the largest potential to create demand in the economy for discretionary items were the ones that suffered the greatest damage to their capacity to spend.
23
Conclusion Household incomes after taxes, total household expenditures, and expenditures on most items, were rising rapidly in years prior to the beginning of the Great Recession in 2008. However, since then, spending on most items has fallen in both current terms and in terms of constant dollars. As a result, expenditures in real terms on many items in 2010 had fallen back either close to or below the level achieved in 2004. The money available for discretionary expenditures (that is, excluding expenditures on food, gasoline and healthcare) has shrunk dramatically. These declines have also depressed many businesses that were expecting incomes after taxes and expenditures to grow at the pre‐recession pace. For them, the gap between expectations and outcomes has been even wider than that indicated by the decline in actual expenditures. Unless the economic recovery can equal the 4.5 percent growth experienced in the average postwar recession, it may take a decade for household expenditures to regain the levels enjoyed prior to the Great Recession. Thus, households, and the businesses that serve them, will have to continue to make major adjustments in their planning as the process of recovery drags on.


![How the recession effects education in ireland[1][1]](https://static.fdocuments.in/doc/165x107/55a217e01a28abec118b4775/how-the-recession-effects-education-in-ireland11.jpg)