An example of gravimetric geoid computation: The Iberian Gravimetric Geoid of 2005.
I LLINOIUNIVERSITY OF ILLINOIS AT URBANA-CHAMPAIGN
PRODUCTION NOTE
University of Illinois atUrbana-Champaign Library
Large-scale Digitization Project, 2007.
Numbers 472 and 473 are missing


ABSTRACT
DURING THE SPRING OF 1960, A
GRAVITY AND MAGNETIC SURVEY WAS MADE
IN ILLINOIS. THE DATA OBTAINED THERE-
BY ARE PRESENTED IN THIS REPORT; THEY
ARE THEN INTERPRETED IN TERMS OF A
GRAVITY AND MAGNETIC ANOMALY PROFILE
ALONG THE 40TH PARALLEL ACROSS THE
STATE OF ILLINOIS

CONTENTS
I. DISCUSSION OF SURVEY . .
II. APPENDIX . . . . . . . .
A. List and DescriptionOccupied . . . . . .
B. Table 1 . . . . . .
C. Table 2 . . . . . .
D. Table 3 . . . . . .
E. Table 4 . . . . . .
F. Figure 1 . . . . . .
of Stations
. . . . . .
. . . . . .•
. . . . . .
. . . . . . . . 1
. . . . . . . . 4
. . . . . . . . 5
. . . . . . . . 12
. . . . . . . . 15
. . . . . . . . 17
. . . . . . . . 21
. . . . . . . . 24

I. DISCUSSION OF SURVEY
An extended gravimetric survey,
combined with a ground magnetometer
survey, was made during the spring of
1960. This survey was conducted along
the 40th parallel of latitude as a
followup to an aeromagnetic survey
flown along the same parallel in 1949
(Jensen, 1949).
The instrument used in the grav-
imetric survey was a Worden gravime-
ter (W-72, Houston Technical Labora-
tories). This gravimeter is small,
compact, and requires no temperature
compensating equipment. It was thus
readily applicable to an extended sur-
vey of this type conducted over a rel-
atively short period of time.
The instrument used in the mag-
netic survey was an Askania magnetom-
eter (Askania No. 521652). With this
magnetometer the vertical intensity of
the prevailing magnetic field can be
measured.
The field observations were made
on April 9, 10, 23, and 24, and on
May 1, 1960, with a field party of
four men: three graduate students
(G. Ratti, D. Bronkhorst, H. Gaudette);
and the supervisor, Dr. Wuerker. Sta-
tions were located on recent topo-
graphic maps of the narrow belt across
the State of Illinois along the 40th
parallel. Station locations were
spaced approximately 4 miles apart,
dependent upon topographic conditions
and availability for reoccupation.
The exact location of the stations in-
volved is given in the Appendix. The
set-up of the stations and the manner
of operation are shown in Figure 1.
The survey was divided into es-
sentially three traverses. These were:
1. Mount Pulaski, Illinois
West to Beardstown,
Illinois.
2. Beardstown, Illinois,
west to Station 25 west
of Camp Point, Illinois.
3. Mount Pulaski, Illinois,
east to Philo, Illinois.
On each traverse, readings were
taken by several members of the party

at each station in order to eliminate
observers' errors. Time, and station
location and description were logged
with the readings. As often as pos-
sible during each day's field work,
every fourth station was reoccupied
in order to calculate the drift of
the instruments.
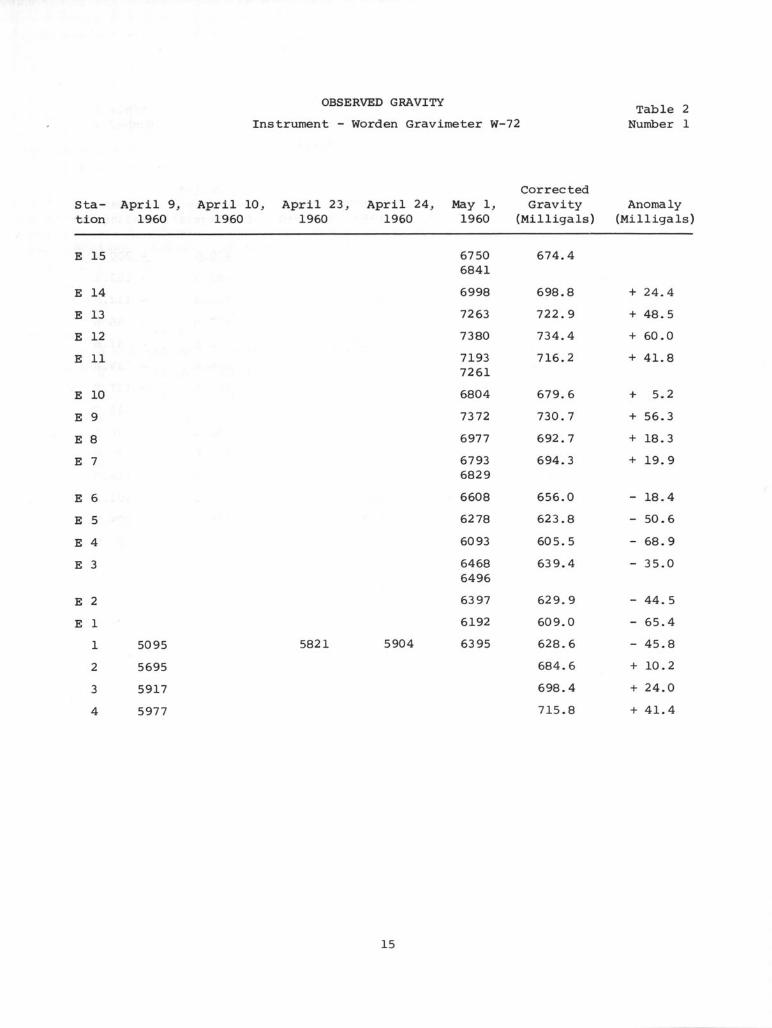
For the gravity survey, a base
station was established at Philo,
Illinois (Station E15), and the anoma-
lies determined in respect to this
base reference. The raw data are
given in Table 1. Instrument drift,
Bouguer, and free-air corrections were
computed in preparing the gravity data
for interpretation. Compensation for
the drift of the instrument was made
by redistributing the observed drift
at each reoccupied station among adja-
cent stations. The Bouguer correction
(based upon a density of 2.0 grams/
cubic centimeter) and the free-air cor-
rection were combined to correct the
gravity observations to a datum plane
of sea level. No latitude correction
was applied to the gravity observa-
tions, since the highest value of cor-
rection to be applied to bring the
data to the reference datum of the
40th parallel was only 4.5 milligals.
This value is considered to be insig-
nificant in this survey, since the
anomalies are observed to be of the
order of 100 to 200 milligals. Nei-
ther was terrain correction applied,
since the gravimetric observations
were made on the top of the till plain
which covers most of the central por-
tion of the State of Illinois. This
till plain is essentially flat with
only slight undulations due to mo-
rainal deposits or recent erosion.
Station locations were selected before
the field observations were begun in
localities free from any great topo-
graphic features. Upon application of
the drift, free-air, and Bouguer cor-
rections to the observed gravity read-
ings, "corrected" gravity readings, and
the gravity anomalies were determined.
These are summarized in Table 2. Re-
garding the accuracy, it may be noted
that the gravimeter had scale divi-
sions corresponding to 0.10305 milli-
gal; since it had an expanded dial
scale, it could be read to 1 scale di-
vision which yielded an accuracy of the
field gravity values of 0.1 milligal.
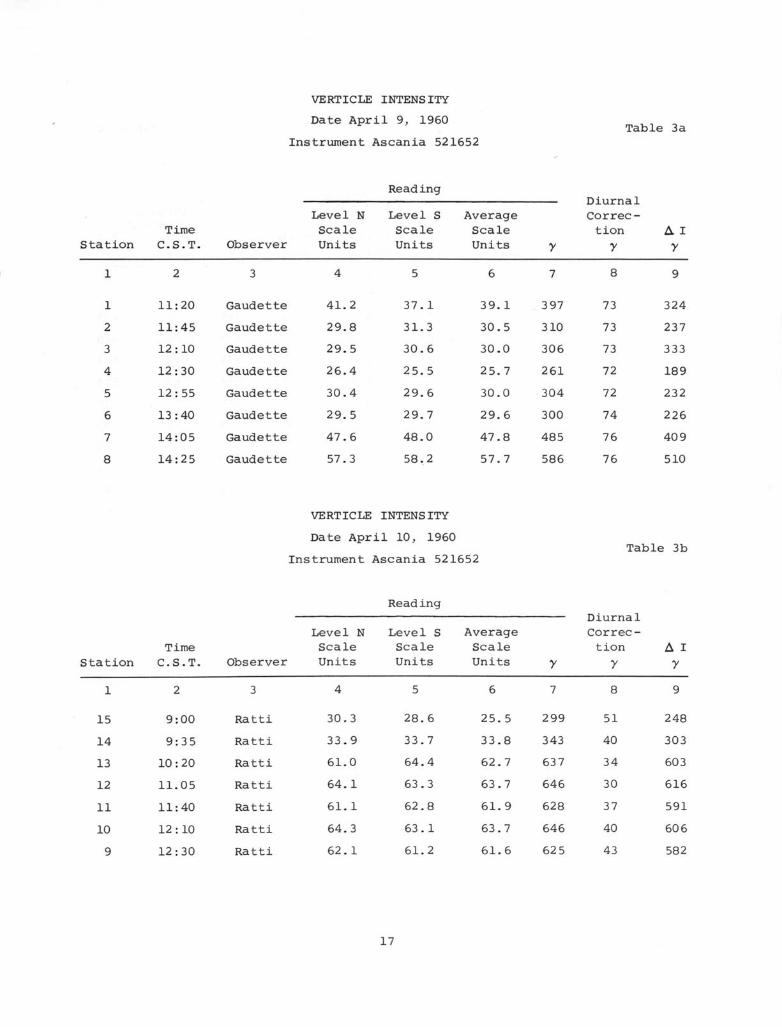
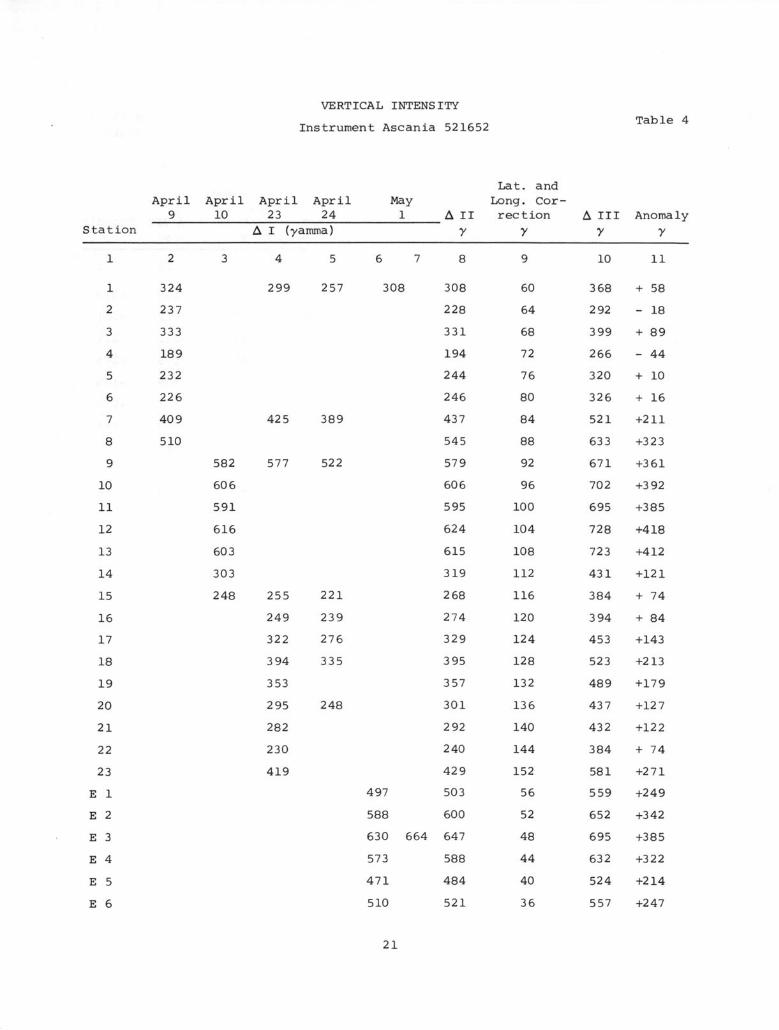
A procedure similar to that used
for the gravity survey was also fol-
lowed for the magnetic survey. The
raw values of the readings obtained at
the various stations are shown in Table
3. In preparing the data for interpre-
tation, corrections for the magnetic
disturbances obtained at the various
days of the survey were applied. These
were taken from magnetograms of the
Fredericksburg, Virginia, magnetic ob-
servatory which were kindly supplied
by the United States Coast and Geo-
detic Survey. A latitude and longi-
tude correction was also applied. The
final anomaly values (referring to
Station E15 as base station, as for

the gravity survey) are shown in Table
4. The magnetometer could be read to
an accuracy of about 0.2 scale units
which corresponds to an accuracy of
the final values of 2 y.
Finally, the gravity and magnetic
anomalies were plotted as a profile
which is shown in Figure 1. As a
means of comparison, the total magnetic
intensity measured in an airborne sur-
vey by Jensen (1949) is also shown in
Figure 1. It is seen that the two mag-
netic profiles agree fairly well.
Since the interpretation of the
above data in terms of crustal struc-
ture requires the introduction of a
variety of hypotheses, this is not at-
tempted here.
REFERENCES
H. Jensen, "Airborne magnetic profile
above 40th parallel, Eastern
Colorado to Western Indiana,"
Geophysics, Vol. 14, No. 1 (1949),
p. 57.

II. APPENDIX
STATIONS OF THE GEOPHYSICAL SURVEY
The following pages contain a
list and description of the stations
occupied during the period April 9,
1960 till May 1, 1960, in the course
of the geophysical survey across
Illinois.
The following abbreviations and
symbols are used:
M = Location of the magnetometer.
G = Location of the gravimeter.
© Township section number

LIST AND DESCRIPTION OF STATIONS OCCUPIED
Sheet,Range,
Township,Section
DistanceStation fromNumber Station 1 Latitude Longitude Location Sketch
T18N;R2W. 40° 890 M: In orchard,West of OF CARD Nfarmhouse,80' N. of M FARM 6
1 - 00.303' 18.70' road. G X 6 IG: N -side of
road. @ca. 500'W
Lincoln of crosspoint
TI8N;R3W. 40° 890 M: S-side ofcountry road,300' W. of
2 . 00.337' 23.26' crosspoint.G: S-side of road,
150' W. ofT.i L inr'ln r1 ?, p o T " i n t-
T18N;R3W. 40° 890 M: N-side of M .creek, 100' NE. of cross- X
3 6 ml. 00.337' 25.47' point CREEKG: N-side of
W. road at cross-Lincoln point.
TI8N;R4W. 400 890 M: In field, 100' M ) NW, 60' N. of X 6 ,
4 9 ml. 00.371' 29.10' crosspoint.G: N-side of
W. road, 30' W. @ )Lincoln of crosspoint.
TI8N;R4W. 40° 890 M: At E-W border- -@line of twofields, M POLE
5 14 ml. 00.303' 34.80' 300' W. of - • Icrosspoint. GX
W. G: W-side of road, @Mason 30' S. of cross-City point.
f

LIST AND DESCRIPTION OF STATIONS OCCUPIED (contd.)
TI8N;R!5
17 ml.W.
MasonCity
T18N; R(
7 214 mLW.
Masoncity
T18N; R(8 25% ml.
W.Peters -
burg
T18N; R7
30 ml.W.
Peters-burg
Tl8N; RE
10 34 ml.W.
Peters -burg
T18N; RE
11 37 3/4W.
Chand leville
M: W-side of CREEKcreek, 60' \1 \% I NN. of road. Le ®
G: N-side ofroad, 40' -W. of creek,ca. 700' W.of cross-point.
M: In picnic- -- -area, 200' -X/ NS. of road, PNICat W-side AREA Xof creek.
G: S-side of CREEK
road. 200' ROUTEE. of cross- 29point.
CORNFIELD N
M: In cornfield, M -40'N, 200' W. I--of crosspoint.
G: W-side of road, MEADOWat crosspoint.
I MX100XRN- N
M: In cornfield, FIRlELD100' E, 300' _____
N. of cross-point.
G: N-side of road, S 5at crosspoint.
G R E E K
M: 40' N. of road, NFNE 6 Nopposite tele-phone pole.
G: N-side of road,60' W. of tele-phone pole.
M: W-side of coun-try-road, 300' CREEK o "I
S. of crosspoint. e -G: SW-corner of Nm
crosspoint.

LIST AND DESCRIPTION OF STATIONS OCCUPIED (contd.)
T18N;R9W. 40° 90° M: In field, N
42 ml 50' S.,30'12 42 ml. 00.473' 06.45' W. of cross-
W.point. GX
Chandler- G: SW-corner of 'FENCEville crosspoint MX ECE
T18N;R1OW 40° 90° M: In unculti- Nvated area,
45 2/3 ml 100' S., 60' gx13 45 2/3 ml 02.015' 10.49' W. of cross- MX
W. point. M///G: S-side of
road, 40'Chandler- W. of cross-ville point.
T18N;R1OW 400 900 M: W-side of MX CREEK Ncreek, 130' GX
14 48 2/3 ml. 01.013' 15.13' N. of road.W.
G: N-side ofChandler- road, 30' W.ville of creek. CHURCH
TI8N;R11W 400 900 M: In baseball-
field, 60' 0oNW, 60' S of
15 53¼ ml. 01.150' 20.13' school. DW. G: W-side of mX
road, 60' rL-_Beards- S. of SCHOOL L
BASEBALLtown school. FIELD
N
TI8N;RI2W 40° 900 M: E-side ofcreek, under CREEKN-side of
16 57 ml. 01.250' 24.48' middle tree. S X )G: W-side of /
road, oppo-Beards- site middletown tree.
T1N;R1W. 400 900 M: In meadow, 60' ROUT O03S. of country
17 63½ ml. 01.590' 31.80' road, 40' W. of COUNTRY ROADW. end of fence. _ N
G: S-side of coun- 2 FENCRush- try-road, atville end of fence. MEADOW I

LIST AND DESCRIPTION OF STATIONS OCCUPIED (contd.)
TIN;R2W. 40° 900 M: In meadow, 4 MEADOWto Nhalfway fence NE. of farm, M
18 68½ ml. 01.895' 37.60' 30' adN. of 0road. E FARM G
W. G: N-side of 0L- X-
road, half- I ROUTE 103Rush- way fence, | 3ville at gate.
TIS;R3W. 390 900 M: In field, XM N
300' N, 100' 0 ./E. of cross- G EEK
74 ml. point.
19 W. 59,055' 43.52' G: N-side of ROUTE 24road, 100'
Mere- W. of cross-dosia point.
TIS;R3W. 390° 900 M: In field, W- 7 Nside of creek.
1000' S. of 020 7 . 59.255' 47.15' road.
G: S-side of R "X Croad, 30' W. X
Mt. of cross- COUNTRYG CREEKSterling point MXR
Mx -_
TIS;R4W 390 90° M: In field, 150'
21 81½ ml. 59.730' 52.33' N. of cross-W. point.
Mt. G: W-corner ofSterling crosspoint.
TIN;R5W 40° 900 M: In field, 120' NN. of road, ca. N1000' W. of W
22 85W ml. 01.520' 57.24' crosspoint MG: N-side of road, x 0
ca. 1000' W. of GAugusta crosspoint.
TIN;R6W 400 910 M: In field, 100' ! ROUTE 24
93½ ml. S, 100' E. of ---- N23 . 02.320' 06.50' crosspoint. 6
G: S-side of road, -aoCamp 10' E. of cross- 2 -- MXPoint point. 4ow

LIST AND DESCRIPTION OF STATIONS OCCUPIED (contd.)
TI8N;R3W. 40° 90° M: E-end ofcemetary, --20' S. of
4A 8h ml. 01.216' 28.62' road. - NW. G: In cemetary, XG M A
at E. side ,PATHof bend of CEMETERY I
Lincoln path. i
NT18N;R1W 40° 89° M: In field,130'
N. of road, ) XMEl 5 ml. 00.310' 13.10' opposite
E. farm house.G: S-side of -
Kenney road, opposite Gfarm house. FARM
T18;RIE 400 890 M: N-side ofroad, 300'E. of first
E2 9 ml. 00.360' 08.54' farm E. ofE. crosspoint.
G: N-side ofroad, 300'
Kenney E. of farm.
NT18N;R1E 40° 890 M: S-side of
road, 40'W. of end
E3 14 ml. 00.340' 02.92' of fence. GE. G: N-side of X --
road, op- M #FENCEposite W- a [
Kenney end of fence. BARN
TI8N;R2E 40° 880 M: In field,40' N. of i (! XMroad, ca.
17 ml. 1000' E. of -----E4 E. 00.460' 59.60' crosspoint.
G: N-side ofroad, ca.1000' E. of
Maroa crosspoint.
II I IT18N;R2E 40° 880 M: On middle
of road,E5 21 ml. 00.530' 55.09' 120' W. of
E. crosspoint.G: SW-corner of
Maroa croassointIa o __ _ _ _ __ _ _ _ _ __ _ _J _ _ __ _ _I _ __ _ _ __ _ _ __ _
&
I
N

LIST AND DESCRIPTION OF STATIONS OCCUPIED (contd.)
T18N;R3E. 40° 880 M: In corn-
field, 50' M
E6 25 ml. 00.685' 50.53' of cross- Xpoint.
G: NW-cornerof cross- 22
Maroa point.
TI8N;R4E. 40° 880 M: In clover-
field, 60' M NN., 400' E. X B
29 ml. of cross- x-
E7 . 00.730' 45.80' point.G: N-side of
road, 400' @E. of cross-
Maroa point.
T18N;R5E. 40° 880 M: On farm road, CREEK,33 ml. 40' E. from
E8 E. 00.700' 41.24' main road. , FARMG: On triangle ROAD
Monticello at crosspoint.
T18N;R5E. 400 880 M: In field, 70'S. of road, (N500' E. of N
E9 37 1/3 ml. 01.090' 36.42' bend in road.E.G: N-side of
road, 500'E. of bend RIVER
Monticello in road.
TI8N;R6E. 40° 880 M: In cornfield, a e
40 ml. 150' S. 30' W.E10 E. 00.580' 33.50' of crosspoint.
G: S-side of cross- --Monticello point. M
T18N;R7E. 40° 880 M: In meadow, 30' NS. of road, "
45 ml. 30' E. of fence.Ell E. 00.615' 27.78' G: N-side of road,
30' W. of coun- 4Mahomet ty line. M P'i 1/ [
I_ __________________________ " I

LIST AND DESCRIPTION OF STATIONS OCCUPIED (contd.)
T18N;R7E 40° 880 M: W-side of (road, 40' 14
49 ml. S. of cross-E12 . 00.615' 23.32' point.
of cross- 203
Mahomet point. MX
TI8N;R8E 40° 880 M: W-side of MX Nroad, 30' GX 1ON. of cross-
E13 54 ml. 00.720' 18.84' point.E. G: W-side of
road, 40'N. of cross-
Mahomet point.
T18N;R8E 40° 880 M: 5' N. of 8road, ca.1000' W. of MX G N
E14 58 ml. 00.680' 14.60' crosspoint. n
E. G: N-side ofroad, ca.950' W. of
Mahomet crosspoint.
Tl8N;RlOE 40° 880 M: In meadow FARM 0 MEDOWE. of Eastern- EADOWmost farm along ,C- M
road, 60' N. of i x
E15 62 1/3 m 00.720' 09.33' road, 40' W. of L---..-
E. fence. X
G: S-side of road, Bopposite end 2
Urbana of fence.

DATA SHEET
GRAVITY SURVEY
Instrument - Worden Gravimeter W-72
Sta- Date Timetion 1960 C.S.T. Latitude Longitude
Eleva-tion(feet)
GravityReading(ScaleUnits) Observer Remarks
1 4/9 11:20 40° 00.30' 890 18.7'
4/9
4/9
4/9
4/9
4/9
4/9
4/9
4/10
4/10
4/10
4/10
4/10
4/10
4/10
4/23
4/23
4/23
4/23
4/23
11:45
12:10
12:30
12:55
13:40
14:05
14:25
9:00
9:35
10:10
11:05
11:40
12:10
12:30
10:05
11:15
11:45
12:50
13:10
00.34'
00.34'
00.371'
00.30'
00.30'
00.29'
00.29'
01.15'
01.01'
02.02'
00.47'
00.17'
00.69'
00.70'
00.30'
00.29'
00.70'
01.20'
01.25'
23.3'
25.5'
29.1'
39.8'
38.4'
43.0'
47.7'
20.3'
15.1'
10.5'
06.4'
01.7'
57.4'
52.3'
18.7'
43.0'
52.3'
20.3'
24.5'
5095 Ratti
5695
5917
5977
3609
3809
4514
5054
4712
4888
5087
4653
4685
5448
5288
5821
5189
5775
5212
5392
Ratti
Ratti
Ratti
Ratti
Ratti
Ratti
Ratti
Gaudette
Gaudette
Gaudette
Gaudette
Gaudette
Gaudette
Gaudette
Bronkhorst
Bronkhorst
Bronkhorst
Bronkhorst
Bronkhorst
Table 1Number 1
Readingstaken ontripod
it
Readingstaken onground

DATA SHEET
GRAVITY SURVEY
Instrument - Worden Gravimeter W-72
Sta- Date Timetion 1960 C.S.T. Latitude Longitude
Eleva-tion
(feet)
GravityReading(ScaleUnits) Observer Remarks
17 4/23 14:55 400 01.59'
4/23 15:10 400 01.89'
4/23 15:40 390 59.05'
4/23 15:55 390 59.26'
4/23 16:20 390 59.73'
4/23 16:35 400 01.52'
4/23 17:00 40° 02.32'
4/23
4/23
4/23
4/24
4/24
4/24
4/24
4/24
4/24
4/24
4/24
4/24
4/24
17:25
17:35
17: 55
7:35
7:55
8:15
8:35
8:55
9:15
10:20
12: 15
12: 50
13: 15
90° 31.80'
90° 37.60'
90° 43.52'
900 47.15'
900 52.33'
90° 57.24'
910 06.50'
390 59.23' 900 47.15'
40° 01.22' 90° 28.62'
40° 00.30' 890 18.70'
710
673
450
480
435
475
600
580
700
614
5300 Bronkhorst Readingstaken onground
4104
3930
3448
3979
5071
3981
3449
3922
4046
4206
5659
5405
5477
5288
5854
5259
5175
5904
Bronkhorst
Bronkhorst
Bronkhorst
Bronkhorst
Bronkhorst
Bronkhorst
Ratti
Ratti
Ratti
Ratti
Ratti
Ratti
Ratti
Ratti
Ratti
Ratti
Ratti
Ratti
Ratti
Table 1Number 2
l"

DATA SHEET
GRAVITY SURVEY
Instrument - Worden Gravimeter W-72
Sta- Date Timetion 1960 C.S.T. Latitude Longitude
GravityEleva- Readingtion (Scale(feet) Units) Observer Remarks
7:45 40° 00.72'
8:00
8:20
8:55
9:15
9:40
10:00
10 :20
10:40
11:00
11:15
11:30
11: 50
12: 10
12:25
13 :45
14:30
15: 15
15: 50
16:30
00.68'
00.72'
00.62'
00.62'
00.58'
01.09'
00.70'
00.73'
00.68'
00.53'
00.46'
00.34'
00.36'
00.31'
880 09.33'
14.60'
18.84'
23.32'
27.78'
33.50'
36.42'
41.24'
45.80'
50.53'
50.09'
59.60'
02.92'
08.54'
13.10'
730 6750 Gaudette Readingstaken ontripod
726
690
687
703
735
655
676
687
691
701
706
655
621
615
6998
7263
7380
7193
6804
7372
6977
6793
6608
6278
6093
6468
6397
6192
6395
6496
6829
7261
6841
Gaudette
Gaudette
Gaudette
Gaudette
Gaudette
Gaudette
Gaudette
Gaudette
Gaudette
Gaudette
Gaudette
Gaudette
Gaudette
Gaudette
Gaudette
Gaudette
Gaudette
Gaudette
Gaudette
II
Table 1Number 3
E 15 5/1
OBSERVED GRAVITY
Instrument - Worden Gravimeter W-72
Sta- April 9, April 10,tion 1960 1960
April 23,1960
April 24,1960
E 15
58215095
5695
5917
5977
5904
CorrectedMay 1, Gravity
1960 (Milligals)
67506841
6998
7263
7380
71937261
6804
7372
6977
67936829
6608
6278
6093
64686496
6397
6192
6395
674.4
698.8
722.9
734.4
716.2
679.6
730.7
692.7
694.3
656.0
623.8
605.5
639.4
629.9
609.0
628.6
684.6
698.4
715.8
Anomaly(Milligals)
24.4
48.5
60.0
41.8
5.2
56.3
18.3
19.9
- 18.4
- 50.6
- 68.9
- 35.0
- 44.5
- 65.4
- 45.8
+ 10.2
+ 24.0
+ 41.4
Table 2Number 1

OBSERVED GRAVITY
Instrument - Worden Gravimeter W-72
Sta- April 9, April 10,tion 1960 1960
3609
3809
4514
5054
5288
5448
4685
4653
5087
4888
4712
April 23,1960
5189
5775
5212
5392
5300
5554
4104
39303922
34483449
39793981
5071
April 24,1960
5259
5854
5288
5477
5403
5659
4206
4046
CorrectedMay 1, Gravity1960 (Milligals)
470.0
493.3
562.4
617.8
622.8
636.6
562.5
560.5
598.1
576.8
557.5
573.3
568.1
591.4
461.4
441.6
395.8
448.4
557.9
Anomaly(Milligals)
- 200.4
- 181.1
- 112.0
- 56.6
- 51.6
- 37.8
- 111.9
- 113.9
- 76.3
- 97.6
- 116.9
- 101.1
- 106.3
- 83.0
- 213.0
- 232.8
- 278.6
- 226.0
- 116.5
5175
Table 2Number 2
VERTICLE INTENSITY
Date April 9, 1960
Instrument Ascania 521652
Reading
TimeStation C.S.T.
11:20
11:45
12: 10
12: 30
12: 55
13:40
14:05
14:25
Level NScale
Observer Units
3
Gaudette
Gaudette
Gaudette
Gaudette
Gaudette
Gaudette
Gaudette
Gaudette
4
41.2
29.8
29.5
26.4
30.4
29.5
47.6
57.3
Level SScaleUnits
5
37.1
31.3
30.6
25.5
29.6
29.7
48.0
58.2
DiurnalAverageScaleUnits
Correc-tion
y y
6
39.1
30.5
30.0
25.7
30.0
29.6
47.8
57.7
VERTICLE INTENSITY
Date April 10, 1960
Instrument Ascania 521652
TimeStation C.S.T.
9:00
9:35
10:20
11.05
11:40
12: 10
12: 30
Level NScale
Observer Units
3
Ratti
Ratti
Ratti
Ratti
Ratti
Ratti
Ratti
4
30.3
33.9
61.0
64.1
61.1
64.3
62.1
Table 3a
Reading
Table 3b
AverageScaleUnits
DiurnalCorrec-
tion
y
Level SScaleUnits
5
28.6
33.7
64.4
63.3
62.8
63.1
61.2
6
25.5
33.8
62.7
63.7
61.9
63.7
61.6

VERTICLE INTENSITY
Date April 23, 1960
Instrument Ascania 521652
Level N Level S AverageTime
Station C.S.T.
10:05
11:15
11:45
12: 50
13:10
14:55
15:10
15:40
15: 55
16:20
16:35
17:00
ScaleObserver Units
3
Ratti
Ratti
Ratti
Ratti
Ratti
Ratti
Ratti
Ratti
Ratti
Ratti
Ratti
Ratti
Table 3c
Reading
ScaleUnits
DiurnalCorrec-
tion
y
ScaleUnits
5
34.4
46.9
62.4
31.2
30.8
38.8
46.0
43.1
37.0
26.4
30.1
49.7
4
34.5
47.6
62.0
31.0
30.6
38.9
46.0
42.0
37.2
26.2
32.7
49.5
6
34.5
47.2
62.2
31.1
30.7
38.8
46.0
42.5
37.1
26.3
31.4
49.6

VERTICLE INTENSITY
Date April 24, 1960
Instrument Ascania 521652
TimeStation C.S.T.
Level NScale
Observer Units
3
Bronkhorst
Bronkhorst
Bronkhorst
Bronkhorst
Bronkhorst
Bronkhorst
Bronkhorst
Bronkhorst
Bronkhorst
6 7
Table 3d
Reading
Level SScaleUnits
AverageScaleUnits
DiurnalCorrec-
tiony
2
7:35
8:15
8:35
8:55
9:15
10:20
12: 55
12: 50
13: 15
33.3
39.8
33.2
30.3
27.8
58.1
45.2
21.3
33.6
32.1
40.6
34.0
29.1
28.0
56.5
45.3
21.7
33.1
32.7
40.2
33.6
29.7
27.9
57.3
45.2
21.5
33.3
332
408
341
301
283
582
458
218
338
248
335
276
239
221
522
389
142
257

VERTICAL INTENSITY
Date May 1, 1960
Instrument Ascania 521652
Reading
Diurnal
TimeStation C.S.T.
7:45
8:00
8:20
8:55
9:15
9:40
10:00
10:20
10 :40
11:00
11:15
11:30
11: 50
12: 10
12:25
13 45
14:30
15:15
15: 50
16:30
Level N Level SScale Scale
Observer Units Units
3
Ratti
Ratti
Ratti
Ratti
Ratti
Ratti
Ratti
Ratti
Ratti
Ratti
Ratti
Ratti
Ratti
Ratti
Ratti
Ratti
Ratti
Ratti
Ratti
Ratti
4
38.2
45.0
50.0
55.6
57.1
57.6
57.9
65.1
57.3
59.7
55.9
66.2
71.6
67.5
59.2
41.0
76.6
61.1
60.8
42.5
5
38.3
45.5
54.0
54.2
56.6
58.5
58.6
65.4
57.7
59.6
56.1
65.6
71.8
68.2
59.1
40.9
76.5
61.0
61.1
42.5
AverageScaleUnits
6
38.2
45.2
52.0
54.9
56.8
58.0
58.2
65.2
57.5
59.6
56.0
65.9
71.7
67.8
59.1
40.9
76.5
61.0
60.9
42.5
Correc-tion
7 y
7 8
388
459
527
557
576
588
591
662
583
605
568
669
727
688
600
416
776
619
618
431
Table 3e
296
367
435
465
484
496
498
574
488
510
471
573
630
588
497
308
664
506
503
325
VERTICAL INTENSITY
Instrument Ascania 521652
April April April April9 10 23 24
A I (yamma)
Lat. andLong. Cor-
A II rection
y yA III Anomaly
y V
1 2 3 4 5 6 7 8
324
237
333
189
232
226
409
510
582
606
591
616
603
303
248
299 257
425 389
577 522
1
2
3
4
5
6
7
8
9
10
11
12
13
14
15
16
17
18
19
20
21
22
23
E 1
E 2
E 3
E 4
E 5
E 6
221
239
276
335
248
10 11
Station
Table 4
308
255
249
322
394
353
295
282
230
419
228
331
194
244
246
437
545
579
606
595
624
615
319
268
274
329
395
357
301
292
240
429
503
600
664 647
588
484
521
368
292
399
266
320
326
521
633
671
702
695
728
723
431
384
394
453
523
489
437
432
384
581
559
652
695
632
524
557
+ 58
- 18
+ 89
- 44
+ 10
+ 16
+211
+323
+361
+392
+385
+418
+412
+121
+ 74
+ 84
+143
+213
+179
+127
+122
+ 74
+271
+249
+342
+385
+322
+214
+247
497
588
630
573
471
510

VERTICAL INTENSITY
Instrument Ascania 521652
April April April April9 10 23 24
A I (yamma)
Lat. andLong. Cor-
A II rection
y 7A III Anomaly
y7
2 3 4 5 6 7 8 9
488
574
498
496
484
465
435
367
296
10 11i
506
503
325
+219
+301
+221
+215
+199
+177
+145
+ 74
0
- 46
Station
Table 4contd.
E 7
E 8
E 9
E 10
E 11
E 12
E 13
E 14
E 15
4 A
*


3100
3100
TOTALMA"NELTC
INTENSITYT
2900
2*00
ZTOO
TOTAL MAGN
VERTICAL- MGRAVITY AN
SCALE IN MILES
0 a 16 4*
SCHUYLERMASON
ADAMS
MENARD
I I El as Ia&
[ i cf n iBROW N
_ K __ SANGAMON
d SPRINGFIELD
MORGAN
FIGURE 1. MAGNETIC AND GRAVIMETRIC PROFILE ACROSS ILLINOIS
QUINCY
Mil

LOG6&N
o SW ITT
CLINTON
* CI4AMPAIOW
I USSAWAICHAM PAIGE
-aGo
SAW VILLEU
VEEMILLION
7 6 A 3 2 I El EI 1 EAA ES E ET ES M9 E0 tU) Z E13 EZ14 EI A E%17 ZA 1*F- - -I|
J SANGAMO- tco.. |
Ipainents. DE- ___ ---- - --. --I- ----_
IN PEST
-o
0
-~0
-urn
-7U0
-moo
-'ago
-hOC
,NA
MAWN
ME WA C
.1