GRATITUDE - Tulane University Digital Library
186
Transcript of GRATITUDE - Tulane University Digital Library

2
GRATITUDE My education at Tulane has been one of the greatest experiences in my career. I owe a great deal to all the professors in the department of Health Systems Management. My special thanks go to all committee members, Dr. Jian Li, Dr. Joby John and especially Dr. Lizheng Shi for his input and support in guiding me through this journey. I would like to specially thank Dr. Claudia Campbell who throughout my educational endeavor at Tulane has been the ideal mentor who inspired me and taught me how to think critically and analytically in order to become a better researcher and scientist. I would also like to thank my family for their patience, my colleagues, my residents, my students and my patients for being understanding and accommodative throughout the project. Most importantly, I would also like to thank God for making all of this happen.

3
TABLE OF CONTENTS
ABSTRACT ....................................................................................................................................... PAGE 5
CHAPTER 1 .................................................................................................................................................
INTRODUCTION ................................................................................................................................. PAGE 9
CHAPTER 2 .................................................................................................................................................
BACKGROUND ................................................................................................................................. PAGE 12 QUALITY REPORTING ..................................................................................................................................... 13
VALUE BASED PURCHASING ............................................................................................................................ 16 HCAHPS ..................................................................................................................................................... 19
CHAPTER 3 .................................................................................................................................................
SATISFACTION THEORIES .................................................................................................................. PAGE 22 DETERMINANTS OF SATISFACTION ........................................................................................................... 28 SATISFACTION THEORIES INTERACTION WITH DETERMINANTS................................................................................ 37
PROCESS OF CARE MEASURES AND PATIENT SATISFACTION .................................................................................... 38
CHAPTER 4 .................................................................................................................................................
CONCEPTUAL FRAMEWORK ............................................................................................................. PAGE 49 RESEARCH QUESTIONS AND HYPOTHESES ................................................................................................ 53
CHAPTER 5 .................................................................................................................................................
METHODS ......................................................................................................................................... PAGE 56 DESIGN ..................................................................................................................................................... 56 DATA SOURCES ........................................................................................................................................... 56 IRB ........................................................................................................................................................... 60 SAMPLE ..................................................................................................................................................... 60 MEASUREMENT ........................................................................................................................................... 61 DATA EVALUATION ....................................................................................................................................... 65 STATISTICAL ANALYSIS ................................................................................................................................... 66 EQUATION MODELS ...................................................................................................................................... 66
CHAPTER 6 ................................................................................................................................................. RESULTS ............................................................................................................................................ PAGE 75
OUTCOME VARIABLE ..................................................................................................................................... 75 HOSPITAL CHARACTERISTICS ........................................................................................................................... 77 HCAHPS AND PROCESS MEASURES DATA CHARACTERISTICS ................................................................................... 75 GLM REGRESSION RESULTS FOR RESEARCH QUESTION 1 ....................................................................................... 89 STRUCTURE MEASURES COEFFICIENTS ............................................................................................................ 102 GLM REGRESSION RESULTS FOR RESEARCH QUESTION 2 ..................................................................................... 106 RESULTS SUMMARY………………………………………………………………………………………………………………………………..115

4
TABLE OF CONTENTS (cont.)
CHAPTER 7 ................................................................................................................................................. DISCUSSION .................................................................................................................................... PAGE 118 MODEL OF RELATIONSHIPS .......................................................................................................................... 139
LIMITATIONS ............................................................................................................................................ 139
CHAPTER 8 ................................................................................................................................................. CLINICAL IMPLICATIONS .................................................................................................................. PAGE 144 POLICY IMPLICATIONS………………………………………………………………………………………………………………….PAGE 145 FUTURE RESEARCH .......................................................................................................................... PAGE 145 CONCLUSION…………………………………………………………………………………………………………………………………PAGE 147 REFERENCES ................................................................................................................................ PAGE 150 APPENDIXES ................................................................................................................................ PAGE 169

5
ABSTRACT Background:
US healthcare expenditures continue to rise although the trend is slowing down recently
1. Unfortunately despite the increase in spending, quality of health care delivery needs
improvement 2. In January of 2011, CMS proposed to implement a Hospital Value-Based
Purchasing Program (HVBP) under which value-based incentive payments will be made
in a fiscal year to hospitals that meet performance standards with respect to a
performance period for the fiscal year involved 3. For fiscal year 2014, a hospital’s
performance in VBP was based on its performance on 45% clinical process of care, 25%
outcome (mortality) and 30% experience of care. Patient experience of care is measured
by a national, standardized survey of hospital patients about their experiences during a
recent inpatient hospital stay. This is also referred to as HCAHPS (Hospital Consumer
Assessment of Healthcare Providers and Systems) 4.The Donabedian model for quality
assessment (structure, process, and outcome) provides a good framework for satisfaction
dimensions. Donabedian proposed that satisfaction was the principal outcome of the
interpersonal process of care. He also regarded "outcome" as the most important aspect
of quality of care. 17, 18. Critics have argued that associations between patients’ reports of
experiences and available measures of hospital quality and safety would add to the
credibility of HCAHPS measures 7.
There is a paucity of studies looking into the association between individual hospital
process of care quality measures and patient satisfaction. The studies showing association
mostly examined summary quality process scores instead of effects of individual process
of care scores. 6, 7, 19, 20. In addition studies on the relationship between patients’

6
experiences and the quality of clinical care have had mixed results. No studies have been
done analyzing the role of each HCHAPS composite within each process of care measure
to determine global patient satisfaction.
Method:
An observational retrospective, cross-sectional design was used to analyze the
relationship between each individual hospital process of care measure for acute MI, heart
failure (HF), pneumonia (PN), SCIP (surgical care improvement project), stroke (SK),
VTE (thromboembolism), and the global patient satisfaction HCAHPS score (definitely
recommend hospital) using General Linear Modeling regression analysis using the
Donabedian framework. The data collection period is from 7/1/2012- 6/30/2013.
The sample consists of 551 hospitals in the West South Central Region consisting of the
states of Louisiana, Arkansas, Texas and Oklahoma that report HCHAPS measures in
Hospital Compare. Hospitals reporting HCAHPS data are then matched with the
American Hospital Association annual survey database to capture hospital characteristics
for bed size, ICU bed capacity, Medicare spending per beneficiary, nurse staffing,
Medicaid volume, Medicare volume, rural status, for-profit status and specialty hospital
status that are used in the analysis as adjustment factors to control for differences in
hospitals that could affect outcomes.
Results:
We expected to find a significant relationship between all individual process measures
and the percent of patients definitely recommending hospital. Instead, only a few
significant measures with a p value<0.05 were identified for individual process of care
scores in all diagnostic groups. The strongest relationships were found for discharge

7
meds in stroke and myocardial infarction (dc on antithrombotic, β= 0.34 and dc on
aspirin, β=0.67 respectively), assessment of left ventricular function for heart failure (β=
1.96), cultures before antibiotics for pneumonia (β= 0.49) and infection prevention
measures for surgery SCIP (outpatient antibiotic within one hour of surgery β= 0.74,
given right antibiotic β= 0.67). These associations have also the strongest relationship to
other outcomes such as readmission, mortality and infection.
When analyzing the impact of individual HCAHPS process measures within each quality
metric group, almost all HCAHPS composites were statistically significant in
determining percent of patients definitely recommending the hospital. However, pain
control seems to be the dominant determinant for larger hospitals with greater than 100
beds. (β= 1.25 for stroke, 1.34 for VTE, 1.27 for MI, 1.27 for HF, 1.39 for pneumonia
and 1.44 for SCIP). In smaller hospitals with beds less than 100, nurse communication is
the stronger determining factor of patient satisfaction for CHF, Pneumonia and SCIP (β=
0.83, 0.95, and 0.63 respectively).
Conclusion:
Global patient satisfaction with hospital care was related to only a few significant
measures within different process of care tracts. Although some of these measures could
be relevant for policy recommendations (discharge meds for stroke/AMI, LV function for
HF, cultures before antibiotics for pneumonia and infection prevention measures for
SCIP), more needs to be done to understand the drivers behind the strengths of the
relationships of these measures with global patient satisfaction, including their
associations with other outcomes such as readmission, mortality, or infection.

8
Among HCAHPS composites, pain control is most important determining factor of global
satisfaction among larger hospitals with beds>100. Additional studies need to be
performed to understand influencers of pain perception and the variability of the strengths
of the measures relationships with patient satisfaction among different bed sizes within
each process of care measure.

9
CHAPTER ONE INTRODUCTION
US healthcare costs continue to grow although the trend is slowing down recently 24.
Controlling this growth has become a major policy priority. Unfortunately despite the
increase in spending, quality of health care delivery needs improvement. Moreover,
Americans report a low level of satisfaction with the health care system; in some surveys,
only 40 percent of those interviewed reported being “fairly satisfied” or “very satisfied”
with how health care is delivered in this country 2. Different approaches to quality
improvement have emerged, including the use of evidence-based medicine and clinical
practice guidelines, professional development, assessment and accountability, patient
empowerment, and total quality management 25. In January 2011, CMS proposed to
implement a Hospital Value-Based Purchasing program (HVBP) under which value-
based incentive payments will be made in a fiscal year to hospitals that meet performance
standards with respect to a performance period for the fiscal year involved 26. HVBP is
part of the Centers for Medicare & Medicaid Services’ (CMS’) long-standing effort to
link Medicare’s payment system to improve healthcare quality, including the quality of
care provided in the inpatient hospital setting. The measures initially adopted for the
program are a subset of the measures that were already adopted for the existing Medicare
Hospital Inpatient Quality Reporting Program (Hospital IQR program) 3, 27.
A hospital’s performance in HVBP was based on its performance for FY2014 on 45%
clinical process of care, 25% outcome (mortality) and 30% experience of care. Patient

10
experience of care is measured by a national, standardized survey of hospital patients
about their experiences during a recent inpatient hospital stay. This is also referred to as
HCAHPS (Hospital Consumer Assessment of Healthcare Providers and Systems) 28.
HVBP is funded through a reduction from participating hospitals’ Diagnosis-Related
Group (DRG) payments for the applicable fiscal year. The money that is withheld will be
redistributed to hospitals based on their Total Performance Scores (TPS). Roughly $850
million dollars in VBP incentives were paid out to participating hospitals in FY 2013.
The program was financed through a 1% across-the-board reduction in FY 2013
diagnosis-related group (DRG)-based inpatient payments to participating hospitals 5. Of
this dollar amount 30% was derived from patient satisfaction scores based on the
HCAHPS survey scores. This significant percentage of reimbursement at risk is expected
to grow with more reduction in DRG –based payments by 2017.
The HCAHPS survey, developed by the Agency for Healthcare Research and Quality,
asks patients 32 questions about their experiences in the hospital and about their
demographic characteristics. Possible responses (always, usually, sometimes, and never)
are summarized by CMS and reported in 7 domains as composites: communication with
physicians, communication with nurses, communication about medications, quality of
nursing services (responsiveness of staff), adequacy of planning for discharge, pain
management, and care transition 28. Care transition composites have been added to
HCAHPS in October 2014. Critics have argued that HCAHPS measures, which reflect
the experiences of a broader sample of patients, might provide a more representative
summary of selected aspects of care quality 29. Others have argued that associations

11
between patients’ reports of experiences and available measures of hospital quality and
safety would add to the credibility of HCAHPS measures7. The Donabedian model for
quality assessment (structure, process, and outcome) provides a good framework for
satisfaction dimensions 18. Structural aspects include access, cost and physical
environment. Process aspects include technical quality, interpersonal communications,
and coordination of care 17. Outcomes aspects include satisfaction with health 30.
Donabedian proposed that satisfaction was the principal outcome of the interpersonal
process of care. He also regarded "outcome" as the most important aspect 1 7 .
There is a paucity of studies looking into the association of individual hospital process of
care quality measures and patient satisfaction 10,14,22,31 No studies have been done to
analyze the relationship between current stroke and venous thromboembolism (VTE)
process of care quality measures and patient satisfaction. In addition, no studies have
been done studying the role of each HCAHPS composite scores for each process of care
measure to determine how they predict global patient satisfaction. This gap in the
literature provides a unique opportunity to analyze the relationship between each
individual hospital process of care measure for acute MI, heart failure, pneumonia, SCIP,
stroke, VTE and global patient satisfaction HCAHPS scores using the Donabedian
framework. This study also incorporates other HCAHPS composite components into
quality elements to determine relationship with global satisfaction with care.

12
CHAPTER TWO
BACKGROUND
United Stated healthcare National Health Expenditures continue to increase, growing to
$2.5 trillion in 2009, $2.6 trillion in 2010 more than three times the $714 billion spent in
1990, and over eight times the $253 billion spent in 1980 32. Controlling this growth has
become a major policy priority. There is general agreement that health costs are likely to
continue to increase in the foreseeable future. In 2008, U.S. health care spending was
about $7,681 per resident. The health share of GDP grew reached 17.3% in 2009 and is
projected to reach 19.3% in 2019. US health spending is among the highest of all
industrialized countries 24, 33, 34. It is noticeable that health spending has been growing at
historically low levels in recent years. According to the Office of the Actuary (OACT) in
the Centers for Medicare and Medicaid Services, national health spending grew by 3.9%
each year from 2009 to 2011, the lowest rate of growth since the federal government
began keeping such statistics in 1960. Estimates from the Center for Sustainable Health
Spending at the Altarum Institute suggest that the slowdown largely continued into 2012,
with health spending growing by 4.3% last year. This slowdown in health spending is a
result of broader economic factors (such as the Great Recession of 2007-2009), structural
changes in the health system that could lead to slower growth in the future as well, or
some combination of the two 24,34.

13
Despite the favorable slowing in spending growth, US health care quality needs
improvement. The World Health Organization Health Report 2000, ranked the U.S.
health care system only 37th overall among 191 countries, with the major deficiencies
being in the areas of health status, fairness in financial contribution, and responsiveness
to people’s expectations of the health system. Moreover, Americans report a low level of
satisfaction with the health care system; in some surveys, only 40 percent of those
interviewed reported being “fairly satisfied” or “very satisfied” with how health care is
delivered in this country 2. Different approaches to quality improvement have emerged,
including the use of evidence-based medicine and clinical practice guidelines,
professional development, assessment and accountability, patient empowerment, and
total quality management 25.
The Hospital IQR (inpatient quality reporting) Program was developed as a result of the
Medicare Prescription Drug Improvement and Modernization Act (MMA) of 2003. The
Hospital IQR Program is intended to equip consumers with quality of care information to
make more informed decisions about healthcare options. It is also intended to encourage
hospitals and clinicians to improve the quality of inpatient care provided to all patients.
Section 5001(a) of Pub. 109-171 of the Deficit Reduction Act (DRA) of 2005 provided
new requirements for the Hospital IQR Program, which built on the voluntary Hospital
Quality Initiative. The Section of the MMA authorized CMS to pay hospitals that
successfully report designated quality measures a higher annual rate to their payment
rates. Initially, the MMA provided for a 0.4% reduction in the annual market basket
update for hospitals that did not successfully report. The Deficit Reduction Act of 2005

14
increased that reduction to 2.0 percentage points 35. Quality measures included in
Hospital IQR Program are used to gauge how well an entity provides care to its patients.
Measures are based on scientific evidence and can reflect guidelines, standards of care, or
practice parameters.
A quality measure converts medical information from patient records into a rate or
percentage that allows facilities to assess their performance. Process of care measures are
measures that show, in percentage form or as a rate, whether or not a health care provider
gives recommended care; that is, the treatment known to give the best results for most
patients with a particular condition. Conditions covered under process of care measures
include AMI (acute myocardial infarction), HF (heart failure), PN (pneumonia), SCIP
(surgical care improvement project) measures, SK (stroke), VTE (venous
thromboembolism), ED (emergency department throughput measures), and
immunization. Outcome measures are measures designed to reflect the results of care,
rather than whether or not a specific treatment or intervention was performed. These
include Health Care Associated Infections, thirty-day mortality for HF/MI/pneumonia,
30-day readmission for HF/MI/PN, AHRQ (Agency for Health Care Research and
Quality) measures including complication/patient safety for selected indicators and
deaths among surgical patients with serious treatable complications .Hip and knee
complications, and cost efficiency measures (Medicare spending per beneficiary) are also
included. IQR data is listed in Appendix A.

15
The hospital quality of care information gathered through the hospital IQR program is
available to consumers on the Hospital Compare website:
http://www.medicare.gov/hospitalcompare. Hospital Compare currently provides
information on quality measures, which include clinical process of care, clinical outcome
measures and patient experiences of care topics. Through Hospital Compare, consumers
are able to get a better picture of the quality of care delivered at their local hospitals. The
patient experience of care is measured by a national, standardized survey of hospital
patients about their experiences during a recent inpatient hospital stay. This survey is
also referred to as HCAHPS (Hospital Consumer Assessment of Healthcare
Providers and Systems) 27.See Appendix C for all Hospital Compare measures.
Some of the quality-reporting approaches have not brought about substantial changes in
clinical practice. (E.g. legislative mandates for immunization at the state levels did not
result originally in significant improvement in immunization rates) 36 .As a result, some
purchasers, public and private employers, business coalitions, and public programs (e.g.,
Medicare and Medicaid) attempted to build quality considerations into their health care
purchasing programs. Consequently, purchasers, rather than patients, have begun to
establish themselves as the real customers within the health care delivery system, giving
them a remarkable responsibility and interest in getting value for their money 36. Such
initiatives have shown that public and private purchasers may be able to influence the
quality and costs of health care services through value-based purchasing (VBP). VBP can
be defined as “any purchasing practices aimed at improving the value of health care
services, where value is a function of both quality and cost. Value increases as quality

16
increases, holding expenditure constant” 37. As an example, inclusion in benefit packages
of providers perceived as being “high quality,” helped employers to retain employees and
increased employee satisfaction and productivity potentially reducing long-term health
costs 38.
In January 2011, CMS proposed to implement a Hospital Value-Based Purchasing
program (HVBP) for Medicare under section 1886(o) of the Social Security Act, under
which value-based incentive payments will be made in a fiscal year to hospitals that meet
performance standards with respect to a performance period for the fiscal year involved.
HVBP is part of the Centers for Medicare & Medicaid Services’ long-standing effort to
link Medicare’s payment system to improve healthcare quality, including the quality of
care provided in the inpatient hospital setting. The program will implement value-based
purchasing to the payment system that accounts for the largest share of Medicare
spending, affecting payment for inpatient stays in over 3,000 hospitals across the country.
Hospitals will be paid for inpatient acute care services based on the quality of care, not
just quantity of the services they provide.
The HVBP program is designed to promote better clinical outcomes for hospital patients,
as well as improve their experience of care during hospital stays. Specifically, HVBP
seeks to eliminate or reduce the occurrence of adverse events (healthcare errors resulting
in patient harm) by adopting evidence-based care standards and protocols that result in
the best outcomes for the most patients, and by re-engineering hospital processes that
improve patients’ experience of care 26. The measures initially adopted for the HVBP
17
program are a subset of the measures that were already employed in the existing
Medicare Hospital Inpatient Quality Reporting Program (Hospital IQR program).
Depending on whether a hospital meets or exceeds the performance standards with
respect to the measures, the hospitals would be rewarded based on actual performance,
rather than simply reporting of data for those measures 3.
A hospital’s performance in HVBP is based on its performance according to the
following schedule:
Fiscal Year (FY) 2013: 12 clinical Process of care measures and 8 Patient Experience of
Care dimensions of the Hospital Consumer Assessment of Healthcare Providers and
Systems (HCAHPS) survey. FY 2014: 12 Clinical Process of Care measures, 8 Patient
Experience of Care dimensions (HCAHPS), three 30-Day Outcome Mortality measures
for acute Myocardial Infarction (AMI), Heart Failure (HF) and Pneumonia (PN). For FY
2015: 12 Clinical Process of Care measures, 8 Patient Experience of Care dimensions
(HCAHPS), three - 30-Day Outcome Mortality measures for Acute Myocardial Infarction
(AMI), Heart Failure (HF) and Pneumonia (PN), one Agency for Healthcare Research
and Quality (AHRQ) Composite measure (Patient Safety Indicator (PSI-90)]), one
Healthcare Associated Infection (Central Line-Associated Blood Stream Infection
(CLABSI)) and one Efficiency measure (Medicare Spending Per Beneficiary (MSPB)) 26.
VPB measures are listed in Appendix B.
HVBP will be funded through a reduction from participating hospitals’ Diagnosis-

18
Related Group (DRG) payments for the applicable fiscal year. The money that is
withheld will be redistributed to hospitals based on their Total Performance Scores
(TPS). The actual amount earned by hospitals will depend on the actual range and
distribution of all eligible/participating hospitals’ TPSs. A hospital may earn back a
value-based incentive payment percentage that is less than, equal to, or more than the
applicable reduction for that program year. 1 percent reduction was applied for FY 2013.
This reduction is expected to grow by 0.25%/year till it reaches 2.0 percent in FY 2017.
A hospital’s performance in HVBP is based on measures/dimensions for the domains per
fiscal year (FY). The hospital’s TPS is composed of the following: For FY2013, 70%
clinical process of care and 30% patient experience of care. For FY2014, 45% clinical
process of care, 25% outcome (mortality) and 30% experience of care. Process of care
measures will constitute only 20% of TPS in 2015, experience of care will remain at 30%
and the rest will be comprised of outcome and efficiency measures 26.
Hospitals eligible for participation HVBP include acute care hospitals that had at least 10
cases in at least 4 of 12 clinical process of care measures and/or at least 100 completed
HCAHPS surveys. Excluded hospitals include psychiatric, rehabilitation, long-term care,
children’s or cancer hospitals. Hospitals that did not participate in hospital IQR are also
excluded. CMS estimated that more than 3000 facilities across the United States would
participate in FY 2013. Roughly $850 million dollars in VBP incentives would be paid
out to these participating hospitals in FY 2013. Money at risk is expected to grow with
more reduction in DRG-based payments by 2017 5.

19
Patient satisfaction is important not only to the financial reimbursement of hospitals, but
it has been recently linked to CEO pay. In a recent retrospective observational study,
participants included 1877 CEOs at 2681 private, nonprofit US hospitals. Compensation
was associated with technology and patient satisfaction but not with processes of care,
patient outcomes, or community benefit. Hospitals with high performance on patient
satisfaction compensated their CEOs on average $51, 706 more than did those with low
performance on patient satisfaction 39.
The HCAHPS survey, developed by the Agency for Healthcare Research and Quality,
asks patients 32 questions about their experiences in the hospital and about their
demographic characteristics. Possible responses (always, usually, sometimes, and never)
to the questions are summarized by CMS and reported in 7 domains as composites:
communication with physicians, communication with nurses, communication about
medications, quality of nursing services (responsiveness of staff), adequacy of planning
for discharge, care transition, and pain management. (The care transition composite has
been recently added in October 2014: “Patients who understood their care when they left
the hospital”). CMS calculated composite ratings for the domains by averaging the
responses to each individual item within that domain. Other domains reflect individual
questions about whether the rooms were clean and whether they were quiet (possible
responses: always, usually, sometimes, and never) and two overall ratings: a global rating
of the hospital on a scale of 0 to 10, with 0 being the worst and 10 being the best a
hospital can be, and a question about whether the patient would recommend the hospital
to family and friends (possible responses: definitely yes, probably yes, probably no, and

20
definitely no). The global ratings are grouped by the CMS into one of three categories, 0
to 6, 7 or 8, or 9 or 10, rather than reported individually. Data are adjusted for the method
of administration of the survey, as well as for patient demographic factors (e.g. age,
educational level, and health status) in order to adjust for nonresponse bias, as described
at www.hcahpsonline.org 6, 40. The survey is administered using a standardized protocol 2
days to 6 weeks after discharge by mail, telephone, mail with telephone follow-up, or
interactive voice recognition. A random sample of eligible patients is surveyed monthly
by the hospital or a licensed vendor and the resulting data are aggregated to produce a
rolling 12-month average. Each hospital is directed to obtain 300 completed HCAHPS
questionnaires over the yearlong reporting period. In small hospitals that are unable to
reach the target survey, all-eligible discharges are included 41-43. Hospitals that report
clinical data to CMS are eligible to participate in HCAHPS. The survey is not intended
for pediatric hospitals, psychiatric hospitals or other specialty hospitals 121. Although
HCAHPS is designed for acute-care hospitals, any hospital that is reimbursed under the
Inpatient Prospective Payment System and is eligible for the Annual Payment Update
(referred to as RHQDAPU) needs to participate in HCAHPS in order to receive full
reimbursement updates 121.
Measuring quality in health care is a subject of debate. Critics have argued that hospital
quality classification based on process measures alone may be problematic due to
imprecision arising from lower case volume at low performing hospitals and the poor
reliability of hospitals’ self-reported data. Thus, HCAHPS measures, which reflect the
experiences of a broader sample of patients, might provide a more representative

21
summary of selected aspects of care quality. It has been argued however that experiences
with medical care are more easily understood by patients rather than by technical process
measures. In addition, available technical process measures have limited scope and
coverage, and previous studies indicate that indicators in one domain might not reflect
quality of care in other areas 7, 29, 44. Others question the importance of patient-reported
experiences because they might reflect factors such as a patient’s general mood or
response tendencies in addition to the actual quality of care. Although case-mix
adjustment models have been developed to adjust for such factors, associations between
patients’ reports of experiences and available measures of hospital quality and safety
would add to the credibility of HCAHPS measures 7.

22
CHAPTER THREE
SATISFACTION THEORIES
Patients’ satisfaction usually reflects reactions to their experience with care 45. Many
theories and concepts related to satisfaction have been described in the literature.
Expectancy-value theory of Linder-Pelz postulated that satisfaction was mediated by
personal beliefs and values about care, as well as prior expectations about care experience
(access, efficiency, cost, convenience) 46. Brennan defines satisfaction as the appraisal, by
an individual, of the extent to which the care provided has met that individual's
expectations and preferences. Normative decision theory (NDT) is used in that context to
explain the incorporation of individual expectations, values and preferences into the
decision-making processes of patient responses 47. The expectancy-disconfirmation
model in which consumers compare their expectations with service performance has been
proposed 48. In that regard, Bond and Thomas noted that increasing quality of nursing
care raises expectations 49. Modification of this model called the cognitive-affect model
was suggested, in which perception of service includes cognitive evaluation, affective
response and a direct effect on satisfaction. Feedback loops can be created affecting
patients’ behavior. These can be influenced by patient characteristics, values, beliefs and
expectations 9, 50.
Multiple models theory of Fitzpatrick and Hopkins argued that expectations were socially
mediated, reflecting the health goals of the patient and the extent to which illness and

23
healthcare violated the patient’s personal sense of “self”51. Performance Theory
postulates that prior expectations do not matter; actual performance will overwhelm any
psychological response tendencies related to expectations. In that regard, overall
satisfaction will be higher (or lower) for better (or worse) clinical outcome 52. Blalock et
al. demonstrated that satisfaction would be highest for those with high psychological
well-being regardless of whether outcome is good or poor 53. Others also posit
interaction between psychological wellbeing and outcome 54. Social psychological
theories suggest that satisfaction evaluations are moderated, or even mediated, by
personal feelings of equity in the exchange, disconfirmation between desires and
outcomes55, individual preferences56, and social comparisons57, 58. According to social-
identity theory, these evaluations are moderated by demographic, situational,
environmental, and psychosocial factors 59. Further, interpretations of these factors are
moderated by individual beliefs, perceptions, and frames of reference that are affected by
cultural orientations60.
In the review by Sitzia et al. 8, 61 other psychosocial determinants such as social desirability
response can affect satisfaction. Patients may report greater satisfaction than they actually
feel because they believe positive comments are more acceptable to survey
administrators. A number of observers have also suggested that patients may be reluctant
to complain for fear of unfavorable treatment in the future. Self-interest can also bias
satisfaction scores. This theory proposes that clients are likely to perceive that
expressions of satisfaction will contribute to the continuation of the service, which in turn
will be in their own self-interest 61. A further factor is predicted by "cognitive consistency

24
theory" according to which patients are likely to report they are satisfied as a way of
justifying the time and effort they have invested in their treatment 62. Likewise the
"Hawthorne Effect" postulates that the additional attention in the data collection process
and the apparent concern of the research sponsors about the patient's level of satisfaction
could likely lead to a positive perception of the service 61. Others have also shown that
respondents reporting more satisfaction with life in general, or greater confidence in the
medical care system, recorded significantly higher satisfaction with their physicians than
those who did not 9, 61.
Increased satisfaction also was related to obtaining information about what to expect 9. In
that regard, Keating et al. 63 have shown that complaints of lack of information can result
in the desire to switch physicians. Williams argued that patient expectations were the key
to understanding the reasons for expressed dissatisfaction. 64. In the "discrepancy model",
Fox and Storms65 argued that the lack of variability in satisfaction responses should
prompt a shift in focus from obtaining stability of results to understanding the conditions
under which discrepant findings can be predicted. This implies that a concentration upon
areas of expressed dissatisfaction is more valuable than obtaining consistency of
expressed satisfaction. When favorable experiences match favorable expectations
satisfaction is highest. It is also lower when negative occurrences reinforce negative
expectations or contradict positive ones 65.
In addition to the “expectancy-value” theory and discrepancy theory, equity theory and
fulfillment theory were proposed to explain satisfaction with care. Discrepancy and

25
fulfillment theories define satisfaction as the perceived- but not necessarily actual-
discrepancy between what an individual desires and what occurs. Equity theories
however propose that satisfaction is perceived equity, or perceived balance of inputs and
outputs. Further, equity theory stresses the importance of evaluating one's own balance
with others' balances 66.

26
TABLE A- Summary of patient satisfaction theories
THEORY DESCRIPTION COMMENTS Expectancy-Value Satisfaction mediated by expectation about
care and personal beliefs and values about care
Expectancy-disconfirmation Consumers compare expectations with service performance
Normative decision theory Appraisal of care if it meets expectations, values and preferences
Cognitive-affective model Cognitive evaluation and affective response affect satisfaction. Influenced by patients characteristics, beliefs and expectations
Increased satisfaction related to obtaining information about what to expect.
Multiple models theory Expectations socially mediated reflecting health goals of the patient
Extent to which illness violates personal sense of self
Performance Theory Satisfaction related to outcome regardless of expectations.
Psychological well-being Satisfaction highest with psychological wellbeing regardless of outcome (Blalock). Interaction between psychological wellbeing and outcome (Hudack)
Social Psychological theory Health evaluations mediated by feelings of equity in exchange between desires and outcomes, individual preferences and social comparisons.
Social identity theory Evaluations moderated by demographic, situational and psychosocial factors.
Interpretation of these factors moderated by individual beliefs and perceptions that are affected by cultural orientations
Social desirability Positive comments perceived more favorably Fear of unfavorable treatment if negative comments
Self-interest bias Expression of satisfaction will continue service in the best of self-interest
Cognitive-consistency theory Patients report satisfaction as a way of justifying time they have invested in their treatment
Hawthorne effect Concern of surveyors about patient satisfaction will likely lead to positive perception of service
Discrepancy model Satisfaction highest when favorable experiences meet favorable expectations, and lowest when negative occurrences reinforce negative expectations
Understanding conditions under which discrepant findings can be predicted. Concentration upon areas of dissatisfaction more valuable.
Fulfillment theory Satisfaction as the perceived, but not necessarily actual discrepancy between individual desires and occurrences
Also applies to discrepancy theory
Equity theory Satisfaction is the perceived equity (balance of inputs and outputs).

27
Based on the literature, there is a lack of a single widely accepted conceptual framework
for dimensions of satisfaction with healthcare. Satisfaction may address a variety of
elements of care. Healthcare quality theory of Donabedian proposed that satisfaction was
the principal outcome of the interpersonal process of care 30. He argued that the
expression of satisfaction or dissatisfaction is the patient’s judgment on the quality of
care in all its aspects, but particularly in relation to the interpersonal component of care.
The Donabedian model for quality assessment (structure, process, and outcome) provides
a good framework for satisfaction dimensions 18. Structural aspects include access, cost
and physical environment. Process aspects include technical quality, interpersonal
communications, and coordination of care. Outcomes aspects include satisfaction with
health. Priorities may differ across settings. For some health plans, the structural aspects
of quality such as access, cost, physical environment and technology are viewed
favorably 9. For inpatient care however, the interpersonal interaction particularly with
nursing care is more important 67. Patient condition can also affect satisfaction. Patients
who present with an acute complaint may prioritize outcome whereas patients with
chronic disease may prioritize the process dimensions of satisfaction 48.
Although patient satisfaction is considered as an outcome of health care, it is also
affected by the outcomes of care. In a review of over 100 papers published in the field of
satisfaction, Sitzia et al. 8, 61 argue that the major goal of patients presenting with health
problems is the resolution of those problem not satisfaction with the process. Glickman et
al. 14 examined clinical data on 6467 patients with acute myocardial infarction. Higher
patients satisfaction scores were associated with lower inpatient mortality. Clark and
colleagues identify at least one study each that independently and positively relates
28
patient satisfaction to one of these clinical outcomes: HbA1c levels, cholesterol levels,
post-surgery complications, post-surgery recovery times, risk-adjusted mortality rates,
and unexpected mortality 68. More recent data studying the relationship of outcome
measures and patient satisfaction shows a significant association, and decrease in 30-day
hospital readmission 16.
DETERMINANTS OF SATISFACTION:
Based on the theories of satisfaction and literature review, the major components
influencing satisfaction can be classified into patient factors, provider factors,
hospital/physical plant/structural factors, and quality factors. A summary of these theories
is found in table B.
Patient Factors:
A consistent determinant characteristic is patient age, with a body of evidence
suggesting that older people tend to be more satisfied with healthcare than do younger
people. This is likely related to change in expectation (older people are less likely to
criticize and have more modest expectations) 8, 61. Additionally, according to Sitzia and
Wood, greater satisfaction was also associated with lower levels of education. However
this effect was likely confounded by lower income 61. In their review of over 100 papers
published in the field of satisfaction, Sitzia and Wood found that the relationship between
satisfaction and income and “social class" was not consistent. It was also generally
found that patient gender does not affect satisfaction values 61. From the United States

29
there was evidence that whites on the whole are more satisfied than non-whites 45.
However the racial disparity was likely confounded by socio-economic status 69. In that
regard, Crow et al 9 determined that although there is a consistent positive relationship
between age and satisfaction, the evidence on other variables (gender, race, education,
income) is equivocal.
In the review by Crow et al .9, there was evidence that poorer physical health status,
disability, low quality of life, and psychological distress were associated with lower
levels of reported satisfaction patients’ ratings. Indeed, patients who perceive themselves
to be healthier may be more satisfied with life generally, and this attitude carries over to
specific episodes of care 70. Expectations of perceived improvement in health has been
determined to be a likely factor in the relationship between health status and patient
satisfaction 9,71.Patients with poor health status have been shown to have higher number
of days of hospitalization 72,73. In a recent longitudinal cohort of acute myocardial
infarction, Lee et al. examined the associations of patient-reported satisfaction with care.
Among the 1866 patients analyzed, satisfaction with care was more likely in patients who
were older, in those without depression, and in those with better functional capacity 10. In
a Dutch study, patient characteristics had statistically significant influence on patient
satisfaction. Older patients with better health status and lower education appeared to be
more satisfied with care 74.
Patient education level has been revisited with other studies suggesting a positive
relationship between lower education and satisfaction with care 75-77. Jha et al. reporting

30
data on 2429 hospitals participating in HCAHPS from July 2006 through June 2007 have
shown that hospitals with higher concentration of Medicaid patients have lower global
HCAHPS patient satisfaction ratings. Patients receiving Medicaid were utilized as a
measure of the extent to which the hospitals provide care to low-income population 6. In
that aspect, it has been suggested that individuals with higher income could experience
better healthcare quality 78.
Provider Factors:
Based on Ware framework79, components of satisfaction include interpersonal manner-
features of the way in which providers interact personally with patients (e.g. respect,
concern, friendliness, courtesy, communication, empathy). In outpatient care,
professional standards and interpersonal relationships are of prime importance to patients.
In primary care, there is evidence that patient–doctor communication and information
sharing is as important as determinants of satisfaction as access and availability 79. In a
study by Blanden et al. 80, failure of physicians to listen and form personal connections
with patients was viewed as major factor for lower patient’s satisfaction with their
physicians. Other factors include ability to have all their questions answered and
incomplete discussion of medication side effects by physicians. In questionnaires
addressed to physicians and patients, significant differences existed between patients' and
physicians' impressions about patient knowledge and inpatient care received. Improving
patient-physician communication was identified as an important step towards improving
quality of care and patient satisfaction 11. However, according to Crow et al .9, there was

31
no evidence that the gender or age of physicians or their interpersonal skills have an
effect on satisfaction.
According to Ware, continuity of care-constancy in the provider or location of care, and
availability-presence of medical care resources (e.g. enough medical facilities and
providers) are important factors in patient satisfaction 79. In a survey of 17,196 enrollees
from a large health plan in California, lack of access to specialists was significantly
related to dissatisfaction with the plan and desires to dis-enroll from the plan 81.
Satisfaction in the heterogeneous US system was also related to having insurance and a
regular source of care. In addition, patients receiving preventive services or health
promotion advice were more satisfied than those who did not. In a study of the Medicare
population, physician supply was not related to patient satisfaction. Nyweide et al. 82, in
national random survey of Medicare beneficiaries, found that patients living in areas with
more physicians per capita had perceptions of their health care that were similar to those
of patients in regions with fewer physicians.
Nursing strain and exhaustion also affected patient satisfaction 9. Experience with nursing
was most strongly correlated to patient ratings of quality of care, services and global
recommendation 83. Significant positive association has been also found between the
supply of nurses and patients evaluation of their care. Strategies towards improving
nursing supply have been suggested for quality improvement 12. Kutney-Lee et al. 13
submitted that improving nurses’ work environments, including nurse staffing, is needed
in order to improve the patient experience and quality of care. Jha et al. 6, in a study of

32
2429 hospitals reported that hospitals in top quartiles of ratio of nurses to patient-days
had better performance on HCAHPS surveys.
Quality Factors:
The Ware framework components of satisfaction include technical quality of care
(measured by the competence of providers and adherence to high standards of diagnosis
and treatment), and outcomes of care measured by the results of services (e.g.
improvements in or maintenance of health) 79. Baicker & Chandra have previously shown
that Medicare spending was inversely related to technical quality measures, and per
capita use of acute care hospitals was also negatively associated with patients’ hospitals
ratings 84, 85. In a more recent study of 2,473 acute care hospitals, Wennberg et al. 86
demonstrated an inverse relationship between greater inpatient care intensity (defined by
amount of hospitalization time and intensity of physician intervention) and patients’
ratings of their hospital experiences based on HCAHPS survey. Greater care intensity
was also associated with lower quality scores, which were also correlated with lower
patients’ ratings. Poorly coordinated care was the common link to increased intensity of
care and lower care quality.
In a study by Isaac et al. 7, data from 927 hospitals were used to examine relationships
between HCAHPS and scores of quality based on Hospital Quality Alliance (HQA) and
Patient Safety Indicators (PSIs) developed by Agency for Healthcare Research and
Quality (AHRQ). The overall global HCAHPs ratings of hospitals and willingness to
recommend hospitals had strong relationships with technical quality performance in all

33
medical conditions and surgical care. Jha et al. 6 reported data on 2429 hospitals
participating in HCAPHS from July 2006 through June 2007. Relationships of HCAHPS
measures to hospitals performances were then studied using hospital quality alliance
quality summary scores. Hospitals with higher levels of patients’ satisfaction reported
higher quality clinical care. Glickman et al. 14 examined clinical data on 6467 patients
with acute myocardial infarction. Higher patients satisfaction scores were associated with
lower inpatient mortality. Patients ‘satisfaction with their care provided important
information on the quality of acute myocardial infarction care in this study. In a recent
study by Girotra et al. 15, it was found that hospitals with consistently poor performance
on cardiac process measures also have lower patient satisfaction on average, suggesting
that these hospitals have overall poor quality of care.
Although little research exists on the relationship between process-based measures of
clinical quality and patient satisfaction with the care experience, some literature
demonstrate a significant relationship between outcome measures of clinical quality and
patient satisfaction. A comprehensive collection and evidence-based hierarchy of the
published research lists 33 studies that link patients’ satisfaction with their care
experience to clinical quality and 14 studies associating patient satisfaction with
compliance68. In their review, Clark and colleagues identify at least one study each that
independently and positively relates patient satisfaction to one of the following clinical
outcomes: clinical quality (e.g., HbA1c levels, cholesterol levels, fewer bed disability
days), chronic disease control, compliance, drug complications, quality of life, emotional
health status, mental health, physical functioning, physical health status, post-surgery

34
complications, post-surgery recovery times, risk-adjusted mortality rates, unexpected
mortality, and work effectiveness 68. More recent data studying the relationship of
outcome measures and patient satisfaction shows a significant association with a decrease
in 30-day hospital readmission 16, and lower MI mortality 14. In a recently published
study using the Hospital Compare Database, there was an inverse relationship between
patient experiences and complication rates (Hospital acquired conditions) 87.
Hospital/Physical plants/structural factors:
The Ware framework components of satisfaction include accessibility/convenience-
factors involved in arranging to receive medical care; and physical environment-features
of setting in which care is delivered (e.g. clarity of signs and directions, orderly
facilities and equipment, pleasantness of atmosphere) 79. Crow et al. 9 and Young et al.
88 found that in-hospital satisfaction in the USA has been reported to be lower in
teaching hospitals than in private hospitals. Others however have found that teaching
hospitals were more likely to have superior performance on dimensions of quality and
HCAHPS than non-teaching hospitals 89. Lehrman et al. 89 found that top hospital
performers in patient experience are most often small and rural and located in the East
South Central division. Hospital size and its effect on satisfaction was also confirmed
by Young et al. 88 who showed that among the institutional characteristics, hospital size
was significantly associated with lower satisfaction scores. Rural hospitals had
significantly higher satisfaction score than did urban hospitals. Jha et al. 6 also
demonstrated that patient satisfaction was higher among non-for-profit hospitals, non-
urban hospitals, hospitals with smaller number of beds, location in the southern US,

35
with less ICU capacity and less Medicaid patient mix.
Despite these findings, other studies showed negative association between hospital size,
rural status and patient satisfactions. Girotra et al. 15 showed that for both acute
myocardial infarction (AMI) and heart failure (HF), low-performing hospitals in quality
measures had lower annual admission volume, fewer beds, lower nurse FTE per 1000
patient days, and these hospitals were more likely to be rural, safety-net hospitals. More
than half of the low-performing AMI and HF hospitals were located in the South census
region and these hospitals scored lower on patient satisfaction. In a retrospective study
of 2761 US hospitals reporting AMI process measures to the Center for Medicare and
Medicaid Services Hospital Compare database during 2004 to 2006,low-performing
cardiac hospitals differ from better performing hospitals with regards to hospital
structure and organization. These hospitals were smaller, rural facilities and have higher
risk-adjusted mortality 90.
Wennberg et al. 19, 85 showed that patients living in regions with more hospital care
intensity (measured by amount of time spent in the hospital and the intensity of physician
intervention during hospitalization) tend to rate their inpatient experiences less favorably.
According to Wennberg19, other measures of care intensity include per capita Medicare
spending. In that regard, ICU bed capacity has been shown to be component of hospital
care intensity index 91 and a measure of technological capacity 6.

36
TABLE B- Determinants of Patient Satisfaction with Hospital Care
PATIENT FACTORS
Age Older more satisfied. Age could be proxy for expectations since older have more modest expectations (Kravitz, Young)
Association Confirmed
Race Whites more satisfied (Pascoe), but effect disappears after controlling for socioeconomic interaction
Association Not confirmed
Education Lower educated patients more satisfied but confounded by SES. (Sitzia, Hekkert,’OMalley, Rahmqvist)
Association Not confirmed
Socioeconomic status (SES) Not consistent in the literature (Sitzia, Crow), Medicaid as a marker of low-income population was negatively related to satisfaction (Jha)
Association Not confirmed
Poor health status, low quality of life, and psychological distress
All associated with negative satisfaction
Association confirmed
PROVIDER FACTORS
Interpersonal interaction with patients
Communication, respect, courtesy, empathy, information sharing (Ware)
Association confirmed
Providing access to care, available medical resources
Association confirmed
Preventive services
Association confirmed
Nursing supply While positive association with nursing supply, negative association with nursing strain.
Association confirmed
QUALITY FACTORS
Technical quality: adherence to standards and outcomes (Clark)
Association confirmed
Quality scores-Process and Outcomes (Wennberg, Isaac, Glickman, Clark, Boulding, Stein)
While positively associated with satisfaction, quality scores negatively related to inpatient care intensity.
Association confirmed
STRUCT. FACTORS
Convenience, physical environment (Ware)
Positive relationship to satisfaction Association confirmed
Teaching Lower association with satisfaction (Crow, Young), higher association (Lehrman)
Association not confirmed
Size Smaller better satisfaction (Lehrman, Young, Jha). Smaller lower satisfaction (Girotra, Popescu)
Association not confirmed
Rural status Better satisfaction (Lehrman, Young, Jha). Worse satisfaction (Girotra, Popescu)
Association not confirmed
Non-profit
Better satisfaction (Jha) Association confirmed
Care intensity (intensity of care and procedures)
Associated with lower satisfaction. Due to lower quality
Association confirmed

37
INTERACTIONS WITH SATISFACTION DETERMINANTS.
As discussed previously patient expectations are main drivers behind satisfaction
theories, however the relationship seems quite complex. Based on the literature review,
there is a significant interplay between expectations, patients, providers, structural
characteristics and satisfaction. As mentioned in Crow et al. 9:
“Measuring satisfaction as the difference between expectations and perceptions of care experiences is complicated by the dynamic, two-way nature of the relationship between them. Experiences may cause expectations to shift, either directly as a result of information provided during the process of care, or indirectly because occurrences may alter patients’ perceptions. Equally, however, expectations may directly modify occurrences (e.g. when patients request certain treatments), or alter patients’ perceptions of them. (Pg.7)”
It has been suggested that patient demographics such as age (associated with higher
satisfaction scores) are possible proxies for patient expectations and values about health
care through which specific experiences are filtered. 92, 93. Wagner et al. 94 proposed that
expectations influence and appear to have an inverse relationship with satisfaction: if
expectations are low, satisfaction is higher; if expectations are high, perception of
satisfaction is lower. Most of the studies showed an association between satisfaction and
age, and determined that older individuals have lower expectations 61. The relationship
between other variables such as race, income and education with satisfaction however is
quite complex and inconclusive. Although it has been shown that as education and
income levels increase so does expectation level 95, prior expectations and expectations
that are adapted by experience can vary. In some, health beliefs can also affect that
relationship 9, 96.

38
While most satisfaction theories can explain the relationship between quality metrics and
satisfaction (expectancy-value, expectancy-disconfirmation, normative decision theory
multiple models theory, performance theory), the relationships with structural measures
seem more complicated such is the case with teaching and larger hospitals. Although they
are reputed to be technologically superior leading to better outcomes 97, teaching and
larger hospitals treat sicker patients with worse health status leading to worse satisfaction
in some cases70.
PROCESS OF CARE MEASURES AND PATIENT SATISFACTION
There is a paucity of studies looking into the association of hospital process of care
measures and patient satisfaction. The studies showing an association mostly examined
summary quality process scores instead of the effects of individual process of care scores.
Previous studies on the relationship between patient satisfaction with their experiences
and the quality of clinical care have had mixed results. Schneider et al. 98, in a national
sample of 233 Medicare health plans, found that enrollees in Medicare managed- care
plans that had better performance on the measures in the Healthcare Effectiveness Data
and Information Set (HEDIS quality measures) reported better experiences in obtaining
information on health plans and in dealing with customer service. However they did not
give higher global ratings of the plan. In a cross sectional population based study using
the general practice assessment survey, Rao et al. 99 studied 18 general practices in
England. There was only a weak correlation between patient assessed survey scores for
technical quality (hypertension control and vaccination), and the objective records based

39
measures of good clinical practice.
Gandhi et al. 100, in a cross-sectional chart review of patients and physicians surveys in 11
ambulatory clinic sites in the Boston-area from May 1996 to June 1997, analyzed report
card scores for five quality domains (performance on HEDIS-like measures, clinic
function, patient satisfaction, diabetes guideline compliance, asthma guideline
compliance). No association was detected between patient satisfaction and quality scores.
Chang et al. 31 studied vulnerable older patients identified by brief interviews of a random
sample of community-dwelling adults 65 years of age or older who received care in 2
managed care organizations during a13-month period. Survey questions from the
Consumer Assessment of Healthcare Providers and Systems program were used to
determine patients’ global rating of health care and provider communication. A set of 236
quality indicators, defined to measure technical quality of care given for 22 clinical
conditions was determined. Two hundred and seven quality indicators were also
evaluated using data from chart abstraction or patient interview. In a multivariate logistic
regression model that included patient and clinical factors, better communication was
associated with higher global ratings of health care. Technical quality of care was not
significantly associated with the global rating of care.
Lyu et al. 22 compared hospital patient satisfaction scores with Hospital Surgical Care
Improvement Program compliance and hospital employee safety attitudes (safety culture)
scores during a 2-year period (2009-2010). Patient satisfaction was not associated with
performance on process measures (antibiotic prophylaxis, R=0.216 [P=. 24]; appropriate

40
hair removal, R=0.012 [P=. 95]; Foley catheter removal, R=0.089 [P=. 63]; deep vein
thrombosis prophylaxis, R=0.101 [P=. 59]) .In a longitudinal cohort of 1866 acute
myocardial infarction patients, Lee et al. 10 examined the associations of patient-reported
satisfaction with care with clinical characteristics, physical and psychological function
measures, quality indicators of myocardial infarction care, and outcomes. Of the study
cohort, 1711 (91.7%) reported that they were satisfied with their overall care. Patients
who reported satisfaction with care were older, had improved physical function, and were
less likely to be depressed. Better physical function (measured by the Specific Activity
Scale) predicted higher satisfaction, after adjustment for age, sex, income, and ethnicity.
Depression was the major predictor of dissatisfaction with overall care. Quality indicators
for myocardial infarction care and clinical outcomes were not associated with patient
satisfaction. (Aspirin upon discharge, beta blocker at discharge, angiotensin-converting
enzyme inhibitor at discharge, HMG-CoA reductase inhibitor at discharge, referral to
cardiac rehabilitation, cardiac catheterization performed, percutaneous coronary
intervention performed, coronary bypass graft surgery performed, referral to cardiologist,
referral to internist, follow-up with family physician alone).
Even though the previously mentioned studies suggest no relationship between process of
care quality measures and patient satisfaction, other data support a positive association.
In a series of literature reviews, Wagner and colleagues 101 concluded that evidence-based
clinical care and well-designed chronic disease self-management programs (chronic care
model) that are patient-centered simultaneously improve disease control, patient
satisfaction, and compliance. In a random sample of patients hospitalized between

41
October 2006 and June 2007 in 2,517 U.S. hospitals, three summary scores were
calculated: one for five measures of the management of acute myocardial infarction
(AMI); a second for two congestive heart failure (CHF) measures; and a third for three
pneumonia measures. Among regions, hospitals with lower overall ratings by their
patients also tended to have lower quality measures. In addition, the percentage of
patients reporting a negative experience was positively correlated with hospital care
intensity (reflecting both the amount of time spent in the hospital and the intensity of
physician intervention during hospitalization) in all categories of the HCAHPS survey 19.
There is also evidence that per capita use of acute care hospitals may be associated with
patients’ ratings of their inpatient experiences. In California, patients using hospitals in
regions with greater care intensity such as Los Angeles tended to give lower ratings to
their hospitals than those using hospitals in regions with more conservative care patterns
such as Sacramento 85,102.
Isaac et al. 7 examined the associations between HCAHPS scores and HQA measures
(Hospital Quality Alliance) from over 900 hospitals pertaining to hospital care in 2006.
For medical conditions, they analyzed the 10 core processes of care measures that
hospitals were required to submit in order to receive their CMS fee update. For surgery,
they examined the measures that were voluntarily reported by hospitals. They calculated
summary performance measures for each quality medical condition and for surgical care
by summing the numerators of related individual measures and then dividing by the sum
of the denominators of related measures as described by Landon et al 103. For AMI,
adjusted correlations were statistically significant for seven of the nine HCAHPS

42
measures. For example, the correlation with the overall rating of the hospital was 0.53
and the correlation with adequate discharge information was 0.43 (both p< .001).
Relationships between pneumonia processes of care and HCAHPS composites were also
significant. Better CHF processes were associated with better overall rating of the
hospital and willingness to recommend the hospital but not with the other HCAHPS
measures. Relationships between surgical processes of care and the HCAHPS measures
followed a similar pattern with correlation coefficients ranging from 0.14 for
communication with doctors (p< .02) to 0.35 (p< .001) for willingness to recommend the
hospital to a friend or family member. There were consistent relationships between
patient experiences and technical quality as determined by the measures used in the HQA
program. Global measures of hospital performance, the overall rating of the hospital and
willingness to recommend the hospital, had strong relationships with better technical
performance in processes of care related to pneumonia, CHF, myocardial infarction, and
for surgical care.
Another study that examined how patients’ experiences of care in hospitals related to
HQA process measures found similar relationship: In a study 2429 hospitals participating
in HCAPHS from July 2006 through June 2007, Jha et al. 6 found that the ratio of nurses
to patient-days was a predictor of performance on the HCAHPS survey: a larger
percentage of patients in hospitals in the top quartile of the ratio of nurses to patient-days,
as compared with the bottom quartile, gave the hospital a global rating of 9 or 10 (65.9%
vs.60.5%, P<0.001 for trend). Fewer patients in for profit hospitals gave a global rating of
9 or 10 than patients in either private or public not-for profit hospitals. There was no

43
significant difference between teaching and nonteaching hospitals .The authors found that
patients’ satisfaction with care was associated with the quality of clinical care in the
hospitals for all four conditions process of care: Acute myocardial infarction, pneumonia,
congestive heart failure and surgery. The HQA scores for hospitals in the highest quartile
of HCAHPS ratings were, on average, about 2 to 4 percentage points higher than the
HQA scores for hospitals in the lowest quartile of HCAHPS ratings. The Hospital Quality
Alliance (HQA) score was defined as the percentage derived from the sum of the number
of times a hospital performed the appropriate action across all measures for that condition
(numerator) divided by the number of opportunities the hospital had to provide
appropriate care (denominator).). The score was adjusted for number of beds, academic
status, region, location, profit status, ratio of nurses to patient-days, and percentage of
patients receiving Medicaid.
Girotra et al. 15 examined patient satisfaction at hospitals that have consistently poor
performance on process measures for 2 cardiac diseases, acute myocardial infarction
(AMI) and heart failure (HF), and compared it with patient satisfaction at hospitals with
intermediate and high performance. For each hospital, the authors calculated a composite
performance score for AMI and HF performance for each year using the opportunities
scoring method 104, (dividing the total number of times each treatment was administered
(numerator) by the total number of opportunities for each therapy (denominator),
multiplied by 100). Next, they stratified hospitals into defiles based on their composite
performance scores for each year. They defined low performing hospitals as hospitals in
the bottom decile of performance for each of the 3 years, top-performing hospitals as

44
those in the top decile of performance for each year, and intermediate hospitals as all
others. Low-performing AMI and HF hospitals scored significantly lower in both global
domains of patient satisfaction, on average compared with intermediate and top-
performing hospitals. A lower ratio of nurse FTEs to patients, higher bed size, and for
profit ownership was independently associated with lower patient satisfaction.
Gesell et al. 21 examined the relationship between hospitals’ adherence to CMS clinical
process measures for heart failure treatment and their heart failure patients’ perceptions
of quality. It was retrospective database study, drawing upon data collected between the
first and second quarters of 2004 and maintained in the Press Ganey National Inpatient
Database and on the CMS Hospital Compare Web site. The satisfaction ratings of heart
failure patients and the clinical process measures for heart failure treatment for 32
hospitals were linked and analyzed. Hospital Compare then showed 17 quality measures
for heart failure, heart attack, and pneumonia treatment. This study analyzed all four of
the quality measures for heart failure treatment (percentage of patients given ACE
inhibitor for LVSD-left ventricular systolic dysfunction, percentage of patients given
assessment of LVF-left ventricular function, percentage of patients given adult smoking
cessation advice or counseling, percentage of patients given discharge instructions). Two
of the four clinical process measures (percentage of patients given assessment of LVF,
percentage of patients given discharge instructions) showed statistically significant,
moderately strong, positive correlations with a global measure of satisfaction. The other
two clinical measures (percentage of patients given an ACE inhibitor for LVSD,
percentage of patients given adult smoking cessation advice or counseling) showed no

45
statistical relationship to patient satisfaction. According to the authors, the failure to
detect a relationship between patient satisfaction and two of the clinical guidelines might
be explained by inadequate statistical power.
Glickman et al. 14 examined clinical data on 6467 patients with acute myocardial
infarction treated at 25 US hospitals participating in the CRUSADE initiative from 2001
to 2006. Patient satisfaction correlated with cardiac catheterization within 48 hours, beta-
blockers on discharge, clopidogrel on discharge, and lipid lower agents (strongest
correlation coefficient = 0.199). Shwartz et al. 20 analyzed 2005 data from a sample of
1,006 U.S. hospitals. They studied performance on five measures calculated from
publicly available data: adherence to evidence-based processes of care, risk-adjusted in-
hospital mortality, risk-adjusted efficiency, risk-adjusted readmissions, and patient
satisfaction. They calculated a composite measure of adherence by condition using the
opportunity-based weights approach (summed the numerators, summed the
denominators, and then calculated the ratio of summed numerators to summed
denominators). They also used this approach to calculate composite measure across all
fifteen-process measures for the three conditions (CHF, AMI, pneumonia). There was a
statistically significant correlation (at the p < .05 level) between the composite adherence
to process of care measure and the HCAHPS patient satisfaction measure (.33). Recently,
Tsai et al.125 in a study that included 2953 hospitals have shown that institutions with the
higher SCIP composite scores had higher HCHAPS global satisfaction scores. Kennedy
et al.135 however in a study of 171 hospitals found that large hospitals, high surgical
volume, and low mortality were associated with patient satisfaction (P < 0.001).

46
Compliance with SCIP process measures and patient safety indicators, as well as length
of stay, did not correlate with overall satisfaction.
TABLE C- Summary of HOSPITAL Process of Care measures and patients satisfaction
SCIP AMI CHF PNEUMONIA
Lyu et al (2013): 31 hospitals NO Association with global satisfaction
Antibiotic prophylaxis, hair removal, urine cath removal, DVT prophylaxis
Kennedy et at (2014) 171 hospitals NO Association
Summary SCIP Process measures
Lee et al (2008) 1711 study cohorts: NO Association with patient satisfaction (questionnaire)
Aspirin upon discharge, beta blockers on discharge, ACE inhibitors on discharge, statins on discharge, cardiac rehab, cardiac cath, PTCA, CABG
Glickman et al (2010) 6467 patients ++ Association with global patient satisfaction
Cardiac catheterization within 48 hours, beta blockers on discharge, clopidogrel on discharge, and lipid lower agents
Wennberg et al (2009) 2517 hospitals: Lower scores associated with lower global satisfaction ratings
Summary scores Summary scores Summary scores
Isaac et al (2010) 900 hospitals: Positive association with all HCAHPS composites with quality summary scores
Summary scores Summary scores Summary scores Summary scores
Jha et al (2008) 2429 hospitals: Higher quartile summary scores associated with higher HCAHPS composite ratings
Summary scores Summary scores Summary scores Summary scores

47
Girotra et al (2012) 2467 hospitals for AMI, 3115 hospitals for CHF: Lower performing hospitals scored lower on global patients satisfaction
Composite performance score
Composite performance score
Gesell et al (2005) 32 hospitals. Positively associated with global patient satisfaction
Percent having assessment of LV function Percent given discharge instruction
Shwartz et al (2010) 1006 hospitals Positive association with global Patients satisfaction
Summary Composite measures
Summary Composite measures
Summary Composite measures
Tsai et al (2014) 2953 hospitals: Positive association with global HCAHPS satisfaction
Summary Composite scores
As is evident from this review of the relevant literature, most studies analyzing the
association between process of care scores and patient satisfaction mostly looked into
summary scores instead of effects of individual process of care scores. Where individual
process of care scores were used, they were based on only selected care measures (acute
MI, CHF, or SCIP surgical measures). Moreover, in these studies a limited numbers of
hospitals are included 14, 22. Other investigations as mentioned previously also showed no
relationship quality measures and patient satisfaction 10, 22, 31. No studies were done to
analyze the relationship between current stroke and venous thromboembolism (VTE)
process of care quality measures and patient satisfaction. In addition, no analyses were
done studying the role of each HCAHPS composite within each process of care measure
to determine global patient satisfaction.

48
This proposed study provides a unique opportunity to analyze the relationship between
each individual hospital process of care measure and global patient satisfaction HCAHPS
score using Donabedian framework. It also incorporates other HCAHPS composite
components (communication with nurses, communication with doctors, responsiveness of
hospital staff, pain management, communication about medicines, and discharge
information, cleanliness of hospital environment and quietness of hospital environment)
into quality elements to determine relationship with global satisfaction with care.

49
CHAPTER FOUR
CONCEPTUAL FRAMEWORK
The Donabedian model for quality assessment (structure, process, and outcome) provides
a good framework for satisfaction dimensions 18. The conceptual framework proposed by
Donabedian is shown in Figure 1.
Figure 1: Determinants of satisfaction based on the Donabedian framework
STRUCTURE Hospital bed size* ICU bed size* Rural/urban* RN staffing* Medicaid volume* Medicare volume* For profit status* Teaching status* Specialty Hospital status* Medicare Spending Per Beneficiary *** Cleanliness of environment** Quietness of environment**
PROCESS
Hospital Compare Measures*** Nurse communication** Doctor communication** Responsiveness of staff** Pain management** Communication about meds** Discharge information** *Data from AHA (American Hospital Association) ** Data from HCAHPS ***Data from hospital compare Process measures for AMI/HF/PN/SCIP/Stroke/VTE
stucture
process
outcome (satisfaction)
OUTCOMES Definitely recommend hospital** Hospital Rating 9-10/10**

50
Structural aspects include access, cost and physical environment. "Structure" generally
refers to the organization of the institution delivering care and the conditions under
which care is provided including the medical delivery system’s fixed characteristics such
as staff number, types, qualifications and facilities. Structure is the patient/consumer’s
rating of the physical environment and physical facilities in which the service occurs.
Process aspects include technical quality, interpersonal communications, and
coordination of care. "Process" refers to the professional activities associated with
providing care such as what is done to and for the patient such as treatment. Process
measures address, for example, the patient’s rating of interpersonal interactions with
service personnel and of personnel with each other. Specific attributes include, for
example, responsiveness, friendliness, empathy, courtesy, competence, and availability
17. Outcomes aspects include satisfaction with health 30.
Donabedian proposed that satisfaction was the principal outcome of the interpersonal
process of care. He also regarded "outcome" as the most important aspect 1 7 and
stressed that an outcome is not simply a measure of health, well-being, or any other
state; it is a change in a patient's current and future health status that can be confidently
attributed to antecedent care 30, 61,105. Although some outcomes are generally
unmistakable and easy to measure (death, for example) other outcomes, not so clearly
defined, can be difficult to measure. These include patient attitudes and satisfactions,
social restoration and physical disability and rehabilitation 30,105. Donabedian suggested
that “patient satisfaction may be considered to be one of the desired outcomes of care …

51
information about patient satisfaction should be as indispensable to assessments of
quality as to the design and management of health care systems” 17. Outcome-related
measures or items ask about the patient’s perception of the results of process, including
symptom reduction or resolution, improvement in functioning, or resolution of
underlying problems. He argued that the expression of satisfaction or dissatisfaction is
the patient’s judgment on the quality of care in all its aspects, but particularly in relation
to the interpersonal component of care 30.
In this study, The Structure-Process-Outcome framework is used to determine the
association of hospital quality process of care measures (acute MI/ heart
failure/pneumonia/ SCIP/stroke/VTE) with the outcome defined as Global HCAHPS
satisfaction scores. Structure measures (bed size capacity, ICU bed capacity, nurse
staffing, Medicaid volume, Medicare volume, rural status, teaching, specialty hospital
status, for-profit status and Medicare spending per beneficiary) are used as adjustment
factors. As discussed earlier, bed size capacity, rural and teaching status had various
effects on patients’ satisfaction possibly through varying influences on expectations
(larger and teaching hospitals expected to receive higher ratings of patient satisfaction,
but treat sicker patients 70,97). Medicare volume is used to reflect the age of the
population. This can also be used as indirect proxy for expectations 61, 92, 93. Medicaid
volume can be used as an adjustment factor for socioeconomic status. Rural status is
used to adjust for education and socioeconomic status, since it has been shown that rural
residents tend to lower incomes and lower college education 106,107.

52
The Medicare Spending per Beneficiary (MSPB) measure evaluates hospitals’ efficiency,
as reflected by Medicare payments made during an MSPB episode, relative to the
efficiency of the median hospital. Specifically, a hospital’s MSPB measure is calculated
as the hospital’s average MSPB amount divided by the median MSPB amount across all
hospitals, where a hospital’s MSPB amount is the hospital’s average price-standardized,
risk-adjusted spending for an MSPB episode 108. The MSPB is being used in the study to
reflect hospital care intensity 19. ICU bed capacity is also used to reflect care intensity and
technological capacity 6, 91. Nurse staffing and for profit status are used as adjustment
factors since they have been shown to influence satisfaction 6. Specialty hospitals will
also be included in structure adjustment measures since they are not required to report
HCAHPS data121, and the ones that report HCAHPS do it voluntarily leading to possible
non-representative sampling. One could argue that HCAHPS components could be
interpreted as patients’ perceptions of structure, process and outcomes related to hospital
care. Incorporating HCAHPS structure and process components into the relationship
between hospital process of care measures and global satisfaction scores would be a great
addition to the literature.
The purpose of this study is analyze each individual process of care component
(Acute myocardial infarction, congestive heart failure, pneumonia, surgical care
measures, stroke, and venous thromboembolism) along with structure measures (bed
size, ICU bed capacity, rural status, RN staffing, for profit status, teaching status,
proportion Medicaid, proportion Medicare, Medicare spending per beneficiary, specialty
hospital status), and study their outcome association with global HCAHPS patient

53
satisfaction scores. Another purpose is to analyze each individual process composite
HCAHPS measure (Nurse communication, doctor communication, responsiveness of
staff, pain management, communication about meds, and discharge information) within
each process category for MI/heart failure/pneumonia/SCIP/stroke and VTE, along with
HCAHPS structure measures (cleanliness of environment, quietness of environment),
and study their outcome association with global HCAHPS patient satisfaction scores.
The study intends to address the following research questions and to test the following
research hypotheses related to patient satisfaction with hospital processes of care.
RESEARCH QUESTIONS:
1) Is there a relationship between individual hospital quality processes of care measures
for AMI, heart failure, pneumonia, SCIP, stroke, VTE, and global HCAHPS satisfaction
scores, adjusting for structure differences between hospitals?
2) Is there an association between each hospital’s HCAHPS composite process measure
within AMI, heart failure, pneumonia, SCIP, stroke, VTE, and global HCAHPS
satisfaction after adjusting for HCAHPS structure differences?

54
RESEARCH HYPOTHESES:
Ho1= There is no relationship between each individual process of care measure for
AMI/heart failure/pneumonia/SCIP/stroke/VTE and Global HCAHPS scores adjusting
for structure differences.
H1= There is a positive relationship between each individual process of care measure for
AMI/heart failure/pneumonia/SCIP/stroke/VTE and Global HCAHPS scores adjusting
for structure differences.
Ho2= There is no association between each HCAHPS process composite measure and
global HCAHPS scores within each studied quality process measure for MI/heart
failure/pneumonia/SCIP/stroke/VTE adjusting for HCAHPS structure differences.
H2= There is a significant association between each HCAHPS process composite
measure and global HCAHPS scores within each studied quality process measure for
MI/heart failure/pneumonia/SCIP/stroke/VTE adjusting for HCAHPS structure
differences.
Thus a unique opportunity exists to measure not only the effect of each process of care
measure on satisfaction, but the impact of each HCAHPS composite component within a
specific quality process on global hospital patient satisfaction. The effect of individual
structure characteristics will also be determined within each process of care type (Acute
MI, heart failure, pneumonia, SCIP, stroke and VTE). Defining the effect of stroke and
VTE quality measures on patient satisfaction has not been examined previously, and this

55
study also provides another opportunity in that regard. By determining the relationship of
each individual quality process of care measure with global patient satisfaction, policy
decisions can be made to focus on improving the weaker associations and reinforcing the
stronger relationships. In addition defining the role of each individual HCAHPS
composite within each process of care measure can determine areas of strengths and
weaknesses towards improving patient satisfaction.

56
CHAPTER FIVE
METHODS
Design
This study uses an observational (non-experimental), retrospective, cross-sectional
Design to assess the association between process of care measures and patient
satisfaction. The data collection period is from 7/1/2012- 6/30/2013.
Data Sources
Samples are drawn from secondary databases. Data sources are derived from Hospital
Compare for West South Central Region, covering hospitals in Louisiana, Arkansas,
Texas and Oklahoma. The following processes of care quality scores are included:
For heart attack (MI): Percent of MI patients given aspirin upon discharge (asadc),
percent of heart attack Patients given fibrinolytic medication within 30 minutes of arrival
(TPA30min), percent who had percutaneous intervention-PCI within 90 minutes
(pci90min), number of minutes of outpatients with chest pain or MI till EKG done
(mintoekg), average number of minutes before outpatients with chest pain or possible
heart attack were transferred to another hospital ( minutestrfer), outpatients with chest
pain or possible heart attack who got aspirin within 24 hours of arrival (asa24hr),
outpatients with chest pain or possible heart attack who got drugs to break up blood clots

57
within 30 minutes of arrival (outpttpa30),statins upon discharge(statindc), median time
to fibrinolysis (timetofiblys).
For heart failure (HF): percent of HF patients having evaluation of ventricular
dysfunction (lvfunction), percent given angiotensin converting enzyme inhibitors (ACEi)
or angiotensin receptor antagonists-ARBs (acearbs), percent given discharge instruction
(DCintruct). For pneumonia (PN): Percent of PN patients who had blood cultures in ER
prior to antibiotics( cxbeforeab), percent with appropriate antibiotic
selection(appropab).For Surgical Care Improvement Project measures (SCIP): Percent
surgery patients with antibiotics given within 1 hour before surgery (abonehour), percent
with antibiotic stopped within 24 hours after surgery (abdc), percent surgery patients
given the right kind of antibiotics (rightab), percent given treatment within 24 hour of
surgery to prevent blood clots (dvtproph), percent heart surgery patients with sugar
control days after surgery (sugarcont), percent surgery patients with urinary catheters
removed on first or second day after surgery (urinecath), percent surgery patients who
were taking heart drugs called beta blockers before coming to the hospital who were kept
on them (betakeep) , percent outpatients having surgery who got an antibiotic within one
hour before surgery (outpaboneh), percent outpatients having surgery who got the right
kind of antibiotic (outprightab), percent of patients having surgery who were actively
warmed in the operating room or whose body temperature was near normal (warmedor).
For blood clot prevention and treatment (VTE): percent of patients who got treatment to
prevent blood clots on the day of or day after hospital admission or surgery (preventclot),

58
percent of patients who got treatment to prevent blood clots on the day of or day after
being admitted to the intensive care unit (icuprophyl), percent of patients with blood clots
who got the recommended treatment, which includes using two different blood thinner
medicines at the same time (overlap), percent of patients with blood clots who were
treated with an intravenous blood thinner and were monitored(anticmonitor), percent of
patients with blood clots who were discharged on a blood thinner medicine and received
written instructions about that medicine(dcinstruct), percent of patients who developed a
blood clot while in the hospital who did not get treatment that could have prevented it
(dvtnoproph). For stroke process of care measures (SK): percent of ischemic or
hemorrhagic stroke patients who received treatment to keep blood clots from forming
anywhere in the body within 2 days of arriving at the hospital (vteprophy), percent of
ischemic stroke patients who received a prescription for medicine known to prevent
complications caused by blood clots before discharge (dcantithrom), percent of ischemic
stroke patients with a type of irregular heartbeat who were given a prescription for a
blood thinner at discharge (afibantico),percent ischemic stroke patients who got medicine
to break up a blood clot within 3 hours after symptoms started (thrombo3hrs), percent
ischemic stroke patients who received medicine known to prevent complications caused
by blood clots within 2 days of arriving at the hospital(antithr2days), percent ischemic
stroke patients needing medicine to lower cholesterol, who were given a prescription for
this medicine before discharge (dcstatin), percent of ischemic or hemorrhagic stroke
patients or caregivers who received written educational materials about stroke care and
prevention during the hospital stay(strokeedu), percent of ischemic or hemorrhagic stroke
patients who were evaluated for rehabilitation services (rehabeval).

59
HCAHPS components for West South Central region hospitals are also derived from the
Hospital Compare database. These consist of 6 composite domains: communication with
physicians (mdcomm), communication with nurses (nursecomm), communication about
medications (medexplain), quality of nursing services-responsiveness of staff-
(receivehelp), adequacy of planning for discharge (dcinfo), and pain management
(paincontrol). Possible responses for these composites: always, usually, sometimes, and
never. Only ‘always’ responses are used in the analysis. Other domains reflect individual
questions about whether the rooms were clean (roomclean) and whether they were quiet
(areaquiet). Possible responses: always, usually, sometimes, and never. Only ‘always’
responses are also used for the study. Two overall ratings are used. First a global rating of
the hospital on a scale of 0 to 10, with 0 being the worst and 10 being the best a hospital
can be. This rating is grouped by CMS into one of three categories, 0 to 6, 7 or 8, or 9 or
10. Only ‘ratings of 9-10’ are chosen (nineten). Another global rating question checks
whether the patient would recommend the hospital to family and friends) (possible
responses: definitely yes, probably yes, probably no, and definitely no). Only ‘definitely
yes’ is chosen for the analysis. (definrecomm).
The data collection period for HCAHPS and all other measures for AMI, CHF, PN, and
SCIP are between 7/1/2012-6/30/2013. Data for Stroke (SK) and VTE are available from
1/1/13-6/30/2103. 4,26,27. Data for structure/hospital characteristics are derived from AHA
(American Hospital Association) database of Census Division 7, West South Central
Region, covering hospitals in Louisiana, Arkansas, Texas and Oklahoma. These are

60
derived from Annual Survey Data Base 2011 edition. These data consist of: number of
beds per hospital (beds), rural/urban (rural), RN staffing per hospital (nursing) derived
by dividing number of full time RNs (FTRN)/beds, Medicaid volume (medicaid),
determined by dividing total facility Medicaid days/total facility inpatient days
(medicaidys/inptdays), Medicare (medicare) is also determined by dividing total facility
Medicare days/ total facility inpatient days. For-profit status (profit), specialty hospital
status (specialtyhos), and teaching status (teaching) also are obtained from American
hospital Association database. The data collection period is from 01/2011-12/31/2011.
As mentioned before, domains reflecting individual questions about whether the rooms
were clean (roomclean) and whether they were quiet (areaquiet) are also utilized in
HCAHPS structural measures. These responses are also obtained from CMS Hospital
Compare database. Another structure measure, Medicare spending per beneficiary
(MSB), reflecting care intensity is also acquired from Hospital Compare.
IRB Approval
The study protocol was submitted to Tulane IRB and IRB exemption was approved
2/2014
Sample Selection
The sample is a non-probability sample consisting of all AHA hospitals in the West
South Central Region covering the states of Louisiana, Arkansas, Texas and Oklahoma,
matched with hospitals reporting HCAHPS and process measures in these states on
Hospital Compare (n=687). Critical access hospitals (CAHs) are then dropped from the

61
analysis leaving total sample=551. CAH (critical access hospitals) are not required to
submit HCAHPS data. They are dropped from analysis to avoid likelihood of having a
non-representative sample CAHs that did report voluntarily. These 551 hospitals are
matched with hospital characteristics/structural measures derived from AHA annual
survey database. Reliability is checked via a second independent observer checking on
random samples of the matched data and comparing to the available data. The unit of
analysis is each individual hospital in the West South Central Region Hospital Compare
file.
Measurement
The independent variables, the constructs they measure, and the sources of the variables
are found in Tables C, D, and E. As discussed earlier, individual quality process of care
measures derived from Hospital Compare for MI, heart failure, pneumonia, SCIP and
stroke are included as independent variables in the analysis. HCAHPS process of care
measures* listed in Table C are utilized in the analysis to answer research question 2.

62
TABLE C: INDEPENDENT VARIABLES – PROCESS MEASURES
CONSTRUCT
VARIABLE NAME
DESCRIPTION SOURCE
Heart attack(MI) asadc (MI1) Percent of MI patients given aspirin upon discharge Hospital compare TPA30min
(MI2) Percent of patients Given fibrinolytic medication within 30 minutes Of arrival
Hospital compare
Pci90min (MI3)
Percent who had percutaneous intervention-PCI within 90 minutes Hospital compare
mintoekg (MI4)
Number of minutes of outpatients with chest pain or MI till EKG done
Hospital compare
minutestrfer (MI5)
Average number of minutes before outpatients with chest pain or possible heart attack who were transferred to another hospital
Hospital compare
asa24hr (MI6)
Percent outpatients with chest pain or possible heart attack who got aspirin within 24 hours of arrival
Hospital compare
outpttpa30 (MI7)
Percent outpatients with chest pain or possible heart attack who got drugs to break up blood clots within 30 minutes of arrival
Hospital compare
statindc (MI8)
Percent MI patients given statins upon discharge Hospital compare
timetofiblys (MI9)
Median time to fibrinolysis Hospital compare
Heart failure( HF) lvfunction
(CHF1) Percent of HF patients having evaluation of ventricular dysfunction
Hospital compare
acearbs (CHF2)
Percent given angiotensin converting enzyme inhibitors (ACEi) or angiotensin receptor antagonists-ARBs
Hospital compare
DCinstruc (CHF3)
Percent given discharge instruction Hospital compare
Pneumonia(PN) cxbeforeab
(PN1) Percent of PN patients who had blood cultures in ER prior to antibiotics
Hospital compare
appropab (PN2)
Percent with appropriate antibiotic selection Hospital compare
Surgical Care Improvement Project measures (SCIP):
abonehour (SCIP1)
Percent surgery patients with antibiotics given within 1 hour before surgery
Hospital compare
abdc (SCIP2)
Percent with antibiotic stopped within 24 hours after surgery Hospital compare
rightab (SCIP3)
Percent surgery patients given the right kind of antibiotics Hospital compare
dvtproph (SCIP4)
Percent given treatment within 24 hour of surgery to prevent blood clots
Hospital compare
sugarcont (SCIP5)
Percent heart surgery patients with sugar control days after surgery Hospital compare
urinecath (SCIP6)
Percent surgery patients with urinary catheters removed on first or second day after surgery
Hospital compare
betakeep (SCIP7)
Percent surgery patients who were taking heart drugs called beta blockers before coming to the hospital who were kept on them
Hospital compare
outpaboneh (SCIP8)
Percent outpatients having surgery who got an antibiotic within one hour before surgery
Hospital compare
outprightab (SCIP9)
Percent outpatients having surgery who got the right kind of antibiotic
Hospital compare
warmedor (SCIP10)
Percent patients having surgery who were actively warmed in the operating room or whose body temperature was near normal
Hospital compare
Blood clot prevention and treatment (VTE)
preventclot (VTE1)
Percent of patients who got treatment to prevent blood clots on the day of or day after hospital admission or surgery
Hospital compare
icuprophyl (VTE2)
Percent of patients who got treatment to prevent blood clots on the day of or day after being admitted to the intensive care unit
Hospital compare
overlap (VTE3)
Percent patients who got recommended treatment, which includes using two different blood thinner medicines at the same time
Hospital compare
anticmonitor (VTE4)
Percent of patients with blood clots who were treated with an intravenous blood thinner and were monitored
Hospital compare
dcinstruct (VTE5)
Percent of patients with blood clots who were discharged on a blood thinner medicine and received written instructions about that medicine
Hospital compare
DVTnoproph (VTE6)
Percent of patients who developed a blood clot while in the hospital who did not get treatment that could have prevented it
Hospital compare

63
STROKE ( SK) vteprophy
(SK1) Percent of ischemic or hemorrhagic stroke patients who received treatment to keep blood clots from forming anywhere in the body within 2 days of arriving at the hospital
Hospital compare
dcantithrom (SK2)
Percent of ischemic stroke patients who received a prescription for medicine known to prevent complications caused by blood clots before discharge
Hospital compare
afibantico (SK3)
Percent ischemic stroke patients with a type of irregular heartbeat who were given a prescription for a blood thinner at discharge
Hospital compare
thrombo3hrs (SK4)
Percent ischemic stroke patients who got medicine to break up a blood clot within 3 hours after symptoms started
Hospital compare
antithr2days (SK5)
Percent ischemic stroke patients who received medicine known to prevent complications caused by blood clots within 2 days of arriving at the hospital
Hospital compare
dcstatin (SK6)
Percent ischemic stroke patients needing medicine to lower cholesterol, who were given a prescription for this medicine before discharge
Hospital compare
strokeedu (SK7)
Percent of ischemic or hemorrhagic stroke patients or caregivers who received written educational materials about stroke care and prevention during the hospital stay
Hospital compare
rehabeval (SK8)
Percent of ischemic or hemorrhagic stroke patients who were evaluated for rehabilitation services
Hospital compare
HCAHPS process domains* Mdcomm* Communication with physicians (percent ‘always’) HCAHPS Nursecomm* Communication with nurses (percent ‘always’) HCAHPS Medexplain* Communication about medications (percent ‘always’) HCAHPS Receivehelp* Quality of nursing services-responsiveness of staff (percent
‘always’) HCAHPS
Dcinfo* Adequacy of planning for discharge (percent ‘always’) HCAHPS Paincontrol* Pain management (percent ‘always’) HCAHPS

64
Structure measures shown in Table D are included to adjust the independent variables in
the analysis. These structural measures are chosen based on the literature as discussed
previously. HCHAPS structural domains** (room cleanliness and quietness of
environment) are also included in the analysis to address research question 2.
TABLE D- Independent Variables: STUCTURE MEASURES CONSTRUCT VARIABLE DESCRIPTION SOURCE Hospital characteristics beds Number of beds per hospital American Hospital
Association (AHA) Icubeds* Number of ICU beds per hospital AHA ICU Proportion determined by dividing icubeds/beds AHA rural Rural (yes or no) AHA FTRN* Full time registered nurses per facility AHA nursing Total RN staffing per hospital (derived by dividing
FTRN by beds) AHA
Medicaidys* Total facility Medicaid days AHA Medicardys* Total facility Medicare days AHA inptdays Total facility inpatient days AHA medicaid Proportion, determined by dividing
medicaidys/inptdays AHA
medicare Proportion,determined by dividing Medicardys/inptdays
AHA
profit Hospital for-profit status (yes or no) AHA teaching Teaching status (yes or no) AHA MSB Medicare spending per beneficiary (proportion) Hospital Compare specialtyhos Specialty hospital ( yes or no) AHA HCAHPS structure domains**
roomclean** Percent answering the rooms were clean (‘always’) HCAHPS
areaquiet** Percent answering the hospital area was quiet (‘always’)
HCAHPS
* will not be used in regression equation ** used in research question 2

65
The dependent (outcome) variables shown in Table E are based on the global patient
HCAHPS satisfaction score. Only “definitely recommend” ratings are included in the
analysis.
TABLE E- Dependent Variables: OUTCOME MEASURES CONSTRUCT VARIABLE DESCRIPTION SOURCE nineten (Proportion).Percent
Global rating of hospital 9 or 10/10.
HCAHPS
definrecomm (proportion).Percent who would definitely recommend hospital to family and friends
HCAHPS
Data Evaluation Merging different data sources by hospital from Hospital Compare, and matching the
variables to the AHA national statistics obtain the necessary variables for the analysis.
Then the data are analyzed using traditional descriptive methods. These techniques
include frequencies, means, standard deviations, and normality tests such as skewness
and kurtosis. Difficulties with any of these areas are adjusted as needed by dropping
highly correlated independent variables, transforming non-normal variables, or treating
missing values by case deletion or sensitivity analysis. To see whether or not missing
data are random, a dummy variable is assigned to missing data. Missing data are coded as
1 if datum is missing and 0 if datum is not. Logistic regression model are done between
the variables and structural characteristics. If predictors are significant this implies that
missing data are not random 122.
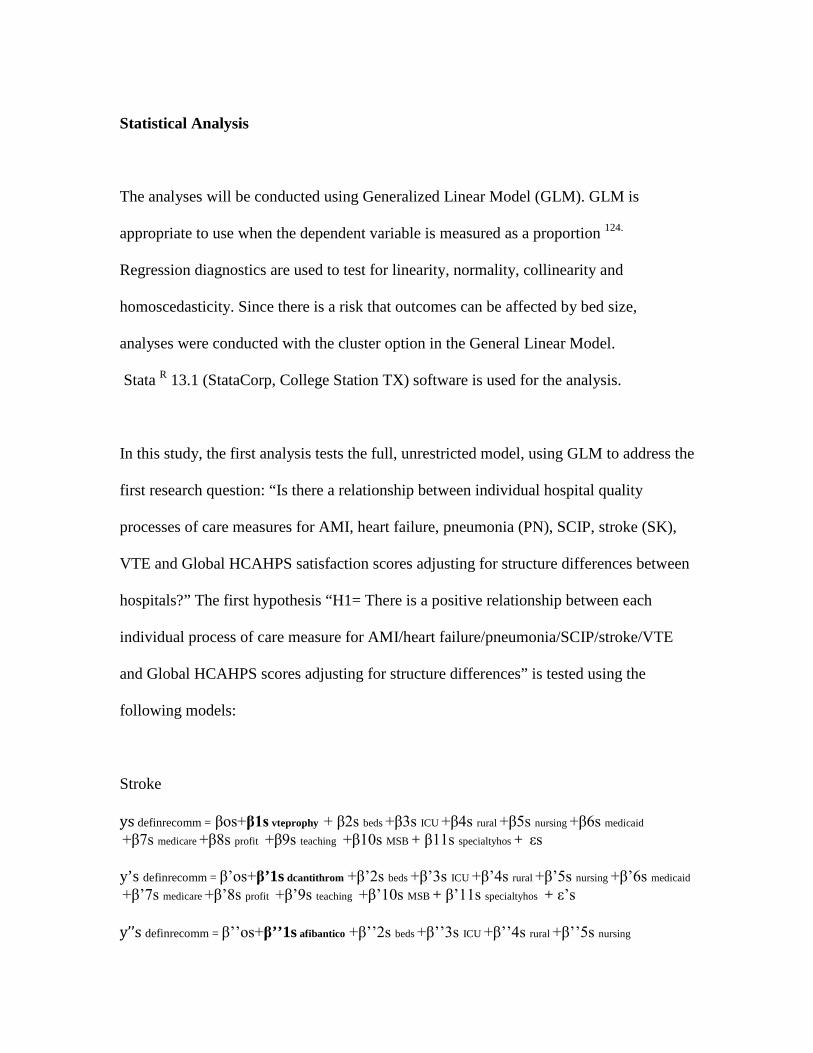
66
Statistical Analysis
The analyses will be conducted using Generalized Linear Model (GLM). GLM is
appropriate to use when the dependent variable is measured as a proportion 124.
Regression diagnostics are used to test for linearity, normality, collinearity and
homoscedasticity. Since there is a risk that outcomes can be affected by bed size,
analyses were conducted with the cluster option in the General Linear Model.
Stata R 13.1 (StataCorp, College Station TX) software is used for the analysis.
In this study, the first analysis tests the full, unrestricted model, using GLM to address the
first research question: “Is there a relationship between individual hospital quality
processes of care measures for AMI, heart failure, pneumonia (PN), SCIP, stroke (SK),
VTE and Global HCAHPS satisfaction scores adjusting for structure differences between
hospitals?” The first hypothesis “H1= There is a positive relationship between each
individual process of care measure for AMI/heart failure/pneumonia/SCIP/stroke/VTE
and Global HCAHPS scores adjusting for structure differences” is tested using the
following models:
Stroke ys definrecomm = βos+β1s vteprophy + β2s beds +β3s ICU +β4s rural +β5s nursing +β6s medicaid
+β7s medicare +β8s profit +β9s teaching +β10s MSB + β11s specialtyhos + εs y’s definrecomm = β’os+β’1s dcantithrom +β’2s beds +β’3s ICU +β’4s rural +β’5s nursing +β’6s medicaid
+β’7s medicare +β’8s profit +β’9s teaching +β’10s MSB + β’11s specialtyhos + ε’s y’’s definrecomm = β’’os+β’’1s afibantico +β’’2s beds +β’’3s ICU +β’’4s rural +β’’5s nursing

67
+β’’6s medicaid +β’’7s medicare +β’’8s profit +β’’9s teaching +β’’10s MSB + β’’11s specialtyhos +ε’’s y3’s definrecomm = β 3’os+ β 3’ 1s thrombo3hrs +β 3’2s beds +β 3’3s ICU +β 3’4s rural +β 3’5s nursing
+β 3’6s medicaid +β 3’7s medicare +β 3’ 8s profit +β 3’9s teaching +β 3’10s MSB + β3’ 11s specialtyhos +ε 3’s y4’ s definrecomm = β 4’os+ β 4’ 1s antithr2days +β 4’2s beds +β 4’3s ICU +β 4’4s rural +β 4’5s nursing
+β 4’6s medicaid +β 4’7s medicare +β 4’ 8s profit +β 4’9s teaching +β 4’10s MSB + β4’ 11s specialtyhos +ε 4’s y5’ s definrecomm = β 5’os+ β 5’ 1s dcstatin +β 5’2s beds +β 5’3s ICU +β 5’4s rural +β 5’5s nursing
+β 5’6s medicaid +β 5’7s medicare +β 5’ 8s profit +β 5’9s teaching + +β 5’10s MSB + β5’ 11s specialtyhos +ε 5’s y6’ s definrecomm = β 6’os+ β 6’ 1s strokeedu +β 6’2s beds +β 6’3s ICU +β 6’4s rural +β 6’5s nursing
+β 6’6s medicaid +β 6’7s medicare +β 6’ 8s profit +β 6’9s teaching +β 6’10s MSB + β6’ 11s specialtyhos +ε 6’s y7’ s definrecomm = β 7’os+ β 7’ 1s rehabeval +β 7’2s beds +β 7’3s ICU +β 7’4s rural +β 7’5s nursing
+β 7’6s medicaid +β 7’7s medicare +β 7’ 8s profit +β 7’9s teaching +β 7’10s MSB + β7’ 11s specialtyhos +ε 7’s VTE yv definrecomm = βov+β1v preventclot + β2v beds +β3v ICU +β4v rural +β5v nursing +β6v medicaid
+β7v medicare +β8v profit +β9v teaching +β10v MSB + β11v specialtyhos +εv y’v definrecomm = β’ov+β’1v icuprophyl +β’2v beds +β’3v ICU +β’4v rural +β’5v nursing +β’6v medicaid +β’7v medicare +β’8v profit +β’9v teaching +β’10v MSB + β’11v specialtyhos +ε’v y’’v definrecomm = β’’ov+β’’1v overlap +β’’2v beds +β’’3v ICU +β’’4v rural +β’’5v nursing
+β’’6v medicaid +β’’7v medicare +β’’8v profit +β’’9v teaching +β’’10v MSB + β’’11v specialtyhos
+ε’’v y3’v definrecomm = β 3’ov+ β 3’ 1v anticmonitor +β 3’2v beds +β 3’3v ICU +β 3’4v rural +β 3’5v nursing
+β 3’6v medicaid +β 3’7v medicare +β 3’ 8v profit +β 3’9v teaching +β 3’10v MSB + β3’11v specialtyhos +ε 3’v y4’ v definrecomm = β 4’ov+ β 4’ 1v dcinstruct +β 4’2v beds +β 4’3v ICU +β 4’4v rural +β 4’5v nursing
+β 4’6v medicaid +β 4’7v medicare +β 4’ 8v profit +β 4’9v teaching +β 4’10v MSB + β4’11v specialtyhos
+ε 4’v y5’ v definrecomm = β 5’ov+ β 5’ 1v DVTnoproph +β 5’2v beds +β 5’3v ICU +β 5’4v rural +β 5’5v nursing

68
+β 5’6v medicaid +β 5’7v medicare +β 5’ 8v profit +β 5’9v teaching +β 5’10v MSB + + β5’11v specialtyhos
ε 5’v MI ym definrecomm = βom+β1m asadc + β2m beds +β3m ICU +β4m rural +β5m nursing +β6m medicaid
+β7m medicare +β8m profit +β9m teaching +β10m MSB + β11m specialtyhos +εm y’m definrecomm = β’om+β’1m TPA30min +β’2m beds +β’3m ICU +β’4m rural +β’5m nursing +β’6m medicaid+β’7m medicare +β’8m profit +β’9m teaching +β’10m MSB + β11’m specialtyhos +ε’m
y’’m definrecomm = β’’om+β’’1m Pci90min +β’’2m beds +β’’3m ICU +β’’4m rural +β’’5m nursing
+β’’6m medicaid +β’’7m medicare +β’’8m profit +β’’9m teaching +β’’10m MSB + β11’’m specialtyhos
+ε’’m y3’m definrecomm = β 3’om+ β 3’ 1m mintoekg +β 3’2m beds +β 3’3m ICU +β 3’4m rural +β 3’5m nursing +β 3’6m medicaid +β 3’7m medicare +β 3’ 8m profit +β 3’9m teaching +β 3’10m MSB + β113’m specialtyhos +ε 3’m
y4’ m definrecomm = β 4’om+ β 4’ 1m minutestrfer +β 4’2m beds +β 4’3m ICU +β 4’4m rural +β 4’5m nursing +β 4’6m medicaid +β 4’7m medicare +β 4’ 8m profit +β 4’9m teaching +β 4’10m MSB + β114’m specialtyhos +ε 4’m
y5’ m definrecomm = β 5’om+ β 5’ 1m asa24hr +β 5’2m beds +β 5’3m ICU +β 5’4m rural +β 5’5m nursing
+β 5’6m medicaid +β 5’7m medicare +β 5’ 8m profit +β 5’9m teaching +β 5’10m MSB + β115’m specialtyhos +ε 5’m y6’ m definrecomm = β 6’om+ β 6’ 1m outpttpa30 +β 6’2m beds +β 6’3m ICU +β 6’4m rural +β 6’5m nursing +β 6’6m medicaid +β 6’7m medicare +β 6’ 8m profit +β 6’9m teaching +β 6’10m MSB + β116’m specialtyhos +ε 6’m
y7’ m definrecomm = β 7’om+ β 7’ 1m statindc +β 7’2m beds +β 7’3m ICU +β 7’4m rural +β 7’5m nursing
+β 7’6m medicaid +β 7’7m medicare +β 7’ 8m profit +β 7’9m teaching +β 7’10m MSB + β117’m specialtyhos +ε 7’m y8’ m definrecomm = β 8’om+ β 8’ 1m timetofiblys +β 8’2m beds +β 8’3m ICU +β 8’4m rural +β 8’5m nursing +β 8’6m medicaid +β 8’7m medicare +β 8’ 8m profit +β 8’9m teaching +β 8’10m MSB + β118’m specialtyhos +ε 8’m
CHF yh definrecomm = βoh+β1h lvfunction + β2h beds +β3h ICU +β4h rural +β5h nursing +β6h medicaid
+β7h medicare +β8h profit +β9h teaching +β10h MSB + β11h specialtyhos +εh

69
y’h definrecomm = β’oh+β’1h acearbs +β’2h beds +β’3h ICU +β’4h rural +β’5h nursing +β’6h medicaid+β’7h medicare +β’8h profit +β’9h teaching +β’10h MSB + β’11h specialtyhos +ε’h
y’’h definrecomm = β’’oh+β’’1h DCinstruc +β’’2h beds +β’’3h ICU +β’’4h rural +β’’5h nursing
+β’’6h medicaid +β’’7h medicare +β’’8h profit +β’’9h teaching +β’’10h MSB + β’’11h specialtyhos
+ε’’h Pneumonia yp definrecomm = βop+β1p cxbeforeab + β2p beds +β3p ICU +β4p rural +β5p nursing +β6p medicaid
+β7p medicare +β8p profit +β9p teaching +β10p MSB + β11p specialtyhos +εp y’p definrecomm = β’op+β’1p appropab +β’2p beds +β’3p ICU +β’4p rural +β’5p nursing +β’6p medicaid+β’7p medicare +β’8p profit +β’9p teaching +β’10p MSB + β’11p specialtyhos +ε’p SCIP ysc definrecomm = βosc+β1sc abonehour + β2sc beds +β3sc ICU +β4sc rural +β5sc nursing +β6sc medicaid +β7sc medicare +β8sc profit +β9sc teaching +β10scMSB + β11sc specialtyhos +εsc
y’sc definrecomm = β’osc+β’1sc abcd +β’2sc beds +β’3sc ICU +β’4sc rural +β’5sc nursing +β’6sc medicaid+β’7sc medicare +β’8sc profit +β’9sc teaching +β’10sc MSB + β’11sc specialtyhos +ε’sc
y’’sc definrecomm = β’’osc+β’’1sc rightab +β’’2sc beds +β’’3sc ICU +β’’4sc rural +β’’5sc nursing
+β’’6sc medicaid +β’’7sc medicare +β’’8sc profit +β’’9sc teaching +β’’10sc MSB + β’’11sc specialtyhos +ε’’sc y3’sc definrecomm = β 3’osc+ β 3’ 1sc dvtproph +β 3’2sc beds +β 3’3sc ICU +β 3’4sc rural +β 3’5sc nursing +β 3’6sc medicaid +β 3’7sc medicare +β 3’ 8sc profit +β 3’9sc teaching +β 3’10sc MSB + β 3’11sc specialtyhos +ε 3’sc
y4’ sc definrecomm = β 4’osc+ β 4’ 1sc sugarcont +β 4’2sc beds +β 4’3sc ICU +β 4’4sc rural +β 4’5sc nursing +β 4’6sc medicaid +β 4’7sc medicare +β 4’ 8sc profit +β 4’9sc teaching +β 4’10sc MSB + β 4’11sc specialtyhos +ε 4’sc
y5’ sc definrecomm = β 5’osc+ β 5’ 1sc urinecath +β 5’2sc beds +β 5’3sc ICU +β 5’4sc rural +β 5’5sc nursing +β 5’6sc medicaid +β 5’7sc medicare +β 5’ 8sc profit +β 5’9sc teaching +β 5’10sc MSB + β 5’11sc specialtyhos +ε 5’sc
y6’ sc definrecomm = β 6’osc+ β 6’ 1sc betakeep +β 6’2sc beds +β 6’3sc ICU +β 6’4sc rural +β 6’5sc nursing +β 6’6sc medicaid +β 6’7sc medicare +β 6’ 8sc profit +β 6’9sc teaching +β 6’10sc MSB + β 6’11sc specialtyhos +ε 6’sc

70
y7’ sc definrecomm = β 7’osc+ β 7’ 1sc outpaboneh +β 7’2sc beds +β 7’3sc ICU +β 7’4sc rural +β 7’5sc nursing +β 7’6sc medicaid +β 7’7sc medicare +β 7’ 8sc profit +β 7’9sc teaching +β 7’10sc MSB + β 7’11sc specialtyhos +ε 7’sc
y8’ sc definrecomm = β 8’osc+ β 8’ 1sc outprightab +β 8’2sc beds +β 8’3sc ICU +β 8’4sc rural +β 8’5sc nursing +β 8’6sc medicaid +β 8’7sc medicare +β 8’ 8sc profit +β 8’9sc teaching +β 8’10sc MSB + β 8’11sc specialtyhos +ε 8’sc y9’ sc definrecomm = β 9’osc+ β 9’ 1sc warmedor +β 9’2sc beds +β 9’3sc ICU +β 9’4sc rural +β 9’5sc nursing +β 9’6sc medicaid +β 9’7sc medicare +β 9’ 8sc profit +β 9’9sc teaching +β 9’10sc MSB + β 9’11sc specialtyhos +ε 9’sc
The Null Hypothesis “Ho1= There is no relationship between each individual process of
care measure for AMI/heart failure/pneumonia/SCIP/stroke/VTE and Global HCAHPS
scores adjusting for structure differences” will be rejected if all process measures within
each diagnosis show statistical significance (p<0.05) in their association with global
HCAHPS scores.
The second analysis tests the full, unrestricted model, using GLM to address the second
research question: “Is there an association between each hospital’s HCAHPS process
composite within AMI, heart failure, pneumonia, SCIP, stroke, VTE, and global
HCAHPS satisfaction adjusting for HCAHPS structure differences?” The second
hypothesis: “There is a significant association between each HCAHPS process composite
measure and global HCAHPS scores within each studied quality process measure for
MI/heart failure/pneumonia/SCIP/stroke/VTE adjusting for HCAHPS structure
differences” is addressed using GLM in these following models:

71
Stroke ysk definrecomm = βo sk + β1sk Mdcomm + β2sk vteprophy + β3sk dcantithrom + β4sk afibantico + β5sk thrombo3hrs + β6sk antithr2days + β7sk dcstatin + β8sk strokeedu + β9sk rehabeval + β10sk roomclean
+ β11sk areaquiet + ξsk y’sk definrecomm = β’o sk + β’1sk Nursecomm + β’2sk vteprophy + β’3sk dcantithrom + β’4sk afibantico + β’5sk thrombo3hrs + β’6sk antithr2days + β’7sk dcstatin + β’8sk strokeedu + β’9sk rehabeval + β’10sk roomclean + β’11sk areaquiet + ξ’sk y’’sk definrecomm = β’’o sk + β’’1sk Medexplain + β’’2sk vteprophy + β’’3sk dcantithrom + β’’4sk afibantico + β’’5sk thrombo3hrs + β’’6sk antithr2days + β’’7sk dcstatin + β’’8sk strokeedu + β’’9sk rehabeval + β’’10sk roomclean + β’’11sk areaquiet + ξ’’sk y3’sk definrecomm = β3’o sk + β3’1sk Receivehelp + β3’2sk vteprophy + β3’3sk dcantithrom + β3’4sk afibantico + β3’5sk thrombo3hrs + β3’6sk antithr2days + β3’7sk dcstatin + β3’8sk strokeedu + β3’9sk rehabeval + β3’10sk roomclean + β3’11sk areaquiet + ξ3’sk y4’sk definrecomm = β4’o sk + β4’1sk Dcinfo + β4’2sk vteprophy + β4’3sk dcantithrom + β4’4sk afibantico + β4’5sk thrombo3hrs + β4’6sk antithr2days + β4’7sk dcstatin + β4’8sk strokeedu + β4’9sk rehabeval + β4’10sk roomclean + β4’11sk areaquiet + ξ4’sk y5’sk definrecomm = β5’o sk + β5’1sk Paincontrol + β5’2sk vteprophy + β5’3sk dcantithrom + β5’4sk afibantico + β5’5sk thrombo3hrs + β5’6sk antithr2days + β5’7sk dcstatin + β5’8sk strokeedu + β5’9sk rehabeval + β5’10sk roomclean + β5’11sk areaquiet + ξ5’sk VTE yvt definrecomm = βo vt + β1vt Mdcomm + β2vt preventclot + β3vt icuprophyl + β4vt overlap + β5vt anticmonitor + β6vt dcinstruct + β7vt + DVTnoproph + β8vt roomclean + β9vt areaquiet + ξvt y’vt definrecomm = β’o vt + β’1vt Nursecomm + β’2vt preventclot + β’3vt icuprophyl + β’4vt overlap + β’5vt anticmonitor + β’6vt dcinstruct + β’7vt + DVTnoproph + β’8vt roomclean + β’9vt areaquiet + ξ’vt y’’vt definrecomm = β’’o vt + β’’1vt Medexplain + β’’2vt preventclot + β’’3vt icuprophyl + β’’4vt overlap + β’’5vt anticmonitor + β’’6vt dcinstruct + β’’7vt + DVTnoproph + β’’8vt roomclean + β’’9vt areaquiet + ξ’’vt y3’vt definrecomm = β3’ovt + β3’1vt Receivehelp+ β3’2vt preventclot + β3’3vt icuprophyl + β3’4vt overlap + β3’5vt anticmonitor + β3’6vt dcinstruct + β3’7vt + DVTnoproph + β3’8vt roomclean + β3’9vt areaquiet + ξ3’vt

72
y4’vt definrecomm = β4’o vt + β4’1vt Dcinfo+ β4’2vt preventclot + β4’3vt icuprophyl + β4’4vt overlap + β4’5vt anticmonitor + β4’6vt dcinstruct + β4’7vt + DVTnoproph + β4’8vt roomclean + β4’9vt areaquiet + ξ4’vt y5’vt definrecomm = β5’o vt + β5’1vt Paincontrol+ β5’2vt preventclot + β5’3vt icuprophyl + β5’4vt overlap + β5’5vt anticmonitor + β5’6vt dcinstruct + β5’7vt + DVTnoproph + β5’8vt roomclean + β5’9vt areaquiet + ξ5’vt MI ymi definrecomm = βo mi +β1mi Mdcomm +β2mi asadc +β3mi TPA30min +β4mi Pci90min + β5mi mintoekg + β6mi minutestrfer + β7mi asa24hr + β8mi outpttpa30 + β9mi statindc + β10mi timetofiblys + β11mi roomclean + β12mi areaquiet + ξmi y’mi definrecomm = β’o mi +β’1mi Nursecomm +β’2mi asadc +β’3mi TPA30min +β’4mi Pci90min + β’5mi mintoekg + β’6mi minutestrfer + β’7mi asa24hr + β’8mi outpttpa30 + β’9mi statindc + β’10mi timetofiblys + β’11mi roomclean + β’12mi areaquiet + ξ’mi y’’mi definrecomm = β’’o mi +β’’1mi Medexplain +β’’2mi asadc +β’’3mi TPA30min +β’’4mi Pci90min
+ β’’5mi mintoekg + β’’6mi minutestrfer + β’’7mi asa24hr + β’’8mi outpttpa30 + β’’9mi statindc + β’’10mi timetofiblys + β’’11mi roomclean + β’’12mi areaquiet + ξ’’mi y3’mi definrecomm = β3’o mi +β3’1mi Receivehelp +β3’2mi asadc +β3’3mi TPA30min +β3’4mi Pci90min
+ β3’5mi mintoekg + β3’6mi minutestrfer + β3’7mi asa24hr + β3’8mi outpttpa30 + β3’9mi statindc + β3’10mi timetofiblys + β3’11mi roomclean + β3’12mi areaquiet + ξ3’mi y4’mi definrecomm = β4’o mi +β4’1mi Dcinfo+ β4’2mi asadc +β4’3mi TPA30min +β4’4mi Pci90min + β4’5mi mintoekg + β4’6mi minutestrfer + β4’7mi asa24hr + β4’8mi outpttpa30 + β4’9mi statindc + β4’10mi timetofiblys + β4’11mi roomclean + β4’12mi areaquiet + ξ4’mi y5’mi definrecomm = β5’o mi +β5’1mi Paincontrol + β5’2mi asadc +β5’3mi TPA30min +β5’4mi Pci90min
+ β5’5mi mintoekg + β5’6mi minutestrfer + β5’7mi asa24hr + β5’8mi outpttpa30 + β5’9mi statindc + β5’10mi timetofiblys + β5’11mi roomclean + β5’12mi areaquiet + ξ5’mi CHF yhf definrecomm = βo hf + β1hf Mdcomm + β2 hf lvfunction + β3 hf acearbs + β4 hf DCinstruc + β5 hf roomclean + β6 hf areaquiet + ξ hf y’hf definrecomm = β’o hf + β’1hf Nursecomm + β’2 hf lvfunction + β’3 hf acearbs + β’4 hf DCinstruc + β’5 hf roomclean + β’6 hf areaquiet + ξ’ hf

73
y’’hf definrecomm = β’’o hf + β’’1hf Medexplain + β’’2 hf lvfunction + β’’3 hf acearbs + β’’4 hf DCinstruc + β’’5 hf roomclean + β’’6 hf areaquiet + ξ’’ hf y3’hf definrecomm = β3’o hf + β3’1hf Receivehelp + β3’2 hf lvfunction + β3’3 hf acearbs + β3’4 hf DCinstruc + β3’5 hf roomclean + β3’6 hf areaquiet + ξ3’ hf y4’hf definrecomm = β4’o hf + β4’1hf Dcinfo + β4’2 hf lvfunction + β4’3 hf acearbs + β4’4 hf DCinstruc + β4’5 hf roomclean + β4’6 hf areaquiet + ξ4’ hf y5’hf definrecomm = β5’o hf + β5’1hf Paincontrol + β5’2 hf lvfunction + β5’3 hf acearbs + β5’4 hf DCinstruc + β5’5 hf roomclean + β5’6 hf areaquiet + ξ5’ hf Pneumonia ypn definrecomm = βo pn + β1pn Mdcomm + β2pn cxbeforeab + β3pn appropab + β4pn roomclean + β5pn areaquiet + ξ pn y’pn definrecomm = β’o pn + β’1pn Nursecomm + β’2pn cxbeforeab + β’3pn appropab + β’4pn roomclean
+ β’5pn areaquiet + ξ’ pn y’’pn definrecomm = β’’o pn + β’’1pn Medexplain + β’’2pn cxbeforeab + β’’3pn appropab +
β’’4pn roomclean + β’’5pn areaquiet + ξ’’ pn y3’pn definrecomm = β3’o pn + β3’1pn Receivehelp + β3’2pn cxbeforeab + β3’3pn appropab +
β3’4pn roomclean + β3’5pn areaquiet + ξ3’ pn y4’pn definrecomm = β4’o pn + β4’1pn Dcinfo + β4’2pn cxbeforeab + β4’3pn appropab +
β4’4pn roomclean + β4’5pn areaquiet + ξ4’ pn y5’pn definrecomm = β5’o pn + β5’1pn Paincontrol + β5’2pn cxbeforeab + β5’3pn appropab +
β5’4pn roomclean + β5’5pn areaquiet + ξ5’ pn SCIP yscp definrecomm = βo scp + β1scp Mdcomm + β2scp abonehour + β3scp abcd + β4scp rightab +
β5scp dvtproph + β6scp sugarcont + β7scp urinecath + β8scp betakeep + β9scp outpaboneh + β10scp outprightab + β11scp warmedor + β12scp roomclean + β13scp areaquiet + ξ scp y’scp definrecomm = β’o scp + β’1scp Nursecomm + β’2scp abonehour + β’3scp abcd + β’4scp rightab
+β’5scp dvtproph + β’6scp sugarcont + β’7scp urinecath + β’8scp betakeep + β’9scp outpaboneh + β’10scp outprightab + β’11scp warmedor + β’12scp roomclean + β’13scp areaquiet + ξ’ scp

74
y’’scp definrecomm = β’’o scp + β’’1scp Medexplain + β’’2scp abonehour + β’’3scp abcd + β’’4scp rightab +β’’5scp dvtproph + β’’6scp sugarcont + β’’7scp urinecath + β’’8scp betakeep + β’’9scp outpaboneh + β’’10scp outprightab + β’’11scp warmedor + β’’12scp roomclean + β’’13scp areaquiet + ξ’’ scp y3’scp definrecomm = β3’o scp + β3’1scp Receivehelp + β3’2scp abonehour + β3’3scp abcd + β3’4scp rightab +β3’5scp dvtproph + β3’6scp sugarcont + β3’7scp urinecath + β3’8scp betakeep + β3’9scp outpaboneh + β3’10scp outprightab + β3’11scp warmedor + β3’12scp roomclean + β3’13scp areaquiet + ξ3’ scp y4’scp definrecomm = β4’o scp + β4’1scp Dcinfo + β4’2scp abonehour + β4’3scp abcd + β4’4scp rightab +β4’5scp dvtproph + β4’6scp sugarcont + β4’7scp urinecath + β4’8scp betakeep + β4’9scp outpaboneh + β4’10scp outprightab + β4’11scp warmedor + β4’12scp roomclean + β4’13scp areaquiet + ξ4’ scp y5’scp definrecomm = β5’o scp + β5’1scp Paincontrol + β5’2scp abonehour + β5’3scp abcd + β5’4scp rightab +β5’5scp dvtproph + β5’6scp sugarcont + β5’7scp urinecath + β5’8scp betakeep + β5’9scp outpaboneh + β5’10scp outprightab + β5’11scp warmedor + β5’12scp roomclean + β5’13scp areaquiet + ξ5’ scp
The Null hypothesis: “Ho2= There is no association between each HCAHPS process
composite measure and global HCAHPS scores within each studied quality process
measure for MI/heart failure/pneumonia/SCIP/stroke/VTE adjusting for HCAHPS
structure differences” will be rejected if all HCAHPS process measures within each
diagnosis show statistical significance (p<0.05) in their association with global HCAHPS
scores.

75
CHAPTER SIX
RESULTS
After matching all AHA hospitals with Hospital Compare for hospitals reporting HCAPS,
process quality measures, and structural measures in the West South Central region, and
after dropping critical access hospitals, 551 hospitals are retained in the data set. Mean
value for the variable definrecomm is 72.37 with a median of 72. For the variable nineten,
mean value is 72.24 with a median of 72. The outcome variables also passed normality
tests, and graphical representation of data appeared normally distributed. Analysis of
definrecomm and nineten shows 92% correlation. Therefore we will use only ‘definitely
recommend’ as a measure for global satisfaction in our study.
Evaluation of missing data shows a strong relationship to bed size (i.e. more missing data
in smaller hospitals). Due to that, we conduct all our analysis based on three bed size
subgroups: beds less then100, beds between 100-200 and beds greater than 200.
We used these ranges to assess effect of small, medium and larger hospitals155 in the
interplay between process measures and patient satisfaction.
Table 1- describes the hospitals data characteristics reported by bed size after dropping
the critical access hospitals from the data. 52.4% of hospitals have fewer than 100 beds,
17.7% have 100-199 beds, and 29.7 % have more than 200 beds. Mean bed capacity is
161 for all hospitals. For small hospitals with less than 100 beds, mean bed capacity is
43. For medium sized hospitals with beds of 100-199, mean bed capacity is 142. For

76
hospitals with more than 200 beds, mean bed capacity is 409. Larger hospitals seem to
have higher Medicare spending per beneficiary and a larger concentration of ICU beds
than 100 bed hospitals. A lower concentration of Medicare and a higher concentration of
Medicaid patients seem to occur in hospitals with more than 100 beds. 46% of small
(<100 beds) hospitals are for profit. This number stays at 44% among hospitals with
100-199 beds, then decreases to 26% among the greater than 200 beds hospitals. 26% of
hospitals with fewer than 100 beds are rural. This number drops to 3% if bed size is
between100 and 199 and to 0 if bed size is greater than 200. 16.6 % of hospitals with
fewer than 100 beds are specialty hospitals, 3% are specialty hospitals if beds are
between100 and 199, and 2% of large hospitals are specialty hospitals. Missing data for
the variables “beds”, “nursing”, “Medicare”, “Medicaid”, “rural”, “profit”, “teaching”,
and “specialty hospitals” were not listed in the AHA database during that time period.
For the variables “MSB” and “ICU”, the majority of missing data are in hospitals with a
less than 100- bed capacity. These hospitals also did not report MSB and ICU beds data
during that time period.
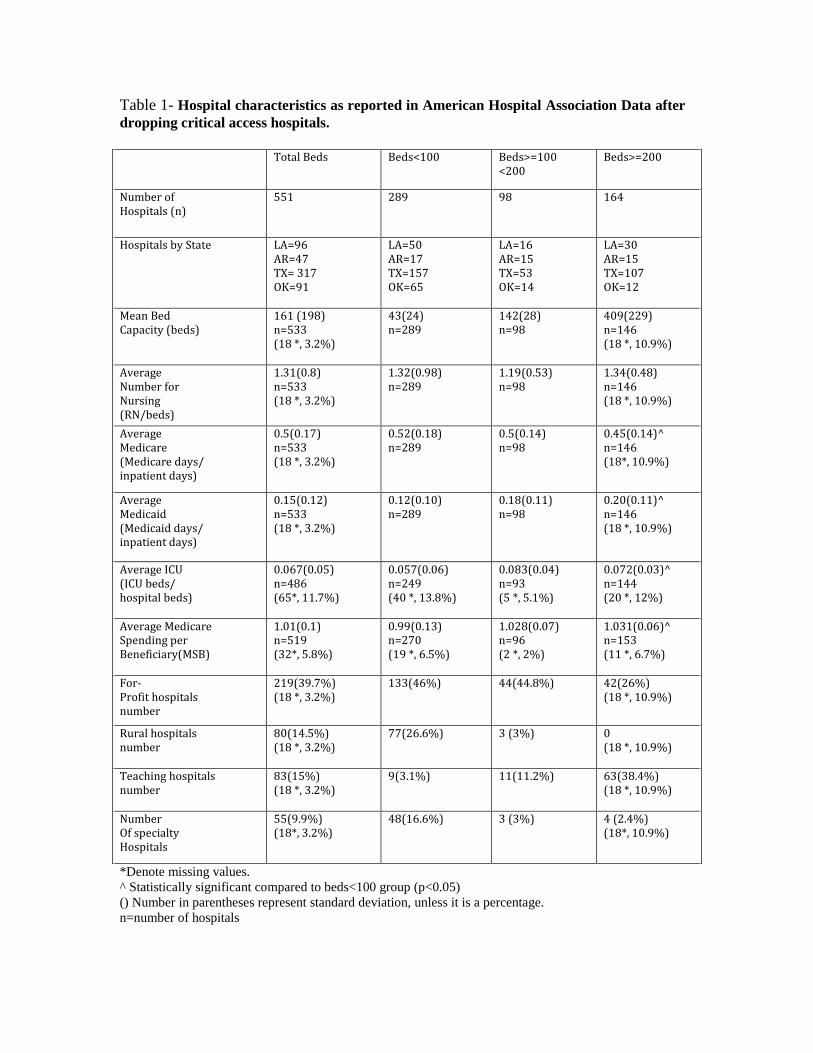
77
Table 1- Hospital characteristics as reported in American Hospital Association Data after dropping critical access hospitals. Total Beds Beds<100 Beds>=100
<200 Beds>=200
Number of Hospitals (n)
551 289
98
164
Hospitals by State LA=96 AR=47 TX= 317 OK=91
LA=50 AR=17 TX=157 OK=65
LA=16 AR=15 TX=53 OK=14
LA=30 AR=15 TX=107 OK=12
Mean Bed Capacity (beds)
161 (198) n=533 (18 *, 3.2%)
43(24) n=289
142(28) n=98
409(229) n=146 (18 *, 10.9%)
Average Number for Nursing (RN/beds)
1.31(0.8) n=533 (18 *, 3.2%)
1.32(0.98) n=289
1.19(0.53) n=98
1.34(0.48) n=146 (18 *, 10.9%)
Average Medicare (Medicare days/ inpatient days)
0.5(0.17) n=533 (18 *, 3.2%)
0.52(0.18) n=289
0.5(0.14) n=98
0.45(0.14)^ n=146 (18*, 10.9%)
Average Medicaid (Medicaid days/ inpatient days)
0.15(0.12) n=533 (18 *, 3.2%)
0.12(0.10) n=289
0.18(0.11) n=98
0.20(0.11)^ n=146 (18 *, 10.9%)
Average ICU (ICU beds/ hospital beds)
0.067(0.05) n=486 (65*, 11.7%)
0.057(0.06) n=249 (40 *, 13.8%)
0.083(0.04) n=93 (5 *, 5.1%)
0.072(0.03)^ n=144 (20 *, 12%)
Average Medicare Spending per Beneficiary(MSB)
1.01(0.1) n=519 (32*, 5.8%)
0.99(0.13) n=270 (19 *, 6.5%)
1.028(0.07) n=96 (2 *, 2%)
1.031(0.06)^ n=153 (11 *, 6.7%)
For- Profit hospitals number
219(39.7%) (18 *, 3.2%)
133(46%) 44(44.8%) 42(26%) (18 *, 10.9%)
Rural hospitals number
80(14.5%) (18 *, 3.2%)
77(26.6%) 3 (3%) 0 (18 *, 10.9%)
Teaching hospitals number
83(15%) (18 *, 3.2%)
9(3.1%) 11(11.2%) 63(38.4%) (18 *, 10.9%)
Number Of specialty Hospitals
55(9.9%) (18*, 3.2%)
48(16.6%) 3 (3%) 4 (2.4%) (18*, 10.9%)
*Denote missing values. ^ Statistically significant compared to beds<100 group (p<0.05) () Number in parentheses represent standard deviation, unless it is a percentage. n=number of hospitals

78
Table 2-describes HCAHPS data characteristics reported by bed size for all reporting
hospitals after dropping the critical access hospitals from the data. Most reporting
facilities are in hospitals with fewer than 100 beds (52%), 29 % of observations occur in
large hospitals where bed size is greater than 200, and 18 % are in medium-sized
hospitals with beds 100-200. Missing observations occurred in 4% of all small hospitals
(<100 beds), 2% in medium-sized hospitals (100-200 beds) and 7% of all large hospitals
(>200 beds). 50% of total missing observations occur in specialty hospitals. 4% of
missing observations are from rural hospitals. Mean percent satisfaction scores appear
higher in smaller hospitals compared to larger hospitals among all composites except for
patients definitely recommending hospital.
Table 2- Hospitals reporting HCAHPS characteristics in Hospital Compare Data by bed size and hospitals missing based on number of hospitals in the AHA database after dropping critical access hospitals from data.
All hospital bed sizes (min-max)
Hospitals with beds<100 (min-max)
Hospitals with beds >=100 <200 (min-max)
Hospitals with beds>=200 (min-max)
Percent patients who reported that nurses always communicated well.
79.5(55-98) N=525 (26*, 4.7%)
81.5(55-98) N=277 (12*, 4.1%)
77.3(67-88) N=96 (2*, 2%)
77.3%(65-94)^ N=152 (12 *, 7.3%)
Percent patients who reported that physicians always communicated well
83.6(71-98) N=525 (26 *, 4.7%)
85.8(71-98) N=277 (12*, 4.1%)
81.7(75-92) N=96 (2 *, 2%)
81.0(74-94)^ N=152 (12 *, 7.3%)
Percent patients who reported that they always receive help as soon as they wanted
68.8%(45-99)) N=525 (26 *, 4.7%)
73.3(48-99) N=277 (12*, 4.1%)
64.7(51-85) N=96 (2 *, 2%)
63.2(45-88)^ N=152 (12 *, 7.3%)

79
Percent patients who reported that their pain was always well controlled
72.4(51-98) N=525 (26 *, 4.7%)
74.1(51-98) N=277 (12*, 4.1%)
70.6(60-85) N=96 (2 *, 2%)
70.6(62-84)^ N=152 (12 *, 7.3%)
Percent patients who reported that staff always explained about medicines.
65.4(34-98) N=525 (26 *, 4.7%)
67.7(34-98) N=277 (12*, 4.1%)
62.7(55-71) N=96 (2 *, 2%)
62.8(52-83)^ N=152 (12 *, 7.3%)
Percent patients who reported that their room and bathroom were always clean
73.4(46-95) N=525 (26 *, 4.7%)
76.3(46-95) N=277 (12*, 4.1%)
70.6(60-85) N=96 (2 *, 2%)
70.1(57-87)^ N=152 (12 *, 7.3%)
Percent patients who reported that the area around their room was always quiet at night.
68.6(46-97) N=525 (26 *, 4.7%)
72.4(46-97) N=277 (12*, 4.1%)
65.0(52-81) N=96 (2 *, 2%)
63.9(51-91)^ N=152 (12 *, 7.3%)
Percent patients who reported that they were given information about what to do during their recovery at home
84.5(61-97) N=525 (26 *, 4.7%)
85.2%(61-97) N=277 (12*, 4.1%)
83.7(76-92) N=96 (2 *, 2%)
83.9(76-92)^ N=152 (12 *, 7.3%)
Percent patients who gave their hospital a rating of 9 or 10 on a scale from 0 to 10
72.2(32-97) N=525 (26 *, 4.7%)
73.6(32-97) N=277 (12*, 4.1%)
69.7%(53-90) N=96 (2 *, 2%)
71.3(48-91)^ N=152 (12 *, 7.3%)
Percent patients who reported YES they would definitely recommend the hospital
72.3(37-98) N=525 (26 *, 4.7%)
72.6(37-98) N=277 (12*, 4.1%)
70.3(49-93) N=96 (2 *, 2%)
73.3(49-93) N=152 (12 *, 7.3%)
Numbers represent mean percent (min-max) N=number of hospitals *Denotes missing observations. ^ Statistically significant compared to beds<100 group (p<0.05)
Table 3 reports stroke data derived from Hospital Compare. There are significant missing
observations for stroke patients. Most of observations occur in hospitals with beds >200.
Most missing observations occur in beds <100. Very few total observations are noticed
within SK3 and SK4. Among missing observations, 10-20% are from specialty hospitals,

80
20-30% are from rural hospitals. In most measures, there is noticeable improvement in
mean stroke quality percent scores as hospital bed size increases.
Table 3- Stroke Data as reported in Hospital Compare. All hospital beds
(min-max) Beds<100 (min-max)
Beds>=100 <200(min-max)
Beds>=200 (min-max)
Percent stroke patients who received treatment to keep blood clots from forming within 2 days of arriving at the hospital (SK1)
89.9(29-100) N=274 (277*, 50%)
85.4(42-100) N=43 (246 *, 85%)
88.8(29-100) N=85 (13 *, 13%)
91.9(50-100)^ N=146 (18 *, 10.9%)
Percent ischemic stroke patients who received a prescription for medicine known to prevent complications caused by blood clots before discharge (SK2)
97.7(64-100) N=278 (273*, 49.5%)
96.1(80-100) N=44 (245 *, 84.7%)
97.4(64-100) N=87 (11 *, 11%)
98.3(83-100)^ N=147 (17 *, 10.3%)
Percent ischemic stroke patients with a type of irregular heartbeat who were given a prescription for a blood thinner at discharge (SK3)
95.2(73-100) N=60 (491 *, 89%)
0 N=0 (289 *, 100%)
95.8(86-100) N=6 (92 *, 94%)
95.1(73-100) N=54 (110 *, 67%)
Percent ischemic stroke patients who got medicine to break up a blood clot within 3 hours after symptoms started (SK4)
69.6(0-100) N=44 (507 *, 92%)
0 N=0 (289*, 100%)
33.5(0-94) N=6 (92*, 94%)
75.3(0-100) N=38 (126*, 77%)
Percent ischemic stroke patients who received medicine known to prevent complications caused by blood clots within 2 days of arriving at the hospital (SK5)
97.2(75-100) N=268 (283*, 51%)
96.4(82-100) N=38 (251*, 87%)
96.8(75-100) N=84 (14*, 14.2%)
97.6(76-100)^ N=146 (18*, 10.9%)

81
Percent ischemic stroke patients needing medicine to lower cholesterol, who were given a prescription for this medicine before discharge (SK6)
90.3(36-100) N=266 (285*, 51.7%)
81.3(36-100) N=38 (251*, 87%)
89.7(45-100) N=82 (16*, 16.3%)
92.9(59-100)^ N=146 (18*, 10.9%)
Percent ischemic or hemorrhagic stroke patients or caregivers who received written educational materials about stroke care and prevention during the hospital stay (SK7)
85.5(0-100) N=227 (324*, 59%)
76.4(16-100) N=16 (273*, 94%)
84.4%(0-100) N=68 (30*, 30.6%)
87.0(18-100)^ N=143 (21*, 13%)
Percent ischemic or hemorrhagic stroke patients who were evaluated for rehabilitation services (SK8)
95.2(46-100) N=282 (269*, 49%)
91.9(64-100) N=48 (241*, 83%)
93.9(46-100) N=87 (11*, 11%)
97.0(80-100)^ N=147 (17 *, 10.3%)
Numbers represent average percent scores (min-max) N= number of hospitals *denote missing observations ^ Statistically significant compared to <100 beds group (p<0.05)
Table 4 reports VTE data derived from Hospital Compare. There are significant missing
observations within VTE, most are concentrated in hospitals with beds less than 100.
Most of observations occur in hospitals with beds >200, except for VTE1 (patients who
got treatment to prevent blood clots on the day of or day after hospital admission or
surgery), where majority of observations occur in beds<100. Very few total observations
are noticed for VTE4 and VTE6. Among missing observations, 15-30 % are from
specialty hospitals, 20-35% are from rural hospitals (except variable VTE1, where 55%
of missing values are from specialty hospitals). In most measures, there is noticeable
improvement in VTE mean quality percent scores as hospital bed size increases.

82
Table 4- VTE Data as reported in Hospital Compare. All Beds Beds<100 Beds>=100 Beds>=200 <200 (Min-max) (Min-max) (Min-max) (Min-max) Percent patients who got treatment to prevent blood clots on the day of or day after hospital admission or surgery (VTE1)
75.4 (0-100) N=522 (29*, 5.2%)
68.6 (0-100) N=269 (20 *, 6.9%)
82.9 (20-100) N=96 (2*, 2%)
82.7(44-100)^ N=157 (7 *, 4.2%)
Percent patients who got treatment to prevent blood clots on the day of or day after being admitted to the intensive care unit (ICU) (VTE2)
88.1(19-100) N=360 (191 *, 34.6%)
82.7(19-100) N=114 (175 *, 60.5%)
89.3(43-100) N=93 (5*, 5.1%)
91.4(67-100)^ N=153 (11*, 6.7%)
Percent patients with blood clots who got the recommended treatment, which includes using two different blood thinner medicines at the same time (VTE3)
90.5(36-100) N=266 (285 *, 51.7%)
86.5(36-100) N=44 (245 *, 84.7%)
90.7(37-100) N=76 (22*, 22.4%)
91.6(54-100)^ N=146 (18 *, 10.9%)
Percent patients with blood clots who were treated with an intravenous blood thinner, and then were checked to determine if the blood thinner was putting the patient at an increased risk of bleeding (VTE4)
97.1(21-100) N=109 (442 *, 80.2%)
100(0-100) N=4 (285 *, 98.6%)
97.6(85-100) N=18 (80*, 81.6%)
96.8(21-100) N=87 (77 *, 46.9%)
Percent patients with blood clots who were discharged on a blood thinner medicine and received written instructions about that medicine (VTE5)
81.9(0-100) N=238 (313 *, 56.8%)
81.1(18-100) N=30 (259*, 89.6%)
85.5(0-100) N=67 (31*, 31.6%)
80.4(0-100) N=141 (23 *, 14%)
Percent patients who developed a blood clot while in the hospital who did not get treatment that could have prevented it (VTE6)
9.4(0-47) N=80 (471 *, 85.4%)
0 N=0 (289 *, 100%)
2.6(0-8) N=3 (95 *, 97%)
9.7(0-47) N=77 (87 *, 53%)
Numbers represent mean percent (min-max) N= number of hospitals *denote missing observation ^statistically significant compared to <100 beds group (p<0.05)

83
Table 5 reports AMI data derived from Hospital Compare. There are significant missing
observations within MI, most are concentrated in beds<100. Most of observations occur
in hospitals with beds >200 for measures MI1, MI3 and MI8. For MI4 and MI6, most
observations occur in beds<100. Very few total observations are noticed for MI5, MI7
and MI9. There are no observations for MI2 (Percent of heart attack patients given
fibrinolytic medication within 30 minutes of arrival). Among missing observations, 10-20
% are from specialty hospitals, 20-30% from rural hospital.
Average percentage scores are higher in beds> 200 hospitals in most AMI measures.
Table 5- MI Data as reported in Hospital Compare. All Beds Beds<100 Beds>=100 Beds>=200 <20 (Min-max) (Min-max) (Min-max) (Min-max) Percent of Heart Attack Patients Given Aspirin at Discharge (MI1)
98.1(58-100) N=268 (283*, 51.3%)
95.9(58-100) N=45 (244*, 84.4%)
97.8(72-100) N=79 (19*, 19.3%)
98.9(79-100)^ N=144 (20*, 12.1%)
Percent of Heart Attack patients given fibrinolytic medication Within 30 Minutes Of Arrival (MI2)
0 N=0 (551*, 100%)
0 N=0 (289*, 100%)
0 N=0 (98 *, 100%)
0 N=0 (164 *, 100%)
Percent of Heart Attack Patients Given PCI Within 90 Minutes Of Arrival (MI3)
93.8(41-100) N=197 (354*, 64.2%)
94.1(82-100) N=16 (273*, 94.4%)
92.2(43-100) N=46 (52 *, 53%)
94.3(41-100) N=135 (29 *, 17.6%)
Average number of minutes before outpatients with chest pain or possible heart attack got an ECG (MI4)
9.0(0-60) N=225 (326*, 59.1%)
9.24(0-60) N=152 (137 *, 47.4%)
8.3(1-26) N=46 (52 *, 53%)
9.0(2-17) N=27 (137 *, 83.5%)

84
Average number of minutes before outpatients with chest pain or possible heart attack were transferred to another hospital (MI5)
83.1(28-306) N=30 (521*, 94.5%)
101(28-306) N=18 (271 *, 93.7%)
59(30-130) N=5 (93 *, 94.8%)
52.5(30-98)^ N=7 (157 *, 95.7%)
Percent of outpatients with chest pain or possible heart attack who got aspirin within 24 hours of arrival (MI6)
94.4(71-100) N=225 (326*, 59.1%)
93.9(71-100) N=152 (137*, 47.4%)
95.5(76-100) N=46 (52 *, 53%)
95.3(73-100) N=27 (137*, 83.5%)
Percent of outpatients with chest pain or possible heart attack who got drugs to break up blood clots within 30 minutes of arrival (MI7)
54.3(6-92) N=16 (535*, 97%)
45.8(6-75) N=9 (280*, 96.8%)
65.1(15-92) N=7 (91 *, 92.8%)
0 N=0 (164 *, 100%)
Percent of heart Attack Patients Given a Prescription for a Statin at Discharge (MI8)
96.5(36-100) N=268 (283*, 51.3%)
93.0(41-100) N=45 (244*, 84.4%)
95.7(36-100) N=79 (19 *, 19.3%)
98.1(83-100)^ N=144 (20 *, 12.2%)
Median Time to Fibrinolysis in minutes (MI9)
38.2(18-134) N=16 (535*, 97%)
45.3(27-134) N=9 (280 *, 96.8%)
29.1(18-62) N=7 (91 *, 92.8%)
0 N=0 (164 *, 100%)
Numbers represent average percent scores (min-max), except in MI9, MI5 and MI4 where numbers represent minutes. N= number of hospitals *denote missing observations ^ statistically significant compared to beds<100 group (p<0.05)
Table 6 reports CHF data derived from Hospital Compare. There are significant missing
observations, all concentrated in beds<100. There are however less missing observations
compared to MI, stroke and VTE. In CHF1 and CHF3, most observations occur in beds<
100, although there are significant observations for beds>100 among all CHF measures.
Among missing observations, 15-40 % are from specialty hospitals, 10-25% from rural
hospitals. Average percentage scores are higher in beds> 200 hospitals in all CHF
measures

85
Table 6 - CHF Data as reported in Hospital Compare. All hospital beds<100 beds>=100 beds>=200 Beds <200 (Min-max) (Min-max) (Min-max) (Min-max) Percent of Heart Failure Patients Given an Evaluation of Left Ventricular Systolic (LVS) Function (CHF1)
94.8(0-100) N=430 (121*, 22%)
88 (0-100) N=184 (105 *, 36%)
98.6(76-100) N=96 (2 *, 2%)
99.52(94-100)^ N=150 (14 *, 8.5%)
Percent of Heart Failure Patients Given ACE Inhibitor or ARB for Left Ventricular Systolic Dysfunction (CHF2)
95(17-100) N=356 (195 *, 35%)
91.5(17-100) N=117 (172*, 59%)
96.5(76-100) N=92 (6*, 6%)
96.9(81-100)^ N=147 (17 *, 10.3%)
Percent of Heart Failure Patients Given Discharge Instructions (CHF3)
91(6-100) N=423 (128*, 23%)
86.6(6-100) N=177 (112 *, 38.7%)
93.6(44-100) N=96 (2 *, 2%)
94.72(47-100)^ N=150 (14 *, 8.5%)
Numbers represent average percent scores (min-max) N= number of hospitals *denote missing observations ^ statistically significant compared to beds<100 group (p<0.05) Table 7 reports pneumonia data derived from Hospital Compare. There are significant
missing observations, all concentrated in hospitals with beds size less than 100. There are
however less missing observations compared to MI, stroke or VTE. Most observations
occur in hospitals with less than 100 beds, although there are significant observations for
beds greater than 200. Among missing observations 5-15% are from rural hospitals and
35-40% are from specialty hospitals. Average percentage scores are higher in beds> 100
hospitals in all pneumonia measures.

86
Table 7 - Pneumonia Data as reported in Hospital Compare. All hospital beds<100 beds>=100 beds>=200 Beds <200 (Min-max) (Min-max) (Min-max) (Min-max) Percent of Pneumonia Patients Whose Initial ER Blood Culture Was Performed Prior to Administration Of First Dose Of Antibiotics (PN1)
96.7(55-100) N=423 (128*, 23.2%)
94.9(55-100) N=178 (111*, 38.4%)
98.2(92-100) N=95 (3*, 3%)
97.9(76-100)^ N=150 (14*, 8.5%)
Percent of Pneumonia Patients Given the Most Appropriate Initial Antibiotic(s) (PN2)
92.6(16-100) N=434 (117*, 21.2%)
88.9(16-100) N=190 (99*, 34.2%)
95.2(74-100) N=95 (3*, 3%)
95.8(80-100)^ N=149 (15*, 9.1%)
Numbers represent average percent scores (min-max) N= number of hospitals *denote missing observations ^ statistically significant compared to beds<100 group (p<0.05)
Table 8 reports SCIP data derived from Hospital Compare. There are significant missing
observations within SCIP, all concentrated in beds<100. Most of observations occur in
hospitals with beds <100 and beds>200, except in SCIP5 (Heart surgery patients whose
blood sugar (blood glucose) is kept under good control in the days right after surgery),
where, as expected, most observations occur in beds>200. Among missing observations,
10-20 % are from specialty hospitals and 40-50% from rural hospitals. Average
percentage scores are higher in beds> 200 hospitals in all SCIP measures.

87
Table 8 -SCIP Data as reported in Hospital Compare. All hospital beds<100 beds>=100 beds>=200 Beds <200 (Min-max) (Min-max) (Min-max) (Min-max) Percent surgery patients who were given an antibiotic at the right time (within one hour before surgery) (SCIP1)
97.5(6-100) N=433 (118*, 21%)
95.9(6-100) N=187 (102*, 35%)
98.8(88-100) N=94 (4*, 4%)
98.8(83-100)^ N=152 (12*, 7%)
Percent surgery patients whose preventive antibiotics were stopped at the right time (within 24 hours after surgery) (SCIP2)
96.6(0-100) N=430 (121*, 22%)
95.7(0-100) N=185 (104*, 36%)
97.0(69-100) N=93 (5 *, 5%)
97.5(89-100)^ N=152 (12 *, 7%)
Percent surgery patients who were given the right kind of antibiotic to help prevent infection (SCIP3)
97.9(6-100) N=432 (119*, 21.5%)
96.9(6-100) N=186 (103*, 35%)
98.2(59-100) N=94 (4*, 4%)
99(94-100)^ N=152 (12 *, 7%)
Percent patients who got treatment at the right time (within 24 hours before or after their surgery) to help prevent blood clots (SCIP4)
96.2(6-100) N=443 (108*, 19.6%)
94.6(6-100) N=195 (94*, 32.5%)
97.1(77-100) N=94 (4 *, 4%)
97.6(89-100)^ N=154 (10 *, 6%)
Percent heart surgery patients whose blood sugar (blood glucose) is kept under good control in the days right after surgery (SCIP5)
95.8(77-100) N=186 (365*, 66.2%)
95.1(85-99) N=13 (276*, 95.5%)
96.1(77-100) N=42 (56*, 57%)
95.8(81-100) N=131 (33*, 20%)
The percent of surgery patients whose urinary catheters were removed on the first or second day after surgery (SCIP6)
95.1(33-100) N=404 (147*, 26.6%)
93.54(33-100) N=159 (130*, 45%)
95.7(68-100) N=92 (6 *, 6%)
96.3(79-100)^ N=153 (11 *, 6.7%)

88
Percent surgery patients who were taking beta blockers before coming to the hospital who were kept on them (SCIP7)
95.8(46-100) N=382 (169*, 30.6%)
94.3(46-100) N=140 (149 *, 51.5%)
95.7(59-100) N=90 (8*, 8%)
97.3(81-100)^ N=152 (12 *, 7.2%)
Percent outpatients having surgery who got an antibiotic at the right time - within one hour before surgery (SCIP8)
96.7(45-100) N=402 (149*, 27%)
95.9(45-100) N=159 (130*, 45%)
96.9(79-100) N=90 (8*, 8%)
97.3(67-100)^ N=153 (11*, 6.7%)
Percent outpatients having surgery who got the right kind of antibiotic (SCIP9)
96.6(47-100) N=401 (150*, 27.2%)
96.3(47-100) N=158 (131*, 45.3%)
95.6(47-100) N=90 (8*, 8%)
97.3(80-100) N=153 (11 *, 6.7%)
Percent patients having surgery who were actively warmed in the operating room or whose body temperature was near normal (SCIP10)
99.4(32-100) N=452 (99*, 18%)
98.7(32-100) N=203 (86 *, 29.7%)
99.9(98-100) N=95 (3 *, 3%)
99.9(98-100)^ N=154 (10*, 6%)
Numbers represent average percent scores (min-max) N= number of hospitals *denote missing observations ^statistically significant compared to beds<100 group (p<0.05)
In the following section, General linear Modeling (GLM) will be used to analyze the
association between the outcome variable definrecomm (percent patients definitely
recommending hospital) and different process of care measures for stroke, VTE, MI,
CHF, pneumonia and SCIP. Evaluation of missing data shows a strong relationship to
bed size (i.e. more missing data in smaller hospitals). Due to that, we conduct our
analysis based on three bed size subgroups: beds less then100, beds between 100-200 and
beds greater than 200. We use these ranges to assess effect of small, medium and larger
hospitals155 in the interplay between process measures and patients satisfaction

89
In the GLM between definrecomm (definitely recommend hospital) and individual
process of care measures for stroke (shown in Table 9), only the variable SK2 (percent of
ischemic stroke patients who received a prescription for medicine known to prevent
complications caused by blood clots before discharge) is statistically significant in
beds>200. In beds<100, the small sample size limits the interpretation of findings for
this bed size. Recall that in stroke, most of observations occur in beds>200. Within all
hospital beds, percent of ischemic stroke patients who received a prescription for
medicine known to prevent complications caused by blood clots before discharge (SK2)
has the higher significance influencing patients definitely recommending hospital
(coefficient =0.37), although stroke patients who received treatment to keep blood clots
from forming within 2 days of arriving at the hospital (SK1) show some influence
towards patient satisfaction but with a lower magnitude (coefficient =0.09).
Table 9- Coefficients determining relationship between outcome variable (percent that definitely recommend hospital) and individual process of care measures for STROKE, after adjusting for structure measures (beds ,nursing , ICU , Medicare, Medicaid ,MSB, for profit , rural, teaching, specialty hospital) using General Linear Modeling. Total hospital
beds
Beds <100
Beds >=100 <200
Beds >=200
Percent stroke patients who received treatment to keep blood clots from forming within 2 days of arriving at the hospital (SK1)
0.09* n=262
n=40^
-0.004 n=82
0.12 n=140
Percent ischemic stroke patients who received a prescription for medicine known to prevent complications caused by blood clots before discharge (SK2)
0.37* n=263
n=40^
0.08 n=83
0.34* n=140

90
Percent ischemic stroke patients with a type of irregular heartbeat who were given a prescription for a blood thinner at discharge (SK3)
-0.009 n=60
n<10
n<10
-0.01 n=54
Percent ischemic stroke patients who got medicine to break up a blood clot within 3 hours after symptoms started (SK4)
-0.01 n=43
n<10
n<10
-0.01 n=37^
Percent ischemic stroke patients who received medicine known to prevent complications caused by blood clots within 2 days of arriving at the hospital (SK5)
0.2 n=257
n=35^
-0.009 n=82
0.15 n=140
Percent ischemic stroke patients needing medicine to lower cholesterol, who were given a prescription for this medicine before discharge (SK6)
0.09 n=254
n=34^
0.04 n=80
0.12 n=140
Percent ischemic or hemorrhagic stroke patients or caregivers who received written educational materials about stroke care and prevention during the hospital stay (SK7)
0.02 n=219
n=14^
0.02 n=66
0.04 n=139
Percent ischemic or hemorrhagic stroke patients who were evaluated for rehabilitation services (SK8)
0.06 n=267
n=44^
-0.06 n=83
-0.01 n=140
Numbers represent coefficient. *Denote statistical significance (p<0.05) n = number of observations (hospitals) ^ denote observations too few for significance

91
When studying the relationship between definrecomm (percent who definitely
recommend hospital) and individual process of care measures for VTE shown in Table
10, only a weak association (coefficient =0.06) is found with VTE1 (percent patients who
got treatment to prevent blood clots on the day of or day after hospital admission or
surgery) in beds<100. No associations are detected in larger hospitals or among all
hospitals.
Table 10- Coefficients determining relationship between outcome variable (percent that definitely recommend hospital) and individual process of care measures for VTE, after adjusting for structure measures (beds ,nursing , ICU , Medicare, Medicaid ,MSB, profit , rural, teaching, specialty hospital) using General Linear Modeling. Total beds
Beds <100
Beds >=100 <200
Beds >=200
Percent patients who got treatment to prevent blood clots on the day of or day after hospital admission or surgery (VTE1)
0.04 n=457
0.06* n=224
0.006 n=91
0.07 n=142
Percent patients who got treatment to prevent blood clots on the day of or day after being admitted to the intensive care unit -ICU (VTE2)
0.07 n=335
0.1 n=106
-0.007 n=89
0.04 n=140
Percent patients with blood clots who got the recommended treatment, which includes using two different blood thinner medicines at the same time (VTE3)
-0.04 n=252
n=40^
-0.015 n=73
0.023 n=139

92
Percent patients with blood clots who were treated with an intravenous blood thinner, and then were checked to determine if the blood thinner was putting the patient at an increased risk of bleeding (VTE4)
-0.009 n=105
n=0
n=17
-0.005 n=85
Percent patients with blood clots who were discharged on a blood thinner medicine and received written instructions about that medicine (VTE5)
0.007 n=227
n=29^
-0.014 n=64
0.021 n=134
Percent patients who developed a blood clot while in the hospital who did not get treatment that could have prevented it (VTE6)
-0.001 n=78
n=0
n<10
-0.004 n=75
Numbers represent coefficient. *Denote statistical significance (p<0.05) n = number of hospitals (observations.) ^ denote observations too few for significance
In Acute MI, shown in Table 11, for bed size greater than 200, 3 of 9 measures are
positively associated with definrecomm (patients definitely recommending hospital). The
strongest association occurs with percent of heart attacks patients given aspirin upon
discharge (MI1). Each percent increase in MI patients given aspirin upon discharge is
associated with 0.67% increase in patients definitely recommending hospitals. This
association remains in hospitals with 100-200 beds capacity but of a lesser magnitude
(coefficient = 0.52). The other associations in large hospitals occur with percent of
patients given statins upon discharge and percent of heart attack patients given PCI
within 90 minutes (coefficients =0.48 and 0.13 respectively). No other relationship

93
between definrecomm and process of care measures for MI is detected in the100-200 bed
size or in smaller (<100 beds) hospitals. Among all bed sizes, MI1 (aspirin upon
discharge) shows the strongest significance influencing patient satisfaction (coefficient
=0.32). MI8 (statins upon discharge) is also significantly associated with patients
definitely recommending hospital but with a lower magnitude (coefficient =0.23).
Table 11- Coefficients determining relationship between outcome variable (percent that definitely recommend hospital) and individual process of care measures for MI, after adjusting for structure measures (beds ,nursing , ICU , Medicare, Medicaid ,MSB, profit , rural, teaching, specialty hospital) using General Linear Modeling. Total
beds
Beds <100
Beds >=100 <200
Beds >=200
Percent of Heart Attack Patients Given Aspirin at Discharge (MI1)
0.32* n=253
n=40^
0.52* n=76
0.67* n=137
Percent of Heart Attack Patients Given Fibrinolytic Medication Within 30 Minutes Of Arrival (MI2)
n=0
n=0
n=0
n=0
Percent of Heart Attack Patients Given PCI Within 90 Minutes Of Arrival (MI3)
0.07 n=190
n=15^
0.07 n=44
0.13* n=131
Average number of minutes before outpatients with chest pain or possible heart attack got an ECG (MI4)
-0.09 n=201
-0.22 n=135
-0.12 n=44
0.22 n=22^
Average number of minutes before outpatients with chest pain or possible heart attack were transferred to another hospital (MI5)
-0.008 n=28^
-0.01 n=17^
n<10
n<10

94
Percent outpatients with chest pain or possible heart attack who got aspirin within 24 hours of arrival (MI6)
0.05 n=202
0.18 n=136
0.04 n=44
0.04 n=22^
Percent outpatients with chest pain or possible heart attack who got drugs to break up blood clots within 30 minutes of arrival (MI7)
0.06 n=16^
n<10
n<10
n=0
Percent heart Attack Patients Given a Prescription for a Statin at Discharge (MI8)
0.23* n=253
0.2 n=40^
0.14 n=76
0.48* n=137
Median Time to Fibrinolysis (MI9)
0.02 n=16^
n<10
n<10
n=0
Numbers represent coefficient. *Denote statistical significance (p<0.05) n = observations. ^ denote observations too few for significance When GLM is done between definrecomm (percent definitely recommend hospital) and
individual process of care measures for CHF (adjusting for beds, nursing, ICU, Medicare,
Medicaid, MSB, for profit, rural, teaching and specialty hospital status), various
associations are detected at different bed sizes. The results are presented in Table 12. In
larger hospitals (>200 beds), 2 out of 3 measures are related to percent of patients
definitely recommending the hospital. However, the variable percent of heart failure
patients given an evaluation of left ventricular systolic function (CHF1) is the most
strongly associated predictor of satisfaction (definrecomm). For each percent increase in
HF patients having evaluation of ventricular dysfunction there is a 1.96% increase in

95
patients definitely recommending hospital. Only percent given angiotensin converting
enzyme inhibitors or angiotensin receptor antagonists (CHF2) is associated with
definrecomm in beds 100-200 (coefficient 0.42). For hospitals with beds <100, there are
weaker relationships with CHF1 and percent given discharge instructions (CHF3)
(coefficient=0.15 and 0.1 respectively). All three measures are associated with percent
definitely recommending hospital among all beds. Strongest association in this group
remains with percent given evaluation of left ventricular function (coefficient=0.18).
Table 12- Coefficients determining relationship between outcome variable (percent that definitely recommend hospital) and individual process of care measures for CHF, after adjusting for structure measures (beds, nursing , ICU , Medicare, Medicaid ,MSB, profit , rural, teaching, specialty hospital) using General Linear Modeling.
Total Beds
Beds <100
Beds >=100 <200
Beds >=200
Percent of Heart Failure Patients Given an Evaluation of Left Ventricular Systolic Function (CHF1)
0.18* n=391
0.15* n=161
0.29 n=91
1.96* n=139
Percent of Heart Failure Patients Given ACE Inhibitor or ARB for Left Ventricular Systolic Dysfunction (CHF2)
0.16* n=333
0.07 n=107
0.42* n=87
0.37* n=139
Percent of Heart Failure Patients Given Discharge Instructions (CHF3)
0.1* n=385
0.10* n=155
0.02 n=91
0.04 n=139
Numbers represent coefficient.

96
*Denote statistical significance (p<0.05) n = observations.
In pneumonia, shown in Table 13, only patients who had blood cultures in the ER prior to
antibiotics (PN1) are more likely to definitely recommend with a 0.49% increase
satisfaction for each percent increase in cultures before antibiotics among large hospitals
with more than 200 beds. A weaker relationship persists among all hospital beds
(coefficient 0.28). Among all beds, all pneumonia measures are associated with percent
patients definitely recommending hospital. There is a notable weaker relationship with
percent given the most appropriate initial antibiotics (coefficient=0.08). No other
statistically significant associations are seen in hospitals less than 100 beds or in medium
sized hospitals (100-200 beds).

97
Table 13- Coefficients determining relationship between outcome variable (percent that definitely recommend hospital) and individual process of care measures for PNEUMONIA, after adjusting for structure measures (beds ,nursing , ICU , Medicare, Medicaid ,MSB, profit , rural, teaching, specialty hospital) using General Linear Modeling. Total
Beds
Beds <100
Beds >=200 <200
Beds >=200
Percent of Pneumonia Patients Whose Initial ER Blood Culture Was Performed Prior to Administration Of First Dose Of Antibiotics (PN1)
0.28* n=388
0.21 n=159
0.65 n=90
0.49* n=139
Percent of Pneumonia Patients Given the Most Appropriate Initial Antibiotic(s) (PN2)
0.08* n=397
0.07 n=168
0.14 n=90
0.19 n=139
Numbers represent coefficient. *Denote statistical significance (p<0.05) n = observations.
When GLM is conducted between definrecomm (percent definitely recommending
hospital) and individual SCIP measures (adjusting for beds, nursing, Medicare, Medicaid,
ICU, MSB, teaching, rural, for profit and specialty hospital variables), significant
associations are found in 4 out of 10 variables in hospitals with more than 200 beds
(SCIP5, SCIP6, SCIP7 and SCIP8). See Table 14 below. The strongest association
occurs in beds>200 with SCIP6 and SCIP8 variables. For each percentage increase in
surgery patients with urinary catheters removed on first or second day after surgery and
for each percent increase in outpatients receiving antibiotics within one hour of surgery,
there is a 0.39-0.35 % increase in patients who definitely recommend the hospital

98
respectively. In large hospitals with more than 200 beds, blood sugar control is
significantly associated with patient satisfaction (coefficient=0.33). In hospitals with 100-
200 beds, 4 out of 10 measures are associated with definrecomm. The strongest
relationship occurs with SCIP8. For each percent increase in outpatients having surgery
who got an antibiotic within one hour before surgery, there is a 0.74 % increase in
patients definitely recommending hospital. For inpatients, the strongest association
occurs with SCIP3 (Percent of surgery patients given the right antibiotic), with a
coefficient =0.67.In small hospitals with fewer than 100 beds, 7/10 SCIP measures have a
statistically significant association with definrecomm. Strongest relationship occurs with
SCIP2 (antibiotic stopped within 24 hours after surgery -coefficient = 0.35). For
outpatients, SCIP8 variable was strongly related to patient satisfaction (coefficient =
0.34). Among all hospital beds, SCIP8 for outpatients (Outpatients having surgery who
got an antibiotic at the right time - within one hour before surgery) and SCIP2 for
inpatient (surgery patients whose preventive antibiotics were stopped within 24 hours
after surgery) measures are of the most significance towards patient satisfaction
(coefficients of 0.36 and 0.31 respectively).

99
Table 14- Coefficients determining relationship between outcome variable (percent that definitely recommend hospital) and individual process of care measures for SCIP, after adjusting for structure measures (beds ,nursing , ICU , Medicare, Medicaid ,MSB, profit , rural, teaching, specialty hospital) using General Linear Modeling. Total
Beds
Beds <100
Beds >=100 <200
Beds >=200
Percent surgery patients who were given an antibiotic at the right time (within one hour before surgery) (SCIP1)
0.22* n=387
0.24* n=157
0.07 n=89
0.53 n=141
Percent surgery patients whose preventive antibiotics were stopped at the right time (within 24 hours after surgery) (SCIP2)
0.31* n=384
0.35* n=155
0.31 n=88
0.09 n=141
Percent surgery patients who were given the right kind of antibiotic to help prevent infection (SCIP3)
0.24 n=386
0.19 n=156
0.67* n=89
0.8 n=141
Percent patients who got treatment at the right time (within 24 hours before or after their surgery) to help prevent blood clots (SCIP4)
0.02 n=396
0.02 n=164
0.07 n=90
0.28 n=142
Percent heart surgery patients whose blood sugar (blood glucose) is kept under good control in the days right after surgery (SCIP5)
0.21 n=179
n=12
0.26 n=39
0.33* n=128
Percent of surgery patients whose urinary catheters were removed on the first or second day after surgery (SCIP6)
0.2* n=366
0.15* n=137
0.34* n=88
0.39* n=141

100
Percent surgery patients who were taking beta blockers before coming to the hospital who were kept on them (SCIP7)
0.15* n=349
0.14* n=121
0.35* n=86
0.32* n=142
Percent outpatients having surgery who got an antibiotic at the right time - within one hour before surgery (SCIP8)
0.36* n=359
0.34* n=131
0.74* n=86
0.35* n=142
Percent outpatients having surgery who got the right kind of antibiotic (SCIP9)
0.13 n=358
0.28* n=130
-0.04 n=86
0.07 n=142
Percent patients having surgery who were actively warmed in the operating room or whose body temperature was near normal (SCIP10)
0.20* n=403
0.23* n=171
-1.1 n=90
-0.02 n=142
Numbers represent coefficient. *Denote statistical significance (p<0.05) n = observations. ^ denote observations too few for significance
Table 15 presents the results of estimated relationships between individual structure
characteristics (MSB, profit, rural, teaching, beds, specialty hospital status, nursing,
Medicare, Medicaid, ICU) and the percent of patients definitely recommending hospital
using the General Linear Model for the individual process measures for stroke, VTE,
AMI, CHF, pneumonia and SCIP. Among most process of care models of patients
recommending the hospital, for profit hospitals are negatively associated with percent of
patients definitely recommending hospital. Larger bed size is positively associated with
definrecomm for 22 out of 38 measures, with only two associations in SCIP. 30 out of 38
measures in hospitals with a higher Medicaid concentration are negatively associated

101
with percent of patients definitely recommending hospital. Medicare concentration is also
negatively associated with patients definitely recommending hospital in 23 of 38
measures, but the magnitude of the association is weaker than with Medicaid. ICU bed
capacity is also negatively associated with definrecomm in 14 out of 38 process of care
measures. Most of ICU negative association with patients definitely recommending
hospital occurs in SCIP measures. Nursing supply is positively associated with
definrecomm among most process measures. Overall, no statistically significant
relationship is detected with Medicare spending per beneficiary (MSB), rural location, or
teaching status with hospitals for most measures. Specialty hospital status is strongly
positively associated with percent patients definitely recommending hospital across
measures for stroke, VTE, CHF, MI, pneumonia and SCIP.

102
Table 15- Coefficients for ‘structure’ measures in the GLM regression used to control for differences between hospitals that might influence or confound the relationship between the outcome variable (definitely recommend hospital) and individual process variables for Stroke, VTE, AMI, CHF, Pneumonia and SCIP, among all hospital bed sizes. Process measures
MSB profit rural teaching beds nursing medicare medicaid ICU Spec. Hosp.
SK1 10 -4.7* -5.1 -0.62 0.005* 3.02* -9 -13.5* 2.42 - SK2 2.7 -5.1* -1.1 -1.3 0.005* 2.4* -12.9* -15.2* -0.25 22.14* SK3 3.08 -7.5* - -0.22 0.001 2.12 -10 -8.9 -12.8 - SK4 17.9 -5.85 - -2.45 0.005* 2.9 -7.1 -28.9 -23.6 - SK5 8.72 -4.2* -0.61 -0.65 0.005* 3.02* -11.6* -18.07* 4.6 - SK6 3.92 -4.6* 0.71 -1.02 0.005* 2.18* -13.04* -16.27* -2.83 - SK7 4.9 -4.9* 0.21 -1.06 0.005* 2.18* -13.4* -18.4* -1.45 - SK8 6.09 -4.6* -4.64 -0.92 0.005* 3* -12.8* -15* -0.91 22.32* VTE1 2.2 -2* -2.6 0.67 0.004* 3.6* -6.5 -23.6* -31.9* 6.94* VTE2 8.9 -3.5* -5.5* 0.76 0.005* 3.4* -6.7 -20* -12 15.8* VTE3 5.5 -3.2* -3.5 -0.43 0.004* 2.9* -18.4* -26.8* -11.2 19.5* VTE4 9.09 -5.4* 5.45* -1.19 0.005* 0.027 -9.8 -21.64* 7.75 - VTE5 3.9 -3.9* 3.7* -2.7 0.004* 2.54* -13.1* -26.13* -8.1 19.3* VTE6 -3.87 -4.7* - -0.48 0.003* -0.05 -1.29 -13.54 -11.18 - MI1 2.3 -3.8* 3.3 -0.22 0.004* 2.3* -10.7* -19.7* -10 17.5* MI2 - - - - - - - - - - MI3 5.1 -4.9* 3.4* -1.6 0.004* 1.76* -9.8* -16.6* -14.2 21.7* MI4 5.51 -3.5* -2.07 4.11 0.002 4.31* -7.55 -21.84* -18.4 - MI5 - - - - - - - - - - MI6 3.78 -3.6* -1.73 3.98 0.003 4.22* -7.53 -21.76* -18.5 - MI7 - - - - - - - - - - MI8 -2.2 -4* 3.4* -0.34 0.0036 2.15* -10.6* -21.8* -11.1 17* MI9 - - - -- - - - - - CHF1 3.2 -2.9* -1.62 0.19 0.005* 3.37* -9* -22.5* -18.3 14* CHF2 6 -3.4* -0.17 0.03 0.005* 3.6* -12.8* -28.8* -22* 14* CHF3 4.7 -2.9* -3.2* 0.308 0.005* 3.8* -8 -21.1* -18.3* 11.9* PN1 5.9 -2.8* -1.32 0.74 0.0047* 3.58* -10.6* -22.6* -20.6* 14* PN2 6.7 -2.6* -1.8 0.44 0.0045* 3.86* -9.3* -19.4* -21.8* 12.4* SCIP1 5.1 -1.7* -1.37 0.59 0.0028 3.3* -10.5* -26.9* -31.6* 7.5* SCIP2 4.3 -1.6 -1.23 0.55 0.0016 3.36* -9.5* -26.5* -31.7* 7.23* SCIP3 4.1 -1.8* -2.5 0.48 0.0027 3.3* -10.2* -26.1* -29.8* 7.5* SCIP4 4.6 -1.8* -2.7 0.76 0.0039* 3.3* -10.3* -28.15* -28.2* 7.4* SCIP5 -11.9 -4.2* 2.4 -0.92 0.0024 1.77 -7.3 -19.7* -9.4 15.2* SCIP6 2.3 -2.2* 0.49 0.82 0.0025 3.1* -10.34* -27.6* -27.2* 7.6* SCIP7 0.51 -1.9* 2.7 0.49 0.0019 3.05* -12.5* -28.7* -26.2* 7.2* SCIP8 3.5 -2.6* -0.02 0.38 0.002 3.24* -15.47* -28.5* -26.4* 6.4* SCIP9 0.93 -2.2* -1.16 0.42 0.003 3.2* -15.5* -30.8* -25* 6.5* SCIP10 6.2 -1.4 -3.17 0.96 0.0038* 3.38* -9.75* -28.13* -30.2* 7.4* Numbers = coefficients. *Denote statistical significance (p<0.05).

103
When structural measures were analyzed in large hospitals with more than 200 beds
(Table 16), the statistically significant negative relationships between patients satisfaction
and ICU capacity, Medicare and Medicaid concentration are no longer present.
Moreover, the association with nursing supply and definrecomm is no more evident. The
only remaining significant relationships in large hospitals are with for-profit status
(negative) and number of beds (positive). Hospital specialty status still shows significant
positive association with patients definitely recommending hospitals within SCIP.
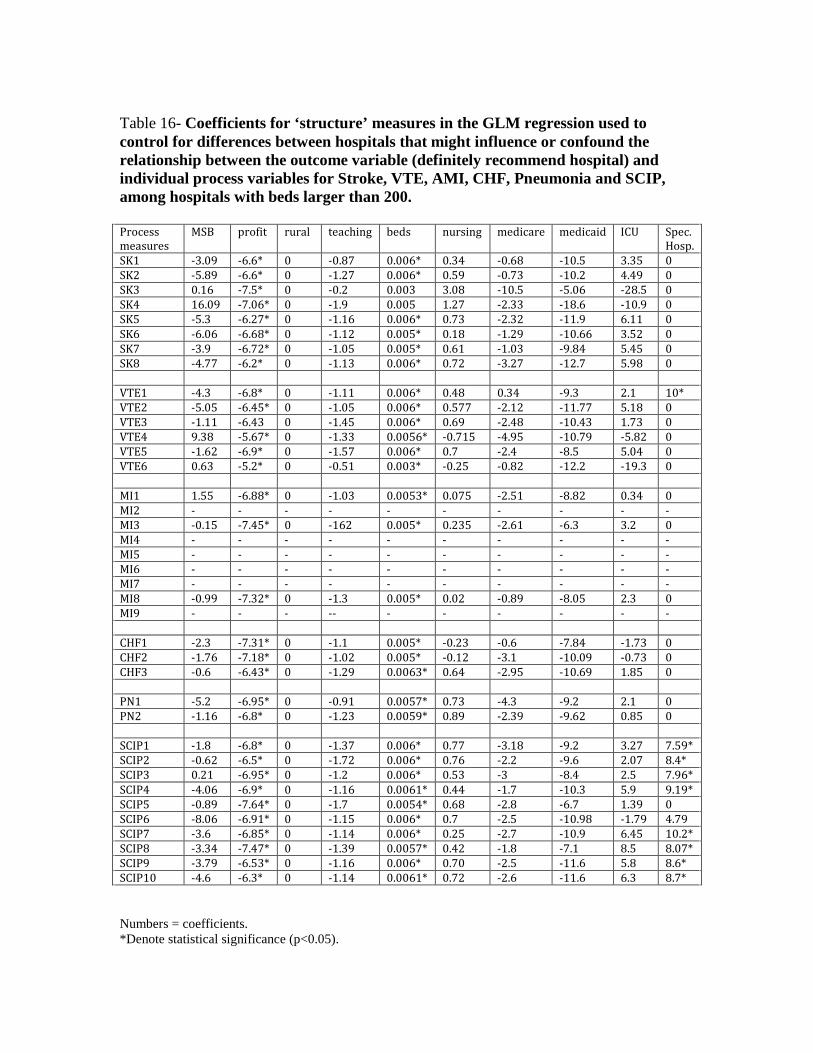
104
Table 16- Coefficients for ‘structure’ measures in the GLM regression used to control for differences between hospitals that might influence or confound the relationship between the outcome variable (definitely recommend hospital) and individual process variables for Stroke, VTE, AMI, CHF, Pneumonia and SCIP, among hospitals with beds larger than 200. Process measures
MSB profit rural teaching beds nursing medicare medicaid ICU Spec. Hosp.
SK1 -3.09 -6.6* 0 -0.87 0.006* 0.34 -0.68 -10.5 3.35 0 SK2 -5.89 -6.6* 0 -1.27 0.006* 0.59 -0.73 -10.2 4.49 0 SK3 0.16 -7.5* 0 -0.2 0.003 3.08 -10.5 -5.06 -28.5 0 SK4 16.09 -7.06* 0 -1.9 0.005 1.27 -2.33 -18.6 -10.9 0 SK5 -5.3 -6.27* 0 -1.16 0.006* 0.73 -2.32 -11.9 6.11 0 SK6 -6.06 -6.68* 0 -1.12 0.005* 0.18 -1.29 -10.66 3.52 0 SK7 -3.9 -6.72* 0 -1.05 0.005* 0.61 -1.03 -9.84 5.45 0 SK8 -4.77 -6.2* 0 -1.13 0.006* 0.72 -3.27 -12.7 5.98 0 VTE1 -4.3 -6.8* 0 -1.11 0.006* 0.48 0.34 -9.3 2.1 10* VTE2 -5.05 -6.45* 0 -1.05 0.006* 0.577 -2.12 -11.77 5.18 0 VTE3 -1.11 -6.43 0 -1.45 0.006* 0.69 -2.48 -10.43 1.73 0 VTE4 9.38 -5.67* 0 -1.33 0.0056* -0.715 -4.95 -10.79 -5.82 0 VTE5 -1.62 -6.9* 0 -1.57 0.006* 0.7 -2.4 -8.5 5.04 0 VTE6 0.63 -5.2* 0 -0.51 0.003* -0.25 -0.82 -12.2 -19.3 0 MI1 1.55 -6.88* 0 -1.03 0.0053* 0.075 -2.51 -8.82 0.34 0 MI2 - - - - - - - - - - MI3 -0.15 -7.45* 0 -162 0.005* 0.235 -2.61 -6.3 3.2 0 MI4 - - - - - - - - - - MI5 - - - - - - - - - - MI6 - - - - - - - - - - MI7 - - - - - - - - - - MI8 -0.99 -7.32* 0 -1.3 0.005* 0.02 -0.89 -8.05 2.3 0 MI9 - - - -- - - - - - - CHF1 -2.3 -7.31* 0 -1.1 0.005* -0.23 -0.6 -7.84 -1.73 0 CHF2 -1.76 -7.18* 0 -1.02 0.005* -0.12 -3.1 -10.09 -0.73 0 CHF3 -0.6 -6.43* 0 -1.29 0.0063* 0.64 -2.95 -10.69 1.85 0 PN1 -5.2 -6.95* 0 -0.91 0.0057* 0.73 -4.3 -9.2 2.1 0 PN2 -1.16 -6.8* 0 -1.23 0.0059* 0.89 -2.39 -9.62 0.85 0 SCIP1 -1.8 -6.8* 0 -1.37 0.006* 0.77 -3.18 -9.2 3.27 7.59* SCIP2 -0.62 -6.5* 0 -1.72 0.006* 0.76 -2.2 -9.6 2.07 8.4* SCIP3 0.21 -6.95* 0 -1.2 0.006* 0.53 -3 -8.4 2.5 7.96* SCIP4 -4.06 -6.9* 0 -1.16 0.0061* 0.44 -1.7 -10.3 5.9 9.19* SCIP5 -0.89 -7.64* 0 -1.7 0.0054* 0.68 -2.8 -6.7 1.39 0 SCIP6 -8.06 -6.91* 0 -1.15 0.006* 0.7 -2.5 -10.98 -1.79 4.79 SCIP7 -3.6 -6.85* 0 -1.14 0.006* 0.25 -2.7 -10.9 6.45 10.2* SCIP8 -3.34 -7.47* 0 -1.39 0.0057* 0.42 -1.8 -7.1 8.5 8.07* SCIP9 -3.79 -6.53* 0 -1.16 0.006* 0.70 -2.5 -11.6 5.8 8.6* SCIP10 -4.6 -6.3* 0 -1.14 0.0061* 0.72 -2.6 -11.6 6.3 8.7* Numbers = coefficients. *Denote statistical significance (p<0.05).

105
The following tables (17-22) analyze the relationship between global patient satisfaction
scores and individual HCAHPS composites (nursing communication, doctors
communication, responsiveness of staff, pain management, communication about
medications, adequacy of discharge planning) for individual process measures associated
with stroke, VTE, AMI, CHF, pneumonia and SCIP, adjusting for HCAHPS structure
measures (room clean, area quiet).
Table 17 shows the GLM regression results predicting the percent of patients who will
definitely recommend hospital based on each individual stroke process HCAHPS
measure adjusting for HCAHPS structure measures (rooms clean, area quiet). There is a
significant positive relationship between HCAHPS composites and percent of stroke
patients definitely recommending hospital. The strongest association is with pain
control among all beds (except beds<100 due to very few observations). In largest
hospital group, for each percent increase in patients who reported that their pain is
"Always" well controlled, there is a 1.25% increase in percent of patients who will
definitely recommend hospital. The second strongest association with the percent who
will definitely recommend the hospital is with nurse communication. Having fewer than
30 observations in small hospitals prevented statistical assessment of stroke measures in
this bed size range.

106
Table 17- Coefficients determining relationship between outcome variable (definitely recommend hospital), and each individual HCAHPS composite measure within stroke process measures adjusting for HCAHPS structure characteristics (room clean, area quiet) using General Linear Modeling. Total beds
Beds<100
Beds>=100 <200
Beds>=200
Patients who reported that nurses always communicated well.
1.11* n=224
n=16^
0.88* n=68
1.15* n=140
Patients who reported that physicians always communicated well
0.75* n=224
n=16^
0.37 n=68
0.94* n=140
Patients who reported that they always receive help as soon as they wanted
0.46* n=224
n=16^
0.57* n=68
0.44* n=140
Patients who reported that their pain was always well controlled
1.21* n=224
n=16^
1.14* n=68
1.25* n=140
Patients who reported that staff always explained about medicines.
0.68* n=224
n=16^
0.30* n=68
0.69* n=140
Patients who reported that they were given information about what to do during their recovery at home
0.86* n=224
n=16^
0.93* n=68
0.78* n=140
n=number of hospitals Numbers represent coefficients *Denote statistical significance ^ Very low observations for significant interpretation.

107
In Table 18, GLM regression results are reported for the outcome variable (definitely
recommend hospital) and each individual process HCAHPS measure for VTE adjusting
for HCAHPS structure measures (rooms clean, area quiet). There is a significant positive
relationship between HCAHPS composites and percent of patients definitely
recommending hospital within VTE. As with stroke, the strongest association for
individual process measures is with pain control among all hospitals and groups (except
for bed size of less than 100 due to very few observations). In the largest hospitals with
beds>200, for each percent increase in patients who reported that their pain is "Always"
well controlled, there is a 1.34% increase in patients who will definitely recommend the
hospital. The second strongest association of patients who will definitely recommend the
hospital is with nurse communication as with stroke patients.

108
Table 18- Coefficients determining relationship between outcome variable (definitely recommend hospital), and each individual HCAHPS composite measure within VTE process measures adjusting for HCAHPS structure characteristics (room clean, area quiet) using General Linear Modeling.
Total beds
Beds<100
Beds>=100 <200
Beds>=200
Patients who reported that nurses always communicated well.
1.08* n=230
n=30^
0.89* n=65
1.14* n=135
Patients who reported that physicians always communicated well
0.54* n=230
n=30^
0.04 n=65
0.84* n=135
Patients who reported that they always receive help as soon as they wanted
0.44* n=230
N=30^
0.49* n=65
0.41* n=135
Patients who reported that their pain was always well controlled
1.16* n=230
n=30^
1.37* n=65
1.34* n=135
Patients who reported that staff always explained about medicines.
0.73* n=230
n=30^
0.66* n=65
0.73* n=135
Patients who reported that they were given information about what to do during their recovery at home
0.96* n=230
N=30^
0.94* n=65
0.95* n=135
n=number of hospitals Numbers represent coefficients *Denote statistical significance ^ Very low observations for significant interpretation.

109
In Table 19, GLM regression results are reported for the outcome variable (definitely
recommend hospital) and each individual process HCAHPS measure for MI adjusting for
HCAHPS structure measures (rooms clean, area quiet). There is a significant positive
relationship between HCAHPS composites and percent of patients definitely
recommending hospital within AMI. Strongest association is with pain control among all
beds (except beds<100 due to very few observations). As with stroke and VTE, the
second strongest association is with nurse communication.
Table 19- Coefficients determining relationship between outcome variable (definitely recommend hospital), and each individual HCAHPS composite measure within AMI process measures adjusting for HCAHPS structure characteristics (room clean, area quiet) using General Linear Modeling.
Total beds
Beds<100
Beds>=100 <200
Beds>=200
Patients who reported that nurses always communicated well.
1.08* n=194
n=16^
0.65* n=46
1.18* n=132
Patients who reported that physicians always communicated well
0.70* n=194
n=16^
-0.1 n=46
0.88* n=132
Patients who reported that they always receive help as soon as they wanted
0.48* n=194
n=16^
0.37* n=46
0.47* n=132
Patients who reported that their pain was always well controlled
1.14* n=194
n=16^
1.08* n=46
1.27* n=132
Patients who reported that staff always explained about medicines.
0.74* n=194
n=16^
0.47* n=46
0.74* n=132

110
Patients who reported that they were given information about what to do during their recovery at home
0.83* n=194
n=16^
0.53 n=46
0.81* n=132
n=number of hospitals Numbers represent coefficients *Denote statistical significance ^ Very low observations for significant interpretation.
In Table 20, GLM regression results are reported between outcome variable (definitely
recommend hospital) and each individual process HCAHPS measure along with process
measures for CHF, adjusting for HCAHPS structure measures (rooms clean, area quiet).
There is a significant positive relationship between HCAHPS composites and percent of
patients definitely recommending hospital within CHF. Strongest association is with pain
control among all beds, except in beds<100 where nurse communication seems to have
the stronger relationship with definrecomm. In beds>200, for each percent increase in
patients who reported that their pain is "Always" well controlled, there is a 1.27 %
increase in patients who will definitely recommend hospital.

111
Table 20- Coefficients determining relationship between outcome variable (definitely recommend hospital), and each individual HCAHPS composite measure within CHF process measures adjusting for HCAHPS structure characteristics (room clean, area quiet) using General Linear Modeling.
Total beds
Beds<100
Beds>=100 <200
Beds>=200
Patients who reported that nurses always communicated well.
0.90* n=350
0.83* n=117
1.03* n=92
1.11* n=141
Patients who reported that physicians always communicated well
0.15 n=350
0.18 n=117
0.32 n=92
0.72* n=141
Patients who reported that they always receive help as soon as they wanted
0.22* n=350
0.28* N=117
0.56* n=92
0.39* n=141
Patients who reported that their pain was always well controlled
0.84* n=350
0.53* N=117
1.38* n=92
1.27* n=141
Patients who reported that staff always explained about medicines.
0.41* n=350
0.38* n=117
0.31 n=92
0.61* n=141
Patients who reported that they were given information about what to do during their recovery at home
0.87* n=350
0.78* N=117
1.22* n=92
0.76* n=141
n=number of hospitals Numbers represent coefficients *Denote statistical significance

112
Table 21 shows the GLM regression results predicting the percent of patients who will
definitely recommend hospital based on each individual pneumonia process HCAHPS
measure adjusting for HCAHPS structure measures (rooms clean, area quiet). There is a
significant positive relationship between HCAHPS composites and percent of pneumonia
patients definitely recommending hospital. The strongest association is with pain
control among beds>100 .In largest hospital group, for each percent increase in patients
who reported that their pain is "Always" well controlled, there is a 1.39% increase in
percent of patients who will definitely recommend hospital. In small bed hospitals (less
than 100), nurse communication dominates in predicting percent recommending
hospitals.
Table 21- Coefficients determining relationship between outcome variable (definitely recommend hospital), and each individual HCAHPS composite measure within PNEUMONIA process measures adjusting for HCAHPS structure characteristics (room clean, area quiet) using General Linear Modeling.
Total beds
Beds<100
Beds>=100 <200
Beds>=200
Patients who reported that nurses always communicated well.
0.92* n=409
0.95* n=173
0.99* n=95
1.21* n=141
Patients who reported that physicians always communicated well
0.23* n=409
0.47* n=173
0.37 n=95
0.74* n=141
Patients who reported that they always receive help as soon as they wanted
0.15* n=409
0.29* N=173
0.52* n=95
0.45* n=141

113
Patients who reported that their pain was always well controlled
0.78* n=409
0.62* N=173
1.24* n=95
1.39* n=141
Patients who reported that staff always explained about medicines.
0.37* n=409
0.38* n=173
0.26 n=95
0.72* n=141
Patients who reported that they were given information about what to do during their recovery at home
0.9* n=409
0.88* N=173
1.16* n=95
0.89* n=141
n=number of hospitals Numbers represent coefficients *Denote statistical significance
In Table 22, GLM regression results are reported between outcome variable (definitely
recommend hospital) and each individual process HCAHPS measure along with process
measures for SCIP, adjusting for HCAHPS structure measures (rooms clean, area quiet).
There is a significant positive relationship between HCAHPS composites and percent of
SCIP patients definitely recommending hospital. The strongest association is with pain
control among all beds, except in beds<100 where nurse communication has a stronger
relationship in determining patients definitely recommending hospital. In beds>200, for
each percent increase in patients who reported that their pain is "Always" well controlled,
there is a 1.44 % increase in patients who will definitely recommend hospital.

114
Table 22- Coefficients determining relationship between outcome variable (definitely recommend hospital), and each individual HCAHPS composite measure within SCIP process measures adjusting for HCAHPS structure characteristics (room clean, area quiet) using General Linear Modeling.
Total beds
Beds<100
Beds>=100 <200
Beds>=200
Patients who reported that nurses always communicated well.
0.83* n=344
0.63* n=117
0.8* n=85
1.21* n=142
Patients who reported that physicians always communicated well
0.40* n=344
0.40* n=117
0.23 n=85
0.75* n=142
Patients who reported that they always receive help as soon as they wanted
0.24* n=344
0.23* N=117
0.47* n=85
0.43* n=142
Patients who reported that their pain was always well controlled
0.85* n=344
0.39* N=117
1.01* n=85
1.44* n=142
Patients who reported that staff always explained about medicines.
0.43* n=344
0.26* n=117
0.34 n=85
0.72* n=142
Patients who reported that they were given information about what to do during their recovery at home
0.7* n=344
0.41 N=117
0.66 n=85
0.93* n=142
n=number of hospitals Numbers represent coefficients *Denote statistical significance

115
RESULTS SUMMARY
Significant findings are detected from the descriptive statistics. Smaller hospitals (less
than 100 beds) constitute the majority of observations reporting HCAHPS data. In
addition most of the HCAHPS mean composite scores also seem higher in smaller
hospitals. Larger hospitals however appear to have more Medicaid and less Medicare
patients. These hospitals also have more ICU beds and higher Medicare Spending per
Beneficiary. Larger hospitals also have lower ratio of for profit hospitals compared to
smaller ones. Rural and specialty hospitals are mostly distributed in smaller less than 100
beds hospitals, constituting 26% and 17% of these hospitals accordingly. Teaching
hospitals are mostly located among larger hospitals.
Looking into individual Hospital Compare process measures, it is noticeable that mean
percent scores for each measure are higher among larger hospitals. In stroke, VTE and
MI, most of the observations occur among larger hospitals. Increase in smaller hospitals
reporting for CHF, pneumonia and SCIP is noticeable with some having more
observations then larger hospitals. Missing data remains problematic across all hospital
compare measures, however there are less missing data among SCIP, pneumonia and
heart failure compared to stroke, VTE and MI. Rural hospitals and specialty hospitals
constitute 20-30% of missing data. Most of these data are also concentrated in hospitals
smaller than 100 beds.

116
GLM was then done to study the association of individual process of care measures for
stroke, VTE, MI, CHF, pneumonia and SCIP, and patients definitely recommending
hospital adjusting for structure measures (MSB, for- profit status, rural status, teaching,
beds, nursing, Medicare, Medicaid, ICU and specialty hospital status). Only 2 out of 8
measures are significant in stroke, with strongest relationship pertinent to antithrombotic
on discharge. No measures are significant in VTE among all bed sizes. In heart attack,
only 2 out of 9 measures are positively associated with patients definitely recommending
hospital among all beds, strongest relationship pertinent to aspirin given upon discharge.
In heart failure and pneumonia, all measures are positively associated with patient
satisfaction among all beds, with the strongest relationship occurring with evaluation of
left ventricular function in CHF and blood cultures before antibiotics in pneumonia.
Among all beds, 6 out of 10 SCIP measures are positively related to patients definitely
recommending hospital. Within inpatients strongest relationship occurs with stopping
antibiotics within 24 hours of surgery and among outpatients strongest association occurs
with receiving antibiotics at the right time.
The coefficients for structure measures in the GLM regression between the outcome
variable (definitely recommend hospital) and individual process variables for stroke,
VTE, AMI, CHF, pneumonia and SCIP are then analyzed. Among all beds, for-profit
status, Medicare, Medicaid and ICU are negatively associated with the outcome variable,
whereas nursing, bed size and specialty hospital status are positively related. Among
larger hospitals (>200 beds), only for-profit status remained negatively associated with

117
percent definitely recommending hospital. Only specialty hospital status and bed size
remain positively associated with the outcome variable in larger hospitals.
GLM regression was then done to analyze the relationship between global patient
satisfaction scores and individual HCAHPS composites (nursing communication, doctors
communication, responsiveness of staff, pain management, communication about
medications, adequacy of discharge planning) for individual process measures associated
with stroke, VTE, AMI, CHF, pneumonia and SCIP. Among larger hospitals, all
HCAHPS composites are significantly positively associated with percent patients
definitely recommending hospital. Pain control however seems to be the dominant
HCAHPS composite predicting global patient satisfaction in larger hospitals. In small
hospitals (<100 beds), and within heart failure, pneumonia and SCIP, nurse
communication is the dominant HCAHPS composite determining percent patients
definitely recommending hospital.
In the following chapter we will analyze all the above-mentioned findings in detail, and
try to understand drivers and common factors behind these relationships. Clinical and
policy implications will then be suggested towards improving patient satisfaction with
hospital care. In that regard, more research will be recommended towards that goal.
118
CHAPTER SEVEN
DISCUSSION
There is a paucity of studies looking into the association of hospital process of care
measures with patient satisfaction. Most of the studies examined summary quality
process scores instead of the effects of individual process of care scores 19,7,6,15,20,125
No studies have been done analyzing the association of stroke and VTE hospital compare
process measures with satisfaction scores. GLM regression was used to answer our
research question 1: “Is there a relationship between individual quality processes of care
measures for AMI, heart failure, pneumonia, SCIP, stroke, VTE, and global HCAHPS
satisfaction scores, adjusting for structure differences between hospitals?” We did not
find support to reject the null hypothesis Ho1= “There is no relationship between each
individual process of care measure for AMI, heart failure, pneumonia, SCIP, stroke, VTE
and Global HCAHPS scores adjusting for structure differences” because significant
process measures were not associated with the outcome (patients definitely
recommending hospital).
In stroke, 2 out of 8 process measures are related to global patient satisfaction. The
strongest association is with the percent of ischemic stroke patients who received a
prescription for medicine known to prevent complications caused by blood clots before
discharge. This is also the only significant relationship between stroke process measures
and patients definitely recommending hospital in larger hospitals (>200 beds).

119
Association between Hospital Compare stroke measures and patient satisfaction has not
been previously studied. Scant research has been done to compare various stroke
processes and patient satisfaction. Reker et al.126, in a cohort of 288 stroke veterans in
2002, studied compliance with AHRQ process stroke guidelines (patient and family
education, baseline assessments, discharge planning, family involvement, monitoring of
patient progress, management of impairments, multidisciplinary evaluation, prevention of
complications, prevention of recurrent stroke, goal setting, treatment plan) and patient
satisfaction using a stroke- specific instrument. Process of care in their study was
positively and significantly associated with greater patient satisfaction.
The positive relationship between percent of ischemic stroke patients who received a
prescription for medicine known to prevent complications caused by blood clots
(antithrombotic) before discharge and definrecomm in our study seems to be in agreement
with findings on the components of AHRQ stroke process measures in the Reker’s
analysis (discharge planning, prevention of recurrent stroke, treatment plan).
Antithrombotic therapy with antiplatelet agents is known to prevent strokes. In a meta-
analysis of 287 studies involving 135,000 patients in comparison of antiplatelet therapy
versus control, allocation to antiplatelet therapy reduced the combined outcome of any
serious vascular event by about one quarter, non-fatal myocardial infarction was reduced
by one third, non-fatal stroke by one quarter, and vascular mortality by one sixth140. In
our inquiry two processes were associated with patients definitely recommending hospital
in stroke (percent of stroke patients receiving medications to prevent strokes upon
discharge and percent stroke patients who received treatment to keep blood clots from

120
forming within 2 days of arriving at the hospital). As mentioned previously health
outcomes including mortality, problem resolution, readmissions and complications have a
strong effect on patient satisfaction 14, 68, 16,8,61. It has been suggested that individual
stroke measures are associated with improved outcomes150 (improved functional ability,
decreased risk of blood clots, decreased risk of recurrent strokes). Fonarow in a study of
stroke “Get with the Guidelines "summary composites in 2003-2009 (anti-thrombotics
/lipid lowering/smoking cessation/dysphagia/rehab evaluation and education), showed
that there was some improvement in hospital length of stay and in hospital mortality
when these composites were implemented159. There are limited studies however
analyzing all stroke quality measures as group with outcomes, or looking into influences
comparing individual processes towards outcomes. It is possible that the lack of other
stroke process associations with patient satisfaction is due to the absence of a true
relationship between different stroke process measures and outcomes. In a prospective
study of consecutive patients with acute stroke, process was measured by use of the
Royal College of Physicians Stroke Audit Package, and outcomes were measured by
range of disability, health status, handicap, and independence measures, as well as
mortality. There was evidence for a relationship between some process variables and
outcomes at hospital discharge, but the relationships were generally weak. Only 3 out of
six process measures were significant towards functional independence measure of
outcome. None of the process variables remained associated with outcomes after 12
months. The link between stroke process and outcome was not straightforward138. In a
retrospective cohort study that included patients with an ischemic stroke or transient
ischemic attack (TIA), the combined outcome included in-hospital mortality, discharge to

121
hospice, or discharge to a skilled nursing facility. Seven processes of stroke care were
evaluated: fever management, hypoxia management, blood pressure management,
neurologic evaluation, swallowing evaluation, deep vein thrombosis (DVT) prophylaxis,
and early mobilization. Only 3 of these processes of care, swallowing evaluation, DVT
prophylaxis, and treating all episodes of hypoxia with supplemental oxygen, were
independently associated with an improvement in the combined outcome after adjustment
139. Thus the lack of solid evidence linking stroke process measures with clinical
outcomes could explain the lack of relationship between the stroke Hospital Compare
measures and patient satisfaction.
In our study we are unable to reject the null hypothesis associated with VTE processes.
Among all beds there is no relationship between patient satisfaction and VTE measures.
Only a weak association is detected (coefficient=0.06) between percent of patients who
got treatment to prevent blood clots on the day of or day after hospital admission or
surgery in small hospitals (beds<100) and satisfaction. It is established that VTE
prophylaxis reduces risks of venous thromboembolism151 but there are no studies looking
into the association of VTE measures and patient satisfaction. The lack of VTE process
association with patient satisfaction scores could be due to the lack of an underlying
clinical relationship between VTE processes as a group and outcomes. In a study by
Johnbull et al. 127, using Hospital Compare SCIP VTE measures, and AHRQ PSI (patient
safety indicator) VTE outcomes; average annual prophylaxis performance was linked to
the 2-year VTE rate for each hospital (from July 1, 2009, to June30, 2011). The PSI-12
was adjusted for age, sex, diagnosis-related group, and modified comorbidity index.

122
Simple linear regression was used to test for an association between VTE prophylaxis
and VTE rate. There were 3040 hospitals with complete prophylaxis and VTE data. The
median risk adjusted VTE rate was 4.13 per 1000 surgical discharges. Prophylaxis
performance was not associated with VTE rate (P = .13) on linear regression. In a review
within the American College of Physicians VTE guidelines, Qaseem et al.160 have shown
that VTE prophylaxis was not associated with reduced risk of mortality. In our study, we
found no relationship between VTE measures and patient satisfaction (outcome measure)
in all hospitals or large hospitals with more than 200 beds.
In acute MI, only 3 out of 9 measures in large hospitals and 1 out of 9 measures in
medium sized hospitals with 100 to 200 beds are associated with patient satisfaction. The
strongest correlation occurs with percent of MI patients given aspirin upon discharge.
The second strongest association is detected with percent of MI patients given a statin
upon discharge. In the literature, one study looked into individual process of care
measures for AMI and there was no relationship between aspirin upon discharge, beta
blockers on discharge, ACE inhibitors on discharge, statins on discharge, cardiac rehab,
cardiac catheterization, PTCA or CABG, and patient satisfaction 10. Glickman et al. 14
examined clinical data on 6467 patients with acute myocardial infarction treated at 25 US
hospitals participating in the CRUSADE initiative from 2001 to 2006. Patient satisfaction
correlated with cardiac catheterization within 48 hours, beta-blockers on discharge,
clopidogrel on discharge, and lipid lower agents (strongest correlation coefficient =
0.199). Other studies looking into summary scores of AMI process measures did find a
positive association with patient satisfaction 19,7,6,15,20.

123
It is intriguing that measures related to discharge medications such as aspirin on
discharge and statins on discharge seem most strongly associated with global patient
satisfaction scores. In a study by Bradley et al. 128, the authors assessed hospital
performance in the CMS/JCAHO AMI core process measures using 2002-2003 data from
962 hospitals and they correlated these measures with 30-day mortality rates. All
measures were associated with decrease mortality, the strongest correlation however
occurred with aspirin upon discharge variable (coefficient =-0.18). In a more recent study
that included all patients discharged from Massachusetts General Hospital between 1 July
2004 and 31 December 2007 with a principle diagnosis of acute myocardial infarction
(AMI), heart failure (HF) or pneumonia (PN), hospital data were linked with state
administrative data to determine mortality and readmissions. Non-adherence to aspirin on
discharge was linked to highest hazard rate of 90-day mortality. 129. Also in the review
by the Antithrombotic Trialists' Collaboration 140 it was found that allocation to
antiplatelet therapy reduced non-fatal myocardial infarction by one third. Thus, it is very
likely that because of their stronger effect on other outcomes like mortality, these
discharge processes of care measures also have the most significant impact on patient
satisfaction.
In Heart Failure, two measures out of 3 are associated with patient satisfaction in large
hospitals with beds >200 (percent having evaluation of ventricular heart function, percent
given ACE inhibitors or ARBs), one out of 3 heart failure measures is associated with
patient satisfaction in medium sized hospitals (100-200 beds) (given ACE inhibitors or

124
ARBs), and two out of 3 measures are related to satisfaction in small hospitals with beds
<100(evaluation of ventricular heart function, percent heart failure patients given
discharge instruction) . Among all hospitals, all 3 measures are related to satisfaction.
The strongest relationship (coefficient =1.96) is found in hospitals with more than 200
beds for the percent of HF patients having an evaluation of ventricular dysfunction.
Gesell et al. 21, in a study of only 32 hospitals have shown that among HF measures, only
the percent of patients having had assessment of ventricular function and percent of
patients given discharge instructions were associated with patient satisfaction. Other
studies utilizing summary composite measures for HF showed significant positive
relationships with patient satisfaction 86, 7, 6, 15, and 20. In a study of 22,750 Medicare
patients with heart failure between March 2003 and December 2004, mortality and
cardiovascular readmission at 1 year and adherence to hospital-level process measures
were analyzed. Only assessment of left ventricular function was statistically associated
with cardiovascular readmissions130. Likewise in another cross-sectional study of hospital
care between January 1 and December 31, 2004, for acute myocardial infarction, heart
failure, and pneumonia, ten process performance measures included in Hospital Compare
were compared with hospital risk-adjusted mortality rates. In HF, assessment of LV
function was associated with lower 30 day and 1 year mortality 131. In a study by Shahian
et al. 129, non-adherence to LV assessment in the setting of HF showed the strongest
relationship to 365-days mortality. Thus, it is very likely by its demonstrated effect on
clinical outcomes, such mortality and readmission to the hospital, LV function
assessment for HF patients is likely to have the most significant impact on patient
satisfaction.

125
In pneumonia, patients admitted to hospitals with more than 200 beds and among all
hospitals, the percent of patients who had blood cultures in the ED prior to administration
of antibiotics is statistically and positively associated with global patient satisfaction.
Percent of pneumonia patients given the most appropriate initial antibiotic is weakly
associated with patients definitely recommending hospital among all bed sizes, but the
relationship is of a lower magnitude (coefficient=0.08). In review of the literature,
summary process of care measures in pneumonia have been shown to be positively
associated with patient satisfaction19, 7, 6, 20. Lee et al. 23 studied 2076 patients hospitalized
with pneumonia from 32 emergency departments. They used multilevel logistic
regression modeling to assess independent associations between patient outcomes and the
performance of 4 individual processes of care for pneumonia (assessment of oxygenation,
blood cultures, and rapid initiation [<4 hours] and appropriate selection of antibiotic
therapy). Mortality was not significantly associated with either individual or cumulative
process measures in multivariable models. In a study by Shahian et al.129, time-weighed
non adherence to blood culture prior to antibiotic therapy had the strongest relationship to
increased hazard rate of readmission at 90 and 365 days (1.06 and 1.04 respectively). The
lack of consistency in pneumonia process measure relationships with other outcomes
such as mortality, as shown in Lee et al.23 and their association with readmission in the
Shahian et al.129 study could possibly explain the relationship of the ‘cultures before
antibiotics administration’ measure in large hospitals with beds>200 with patient
satisfaction, and lack of relationships in smaller bed size hospitals in our analysis.

126
Among different bed sized hospitals, SCIP measures differ in their influences on the
percent of patients who definitely recommend the hospitals. In hospitals with more than
200 beds, 4 out of 10 SCIP measures are significantly associated with patient satisfaction.
Strongest relationships occur with percent surgery patients with urinary catheters
removed on first or second day after surgery for inpatients (coefficient=0.39) and percent
outpatients who received antibiotics within one hour or surgery for outpatients
(coefficient = 0.35). In hospitals with 100 to 200 beds, 4 out of 10 measures are
significantly associated with patient satisfaction. The strongest relationships in this bed
size range occur with percent having surgery that got an antibiotic within one hour before
surgery for outpatients (coefficient= 0.74), and the percent surgery patients given the
right kind of antibiotics for inpatients (coefficients = 0.67). In small hospitals with fewer
than 100 beds, 7 out of 10 measures are significantly associated with patient satisfaction.
The strongest relationship in this bed size occurs with percent whose antibiotic was
stopped within 24 hours after surgery for inpatients (coefficient =0.35) and percent that
received antibiotics within one hour of surgery for outpatients (coefficient=0.34).
Lyu et al.22, in a study of 31 hospitals, found no association between patient satisfaction
and individual SCIP measures (antibiotic prophylaxis, hair removal, urine catheter
removal, DVT prophylaxis). Other studies found a significant relationship between
summary SCIP measures and patient satisfaction 7, 6,125. To analyze the possible effect of
SCIP process measures on outcomes influencing patient satisfaction, additional SCIP
process and outcome studies were reviewed. In a cross-sectional study of 189 hospitals,
relationships between SCIP measures and outcomes (30-day overall morbidity, serious

127
morbidity, surgical site infections [SSI], and mortality) were collected from January 1,
2008, through December 31, 2008. Of the 16 correlations, 15 demonstrated non-
significant associations with risk-adjusted outcomes. The exception was the relationship
between SCIP-2 (appropriate antibiotics administration) and SSI (p = 0.004). SCIP-1
(antibiotics administered one hour before incision) demonstrated an intriguing but non-
significant relationship with SSI (p =0.08) and overall morbidity (p =0.08). Adherence to
SCIP-2 was a significant predictor of risk-adjusted SSI (p <0.0001) and overall morbidity
(p <0.0001) 132.
It might be reasonable to assume based on these findings that the effect of SCIP measures
on patient satisfaction could be related to a decrease in infectious complications. Stulberg
et al. 120 in a retrospective cohort study between July 1, 2006 and March 31, 2008, of
405,720 patients from 398 hospitals found that SCIP adherence measured through a
global all-or-none composite infection prevention score was associated with a lower
probability of developing a postoperative infection. However, adherence reported on
individual SCIP measures was not associated with a significantly lower probability of
infection in this study. Another study by Wang et al. found that targeting complete
compliance with SCIP infection prevention measures was not associated with additional
reductions in infection outcomes following hip replacement 133. Awad 134, in a review of
the literature in 2012, concluded that whereas there is some evidence that compliance
with the SCIP measures decreases SSIs, this has not been corroborated by large-scale
national studies. This was also reinforced by the fact that numerous studies demonstrate
that the Surgical Care Improvement Program (SCIP) has been ineffective.

128
It is very likely that by their effect on other outcomes (such as mortality and
readmission), SCIP processes of care measures have the most significant impact on
patient satisfaction. The strongest SCIP measures affecting patient satisfaction in our
data may have important impacts on decreasing infectious complications. They include
urine catheter removal within 48 hours, outpatient antibiotics within one hour of surgery,
right antibiotic administration, and preventive antibiotics discontinued within 24 hours of
surgery. However, the effect of individual SCIP measures on outcomes and satisfaction
is not fully established. It is not clear that the potential effect of SCIP processes of care
on the surgical infection rate is the sole clinical outcome that influences of patient
satisfaction. This argument has been raised by Kennedy et al.135 who in a study of 171
hospitals found that large hospitals, high surgical volume, and low mortality were
associated with patient satisfaction (P < 0.001). Compliance with SCIP process measures
and patient safety indicators, as well as length of stay, did not correlate with overall
satisfaction. Additionally, according to Kennedy et al.135, the presence of surgical
complications or increased readmission was not found to affect patient satisfaction.
Favorable surgical outcomes in their study were not consistently associated with high
HCAHPS scores. The authors concluded that factors outside of surgical outcomes could
be influencing patients’ perceptions of their care. More studies need to be done to
understand the various relationships among SCIP measures among different hospital bed
sizes and their associations with outcomes including patient satisfaction.
In previous studies, nursing supply has shown a positive relationship with satisfaction,

129
whereas Medicaid, for-profit status, and care intensity were negatively related6. Studies
have differed on the relationship between teaching status, bed size and rural status on
patient satisfaction. Moreover, in these studies, these relationships were not stratified
among different hospital bed sizes. 6,12,89,15,90,70,86 .In our research a significant positive
association between nursing, bed size, specialty hospital status and patient satisfaction
was detected among all process of care quality measures. There were also significant
negative relationships between for profit status, Medicaid, Medicare status, and ICU
(reflecting care intensity) and patient satisfaction. Although Medicare reflects older
patients who are expected to have better satisfaction 92, 88, these patients are generally
sicker with poorer health status and this could be correlated with lower satisfaction 9, 70, 71
In large hospital (beds >200), it is very interesting to note the disappearance of the
relationship between nursing, Medicare, Medicaid and ICU variables and percent of
patients definitely recommending hospitals. It is possible that a saturation point of
nursing supply, Medicare, Medicaid or ICU beds has been reached at a certain bed level
(less than 200), beyond which the impact of these variables is not of a significant
magnitude towards satisfaction. In hospitals with beds>200, only bed size was positively
associated, and for profit status was negatively associated with patient satisfaction.
Specialty hospital status remained significantly positively related to patients definitely
recommending hospital within SCIP. It is not clear why for profit hospitals perform
worse in patient satisfaction. It has been suggested that the patient population seen at for-
profit hospitals might differ in expectations, from the population seen at not-for profit 6.
As discussed previously, expectations influence and appear to have an inverse
relationship with satisfaction: if expectations are low, satisfaction is higher; if

130
expectations are high, perception of satisfaction is lower94
GLM regression was also used to answer our research question 2: “Is there an association
between each HCAHPS composite process measure within AMI, heart failure,
pneumonia, SCIP, stroke VTE, and global HCAHPS satisfaction adjusting for HCAHPS
structure differences?” .We did find enough support to reject the null hypothesis Ho2=
“There is no association between each HCAHPS process composite measure and global
HCAHPS scores within each studied quality process measure for MI, heart failure,
pneumonia, SCIP, stroke and VTE adjusting for HCAHPS structure measures” for large
hospitals with beds>200. The strongest associations in large hospitals were detected
between the percent of patients who report that pain was ‘always’ well controlled and
percent who definitely recommend hospital for the diagnoses of stroke, VTE, acute MI in
all bed sizes, and in hospitals with beds >100 for CHF, pneumonia and SCIP. In small
hospitals for CHF, pneumonia and SCIP, strongest relationship occurred between percent
who reported that nurses always communicated well and the percent who would
definitely recommend hospital. Pain control came second in this setting.
There is a paucity of studies looking into the association of individual HCAHPS
composite measures with global satisfaction measures. In cross-sectional observational
data, Elliot et al.136 determined whether the contributions of patients experiences on
HCHAPS composite measures with their overall hospital satisfaction ratings vary by
hospitalization type based on medical diagnoses. They calculated the simultaneous partial
correlations of 7 HCAHPS composite scores with overall hospital rating, controlling for

131
patient demographics. Nurse communication was most important overall, with a 0.34
average partial correlation. Discharge information was the least important overall to
patient hospital ratings, with an average partial correlation of 0.05. The importance of
composite scores varied by hospitalization types. Pain management had a partial
correlation of 0.23 with overall ratings for infectious diseases, but no correlation with
overall ratings for nervous system surgery.
In a study by Otani et al.137, the authors utilized data collected between January 2007 and
June 2008 from 32 hospitals. The patient satisfaction survey included the Consumer
Assessment of Healthcare Providers and Systems, Hospital version questionnaire items.
Two-stage multiple linear regression analyses were conducted with control variables
(age, gender, perceived health, education and race). It was found that patients' highest
priority was to be treated with courtesy and respect by nurses and physicians. Clark et
al.12 have a found significant positive association between nurses supply and patient
evaluation of their hospital care. Nurse supply was also positively associated with other
areas such as pain management, emotional and spiritual care, discharge process, tests and
treatment and overall satisfaction. Jha et al.6 in a study of 2429 hospitals reported that
hospitals in top quartiles of ratio of nurses to patient-days had better performance on
HCAHPS surveys compared to the hospitals in the bottom quartiles. In the same study,
within supplementary appendix 4, the correlation matrix among individual domains of
patient experience showed that global satisfaction score ‘definitely recommend hospital’
had the strongest correlation with communication with nurses(R=0.7). This was followed
by pain control (R=0.69) and then by discharge instructions (R=0.6). Wolosin et al.142,

132
investigated how domains of patient satisfaction in hospitals (via a commercially
available survey) predict HCAHPS global rating scores. Patient satisfaction with rooms,
physician care, and meals were also significant predictors of the HCAHPS overall rating,
but nursing care in their study was clearly the most important.
In view of the above findings, a correlation matrix between the outcome variable
definrecomm (definitely recommend hospital) and other HCAHPS composites: nurse
communication (nursecomm), doctor communication (mdcomm), receive help when
needed (receivehelp), pain control (paincontrol) , explanation about meds (medexplain),
discharge information(dcinfo), rooms kept clean (roomclean), areas kept quiet
(areaquiet) was examined. Results are found in Table 23.
Table 23- Correlation matrix between definrecomm and all other HCAHPS composites
As evident from the matrix on the data, the strongest correlation occurs between
definrecomm and nursecomm (R=0.67), followed by paincontrol (R=0.61) then dcinfo
(R=0.57). These results are comparable to the findings of the correlation matrix produced
in Jha et al.6

133
Our investigation however was unique in identifying the roles of each HCAHPS
composite for each process of care measures for stroke, VTE, AMI, CHF, pneumonia and
SCIP and analyzing the relationships of each HCAHPS composite with global patient
satisfaction. Pain control was the most important determinant for all measures in larger
hospitals with more than 100 beds. In hospitals with fewer than 100 beds, nurse
communication was the most important determinant in CHF, pneumonia and SCIP
patients. No other study in the literature has looked into these factors within these process
measures. It is interesting to note that pain control has the strongest association with
global patient satisfaction for process of care measures in our report, although in other
studies nurse communication had the strongest relationship to patients definitely
recommending hospital. We have suggested in our analysis of our first research question
that process of care measures affect patient satisfaction by influencing health outcomes.
Thus, it is very feasible that by affecting or reflecting patients’ outcomes or their
experience of their outcomes, pain control would strongly influence patient satisfaction.
In that regard, it has been shown that pain as a factor contributes to the development of
post-operative pulmonary complications among the elderly population after abdominal
surgery It has been also determined that pain could be a symptom of complications
related to hospitalization, surgery or any procedure suggestive of a poorer outcome146 147.
To further understand the role of pain management in the patient’s experience, a study of
4349 patients examined the relationship between patients' perceptions of pain control
during hospitalization and their overall satisfaction with care. Patient satisfaction was

134
more strongly correlated with the perception that caregivers did everything they could to
control pain than with pain actually being well controlled 143. In another pilot study of 88
patients, the authors used a 14-question survey from a questionnaire developed by the
American Pain Society to assess patient pain control and overall satisfaction with the
institution's pain management strategies. There was no association between pain intensity
score and patient satisfaction with overall pain management 144. It appears that
perception of pain control could be of greater importance than actual pain or pain
intensity control. Since pain control is of higher significance in our analysis towards
global patient satisfaction, it will be of great interest in future studies to comprehend
whether actual pain control or whether other determinants affecting patients’ perception
of pain management within stroke, VTE, AMI, CHF, pneumonia and SCIP affect global
patient satisfaction. That research should also include analysis of health outcomes such as
medical adverse events, surgical complications, readmissions, mortality or other
outcomes that are related to pain.
Our study is limited with missing data, although critical access hospitals (CAH) were
dropped from analysis. Before dropping critical access hospitals (n=136), 16.4% of
hospitals had missing HCAHPS data. However there are still 4.7% missing data among
these hospitals after dropping CAH. Significant missing data also remain in hospitals
reporting process measures in Hospital Compare. In stroke for example, in SK1 (Stroke
patients who received treatment to keep blood clots from forming within 2 days of
arriving at the hospital), there were 60% missing observations before dropping CAH.
However, there are still 50% missing observations after dropping CAH. Understandably,
135
stratifying information within different bed sizes helped us to identify the determinants of
missed data that are mostly concentrated in small hospitals with fewer than 100 beds.
We also had the opportunity to analyze large hospitals with beds>200 where there were
little missing data.
When studying effects of individual HCAHPS measures within hospital process
measures, significant amount of missing data limited interpretation of satisfaction in
smaller hospitals for stroke, VTE and MI. However for CHF, pneumonia and SCIP, with
a large enough sample size to assess hospital with less than 100 beds, there was a clear
distinction of the influence of pain control in large hospitals (beds>200) and nurse
communication in small hospitals (beds<100). This difference is also clearly shown in
tables 15 and 16 where the coefficients for ‘structure’ measure in the GLM regression
between outcome variable (definitely recommend hospital) and individual process
variables for stroke, VTE, AMI, CHF, pneumonia and SCIP were analyzed. The roles of
nursing, Medicare, Medicaid and ICU bed capacity were not evident in large hospitals
compared to small hospitals. The effect of bed size was also factored when looking into
the association of each process of care measure with patient satisfaction. Changes in the
level and strengths of relationships of these process measures were obvious among
hospitals of different sizes. More research needs to be done to understand the decreasing
role of nursing communication with increasing bed size. Since the great majority of rural
and specialty hospitals are concentrated in small hospitals, understanding other unique
characteristics among these hospitals will help to better appreciate their influence on
patient satisfaction.

136
It is also important to study other unmeasured confounders, such as cultural differences
and other contributors to patients’ perceptions of care among different hospital sizes.
These confounders can influence the relationships between process of care measures or
individual HCAHPS composites towards patients definitely recommending hospital.
Moreover, these confounders could play a key role in pain perception determining
satisfaction among larger hospitals compared to small ones. It is quite possible that
perception of quality of care also influences the way patients evaluate their responses
within all quality measures for stroke, VTE, MI, CHF, Pneumonia or SCIP.
It is established that confirmation or disconfirmation of expectations for a hospital is the
result of comparing the perceptions of current performance of the hospital with the
expectations. Depending on the confirmation or disconfirmation of expectations by
patient perceptions of the current hospital experience, patients are either satisfied or
dissatisfied 96, 161. In addition, perceived quality is the evaluation of a hospital experience
as determined by perceptions of the hospital performance 162. Perceived quality is also
influenced by expectations. Thus, patient expectations determine both the evaluation (i.e.,
perceived quality) and the response (i.e., satisfaction) to that evaluation of the health care
provider's performance 96. John has demonstrated that expectations are derived from
previous hospital experiences and these patient expectations influence perceptions of
current experience. Patient satisfaction consequently is the result of confirmation or
disconfirmation of these patient expectations 96. It is therefore important in future studies
to understand drivers behind previous and current patient experiences and their role
towards expectations and perception of care. This will help clarify the interplay between
quality process and outcome measures and patients satisfaction with hospital care.

137
It is of interest to find in our data the strong positive relationship between specialty
hospital status and patients definitely recommending hospital. Barro et al.156 have shown
that specialty hospitals have lower mortality and readmission rates compared to all other
hospitals. In another study of hospitals in 6 states, it has been shown that specialty
hospitals had lower risk-adjusted thirty-day mortality rates. These hospitals also had
higher patient satisfaction 157. Concerns have been raised however that specialty hospitals
data could be biased since some of these hospitals would select less medically
complicated patients 158.
Girotra et al. 15 showed that for both acute myocardial infarction (AMI) and heart failure
(HF), low-performing hospitals in quality measures had lower annual admission volume,
fewer beds, lower nurse FTE per 1000 patient days, and these hospitals were more likely
to be rural. It was also shown that low-performing cardiac hospitals were smaller, rural
facilities and these have higher risk-adjusted mortality90. Joynt et al.152 indicated that
patients who were discharged from small hospitals also had higher readmission rates than
those discharged from large hospitals. It was also shown by Joynt et al. that rural
hospitals had fewer clinical capabilities, worse measured processes of care, and higher
mortality rates for patients with AMI, CHF, or pneumonia153. In US hospitals higher
condition-specific performance on process measures was associated with lower risk-
adjusted mortality for Acute MI, heart failure and pneumonia154.

138
Better hospital quality process measures were also associated with improved
outcomes150, 138,128,130,131,149,129,132. (Functional ability, complications, readmissions,
mortality). It is also determined that health outcomes including mortality, problem
resolution, readmissions and complications have a strong effect on patient satisfaction 14,
68, 16,8,61. Larger sized hospitals in our data have higher mean scores on process measures.
Accordingly as anticipated for these larger hospitals, those with process measures having
highest impact on outcomes would have a greater impact on patient satisfaction. Indeed
in our regression data within research questions 1 and 2, the coefficients determining the
strengths of the relationships between process of care measures and satisfaction are
greater in magnitude in larger sized hospitals.
As discussed previously, a major determinant affecting global satisfaction is patients
‘expectations. This raises the potential for uncontrolled selection bias, which may affect
the results 113. In that regard, Heckman correction 114 was used in research question two,
for pneumonia process measures in the relationships between nursecomm, paincontrol
and definrecomm. The variable medicare was used in the selection equation, since
medicare reflects older patients who are expected to have better satisfaction 92, 88. Using
Heckman’s approach in this setting did not show evidence of selection bias (Mills p value
0.97 for nursecomm and 0.99 for paincontrol , not significant 114). See Appendix D for
Stata output of Heckman selection models.

139
Based on the above discussion, a proposed model on the relationship between process of
care measures, HCAHPS composites and Global patient satisfaction is outlined below.
Model for relationships between process of care measures, HCAHPS composites and
Global patient satisfaction:

140
In the above model, it is proposed that associations between process of care measures for
stroke, MI, CHF, pneumonia, SCIP, and other outcome measures (readmission, mortality
or infection) influence the relationships between individual process of care measures and
global patient satisfaction. (VTE not included in model since there are no associations
except for a small relationship in small hospitals with beds<100). Moreover, pain control
and nurse communication are the strongest determinants of patient satisfaction when
analyzed within individual process of care measures for stroke, VTE, acute MI, CHF,
pneumonia or SCIP.
LIMITATIONS
The study is limited by the number of various missing data from different components of
process of care measures limiting sample size for the analysis. Since there was a
relationship between missing data and bed size, we stratified hospitals in our analysis by
bed sizes (<100, 100-200, and >200 beds). The cross sectional design has several
significant weaknesses or threats to internal validity. One weakness is the potential for
uncontrolled selection bias, which may affect the results 113. In that aspect, Heckman
correction was applied as discussed previously. Additionally, because this is a cross-
sectional analysis, there is a significant possibility for endogeneity among the
independent variables. This problem arises when the specified model contains an omitted
variable that, because of its omission, is a part of the error term. If the omitted variable is
correlated with any of the independent predictor variables, the estimates produced would

141
be biased and inconsistent 115. This is especially problematic in the second research
question where expectations for example could influence individual HCAHPS
composites and Global HCAHPS scores.
Other sources of bias could be related to unmeasured confounders, such as cultural
differences and other factors affecting patients’ perceptions of care. These confounders
can influence the relationships between process of care measures or individual HCAHPS
composites towards patients definitely recommending hospital. It is quite possible that
perception of quality of care also influences the way patients evaluate their responses
within all quality measures for stroke, VTE, MI, CHF, Pneumonia or SCIP. Some portion
of the differences observed between for-profit hospitals and not-for profit hospitals for
example may also reflect confounding; the patient population seen at for-profit hospitals
might differ in important ways, including expectations, from the population seen at not-
for profit hospitals6.
Major data collection was done with survey instruments, leading to the possibility that
respondents differ in some important ways than non-respondents. Satisfaction surveys are
plagued with low response rate often less than 50%. Demographics, utilization, patterns,
and health status differ between respondents and non-respondents 8. Since less satisfied
patients are also less likely to respond, and more satisfied patients are more likely to
respond caution must be taken when interpreting the results of studies with satisfaction
rate below 80%. 48,116. Response bias may also significantly impact the results of patient
satisfaction surveys, leading to overestimation of the level of satisfaction in the patient

142
population overall 117.All of the data used in this study comes from secondary databases,
which also suffer from similar other limitations. Weaknesses are inherent to the cross-
sectional design. In that setting, even if associations are found, there are limitation in
establishing temporal relationships between predictors and outcome 118.
The limitations of the performance measures used in the analysis are well known,
including concerns about the quality of the input data and the adequacy of (or lack of)
risk adjustment 20. Adherence to process measures are self-reported by hospitals and not
subjected to independent external validation; some have voiced concern over whether
hospitals might be manipulating their results to enhance their apparent quality 15, 90. The
HQA program only examines process measures across a few conditions, and although
these conditions are common and a source of major morbidity and mortality, they make
up only 15 percent of hospital admissions. In addition, the ability to fully account for
differences in underlying risk among patients might be limited 89,119. Process measures
are not a definitive criterion standard for quality of care. Some studies suggested that
some of these measures (SCIP) may not be a total surrogate marker of quality and have
shown that they do not correlate with patient outcomes 22,120.
The present study reports findings from hospitals in the West South Central Region that
may not be representative to generalize to other hospitals. The analysis was only limited
to 1 year of data for all process of care measures, but only for 6 months of data for VTE
and stroke measures (newest measures reported). Although it was a cross section study,

143
structure data were from previous year (data was only available for that period, and it is
presumed that no major changes in hospital characteristics have occurred in a year
period). Our data represent a snapshot of patients’ experiences, and it will be critical to
understand the ways in which these scores change over time and the factors that underlie
their improvement 6.

144
CHAPTER EIGHT
CLINICAL IMPLICATIONS
Significant implications can be made from this study. They include that the associated
process of care variables with global patient satisfaction have been shown to be of most
relevance towards improving outcomes (mortality and readmissions), except in SCIP
where these strong associations are of importance to prevent surgical infections. For
stroke and AMI, the strongest associations to global patient satisfaction occur with
medications given on discharge. In research question 2 looking into the association of
HCAHPS composites with global patient satisfaction within process measures for stroke,
VTE, MI, CHF, pneumonia and SCIP, pain control is most important determinant of
patient satisfaction in larger hospitals among all these process measures. In small
hospitals with beds<100, nurse communication is the most important determinant of
global patient satisfaction in CHF, pneumonia and SCIP. The relationships between
Medicare volume, Medicaid volume, RN staffing and ICU bed capacity (reflecting care
intensity) with global patient satisfaction seem to dissipate in large hospitals (beds>200)
145
POLICY IMPLICATIONS
This study also has important policy implications. These include that in stroke and AMI,
focusing on discharge medications (DC anti-thrombotics and aspirin on discharge) could
be of primary importance towards improving patient satisfaction. In heart failure,
concentrating on assessment of LV function metric can ensure improved global patient
satisfaction. In pneumonia, cultures before antibiotics metric would be of core emphasis
towards improving satisfaction. In SCIP, in the outpatient setting, antibiotics
administration within one hour of surgery seems to be fundamental for global patient
satisfaction. Discontinuation of urine catheter is the most important variable in large
hospitals to ensure patient satisfaction. Giving the right antibiotics and discontinuation of
antibiotics within one hour of surgery are more important in medium sized hospitals
(beds100-200) and small hospitals (beds<100) respectively. Focusing on pain control
likely has the strongest impact towards satisfaction in larger hospitals (>100 beds). In
small hospitals with beds <100, focusing on nurse communication likely has the strongest
influence towards satisfaction within SCIP, pneumonia and CHF.
FUTURE RESEARCH
The relationship of nurse communication and pain control with global satisfaction in
smaller and larger beds hospitals, and the associations of structure factors
(Medicare/Medicaid/ICU/beds/nursing) with satisfaction in smaller beds and
disappearance of these links in >200 beds is intriguing. These are remarkable findings

146
especially since the smaller hospitals in our study tend to be more rural, with larger
Medicare population, and less ICU bed capacity. More research needs to be done to
identify other unique characteristics of the smaller hospitals compared to larger hospitals
in order to understand the differences in relationships between process of care measures
and patient satisfaction. It is possible that a saturation point of nurse staffing, Medicare
volume or ICU bed capacity has been reached at a certain level within hospital size range
of 100-200 beds, beyond which the impact of these variables is not of a significant
magnitude with regard to patient satisfaction. Determining this point and associated
factors would be a great value to the literature.
Perception of pain control seems of greater importance than pain intensity control, and
pain control appears to be of higher significance towards global patient satisfaction in
larger hospitals. Moreover, perception of quality of care could also influence the way
patients evaluate their responses within all quality measures for stroke, VTE, MI, CHF,
pneumonia or SCIP. As a result, it will be of great interest in future studies to look into
the determinants affecting patients’ perception of care within stroke, VTE, AMI, CHF,
pneumonia and SCIP, and patients perception of satisfaction within all HCAHPS
composites, mainly pain control. Patient satisfaction is the result of confirmation or
disconfirmation of patient expectations. These expectations are derived from previous
hospital experiences and they also influence perceptions of current experience 96. It is
therefore important in future studies to understand drivers behind previous and current
patient experiences and their role towards expectations and perception of care.

147
Determining the role of additional unmeasured confounders such as socio-cultural factors
within this framework will be a great addition to the literature.
More research including prospective studies is needed to compare each individual
process measure within each quality metric (stroke/VTE/pneumonia/CHF/MI/SCIP) and
its association with other outcomes, especially in view of the strong relationships
between outcome measures and patient satisfaction. These investigations will expand our
understanding of the major drivers behind stronger and weaker relationships within each
process care category.
Since a new HCAHPS composite related to care transition has been introduced recently
(Patients who understood their care when they left the hospital), it will be of great interest
to study the effect of this composite towards global patient satisfaction within all process
measures for stroke, VTE, MI, CHF, pneumonia and SCIP. Lastly, since our study was
limited to hospitals in South Central region. Research to include all hospitals in the US
will be helpful to generalize the findings
CONCLUSION
This study provides a unique opportunity to analyze the relationships between each
individual hospital process of care measure for acute MI, heart failure (HF), pneumonia
(PN), SCIP (surgical care improvement project), stroke (SK) ,VTE , and the global
patient satisfaction HCAHPS score( definitely recommend hospital) using Generalized
Linear Model regression analysis within the Donabedian framework. This study also

148
incorporates other HCAHPS composite components into quality elements to determine
relationship with global satisfaction with care.
We expected to find significant associations between all individual process measures and
percent of patients definitely recommending hospital. Instead, only few significant
measures were identified within different process of care scores. Although some of these
measures could be relevant for policy recommendations (discharge meds for Stroke/AMI,
LV function for HF, cultures before antibiotics for pneumonia and infection prevention
measures for SCIP), it is prudent to note that more needs to be done to understand the
drivers behind the strengths of the relationships of these measures with global patient
satisfaction, including their associations with other outcomes such as readmission,
mortality of infection. More also needs to be done to determine the generalizability of our
findings to other US hospital.
When analyzing the impact of individual HCAHPS process measures within each quality
metric, almost all HCAHPS composites were significant in determining percent of
patients definitely recommending hospital. However, pain control seems to be the
dominant determinant for beds>100. More needs to be done to understand influencers of
pain perception and outcomes with patient satisfaction.
It is very interesting to note the variability of the strengths of process and structure
measures relationships with patient satisfaction within different bed sizes. Larger
hospitals in our data have more care intensity and they also have higher mean percent
149
scores on process measures .The relationship with nurse supply with satisfaction seems to
disappear with large hospitals (beds >200). It is possible that a saturation point has been
reached at this level beyond which the impact of nursing is not of a significant magnitude
towards satisfaction. Same situation occurs in research question 2, where in larger
hospitals the dominance of nurse communication impact on global satisfaction yields to
pain control in CHF, pneumonia and SCIP.
Our study was unique in analyzing stroke and VTE hospital compare measures with
satisfaction. In addition, our study was distinctive in stratifying relationships among
different bed sizes, and in measuring the relationships of each HCAHPS composite
within each hospital compares process with global satisfaction.
More investigations to include all US hospitals need to be undertaken to understand the
various factors and determinants of process and structure measures within different
hospital bed sizes and their relationships with outcomes including patient satisfaction.
Towards this end, policy recommendations will be more valid towards improving
satisfaction with care.

150
REFERENCES
1. Kaiser Family Foundation. Assessing the effects of the economy on the recent
slowdown in health spending. http://kff.org/health-costs/issue-brief/assessing-the-effects-
of-the-economy-on-the-recent-slowdown-in-health-spending-2/. Updated 2013. Accessed
12/27, 2013.
2. Vittorio Maio, Neil I. Goldfarb, Chureen Carter, and David B. Nash. Value-based
purchasing:A review of the litterature.
http://www.commonwealthfund.org/usr_doc/maio_valuebased_636.pdf. Updated 2003.
Accessed September 29, 2011.
3. Center of Medicare and Medicaid Services. Medicare program;hospital inpatient value-
based purchasing program. Federal Register. 2011;76(88):26490-26547.
http://www.gpo.gov/fdsys/pkg/FR-2011-05-06/pdf/2011-10568.pdf.
4. Centers for Medicare and Medicaid Services (CMS), HHS. Medicare program; hospital
inpatient prospective payment systems for acute care hospitals and the long-term care
hospital prospective payment system and fiscal year 2014 rates; quality reporting
requirements for specific providers; hospital conditions of participation; payment policies
related to patient status. Final rules. Fed Regist. 2013;78(160):50495-51040.
5. Blumenthal D, Jena AB. Hospital value-based purchasing. J Hosp Med. 2013;8(5):271-
277.
6. Jha AK, Orav EJ, Zheng J, Epstein AM. Patients' perception of hospital care in the
united states. N Engl J Med. 2008;359(18):1921-1931.

151
7. Isaac T, Zaslavsky AM, Cleary PD, Landon BE. The relationship between patients'
perception of care and measures of hospital quality and safety. Health Serv Res.
2010;45(4):1024-1040.
8. Sitzia J, Wood N. Response rate in patient satisfaction research: An analysis of 210
published studies. Int J Qual Health Care. 1998;10(4):311-317.
9. Crow R, Gage H, Hampson S, et al. The measurement of satisfaction with healthcare:
Implications for practice from a systematic review of the literature. Health Technol
Assess. 2002;6(32):1-244.
10. Lee DS, Tu JV, Chong A, Alter DA. Patient satisfaction and its relationship with
quality and outcomes of care after acute myocardial infarction. Circulation.
2008;118(19):1938-1945.
11. Olson DP, Windish DM. Communication discrepancies between physicians and
hospitalized patients. Arch Intern Med. 2010;170(15):1302-1307.
12. Clark PA, Leddy K, Drain M, Kaldenberg D. State nursing shortages and patient
satisfaction: More RNs--better patient experiences. J Nurs Care Qual. 2007;22(2):119-
27; quiz 128-9.
13. Kutney-Lee A, McHugh MD, Sloane DM, et al. Nursing: A key to patient
satisfaction. Health Aff (Millwood). 2009;28(4):w669-77.
14. Glickman SW, Boulding W, Manary M, et al. Patient satisfaction and its relationship
with clinical quality and inpatient mortality in acute myocardial infarction. Circ
Cardiovasc Qual Outcomes. 2010;3(2):188-195.
15. Girotra S, Cram P, Popescu I. Patient satisfaction at america's lowest performing
hospitals. Circ Cardiovasc Qual Outcomes. 2012;5(3):365-372.

152
16. Boulding W, Glickman SW, Manary MP, Schulman KA, Staelin R. Relationship
between patient satisfaction with inpatient care and hospital readmission within 30 days-
page 2. Am J Manag Care. 2011;17(1):41-48.
17. Donabedian A. Quality assurance in our health care system. Qual Assur Util Rev.
1986;1(1):6-12.
18. Donabedian A. The quality of care. how can it be assessed? JAMA.
1988;260(12):1743-1748.
19. Wennberg JE, Bronner K, Skinner JS, Fisher ES, Goodman DC. Inpatient care
intensity and patients' ratings of their hospital experiences. Health Aff (Millwood).
2009;28(1):103-112.
20. Shwartz M, Cohen AB, Restuccia JD, et al. How well can we identify the high-
performing hospital? Med Care Res Rev. 2011;68(3):290-310.
21. Gesell SB, Clark PA, Mylod DE, et al. Hospital-level correlation between clinical and
service quality performance for heart failure treatment. J Healthc Qual. 2005;27(6):33-
44.
22. Lyu H, Wick EC, Housman M, Freischlag JA, Makary MA. Patient satisfaction as a
possible indicator of quality surgical care. JAMA Surg. 2013;148(4):362-367.
23. Lee JS, Primack BA, Mor MK, et al. Processes of care and outcomes for community-
acquired pneumonia. Am J Med. 2011;124(12):1175.e9-1175.17.
24. Kaiser Family Foundation. How much does the U.S. spend on health and how has it
changed? http://kaiserfamilyfoundation.files.wordpress.com/2013/01/7670-03.pdf.
Updated 2013. Accessed 02/11, 2014.

153
25. Grol R. Improving the quality of medical care: Building bridges among professional
pride, payer profit, and patient satisfaction. JAMA. 2001;286(20):2578-2585.
26. Centers for Medicare & Medicaid Services (CMS). Hospital value-based purchasing.
http://www.qualitynet.org/dcs/ContentServer?c=Page&pagename=QnetPublic%2FPage
%2FQnetTier3&cid=1228772479353. Updated 2013. Accessed 12/27, 2013.
27. Centers for Medicare & Medicaid Services (CMS). Hospital inpatient quality
reporting program.
https://www.qualitynet.org/dcs/ContentServer?c=Page&pagename=QnetPublic%2FPage
%2FQnetTier2&cid=1138115987129. Updated 2013. Accessed 12/27, 2013.
28. Centers for Medicare and Medicaid Services. Hospital consumer assessment of
healthcare providers and systems. http://www.hcahpsonline.org/home.aspx Web site. .
Updated 2014. Accessed 04/16, 2014.
29. Davidson G, Moscovice I, Remus D. Hospital size, uncertainty, and pay-for-
performance. Health Care Financ Rev. 2007;29(1):45-57.
30. Donabedian A. Methods for deriving criteria for assessing the quality of medical care.
Med Care Rev. 1980;37(7):653-698.
31. Chang JT, Hays RD, Shekelle PG, et al. Patients' global ratings of their health care
are not associated with the technical quality of their care. Ann Intern Med.
2006;144(9):665-672.
32. Center of Medicare and Medicaid Services.
National health expenditures; aggregate and per capita amounts, annual percent change
and percent distribution: Selected calendar years 1960-2012. National Health
Expenditures; Aggregate and Per Capita Amounts, Annual Percent Change and Percent

154
Distribution: Selected Calendar Years 1960-2012 Web site.
https://www.cms.gov/Research-Statistics-Data-and-Systems/Statistics-Trends-and-
Reports/NationalHealthExpendData/Downloads/tables.pdf. Published 1/2014. Updated
2014. Accessed 04/27/, 2014.
33. Centers for Medicare & Medicaid Services (CMS). National health expenditures data.
National Health Expenditures Data Web site. https://www.cms.gov/Research-Statistics-
Data-and-Systems/Statistics-Trends-and-
Reports/NationalHealthExpendData/NationalHealthAccountsProjected.html. Published
1/14. Updated 2014. Accessed 04/28, 2014.
34. Kaiseredu.org. US health care costs. http://www.kaiseredu.org/issue-modules/us-
health-care-costs/background-brief.aspx#footnote2. Updated 2012. Accessed 10/18/2012,
2012.
35. Centers for Medicare & Medicaid Services (CMS). Hospital inpatient quality
reporting program. http://www.cms.gov/Medicare/Quality-Initiatives-Patient-
Assessment-Instruments/HospitalQualityInits/HospitalRHQDAPU.html. Updated 2013.
Accessed 12/27, 2013.
36. Kajander J. Ensuring health care quality: A purchaser's perspective--an employer.
Clin Ther. 1997;19(6):1555-1563.
37. Agency for Healthcare Research and Quality. Evaluating the impact of value-based
purchasing. http://www.ahrq.gov/qual/valuebased/evalvbp1.htm#whatisvbp. Updated
2002. Accessed October 1, 2011.
38. Bodenheimer T, Sullivan K. How large employers are shaping the health care
marketplace. second of two parts. N Engl J Med. 1998;338(15):1084-1087.

155
39. Joynt KE, Le ST, Orav EJ, Jha AK. Compensation of chief executive officers at
nonprofit US hospitals. JAMA Intern Med. 2014;174(1):61-67.
40. Elliott MN, Lehrman WG, Goldstein E, Hambarsoomian K, Beckett MK, Giordano
LA. Do hospitals rank differently on HCAHPS for different patient subgroups? Med Care
Res Rev. 2010;67(1):56-73.
41. Kahn KL, Pearson ML, Harrison ER, et al. Health care for black and poor
hospitalized medicare patients. JAMA. 1994;271(15):1169-1174.
42. Keller S, O'Malley AJ, Hays RD, et al. Methods used to streamline the CAHPS
hospital survey. Health Serv Res. 2005;40(6 Pt 2):2057-2077.
43. O'Malley AJ, Zaslavsky AM, Elliott MN, Zaborski L, Cleary PD. Case-mix
adjustment of the CAHPS hospital survey. Health Serv Res. 2005;40(6 Pt 2):2162-2181.
44. Wilson IB, Landon BE, Marsden PV, et al. Correlations among measures of quality in
HIV care in the united states: Cross sectional study. BMJ. 2007;335(7629):1085.
45. Pascoe GC. Patient satisfaction in primary health care: A literature review and
analysis. Eval Program Plann. 1983;6(3-4):185-210.
46. Linder-Pelz S. Social psychological determinants of patient satisfaction: A test of five
hypothesis. Soc Sci Med. 1982;16(5):583-589.
47. Brennan PF. Patient satisfaction and normative decision theory. J Am Med Inform
Assoc. 1995;2(4):250-259.
48. Kane R, Radosevich D. Satisfaction with care. In: Jones and Bartlett Learning (Ed.),
ed. Conducting health outcomes research. 1st ed. Sudbury,MA: Michael Brown.;
2011:160-197.
156
49. Bond S, Thomas LH. Measuring patients' satisfaction with nursing care. J Adv Nurs.
1992;17(1):52-63.
50. Oliver R. Cognitive,affective, and attribute bases of the satisfaction response. . The
Journal of Consumer Research. 1993;20(3):418-430.
51. Fitzpatrick R, Hopkins A. Problems in the conceptual framework of patient
satisfaction research: An empirical exploration. Sociol Health Illn. 1983;5(3):297-311.
52. Oliver RL, DeSarbo WS. Response determinants in satisfaction judgments. Journal of
consumer research. 1988:495-507.
53. Blalock SJ, deVellis BM, deVellis RF, Sauter SH. Self-evaluation processes and
adjustment to rheumatoid arthritis. Arthritis Rheum. 1988;31(10):1245-1251.
54. Hudak PL, Hogg-Johnson S, Bombardier C, McKeever PD, Wright JG. Testing a new
theory of patient satisfaction with treatment outcome. Med Care. 2004;42(8):726-739.
55. Alford BL. Affect, attribution, and disconfirmation: Their impact on health care
services evaluation. Health Mark Q. 1998;15(4):55-74.
56. Ullman R, Hill JW, Scheye EC, Spoeri RK. Satisfaction and choice: A view from the
plans. Health Aff (Millwood). 1997;16(3):209-217.
57. Williams B, Coyle J, Healy D. The meaning of patient satisfaction: An explanation of
high reported levels. Soc Sci Med. 1998;47(9):1351-1359.
58. Tucker JL. The moderators of patient satisfaction. J Manag Med. 2002;16(1):48-66.
59. Haslam SA, McGarty C, Oakes PJ, Turner JC. Social comparative context and
illusory correlation: Testing between ingroup bias and social identity models of
stereotype formation. Aust J Psychol. 1993;45(2):97-101.

157
60. Platow MJ, Harley K, Hunter JA, Hanning P, Shave R, O'Connell A. Interpreting
in‐group‐favouring allocations in the minimal group paradigm. British Journal of
Social Psychology. 2011;36(1):107-117.
61. Sitzia J, Wood N. Patient satisfaction: A review of issues and concepts. Soc Sci Med.
1997;45(12):1829-1843.
62. LeVois M, Nguyen TD, Attkisson CC. Artifact in client satisfaction assessment:
Experience in community mental health settings. Eval Program Plann. 1981;4(2):139-
150.
63. Keating NL, Green DC, Kao AC, Gazmararian JA, Wu VY, Cleary PD. How are
patients' specific ambulatory care experiences related to trust, satisfaction, and
considering changing physicians? J Gen Intern Med. 2002;17(1):29-39.
64. Williams B. Patient satisfaction: A valid concept? Soc Sci Med. 1994;38(4):509-516.
65. Fox JG, Storms DM. A different approach to sociodemographic predictors of
satisfaction with health care. Soc Sci Med A. 1981;15(5):557-564.
66. Lawler EE. Pay and organizational effectiveness: A psychological view. In: McGraw-
Hill New York; 1971:206.
67. Rubin HR. Can patients evaluate the quality of hospital care? Med Care Rev.
1990;47(3):267-326.
68. Clark, P. A., Drain, M., & Malone, M. P. Return on investment in satisfaction
measurement and improvement.
http://www.pressganey.com.au/snapshots/Improving%20Patient%20Satisfaction%20-
%20Quantifying%20the%20Return%20on%20Investment.pdf. Updated 2004. Accessed
12/15, 2013.

158
69. Doering ER. Factors influencing inpatient satisfaction with care. QRB Qual Rev Bull.
1983;9(10):291-299.
70. Young GJ, Meterko M, Desai KR. Patient satisfaction with hospital care: Effects of
demographic and institutional characteristics. Med Care. 2000;38(3):325-334.
71. Carmel S. Satisfaction with hospitalization: A comparative analysis of three types of
services. Soc Sci Med. 1985;21(11):1243-1249.
72. DeOreo PB. Hemodialysis patient-assessed functional health status predicts continued
survival, hospitalization, and dialysis-attendance compliance. Am J Kidney Dis.
1997;30(2):204-212.
73. Brett O’Hara and Kyle Caswell. Health status,health insurance,and medical service
utilization : 2010. Health Status,Health Insurance,and Medical Service Utilization : 2010
Web site. https://www.census.gov/prod/2012pubs/p70-133.pdf. Published 2013. Updated
2013. Accessed 4/30, 2014.
74. Hekkert KD, Cihangir S, Kleefstra SM, van den Berg B, Kool RB. Patient satisfaction
revisited: A multilevel approach. Soc Sci Med. 2009;69(1):68-75.
75. O'Malley AJ, Zaslavsky AM, Elliott MN, Zaborski L, Cleary PD. Case-mix
adjustment of the CAHPS® hospital survey. Health Serv Res. 2005;40(6p2):2162-2181.
76. Rahmqvist M, Bara AC. Patient characteristics and quality dimensions related to
patient satisfaction. Int J Qual Health Care. 2010;22(2):86-92.
77. Findik UY, Unsar S, Sut N. Patient satisfaction with nursing care and its relationship
with patient characteristics. Nurs Health Sci. 2010;12(2):162-169.

159
78. Owolabi O, Zhang Z, Wei X, et al. Patients' socioeconomic status and their
evaluations of primary care in hong kong. BMC Health Serv Res. 2013;13:487-6963-13-
487.
79. Ware JE,Jr, Snyder MK, Wright WR, Davies AR. Defining and measuring patient
satisfaction with medical care. Eval Program Plann. 1983;6(3-4):247-263.
80. Blanden AR, Rohr RE. Cognitive interview techniques reveal specific behaviors and
issues that could affect patient satisfaction relative to hospitalists. J Hosp Med.
2009;4(9):E1-6.
81. Kerr EA, Hays RD, Lee ML, Siu AL. Does dissatisfaction with access to specialists
affect the desire to leave a managed care plan? Med Care Res Rev. 1998;55(1):59-77.
82. Nyweide DJ, Anthony DL, Chang C, Goodman D. Seniors’ perceptions of health care
not closely associated with physician supply. Health Affairs. 2011;30(2):219-227.
83. Nelson EC, Rubin HR, Hays RD, Meterko M. Patient judgments of hospital quality.
response to questionnaire. Med Care. 1990;28(9 Suppl):S18-22.
84. Baicker K, Chandra A. Medicare spending, the physician workforce, and
beneficiaries' quality of care. Health Aff (Millwood). 2004;Suppl Web Exclusives:W4-
184-97.
85. Wennberg JE, Fisher ES, Baker L, Sharp SM, Bronner KK. Evaluating the efficiency
of california providers in caring for patients with chronic illnesses. Health Aff
(Millwood). 2005;Suppl Web Exclusives:W5-526-43.
86. Wennberg JE, Bronner K, Skinner JS, Fisher ES, Goodman DC. Inpatient care
intensity and patients' ratings of their hospital experiences. Health Aff (Millwood).
2009;28(1):103-112.

160
87. Stein SM, Day M, Karia R, Hutzler L, Bosco JA,3rd. Patients' perceptions of care are
associated with quality of hospital care: A survey of 4605 hospitals. Am J Med Qual.
2014.
88. Young GJ, Meterko M, Desai KR. Patient satisfaction with hospital care: Effects of
demographic and institutional characteristics. Med Care. 2000;38(3):325-334.
89. Lehrman WG, Elliott MN, Goldstein E, Beckett MK, Klein DJ, Giordano LA.
Characteristics of hospitals demonstrating superior performance in patient experience and
clinical process measures of care. Med Care Res Rev. 2010;67(1):38-55.
90. Popescu I, Werner RM, Vaughan-Sarrazin MS, Cram P. Characteristics and outcomes
of america's lowest-performing hospitals: An analysis of acute myocardial infarction
hospital care in the united states. Circ Cardiovasc Qual Outcomes. 2009;2(3):221-227.
91. Dartmouth Atlas of Health Care. Health care intensity report. Health Care Intensity
Report Web site. http://www.cpt12.org/news/wp-content/uploads/2010/01/Hospital-Care-
Intensity-Report.pdf. Published 2010. Updated 2010. Accessed 04/30, 2014.
92. Kravitz RL. Patients' expectations for medical care: An expanded formulation based
on review of the literature. Med Care Res Rev. 1996;53(1):3-27.
93. Young GJ, Meterko M, Desai KR. Patient satisfaction with hospital care: Effects of
demographic and institutional characteristics. Med Care. 2000;38(3):325-334.
94. Wagner D, Bear M. Patient satisfaction with nursing care: A concept analysis within
a nursing framework. J Adv Nurs. 2009;65(3):692-701.
95. Bostan S, Acuner T, Yilmaz G. Patient (customer) expectations in hospitals. Health
Policy. 2007;82(1):62-70.

161
96. J. Patient satisfaction: The impact of past experience. J Health Care Mark.
1992;12(3).
97. Fleming GV. Hospital structure and consumer satisfaction. Health Serv Res.
1981;16(1):43-63.
98. Schneider EC, Zaslavsky AM, Landon BE, Lied TR, Sheingold S, Cleary PD.
National quality monitoring of medicare health plans: The relationship between enrollees'
reports and the quality of clinical care. Med Care. 2001;39(12):1313-1325.
99. Rao M, Clarke A, Sanderson C, Hammersley R. Patients' own assessments of quality
of primary care compared with objective records based measures of technical quality of
care: Cross sectional study. BMJ. 2006;333(7557):19.
100. Gandhi TK, Francis EC, Puopolo AL, Burstin HR, Haas JS, Brennan TA.
Inconsistent report cards: Assessing the comparability of various measures of the quality
of ambulatory care. Med Care. 2002;40(2):155-165.
101. Wagner EH, Austin BT, Davis C, Hindmarsh M, Schaefer J, Bonomi A. Improving
chronic illness care: Translating evidence into action. Health Aff (Millwood).
2001;20(6):64-78.
102. Baker LC, Fisher ES, Wennberg JE. Variations in hospital resource use for medicare
and privately insured populations in california. Health Aff (Millwood). 2008;27(2):w123-
34.
103. Landon BE, Normand SL, Lessler A, et al. Quality of care for the treatment of acute
medical conditions in US hospitals. Arch Intern Med. 2006;166(22):2511-2517.
104. Peterson ED, Delong ER, Masoudi FA, et al. ACCF/AHA 2010 position statement
on composite measures for healthcare performance assessment: A report of the american

162
college of cardiology Foundation/American heart association task force on performance
measures (writing committee to develop a position statement on composite measures).
Circulation. 2010;121(15):1780-1791.
105. Donabedian A. Evaluating the quality of medical care. Milbank Mem Fund Q.
1966;44(3):Suppl:166-206.
106. American Hospital Association. The opportunities and challenges for rural hospitals
in an era of heatlh reform. http://www.aha.org/research/policy/2011.shtml. Published
2011. Updated 2011. Accessed 05/3, 2014.
107. United States Department of Agriculture. Employment and education. Rural
Economy and Population Web site. http://www.ers.usda.gov/topics/rural-economy-
population/employment-education.aspx#.U2ZcvK1dX-B. Published 2014. Updated 2014.
Accessed 05/2, 2014.
108. Centers for Medicare & Medicaid Services (CMS). Spending per hospital patient
with medicare .also known as medicare spending per beneficiary (MSPB) . Spending
per Hospital Patient with Medicare .Also Known as Medicare Spending per Beneficiary
(MSPB) Web site. https://www.cms.gov/Medicare/Quality-Initiatives-Patient-
Assessment-Instruments/hospital-value-based-purchasing/Downloads/MSPBDetail-
Dec2012.pdf. Published 2012. Updated 2012. Accessed 05/2, 2014.
109. sagepub.com. Dealing with missing or incomplete data.
http://www.sagepub.com/upm-data/45664_6.pdf. Accessed 01/24, 2014.
110. UCLA Statistics Consutling Group. Multivariate regression analysis.
http://www.ats.ucla.edu/stat/stata/dae/mvreg.htm. Updated 2014. Accessed 2/12, 2014.

163
111. UCLA. Regression with STATA
regression diagnostics.
http://www.ats.ucla.edu/stat/stata/webbooks/reg/chapter2/statareg2.htm. Updated 2014.
Accessed 01/13, 2014.
112. Centers for Disease Control and Prevention. CMS inpatient hospital quality
reporting program. http://www.cdc.gov/nhsn/faqs/FAQ_CMS_HAI.html. Updated 2013.
Accessed 01/2014, 2014.
113. Wooldridge J. Multiple regression analysis with qualitative information. In:
Calhoon, Worls,Bofinger, Conway, ed. Introductory econometrics,A modern approach.
Fourth ed. USA: South-Western Cengage Learning; 2009:253-254.
114. Cameron A, Trivedi P. Selection model. In: Cameron A, Trivedi P, eds.
Microeconometrics using stata. Revised ed. College station,Texas. USA: Stata Press;
2010:556-562.
115. Wooldridge J. Instrumental variables estimation and two stage least square. In:
Calhoon, Worls,Bofinger, Conway, ed. Introductory econometrics,A modern approach.
Fourth ed. USA: South-Western Cengage Learning; 2009:506-545.
116. Mazor KM, Clauser BE, Field T, Yood RA, Gurwitz JH. A demonstration of the
impact of response bias on the results of patient satisfaction surveys. Health Serv Res.
2002;37(5):1403-1417.
117. Mazor KM, Clauser BE, Field T, Yood RA, Gurwitz JH. A demonstration of the
impact of response bias on the results of patient satisfaction surveys. Health Serv Res.
2002;37(5):1403-1417.

164
118. Gordis L. Case-control and cross-sectional studies. In: Schmitt W, Sinclair J,
Stermel M, eds. Epidemiology. Third Edition ed. Philadelphia, PA,USA: Elsevier
Sanders; 2004:174-175.
119. Jha AK, Orav EJ, Li Z, Epstein AM. The inverse relationship between mortality
rates and performance in the hospital quality alliance measures. Health Aff (Millwood).
2007;26(4):1104-1110.
120. Stulberg JJ, Delaney CP, Neuhauser DV, Aron DC, Fu P, Koroukian SM.
Adherence to surgical care improvement project measures and the association with
postoperative infections. JAMA. 2010;303(24):2479-2485.
121. Press Ganey. Frequently asked questions about HCAHPS. PressGaney Web site.
http://www.pressganey.com/researchResources/governmentInitiatives/HCAHPS/faqs.asp
x#q5. Updated 2014. Accessed 05/6, 2014.
122. sagepub.com.Dealing with missing or incomplete data. Retrieved 01/24, 2014, from
http://www.sagepub.com/upm-data/45664_6.pdf
123.Higgins, G. (2011). General principles for dealing with missing data. Retrieved
02/003, 2014, from
http://handbook.cochrane.org/index.htm#chapter_16/16_1_2_general_principl
es_for_dealing_with_missing_data.htm
124. Institute for Digital Research and Education. UCLA. How does one do regression
when the dependent variable is a proportion?
http://www.ats.ucla.edu/stat/stata/faq/proportion.htm. Updated 2014. Accessed 09/15,
2014.

165
125. Tsai TC, Orav EJ, Jha AK. Patient satisfaction and quality of surgical care in US
hospitals. Ann Surg. 2014.
126. Reker DM, Duncan PW, Horner RD, et al. Postacute stroke guideline compliance is
associated with greater patient satisfaction. Arch Phys Med Rehabil. 2002;83(6):750-756.
127. Johnbull EA, Lau BD, Schneider EB, Streiff MB, Haut ER. No association between
hospital-reported perioperative venous thromboembolism prophylaxis and outcome rates
in publicly reported data. JAMA Surg. 2014;149(4):400-401.
128. Bradley EH, Herrin J, Elbel B, et al. Hospital quality for acute myocardial
infarction: Correlation among process measures and relationship with short-term
mortality. JAMA. 2006;296(1):72-78.
129. Shahian DM, Meyer GS, Mort E, et al. Association of national hospital quality
measure adherence with long-term mortality and readmissions. BMJ Qual Saf.
2012;21(4):325-336.
130. Patterson ME, Hernandez AF, Hammill BG, et al. Process of care performance
measures and long-term outcomes in patients hospitalized with heart failure. Med Care.
2010;48(3):210-216.
131. Werner RM, Bradlow ET. Relationship between medicare's hospital compare
performance measures and mortality rates. JAMA. 2006;296(22):2694-2702.
132. Ingraham AM, Cohen ME, Bilimoria KY, et al. Association of surgical care
improvement project infection-related process measure compliance with risk-adjusted
outcomes: Implications for quality measurement. J Am Coll Surg. 2010;211(6):705-714.

166
133. Wang Z, Chen F, Ward M, Bhattacharyya T. Compliance with surgical care
improvement project measures and hospital-associated infections following hip
arthroplasty. J Bone Joint Surg Am. 2012;94(15):1359-1366.
134. Awad SS. Adherence to surgical care improvement project measures and post-
operative surgical site infections. Surg Infect (Larchmt). 2012;13(4):234-237.
135. Kennedy GD, Tevis SE, Kent KC. Is there a relationship between patient
satisfaction and favorable outcomes? Ann Surg. 2014;260(4):592-600.
136. Elliott MN, Kanouse DE, Edwards CA, Hilborne LH. Components of care vary in
importance for overall patient-reported experience by type of hospitalization. Med Care.
2009;47(8):842-849.
137. Otani K, Herrmann PA, Kurz RS. Improving patient satisfaction in hospital care
settings. Health Serv Manage Res. 2011;24(4):163-169.
138. McNaughton H, McPherson K, Taylor W, Weatherall M. Relationship between
process and outcome in stroke care. Stroke. 2003;34(3):713-717.
139. Bravata DM, Wells CK, Lo AC, et al. Processes of care associated with acute stroke
outcomes. Arch Intern Med. 2010;170(9):804-810.
140. Antithrombotic Trialists' Collaboration. Collaborative meta-analysis of randomised
trials of antiplatelet therapy for prevention of death, myocardial infarction, and stroke in
high risk patients. BMJ. 2002;324(7329):71-86.
141. Demers C, Mody A, Teo KK, McKelvie RS. ACE inhibitors in heart failure: What
more do we need to know? Am J Cardiovasc Drugs. 2005;5(6):351-359.
142. Wolosin R, Ayala L, Fulton BR. Nursing care, inpatient satisfaction, and value-
based purchasing: Vital connections. J Nurs Adm. 2012;42(6):321-325.

167
143. Hanna MN, Gonzalez-Fernandez M, Barrett AD, Williams KA, Pronovost P. Does
patient perception of pain control affect patient satisfaction across surgical units in a
tertiary teaching hospital? Am J Med Qual. 2012;27(5):411-416.
144. Phillips S, Gift M, Gelot S, Duong M, Tapp H. Assessing the relationship between
the level of pain control and patient satisfaction. J Pain Res. 2013;6:683-689.
145. Shea RA, Brooks JA, Dayhoff NE, Keck J. Pain intensity and postoperative
pulmonary complications among the elderly after abdominal surgery. Heart & Lung:
The Journal of Acute and Critical Care. 2002;31(6):440-449.
146. Masci E, Toti G, Mariani A, et al. Complications of diagnostic and therapeutic
ERCP: A prospective multicenter study. Am J Gastroenterol. 2001;96(2):417-423.
147. Sigmundsson FG, Jonsson B, Stromqvist B. Preoperative pain pattern predicts
surgical outcome more than type of surgery in patients with central spinal stenosis
without concomitant spondylolisthesis: A register study of 9051 patients. Spine (Phila Pa
1976). 2014;39(3):E199-210.
148. Fonarow GC, Abraham WT, Albert NM, et al. Association between performance
measures and clinical outcomes for patients hospitalized with heart failure. JAMA.
2007;297(1):61-70.
149. Meehan TP, Fine MJ, Krumholz HM, et al. Quality of care, process, and outcomes
in elderly patients with pneumonia. JAMA. 1997;278(23):2080-2084.
150. Poisson SN, Josephson SA. Quality measures in stroke. Neurohospitalist.
2011;1(2):71-77.
151. Menaka Pai jD. Prevention of venous thromboembolic disease in medical patients.
www.uptdate.com. Updated 2015.

168
152.Joynt KE, Jha AK. Who has higher readmission rates for heart failure, and why?
implications for efforts to improve care using financial incentives. Circ Cardiovasc Qual
Outcomes. 2011;4(1):53-59.
153.Joynt KE, Harris Y, Orav EJ, Jha AK. Quality of care and patient outcomes in
critical access rural hospitals. JAMA. 2011;306(1):45-52.
154.Jha AK, Orav EJ, Li Z, Epstein AM. The inverse relationship between mortality rates
and performance in the hospital quality alliance measures. Health Aff (Millwood).
2007;26(4):1104-1110.
155. H.CUP. NIS description fo data elements. http://www.hcup-
us.ahrq.gov/db/vars/hosp_bedsize/nisnote.jsp. Published 2008. Updated 2008. Accessed
02/20, 2015.
156. Barro JR, Huckman RS, Kessler DP. The effects of cardiac specialty hospitals on the
cost and quality of medical care. J Health Econ. 2006;25(4):702-721.
157. Greenwald L, Cromwell J, Adamache W, et al. Specialty versus community
hospitals: Referrals, quality, and community benefits. Health Aff (Millwood).
2006;25(1):106-118.
158. Guterman S. Specialty hospitals: A problem or a symptom? Health Aff (Millwood).
2006;25(1):95-105.
159. Fonarow GC, Reeves MJ, Smith EE, et al. Characteristics, performance measures,
and in-hospital outcomes of the first one million stroke and transient ischemic attack
admissions in get with the guidelines-stroke. Circ Cardiovasc Qual Outcomes.
2010;3(3):291-302.

169
160.Qaseem A, Chou R, Humphrey LL, Starkey M, Shekelle P, Clinical Guidelines
Committee of the American College of Physicians. Venous thromboembolism
prophylaxis in hospitalized patients: A clinical practice guideline from the american
college of physicians. Ann Intern Med. 2011;155(9):625-632.
161. Ross CK, Frommelt G, Hazelwood L, Chang RW. The role of expectations in
patient satisfaction with medical care. J Health Care Mark. 1987;7(4):16-26.
162. Parasuraman AZ. SERVQUAL: A multiple-item scale for measuring consumer
perceptions of service quality. J Retail. 1988;64(1):12-40.
APPENDIX A HOSPITAL INPATIENT QUALITY REPORTING MEASURES (IQR)

170

171
Measures Requiring Web-based Hospital Data Entry

172
Measure Information Obtained from Claims-Based Data
Measures Removed from the Hospital IQR Program

173
APPENDIX B Value Based Purchasing Clinical Process of Care Domains
Measure ID*
Measure Description FY 2013
FY 2014
FY 2015
AMI-7a Fibrinolytic Therapy Received Within 30 Minutes of Hospital Arrival
Yes Yes Yes
AMI-8a Primary PCI Received Within 90 Minutes of Hospital Arrival
Yes Yes Yes
HF-1 Discharge Instructions Yes Yes Yes

174
PN-3b Blood Cultures Performed in the Emergency Department Prior to Initial Antibiotic Received in Hospital
Yes Yes Yes
PN-6 Initial Antibiotic Selection for CAP in Immunocompetent Patient
Yes Yes Yes
SCIP-Card-2 Surgery Patients on a Beta Blocker Prior to Arrival That Received a Beta Blocker During the Perioperative Period
Yes Yes Yes
SCIP-Inf-1 Prophylactic Antibiotic Received Within One Hour Prior to Surgical Incision
Yes Yes Yes
SCIP-Inf-2 Prophylactic Antibiotic Selection for Surgical Patients Yes Yes Yes SCIP-Inf-3 Prophylactic Antibiotics Discontinued Within 24 Hours
After Surgery End Time Yes Yes Yes
SCIP-Inf-4 Cardiac Surgery Patients with Controlled 6AM Postoperative Serum Glucose
Yes Yes Yes
SCIP-Inf-9 Postoperative Urinary Catheter Removal on Post Operative Day 1 or 2
No Yes Yes
SCIP-VTE-1 Surgery Patients with Recommended Venous Thromboembolism Prophylaxis Ordered
Yes Yes No
SCIP-VTE-2 Surgery Patients Who Received Appropriate Venous Thromboembolism Prophylaxis Within 24 Hours Prior to Surgery to 24 Hours After Surgery
Yes Yes Yes
* Measure name: AMI = Acute Myocardial Infarction HF =
Heart Failure PN = Pneumonia SCIP = Surgical Care Improvement Project
VBP Efficiency Domains
Measure ID Measure Description FY
2013 FY 2014
FY 2015
MSPB Medicare Spending Per Beneficiary No No Yes
VBP Patient Experience of Care for the Hospital Consumer Assessment of Healthcare Providers and Systems Survey

175
(HCAHPS) Domains.
Measure Description FY 2013 FY 2014 FY 2015 Communication with Nurses Yes Yes Yes Communication with Doctors Yes Yes Yes Responsiveness of Hospital Staff Yes Yes Yes Pain Management Yes Yes Yes Communication about Medicines Yes Yes Yes Cleanliness and Quietness of Hospital Environment Yes Yes Yes Discharge Information Yes Yes Yes Overall Rating of Hospital Yes Yes Yes
VBP Outcome Domains
Measure ID** Measure Description FY 2013
FY 2014
FY 2015
MORT-30-AMI Acute Myocardial Infarction (AMI) 30-Day Mortality Rate
No Yes Yes
MORT-30-HF Heart Failure (HF) 30-Day Mortality Rate No Yes Yes MORT-30 PN Pneumonia (PN) 30-Day Mortality Rate No Yes Yes AHRQ Composite (PSI-90)
Complication/Patient safety for selected indicators (Composite)
No No Yes
HAI Central Line-Associated Blood Stream Infection (CLABSI)
No No Yes
** Measure names: MORT = Outcome Mortality
Measure AHRQ = Agency for Healthcare Research and Quality PSI = Patient Safety Indicators HAI = Healthcare Associated Infection.
APPENDIX C Hospital Compare Measures in the study
Hospital Measures Current Data Collection Period

176
From Through
Survey of patients' experiences (HCAHPS)
Patients who reported that their nurses "Always", “Usually”, or “Sometimes/Never” communicated well
7/1/2012 6/30/2013
Patients who reported that their doctors "Always”, “Usually”, or “Sometimes/Never” communicated well
7/1/2012 6/30/2013
Patients who reported that they "Always”, “Usually”, or “Sometimes/Never” received help as soon as they wanted
7/1/2012 6/30/2013
Patients who reported that their pain was "Always”, “Usually”, or “Sometimes/Never” well controlled
7/1/2012 6/30/2013
Patients who reported that staff "Always”, “Usually”, or “Sometimes/Never” explained about medicines before giving it to them
7/1/2012 6/30/2013
Patients who reported that their room and bathroom were "Always”, “Usually”, or “Sometimes/Never” clean
7/1/2012 6/30/2013
Patients who reported that the area around their room was "Always”, “Usually”, or “Sometimes/Never” quiet at night
4/1/2012 3/31/2013
Patients who reported “Yes” or “No” that they were given information about what to do during their recovery at home
7/1/2012 6/30/2013
Patients who gave their hospital a rating of “9 or 10,” “7 or 8,” or “6 or lower” on a scale from 0 (lowest) to 10 (highest)
7/1/2012 6/30/2013
Patients who reported they would “Definitely,” “Probably” or “Not” recommend the hospital
7/1/2012 6/30/2013
Timely & effective care
Heart attack care

177
Timely heart attack care
Average number of minutes before outpatients with chest pain or possible heart attack who needed specialized care were transferred to another hospital
7/1/2012 6/30/2013
Average number of minutes before outpatients with chest pain or possible heart attack got an ECG
7/1/2012 6/30/2013
Outpatients with chest pain or possible heart attack who got drugs to break up blood clots within 30 minutes of arrival
7/1/2012 6/30/2013
Outpatients with chest pain or possible heart attack who got aspirin within 24 hours of arrival
7/1/2012 6/30/2013
Heart attack patients given fibrinolytic medication within 30 minutes of arrival
7/1/2012 6/30/2013
Heart attack patients given PCI within 90 minutes of arrival
7/1/2012 6/30/2013
Effective heart attack care
Heart attack patients given aspirin at discharge 7/1/2012 6/30/2013
Heart attack patients given a prescription for a statin at discharge
7/1/2012 6/30/2013
Heart failure care
Effective heart failure care

178
Heart failure patients given discharge instructions
7/1/2012 6/30/2013
Heart failure patients given an evaluation of left ventricular systolic (LVS) function
7/1/2012 6/30/2013
Heart failure patients given ACE inhibitor or ARB for left ventricular systolic dysfunction (LVSD)
7/1/2012 6/3102013
Pneumonia care
Effective pneumonia care
Pneumonia patients whose initial emergency room blood culture was performed prior to the administration of the first hospital dose of antibiotics
7/1/2012 6/30/2013
Pneumonia patients given the most appropriate initial antibiotic(s)
7/1/2012 6/30/2013
Surgical care
Timely surgical care
Outpatients having surgery who got an antibiotic at the right time (within one hour before surgery)
7/1/2012 6/30/2013
Surgery patients who were given an antibiotic at the right time (within one hour before surgery) to help prevent infection
7/1/2012 6/30/2013
Surgery patients whose preventive antibiotics were stopped at the right time (within 24 hours after surgery)
7/1/2012 6/30/2013
Patients who got treatment at the right time (within 24 hours before or after their surgery) to help prevent blood clots after certain types of surgery
7/1/2012 6/30/2013
Effective surgical care

179
Outpatients having surgery who got the right kind of antibiotic
7/1/2012 6/30/2013
Surgery patients who were taking heart drugs called beta blockers before coming to the hospital, who were kept on the beta blockers during the period just before and after their surgery
7/1/2012 6/30/2013
Surgery patients who were given the right kind of antibiotic to help prevent infection
7/1/2012 6/30/2013
Heart surgery patients whose blood sugar (blood glucose) is kept under good control in the days right after surgery
7/1/2012 6/30/2013
Surgery patients whose urinary catheters were removed on the first or second day after surgery
7/1/2012 6/30/2013
Patients having surgery who were actively warmed in the operating room or whose body temperature was near normal by the end of surgery
7/1/2012 6/30/2013
Emergency department care
Timely emergency department care
Average time patients spent in the emergency department, before they were admitted to the hospital as an inpatient
7/1/2012 6/30/2013
Average time patients spent in the emergency department, after the doctor decided to admit them as an inpatient before leaving the emergency department for their inpatient room
7/1/2012 6/30/2013
Average time patients spent in the emergency department before being sent home
7/1/2012 6/30/2013
Average time patients spent in the emergency department before they were seen by a healthcare professional
7/1/2012 6/30/2013

180
Average time patients who came to the emergency department with broken bones had to wait before receiving pain medication
7/1/2012 6/30/2013
Percentage of patients who left the emergency department before being seen
1/1/2012 6/30/2012
Percentage of patients who came to the emergency department with stroke symptoms who received brain scan results within 45 minutes of arrival
7/1/2012 6/30/2013
Preventive care
Patients assessed and given influenza 10/1/2012 3/31/2013
vaccination
Patients assessed and given pneumonia vaccination 7/1/2012 6/30/2013
Children's asthma care
Effective children's asthma care
Children who received reliever medication while hospitalized for asthma
7/1/2012 6/30/2013
Children who received systemic corticosteroid medication (oral and IV medication that reduces inflammation and controls symptoms) while hospitalized for asthma
7/1/2012 6/30/2013
Children and their caregivers who received a home management plan of care document while hospitalized for asthma
7/1/2012 6/30/2013
Stroke care
Timely stroke care

181
Ischemic stroke patients who got medicine to break up a blood clot within 3 hours after symptoms started
1/1/2013 6/30/2013
Ischemic stroke patients who received medicine known to prevent complications caused by blood clots within 2 days of arriving at the hospital
1/1/2013 6/30/2013
Ischemic or hemorrhagic stroke patients who received treatment to keep blood clots from forming anywhere in the body within 2 days of arriving at the hospital
1/1/2013 6/30/2013
Effective stroke care
Ischemic stroke patients who received a prescription for medicine known to prevent complications caused by blood clots before discharge
1/1/2013 6/30/2013
Ischemic stroke patients with a type of irregular heartbeat who were given a prescription for a blood thinner at discharge
1/1/2013
6/30/2013
Ischemic stroke patients needing medicine to lower cholesterol, who were given a prescription for this medicine before discharge
1/1/2013 6/30/2013
Ischemic or hemorrhagic stroke patients or caregivers who received written educational materials about stroke care and prevention during the hospital stay
1/1/2013 6/30/2013
Ischemic or hemorrhagic stroke patients who were evaluated for rehabilitation services
1/1/2013 6/30/2013
Blood clot prevention and treatment
Blood clot prevention

182
Patients who got treatment to prevent blood clots on the day of or day after hospital admission or surgery
1/1/2013 6/30/2013
Patients who got treatment to prevent blood clots on the day of or day after being admitted to the intensive care unit (ICU)
1/1/2013 6/30/2013
Patients who developed a blood clot while in the hospital who did not get treatment that could have prevented it
1/1/2013 6/30/2013
Blood clot treatment
Patients with blood clots who got the recommended treatment, which includes using two different blood thinner medicines at the same time
1/1/2013 6/30/2013
Patients with blood clots who were treated with an intravenous blood thinner, and then were checked to determine if the blood thinner was putting the patient at an increased risk of bleeding
1/1/2013 6/30/2013
Patients with blood clots who were discharged on a blood thinner medicine and received written instructions about that medicine
1/1/2013 6/30/2013
Pregnancy and delivery care
Percent of newborns whose deliveries were scheduled too early (1-3 weeks early), when a scheduled delivery was not medically necessary
1/1/2013 6/30/2013
Readmissions, complications and deaths
30-Day outcomes: Readmission and death rates
Rate of readmission for heart attack patients 7/1/2009 6/30/2012
Death rate for heart attack patients 7/1/2009 6/30/2012
Rate of readmission for heart failure patients 7/1/2009 6/30/2012

183
Death rate for heart failure patients 7/1/2009 6/30/2012
Rate of readmission for pneumonia patients 7/1/2009 6/30/2012
Death rate for pneumonia patients 7/1/2009 6/30/2012
Rate of readmission after hip/knee surgery 7/1/2009 6/30/2012
Rate of readmission after discharge from hospital (hospital-wide)
7/1/2011 6/30/2012
Surgical complications
Rate of complications for hip/knee replacement patients 7/1/2009 3/31/2012
Serious complications
7/1/2010
6/30/2012
Deaths among patients with serious treatable complications after surgery
7/1/2010 6/30/2012
Healthcare-associated infections
Central line-associated bloodstream infections (CLABSI) 7/1/2012 6/30/2013
Catheter-associated urinary tract infections (CAUTI) 7/1/2012 6/30/2013
Surgical site infections from colon surgery (SSI: Colon)
7/1/2012
6/30/2013
Surgical site infections from abdominal hysterectomy (SSI: Hysterectomy)
7/1/2012 6/30/2013
Staphylococcus aureus (or MRSA) Blood Infections (Antibiotic-resistant blood infections)
1/1/2013 6/30/2013
Clostridium difficile (or C.diff.) Infections 1/1/2013 6/30/2013
Other Readmission Measure

184
American College of Cardiology percutaneous coronary intervention (PCI) readmission measure
1/1/2010 11/30/2011
Use of Medical Imaging
Outpatients with low back pain who had an MRI without trying recommended treatments first, such as physical therapy
1/1/2011 12/31/2011
Outpatients who had a follow-up mammogram, ultrasound, or MRI of the breast within 45 days after a screening mammogram
1/1/2011 12/31/2011
Outpatient CT scans of the chest that were “combination” (double) scans
1/1/2011 12/31/2011
Outpatient CT scans of the abdomen that were “combination” (double) scans
1/1/2011 12/31/2011
Outpatients who got cardiac imaging stress tests before low-risk outpatient surgery
1/1/2011
12/31/2011
Outpatients with brain CT scans who got a sinus CT scan at the same time
1/1/2011 12/31/2011
Medicare Payment
Spending per hospital patient with Medicare 1/1/2012 12/31/2012
Number of Medicare Patients
Number of Medicare patients treated 10/01/2011 9/30/2012
Structural Measures
Cardiac Surgery Registry 1/1/2012 12/31/2012
Stroke Care Registry 1/1/2012 12/31/2012
Nursing Care Registry 1/1/2012 12/31/2012
Multispecialty Surgical Registry 1/1/2012 12/31/2012
General Surgery Registry
1/1/2012 12/31/2012

185
HIT Measures Able to receive lab results electronically 1/1/2012 6/30/2012 Able to track patients’ lab results, tests, and referrals electronically
1/1/2012 6/30/2012
APPENDIX D Stata output of Heckman selection models used in discussion section

186