Shaping the Future (Future shaping us) A Montfortian Synthesis

Presentation to Investors
Interim report
as of June 30, 2019
Werdohl, July 25, 2019
Grasping the future.
Shaping the future.

Disclaimer
2
Note:
This presentation contains statements concerning the future business performance of the Vossloh Group that are based on
assumptions and estimates from the Company management. If the assumptions that the projections are based on fail to occur,
the actual results of the projected statements may differ substantially. Uncertainties include changes in the political, commercial
and economic climate, the actions of competitors, legislative reforms, the effects of future case law and fluctuations in exchange
rates and interest rates. Vossloh and its Group companies, consultants and representatives assume no responsibility for
possible losses associated with the use of this presentation or its contents. Vossloh assumes no obligation to update the
forecast statements in this presentation.
The information contained in this presentation does not constitute an offer or an invitation to sell or buy Vossloh shares or the
shares of other companies.

Vossloh Group: Grasping the future. Shaping the future.
Strong development of orders received continues in Q2/2019
3
Order situation
remains strong
Disposal process of
Transportation
Operating
performance in the
core business
▪ Group sales increased in the first half of 2019 by 4.6%, particularly due to an acquisition at
Vossloh Tie Technologies
▪ EBIT, adjusted for one-time effects from the performance program, slightly below the
previous year (adjustment only affects the key figures EBIT and EBIT margin)
▪ Outlook for the operational business in 2019 confirmed, preview for a stronger fiscal year
2020 unchanged
▪ Major orders in China (high-speed line from Hangzhou to Taizhou; around €40 million) and
by Austrak in Australia (order from Rio Tinto for 280,000 concrete ties) won in Q2/2019
▪ Both orders will primarily be delivered in 2020
▪ Very good progress on contract negotiations
▪ Contract signing expected in the coming weeks
Performance program
on track
▪ Personnel: Provisions made for about a third of the planned employee redundancies
▪ Unprofitable or disadvantageous activities: Quantification not yet conclusively possible;
concerns particularly Customized Modules
4
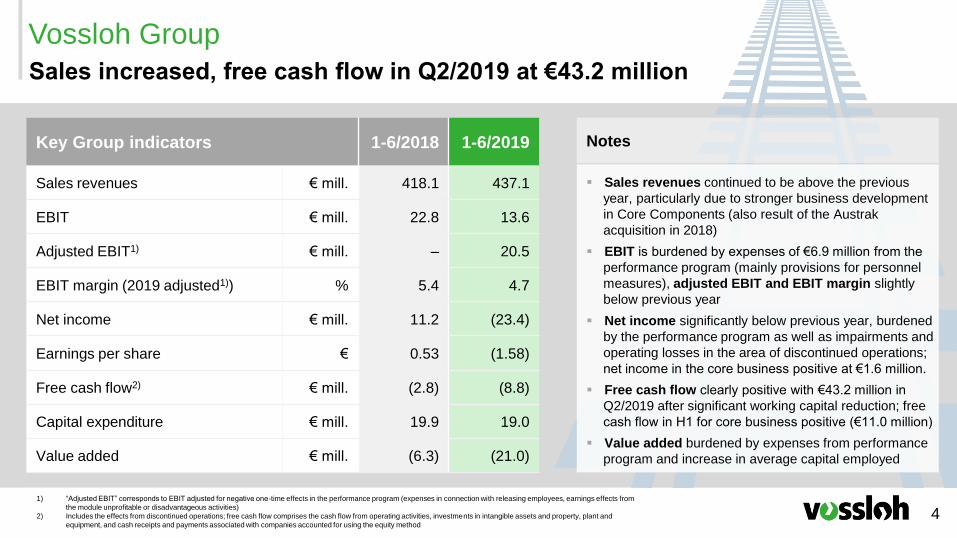
Vossloh Group
Sales increased, free cash flow in Q2/2019 at €43.2 million
Notes
▪ Sales revenues continued to be above the previous
year, particularly due to stronger business development
in Core Components (also result of the Austrak
acquisition in 2018)
▪ EBIT is burdened by expenses of €6.9 million from the
performance program (mainly provisions for personnel
measures), adjusted EBIT and EBIT margin slightly
below previous year
▪ Net income significantly below previous year, burdened
by the performance program as well as impairments and
operating losses in the area of discontinued operations;
net income in the core business positive at €1.6 million.
▪ Free cash flow clearly positive with €43.2 million in
Q2/2019 after significant working capital reduction; free
cash flow in H1 for core business positive (€11.0 million)
▪ Value added burdened by expenses from performance
program and increase in average capital employed
1)
2)
“Adjusted EBIT” corresponds to EBIT adjusted for negative one-time effects in the performance program (expenses in connection with releasing employees, earnings effects from
the module unprofitable or disadvantageous activities)
Includes the effects from discontinued operations; free cash flow comprises the cash flow from operating activities, investments in intangible assets and property, plant and
equipment, and cash receipts and payments associated with companies accounted for using the equity method
Key Group indicators 1-6/2018 1-6/2019
Sales revenues € mill. 418.1 437.1
EBIT € mill. 22.8 13.6
Adjusted EBIT1) € mill. – 20.5
EBIT margin (2019 adjusted1)) % 5.4 4.7
Net income € mill. 11.2 (23.4)
Earnings per share € 0.53 (1.58)
Free cash flow2) € mill. (2.8) (8.8)
Capital expenditure € mill. 19.9 19.0
Value added € mill. (6.3) (21.0)
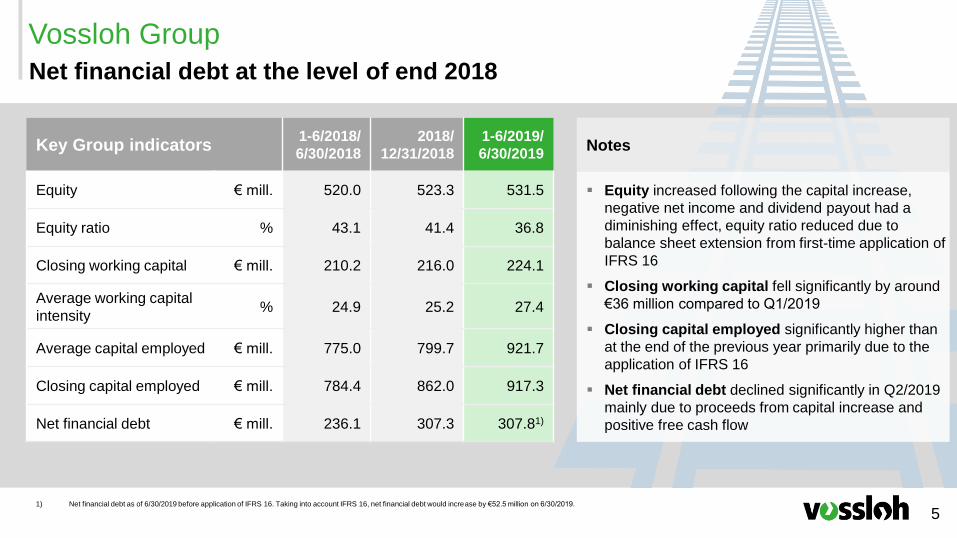
5
Vossloh Group
Net financial debt at the level of end 2018
Notes
▪ Equity increased following the capital increase,
negative net income and dividend payout had a
diminishing effect, equity ratio reduced due to
balance sheet extension from first-time application of
IFRS 16
▪ Closing working capital fell significantly by around
€36 million compared to Q1/2019
▪ Closing capital employed significantly higher than
at the end of the previous year primarily due to the
application of IFRS 16
▪ Net financial debt declined significantly in Q2/2019
mainly due to proceeds from capital increase and
positive free cash flow
Key Group indicators1-6/2018/
6/30/2018
2018/
12/31/2018
1-6/2019/
6/30/2019
Equity € mill. 520.0 523.3 531.5
Equity ratio % 43.1 41.4 36.8
Closing working capital € mill. 210.2 216.0 224.1
Average working capital
intensity% 24.9 25.2 27.4
Average capital employed € mill. 775.0 799.7 921.7
Closing capital employed € mill. 784.4 862.0 917.3
Net financial debt € mill. 236.1 307.3 307.81)
1) Net financial debt as of 6/30/2019 before application of IFRS 16. Taking into account IFRS 16, net financial debt would increase by €52.5 million on 6/30/2019.

6
Vossloh Group
Orders received remain at a high level
▪ Increase of orders received in all divisions,
particularly in the Tie Technologies business unit
with the acquisition of Austrak; Customized
Modules received again more orders in the single
quarter compared to the previous year; Lifecycle
Solutions above the first half of last year
▪ Book-to-bill ratio of 1.3 for the Group
▪ Order backlog of the Vossloh Group at the end of
June 2019 33.7% higher than in the previous year:
Among other things, this is attributable to major
orders in the Fastening Systems business unit in
China, major Rio Tinto order won by Tie
Technologies included
NotesOrders received (in € mill.) Order backlog (in € mill.)
Core Components Customized Modules Lifecycle Solutions
247.8
479.7
181.6
273.4
1-6/2018
243.9
1-6/2019
568.9
6/30/2019
726.9
543.5
6/30/2018
177.2
340.4
316.5
387.4
24.7
29.153.1
60.7

▪ Significant sales increase in Tie Technologies in North America and Australia
▪ EBIT burdened by one-time effects from the performance program in the amount of €0.8
million; adjusted EBIT significantly higher year-on-year due to higher sales, positive
contributions from Austrak, adjusted EBIT margin higher year-on-year despite negative impact
of purchase price allocation following the acquisition of Austrak
▪ Value added burdened by previously mentioned one-time effects, but still slightly above
previous year's level
7
Core Components division
Sales and EBIT significantly higher year-on-year
EBIT margin (2019 adj.)
(in %)
Sales (in € mill.) EBIT (2019 adjusted)
(in € mill.)
Value
added
(in € mill.)
1-6/2019: 8.1
1-6/2018: 7.9
141.0
1-6/2018
164.8
1-6/2019 1-6/2019
19.2
1-6/2018
16.111.7
1-6/20191-6/2018
11.4
ROCE
(in %)
1-6/2019: 13.3
1-6/2018: 14.8
8
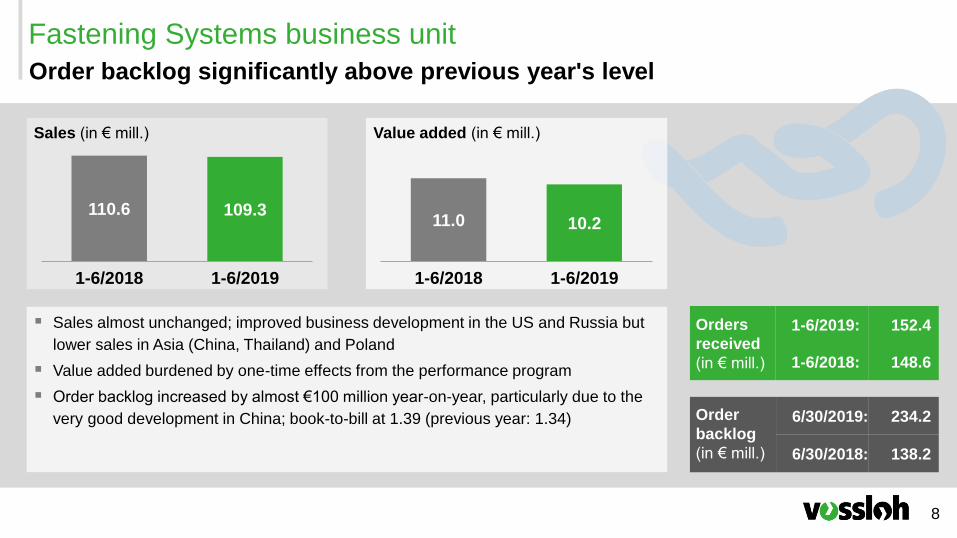
Fastening Systems business unit
Order backlog significantly above previous year's level
Value added (in € mill.) Sales (in € mill.)
▪ Sales almost unchanged; improved business development in the US and Russia but
lower sales in Asia (China, Thailand) and Poland
▪ Value added burdened by one-time effects from the performance program
▪ Order backlog increased by almost €100 million year-on-year, particularly due to the
very good development in China; book-to-bill at 1.39 (previous year: 1.34) Order
backlog
(in € mill.)
6/30/2019: 234.2
6/30/2018: 138.2
Orders
received
(in € mill.)
1-6/2019: 152.4
1-6/2018: 148.6
1-6/2019
110.6
1-6/2018
109.3
1-6/2018
10.2
1-6/2019
11.0

9
Tie Technologies business unit
Sales increased in North America, significant contributions from Australia
Value added (in € mill.) Sales (in € mill.)
▪ Higher sales, particularly due to the acquisition of Austrak at the end of 2018 (€15.9
million), additionally an increase in sales from deliveries under the framework
agreement with CN
▪ Value added improved despite negative effects from the purchase price allocation and
burdens from the performance program
▪ Orders received significantly higher, book-to-bill of 1.55 (previous year: 1.09)
Order
backlog
(in € mill.)
6/30/2019: 84.1
6/30/2018: 39.0
Orders
received
(in € mill.)
1-6/2019: 94.5
1-6/2018: 33.9
1-6/20191-6/2018
31.1
61.0
(3.1)
1-6/2018
(2.1)
1-6/2019

10
Customized Modules division
Sales slightly down year-on-year, orders received remain at a high level
▪ Sales slightly below the previous year; lower sales in Poland, the United Kingdom and France
only partially offset by higher sales in India and Canada
▪ EBIT burdened by one-time effects from the performance program in the amount of €1.7
million; adjusted EBIT down year-on-year, particularly due to lower earnings contributions from
the United Kingdom, the US, Poland and Finland; in contrast, Sweden improved
▪ Orders received continue to be higher than in the previous year, mainly due to additional
orders in Malaysia, the Netherlands and India
EBIT margin (2019 adj.)
(in %)
Sales (in € mill.) EBIT (2019 adjusted)
(in € mill.)
Value
added
(in € mill.)
1-6/2019: (11.3)
1-6/2018: (3.4)
231.7234.1
1-6/2018 1-6/2019
7.712.6
1-6/2018 1-6/2019 1-6/20191-6/2018
5.43.3
ROCE
(in %)
1-6/2019: 2.6
1-6/2018: 5.9
11
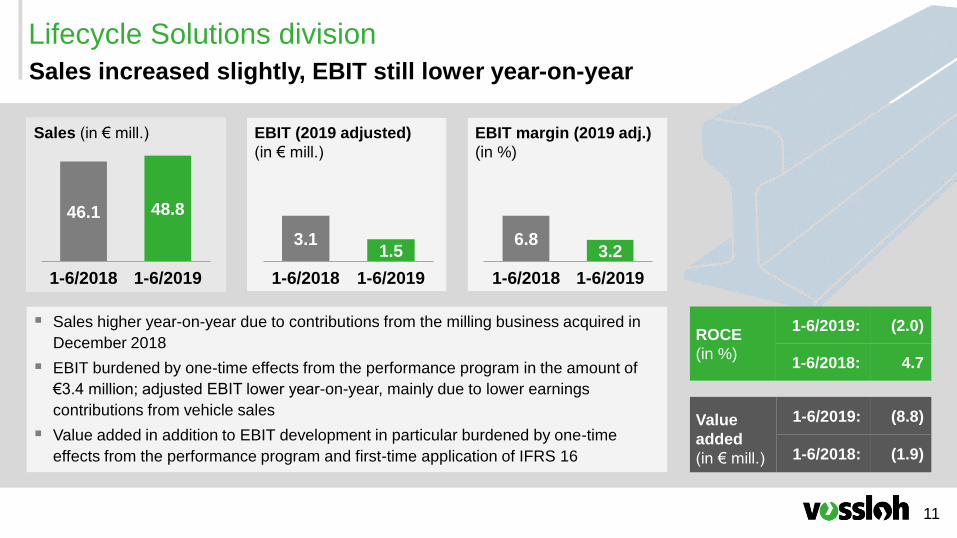
Lifecycle Solutions division
Sales increased slightly, EBIT still lower year-on-year
▪ Sales higher year-on-year due to contributions from the milling business acquired in
December 2018
▪ EBIT burdened by one-time effects from the performance program in the amount of
€3.4 million; adjusted EBIT lower year-on-year, mainly due to lower earnings
contributions from vehicle sales
▪ Value added in addition to EBIT development in particular burdened by one-time
effects from the performance program and first-time application of IFRS 16
EBIT margin (2019 adj.)
(in %)
Sales (in € mill.) EBIT (2019 adjusted)
(in € mill.)
Value
added
(in € mill.)
1-6/2019: (8.8)
1-6/2018: (1.9)
46.1
1-6/2018
48.8
1-6/2019 1-6/2018
3.11.5
1-6/2019 1-6/2018 1-6/2019
3.26.8
ROCE
(in %)
1-6/2019: (2.0)
1-6/2018: 4.7

12
Vossloh Group
Sales increases primarily in Australia, Canada and the USA
Higher sales in both Canada and the USA
Slightly lower sales in Western Europe almost
completely offset
Sales in Australia increased through the acquisition of
Austrak
Lower sales in China and Thailand, higher sales in India and Malaysia
54 64
1827
1-6/2018
91
1-6/2019
72
Rest of Americas US
The Americas
(in € mill.)
Europe (in € mill.) Africa and Australia
(in € mill.)
Asia incl. Middle East
(in € mill.)
128 122
48 51
249
1-6/2018 1-6/2019
248
Eastern Europe
Western EuropeSouthern Europe
Northern Europe
8
1-6/20191-6/2018
22
4
31
Australia Africa
59 52
75
1-6/2018 1-6/2019
66
Middle East Asia
36
37
35
40
14 27
16 14

13
Vossloh Group
Outlook
Looking ahead to 2020
▪ Forecast sales range €950 – 1,050 million:
Sales increase compared with 2019 mainly driven
by high order backlog in rail fastener business in
China
▪ Forecast EBIT range €65 – 80 million
Outlook for 2019 with regard to the operating business
▪ Forecast sales range €900 – 1,000 million: Sales increases
compared to 2018 in the Core Components and Lifecycle
Solutions divisions primarily due to the acquisitions of Austrak
and the milling business, higher sales also expected for
Customized Modules
▪ Adjusted EBIT within a range of €50 – 60 million confirmed
▪ Value added also particularly due to one-time expenses from the
performance program expected to be below the negative
previous year's value
General framework
▪ Good order situation forms basis for future growth
▪ Higher visibility of deliveries to China following three
major project wins in 2018 and another in 2019, majority
of deliveries to be made in 2020 based on current
information

14
Financial calendar and contact information
▪ October 24, 2019 Quarterly statement as of September 30, 2019
▪ March 2020 2019 Annual Report
Financial calendar 2019 / 2020
▪ Dr. Daniel Gavranovic
▪ Email: [email protected]
Phone: +49 (0) 23 92 / 52-609
Fax: +49 (0) 23 92 / 52-219
Contact information for investors:
▪ Gundolf Moritz (Mirnock Consulting)
▪ Email: [email protected]
Phone: +49 (0) 23 92 / 52-608
Fax: +49 (0) 23 92 / 52-219
Contact information for the media:
How to reach us

Thank you for
your time.
Q&A
Grasping the future.
Shaping the future.