Product and labor market imperfections and scale economies ...
Upload
evelyn-parkCategory
view
224download
1
Graphing Production
1
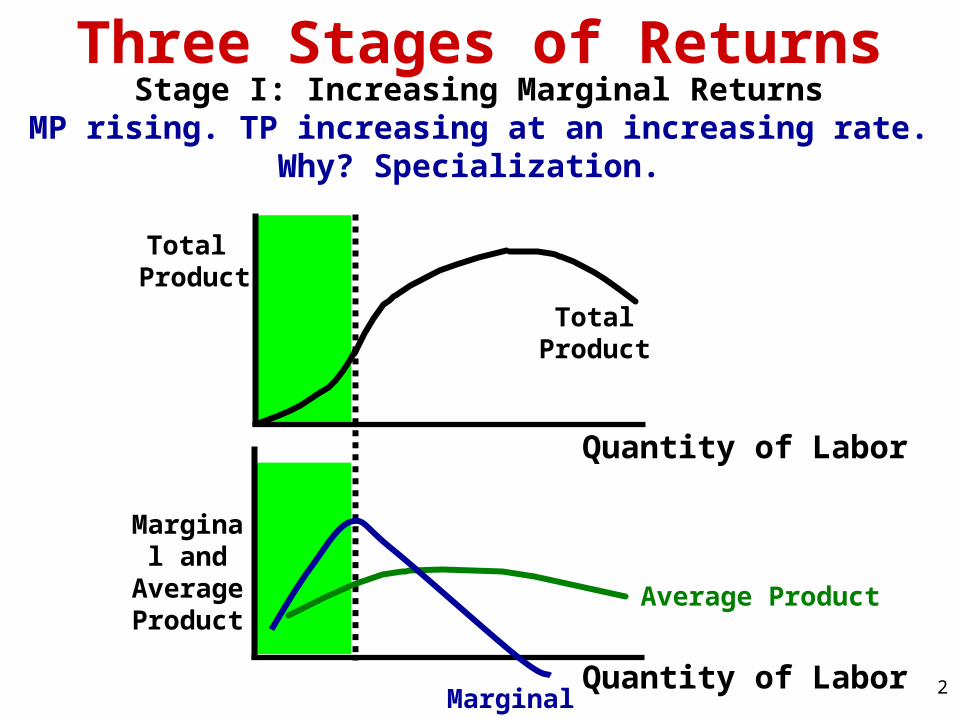
Three Stages of Returns
Total Product
Quantity of Labor
Marginal and
Average Product
Quantity of Labor
Total Product
Stage I: Increasing Marginal ReturnsMP rising. TP increasing at an increasing rate.
Why? Specialization.
Average Product
2Marginal Product
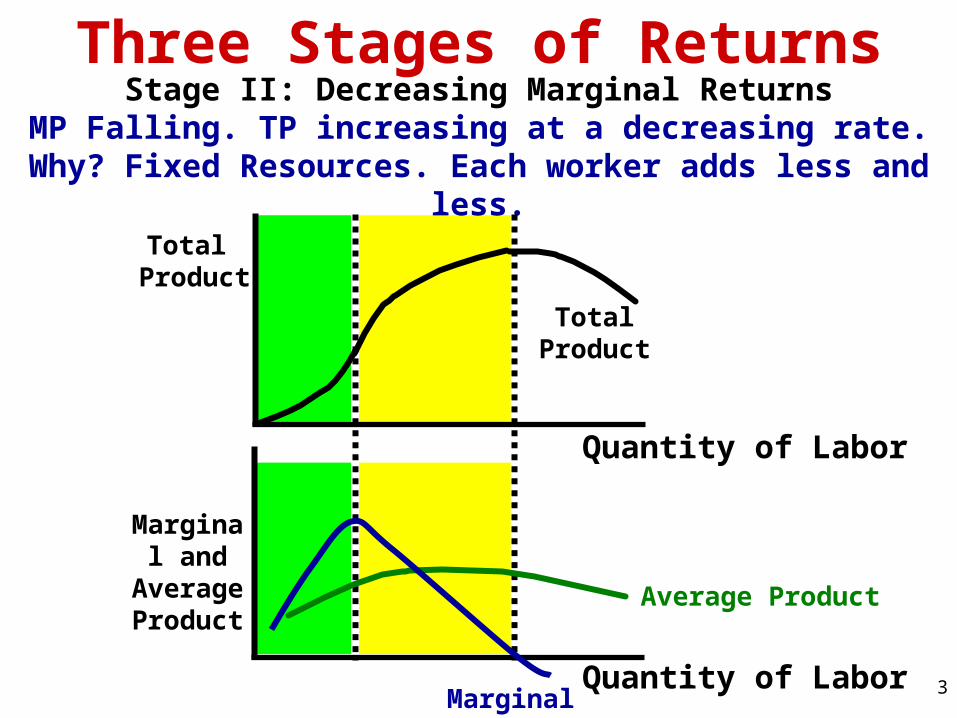
Three Stages of Returns
Total Product
Quantity of Labor
Marginal and
Average Product
Quantity of Labor
Total Product
Stage II: Decreasing Marginal ReturnsMP Falling. TP increasing at a decreasing rate.
Why? Fixed Resources. Each worker adds less and less.
Average Product
3Marginal Product
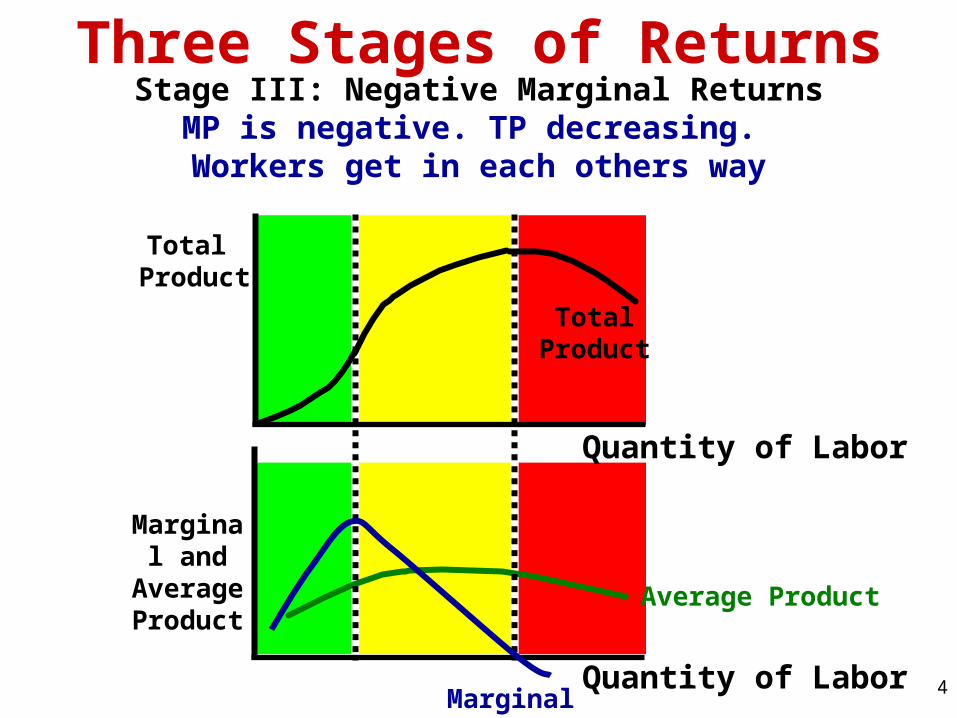
Total Product
Quantity of Labor
Marginal and
Average Product
Quantity of Labor
Total Product
Stage III: Negative Marginal ReturnsMP is negative. TP decreasing. Workers get in each others way
Marginal Product
Average Product
4
Three Stages of Returns
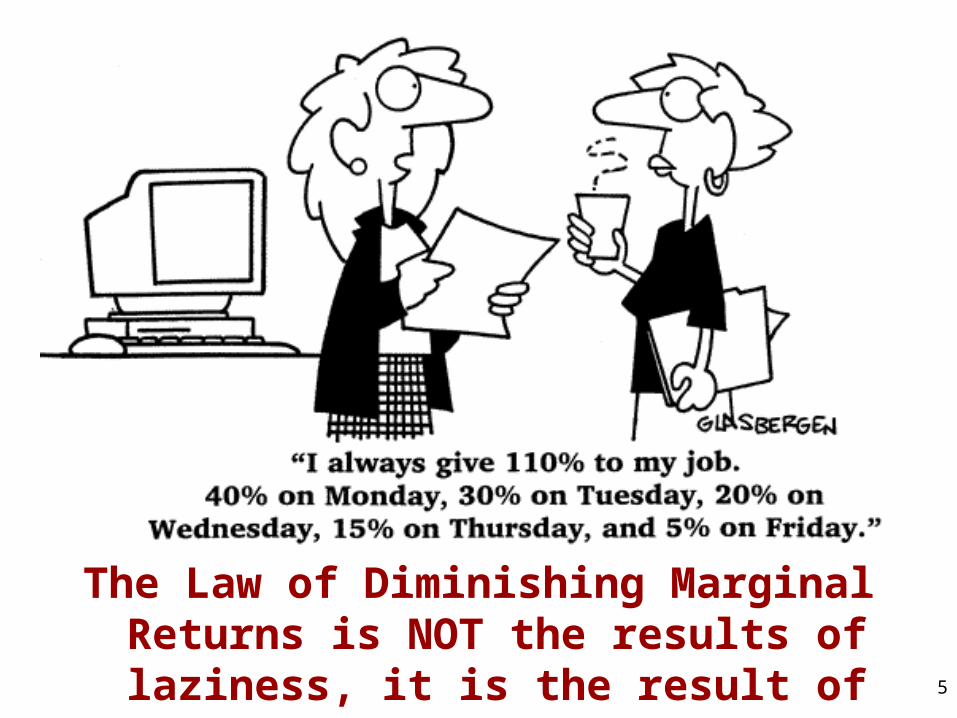
The Law of Diminishing Marginal Returns is NOT the results of laziness, it is the result of limited
fixed resources. 5
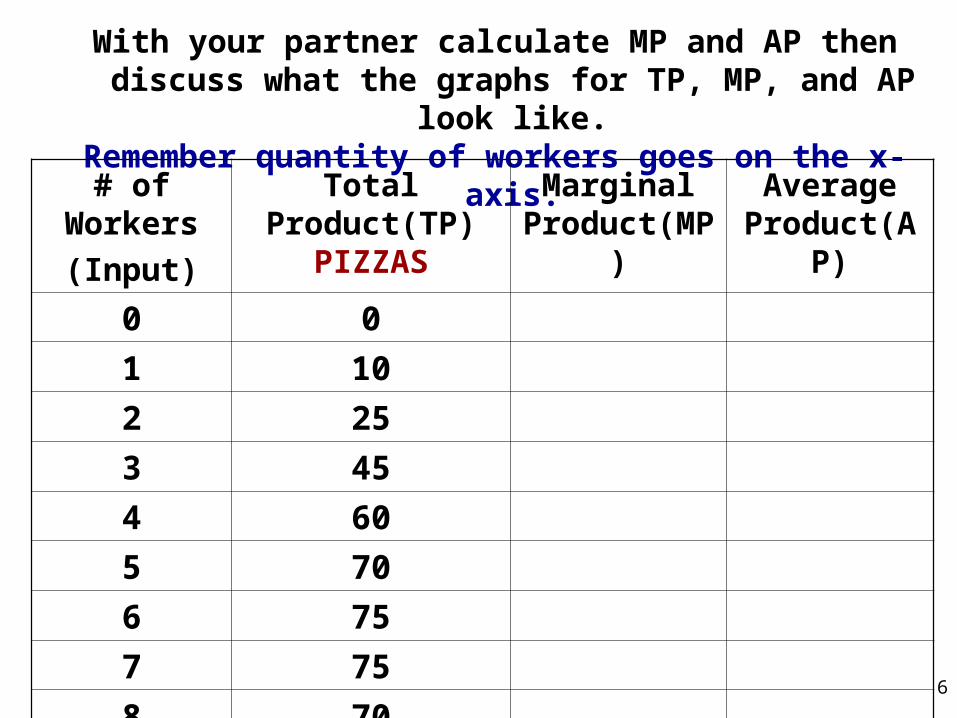
With your partner calculate MP and AP then discuss what the graphs for TP, MP, and AP look like.
Remember quantity of workers goes on the x-axis.
# of Workers
(Input)
Total Product(TP) PIZZAS
Marginal Product(MP)
Average Product(AP)
0 0
1 10
2 25
3 45
4 60
5 70
6 75
7 75
8 70 6
# of Workers
(Input)
Total Product(TP) PIZZAS
Marginal Product(MP)
Average Product(AP)
0 0 - -
1 10 10
2 25 15
3 45 20
4 60 15
5 70 10
6 75 5
7 75 0
8 70 -5
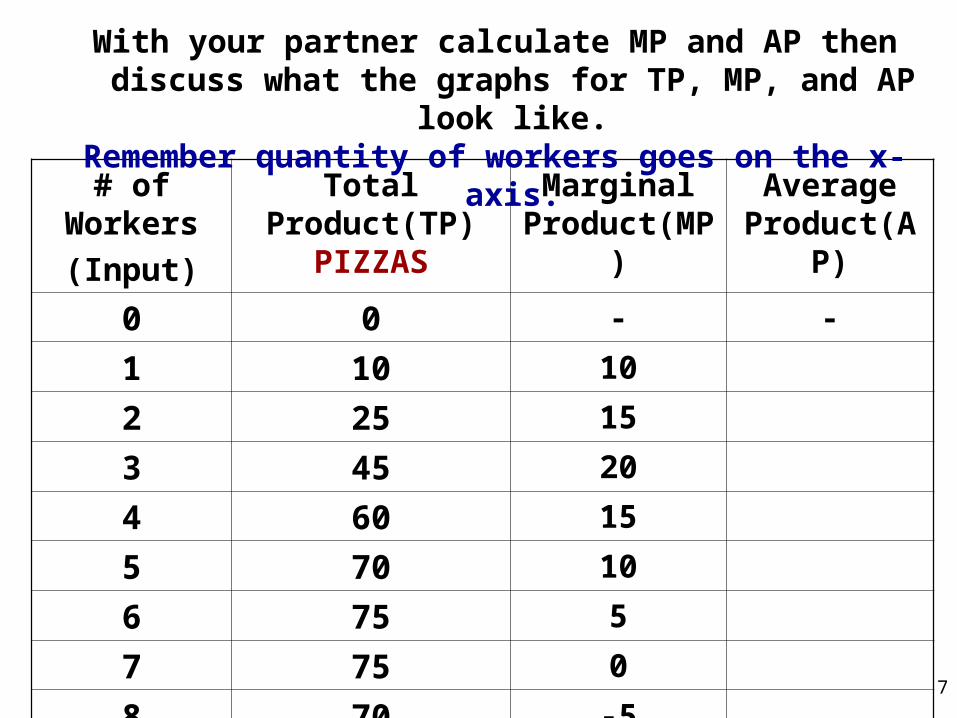
With your partner calculate MP and AP then discuss what the graphs for TP, MP, and AP look like.
Remember quantity of workers goes on the x-axis.
7
# of Workers
(Input)
Total Product(TP) PIZZAS
Marginal Product(MP)
Average Product(AP)
0 0 - -
1 10 10 10
2 25 15 12.5
3 45 20 15
4 60 15 15
5 70 10 14
6 75 5 12.5
7 75 0 10.71
8 70 -5 8.75
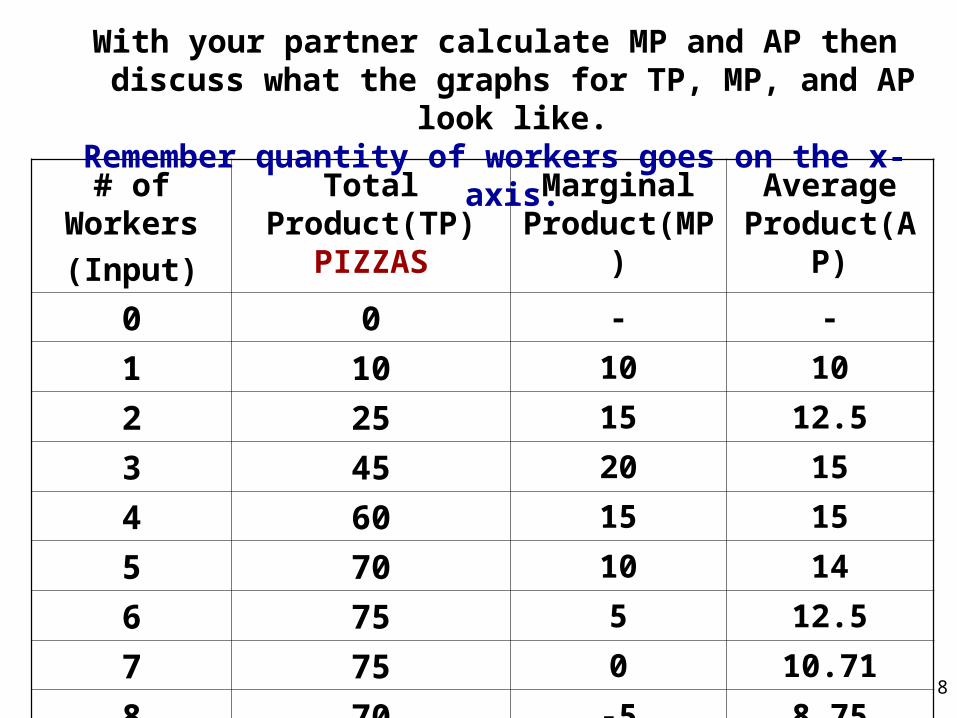
With your partner calculate MP and AP then discuss what the graphs for TP, MP, and AP look like.
Remember quantity of workers goes on the x-axis.
8
# of Workers
(Input)
Total Product(TP) PIZZAS
Marginal Product(MP)
Average Product(AP)
0 0 - -
1 10 10 10
2 25 15 12.5
3 45 20 15
4 60 15 15
5 70 10 14
6 75 5 12.5
7 75 0 10.71
8 70 -5 8.75
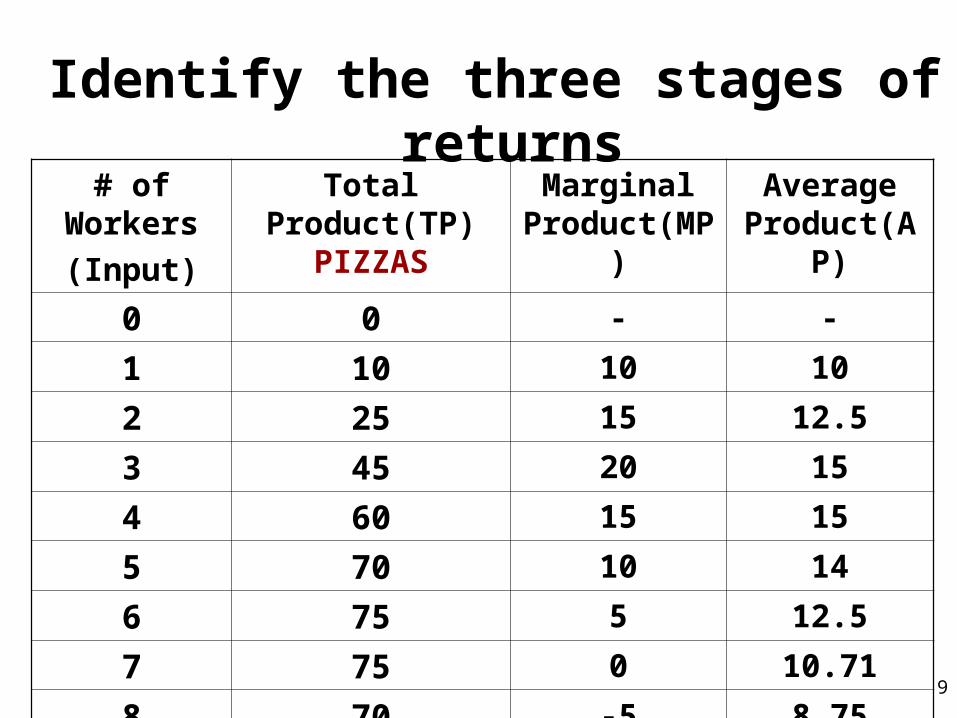
Identify the three stages of returns
9
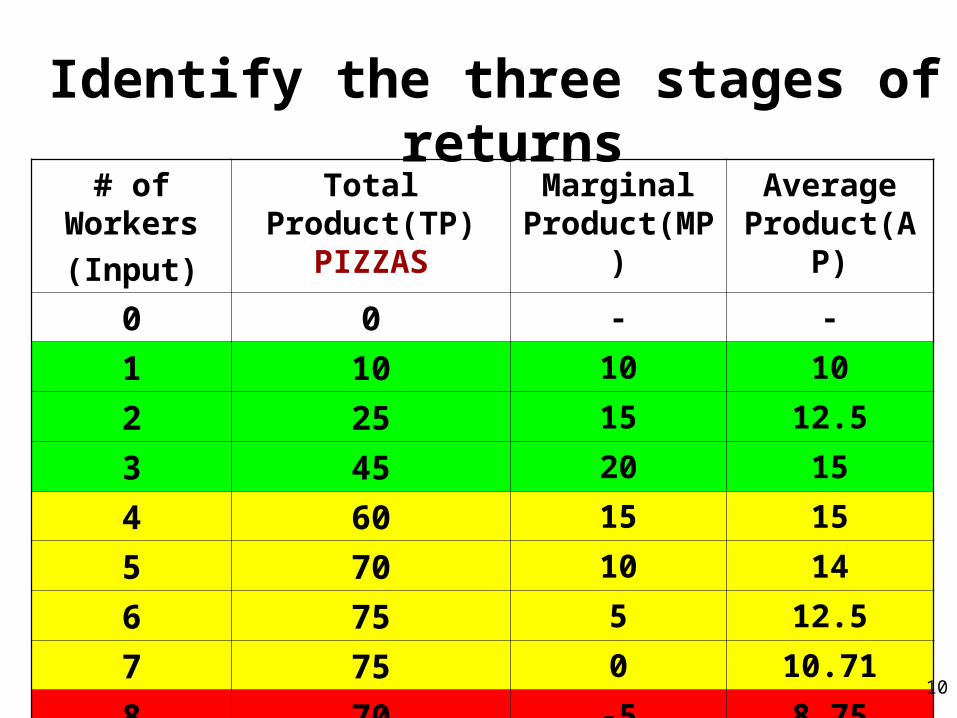
# of Workers
(Input)
Total Product(TP) PIZZAS
Marginal Product(MP)
Average Product(AP)
0 0 - -
1 10 10 10
2 25 15 12.5
3 45 20 15
4 60 15 15
5 70 10 14
6 75 5 12.5
7 75 0 10.71
8 70 -5 8.75
Identify the three stages of returns
10
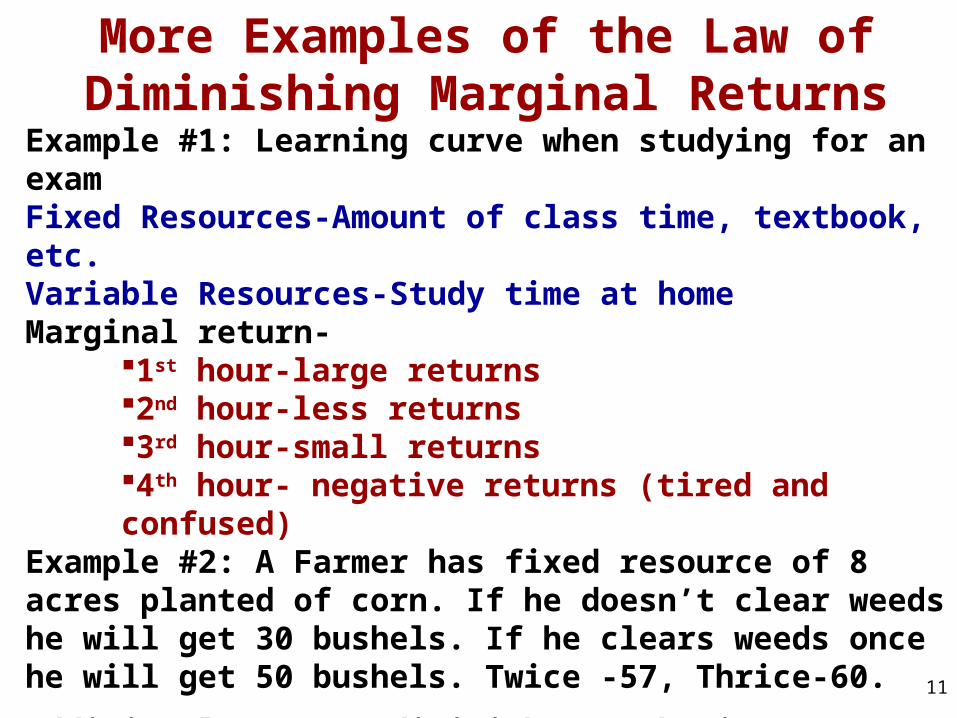
More Examples of the Law of Diminishing Marginal Returns
Example #1: Learning curve when studying for an exam Fixed Resources-Amount of class time, textbook, etc.Variable Resources-Study time at homeMarginal return-
1st hour-large returns2nd hour-less returns3rd hour-small returns4th hour- negative returns (tired and confused)
Example #2: A Farmer has fixed resource of 8 acres planted of corn. If he doesn’t clear weeds he will get 30 bushels. If he clears weeds once he will get 50 bushels. Twice -57, Thrice-60. Additional
returns diminishes each time.
11
Costs of ProductionCosts of Production
12
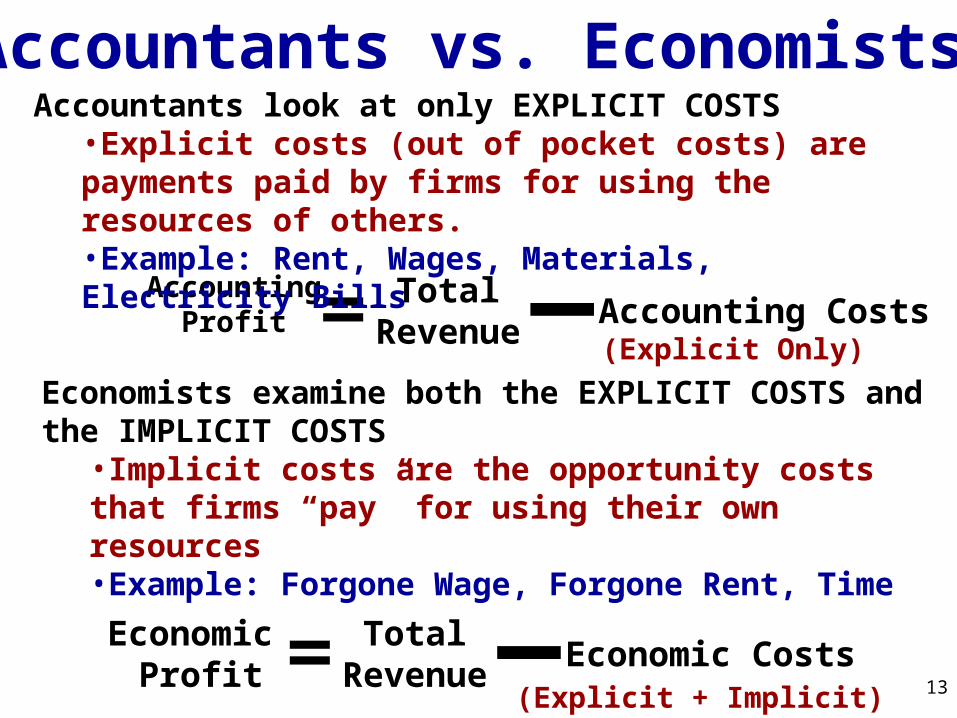
Accountants vs. Economists
AccountingProfit
TotalRevenue
Accounting Costs(Explicit Only)
Accountants look at only EXPLICIT COSTS •Explicit costs (out of pocket costs) are payments paid by firms for using the resources of others. •Example: Rent, Wages, Materials, Electricity Bills
Economists examine both the EXPLICIT COSTS and the IMPLICIT COSTS•Implicit costs are the opportunity costs that firms “pay” for using their own resources•Example: Forgone Wage, Forgone Rent, Time
Economic Profit
TotalRevenue
Economic Costs (Explicit + Implicit) 13
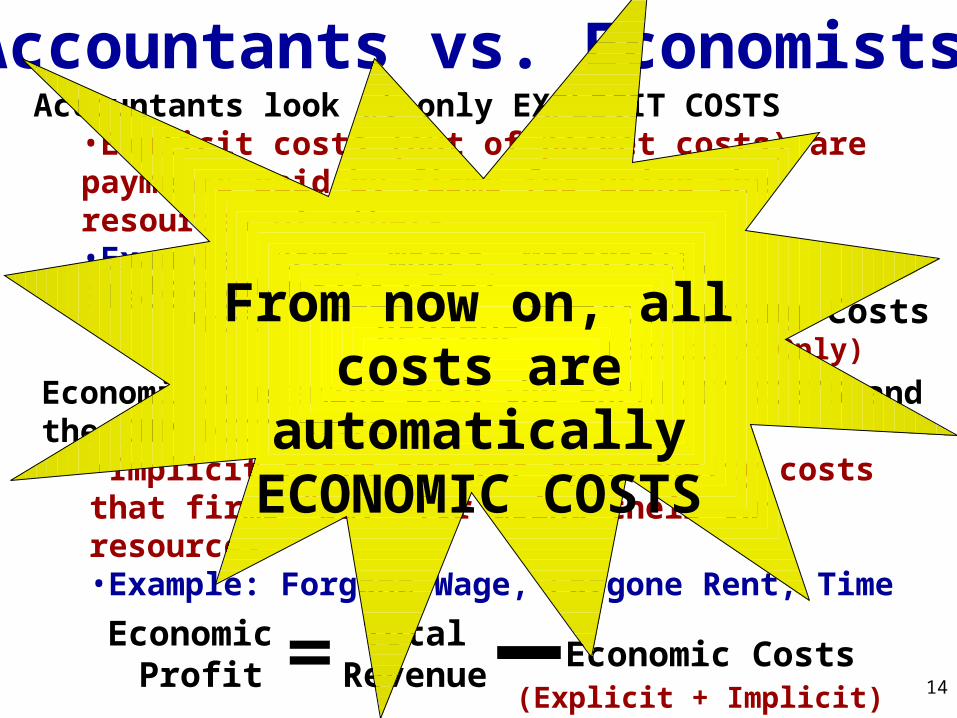
Accountants vs. Economists
AccountingProfit
TotalRevenue
Accounting Costs(Explicit Only)
Accountants look at only EXPLICIT COSTS •Explicit costs (out of pocket costs) are payments paid by firms for using the resources of others. •Example: Rent, Wages, Materials, Electricity Bills
Economists examine both the EXPLICIT COSTS and the IMPLICIT COSTS•Implicit costs are the opportunity costs that firms “pay” for using their own resources•Example: Forgone Wage, Forgone Rent, Time
Economic Profit
TotalRevenue
Economic Costs (Explicit + Implicit)
From now on, all costs are automatically
ECONOMIC COSTS
14
Short-Run Production Costs
15
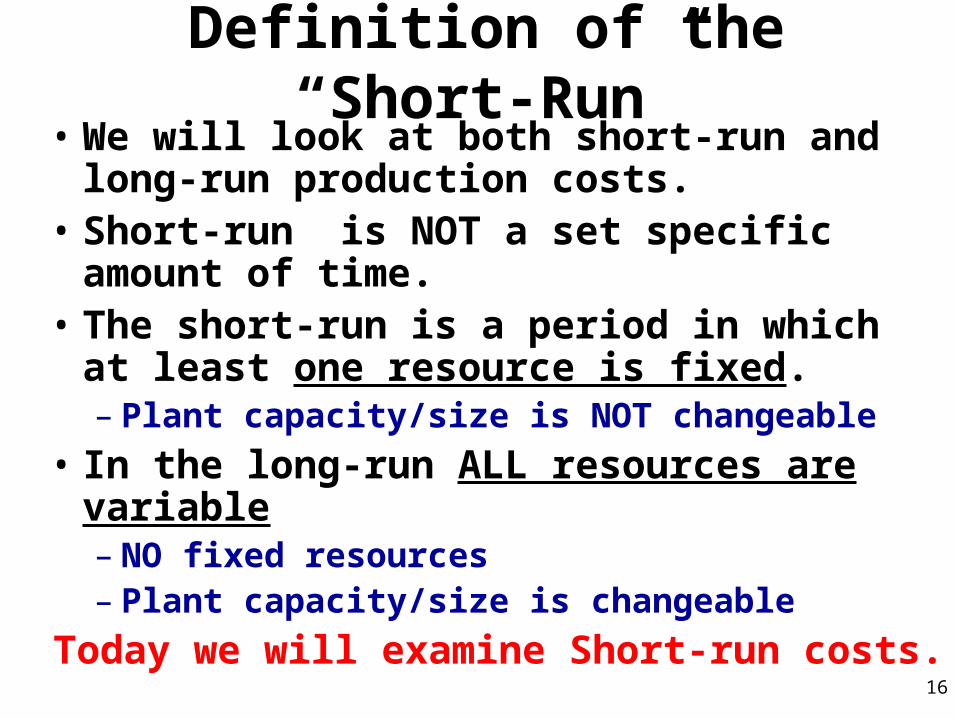
Definition of the “Short-Run”• We will look at both short-run and long-run
production costs.• Short-run is NOT a set specific amount of
time.• The short-run is a period in which at least one
resource is fixed.– Plant capacity/size is NOT changeable
• In the long-run ALL resources are variable– NO fixed resources– Plant capacity/size is changeable
Today we will examine Short-run costs.16
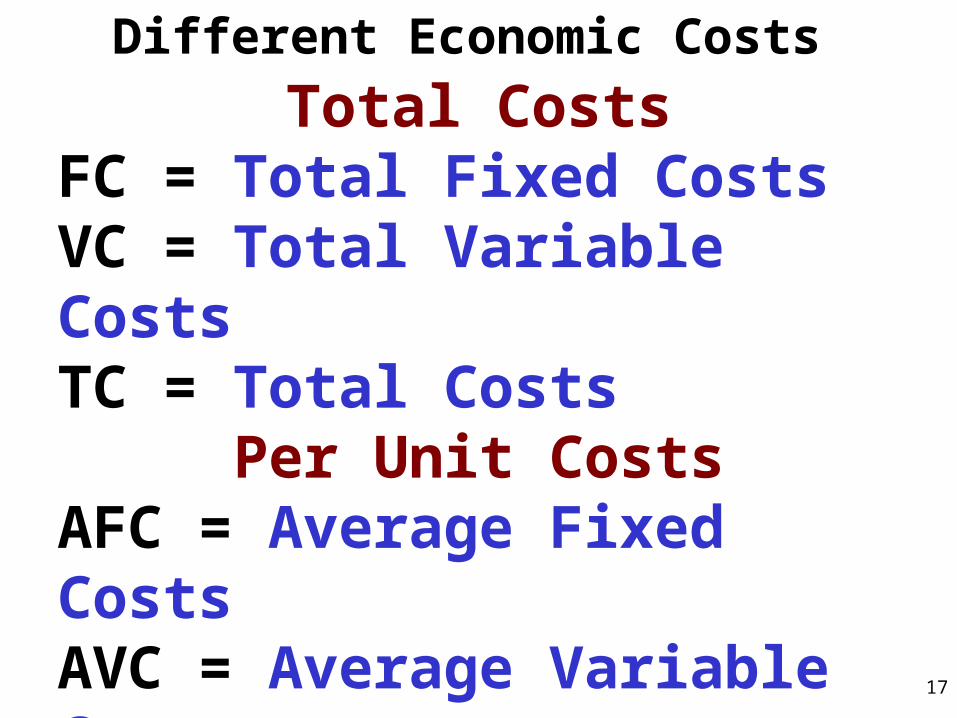
Total CostsFC = Total Fixed Costs VC = Total Variable Costs TC = Total Costs
Per Unit CostsAFC = Average Fixed Costs AVC = Average Variable Costs ATC = Average Total Costs MC = Marginal Cost
Different Economic Costs
17
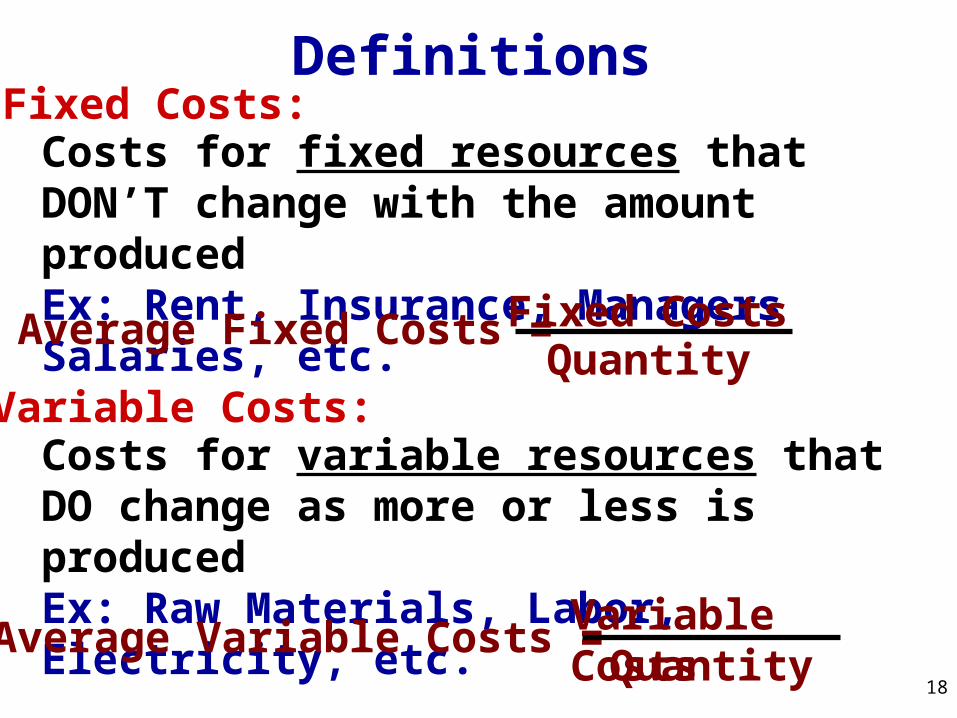
Fixed Costs:Costs for fixed resources that DON’T change with the amount producedEx: Rent, Insurance, Managers Salaries, etc.
Average Fixed Costs = Fixed CostsQuantity
Variable Costs:Costs for variable resources that DO change as more or less is producedEx: Raw Materials, Labor, Electricity, etc.
Average Variable Costs = Variable CostsQuantity
Definitions
18
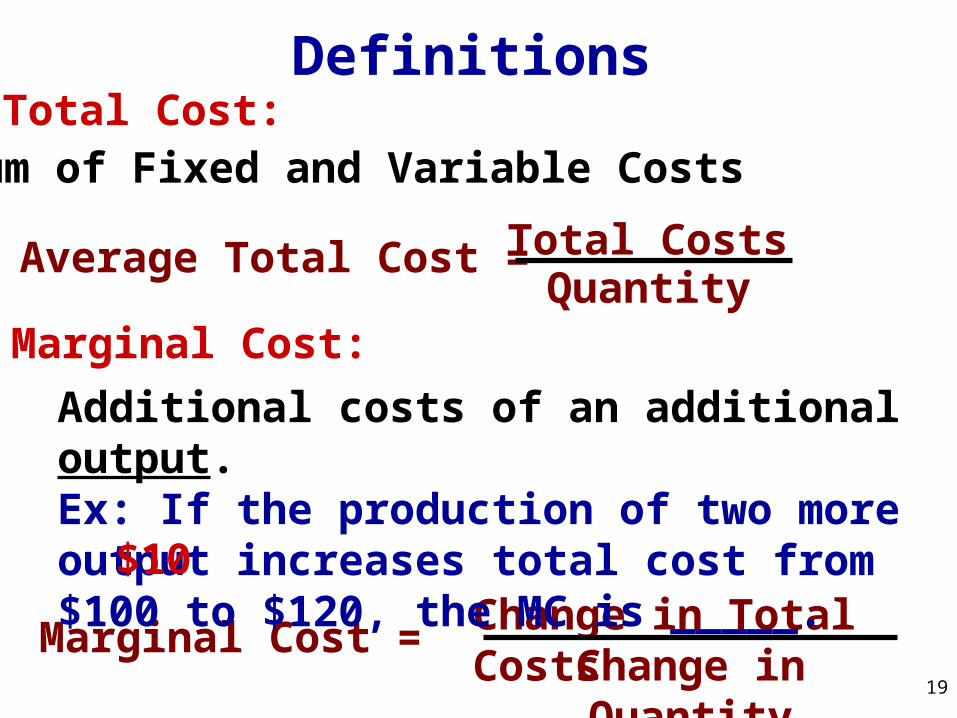
Total Cost:Sum of Fixed and Variable Costs
Average Total Cost = Total CostsQuantity
Marginal Cost:
Marginal Cost = Change in Total CostsChange in Quantity
Additional costs of an additional output.Ex: If the production of two more output increases total cost from $100 to $120, the MC is _____.
Definitions
$10
19
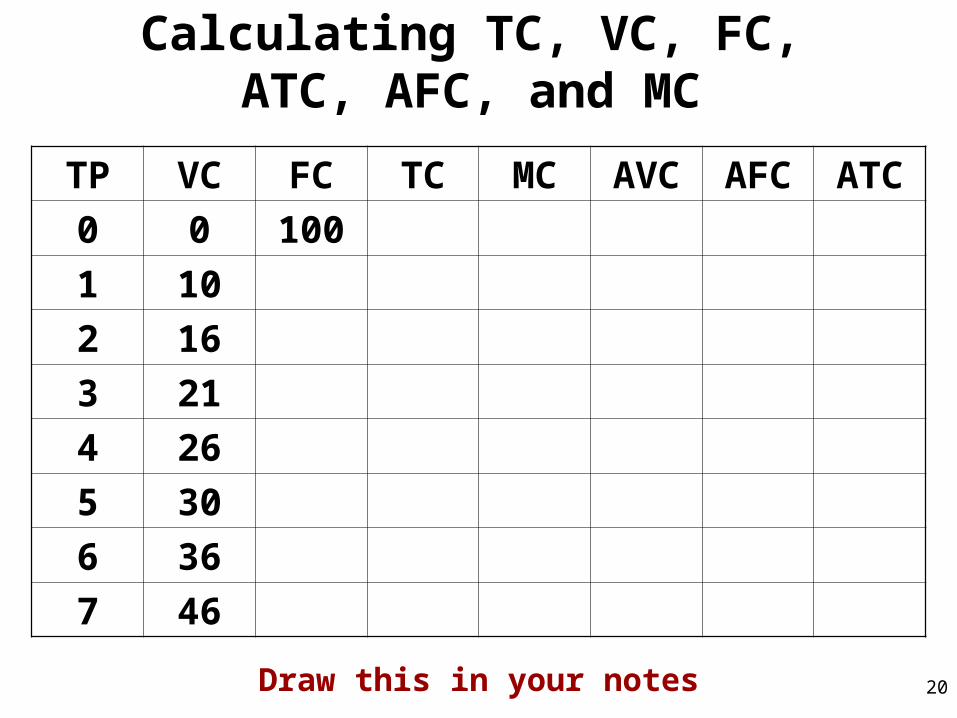
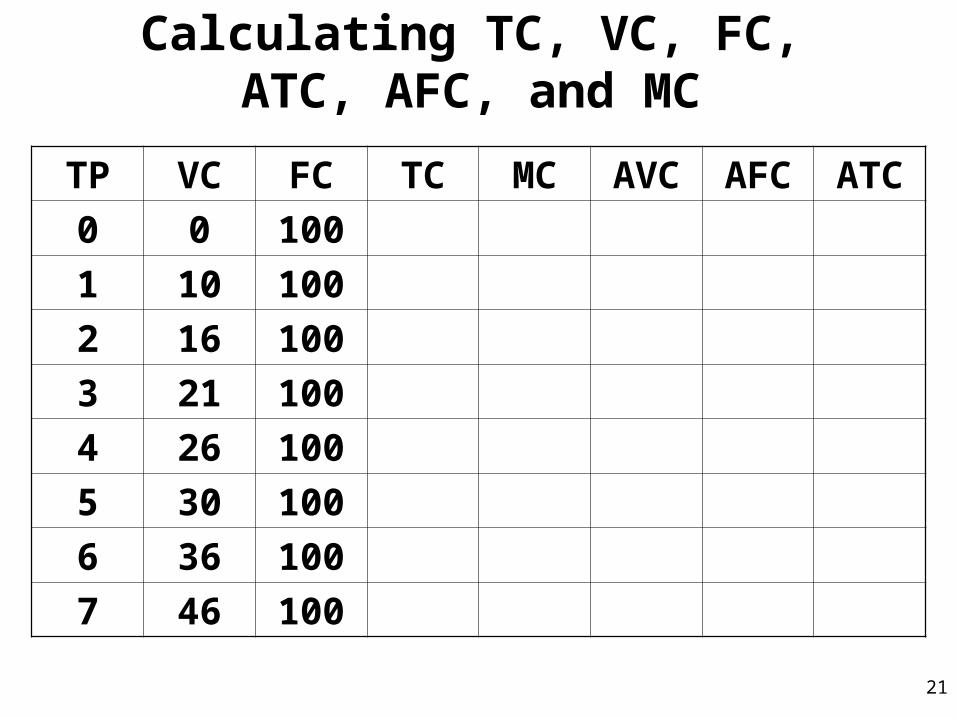
Calculating TC, VC, FC, ATC, AFC, and MC
TP VC FC TC MC AVC AFC ATC
0 0 100
1 10
2 16
3 21
4 26
5 30
6 36
7 46
Draw this in your notes 20
Calculating TC, VC, FC, ATC, AFC, and MC
TP VC FC TC MC AVC AFC ATC
0 0 100
1 10 100
2 16 100
3 21 100
4 26 100
5 30 100
6 36 100
7 46 100
21
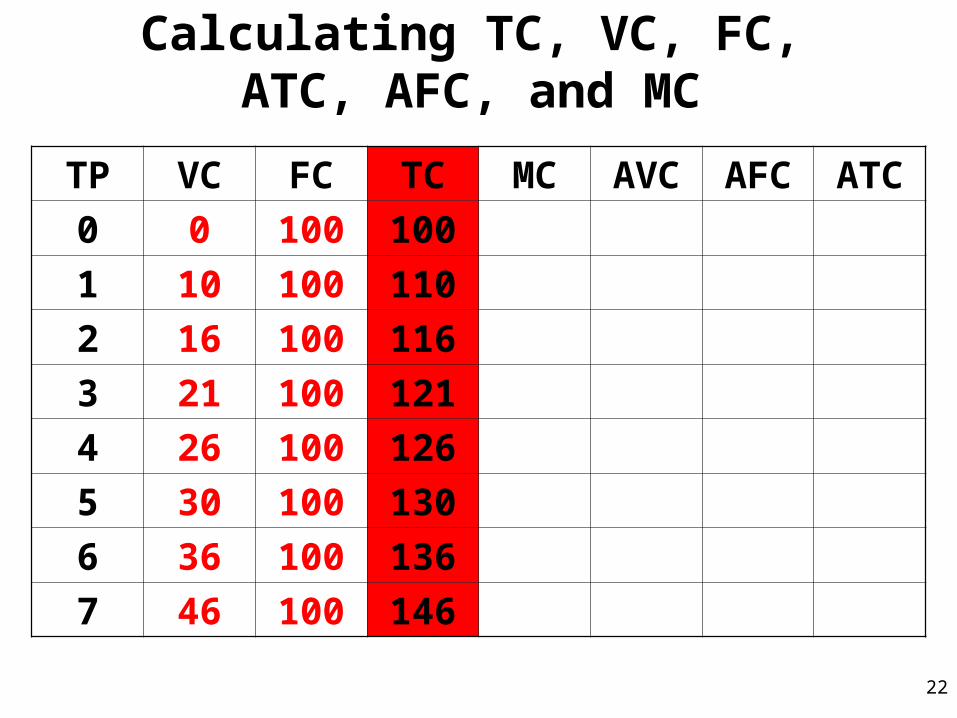
Calculating TC, VC, FC, ATC, AFC, and MC
TP VC FC TC MC AVC AFC ATC
0 0 100 100
1 10 100 110
2 16 100 116
3 21 100 121
4 26 100 126
5 30 100 130
6 36 100 136
7 46 100 146
22
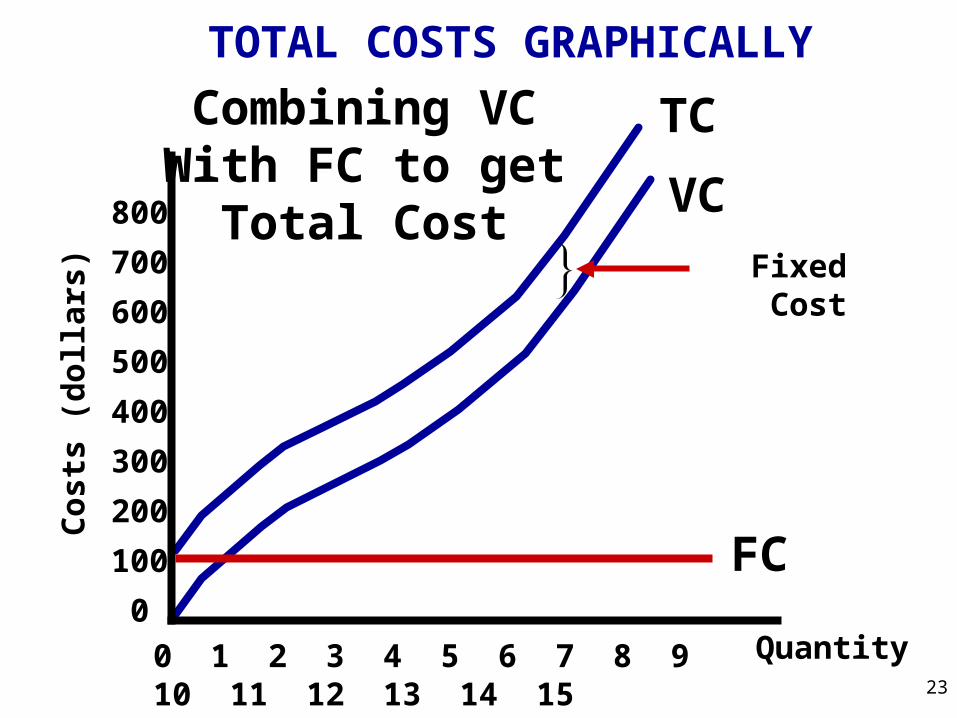
TOTAL COSTS GRAPHICALLY
Quantity
TC
Fixed Cost
VC
FC
Combining VCWith FC to get
Total Cost
0 1 2 3 4 5 6 7 8 9 10 11 12 13 14 15
Co
sts
(do
llar
s)
800
700
600
500
400
300
200
100
0
23
Quantity
Co
sts
(do
llar
s)
TC
Fixed Cost
VC
FC
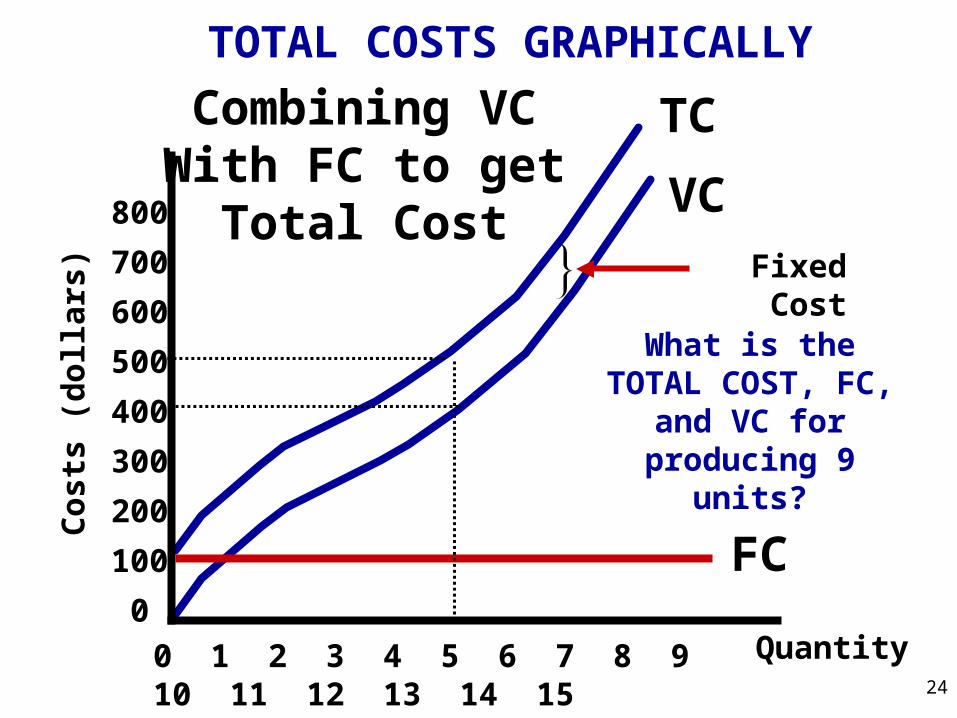
Combining VCWith FC to get
Total Cost
0 1 2 3 4 5 6 7 8 9 10 11 12 13 14 15
What is the TOTAL COST, FC, and VC
for producing 9 units?
TOTAL COSTS GRAPHICALLY
800
700
600
500
400
300
200
100
0
24
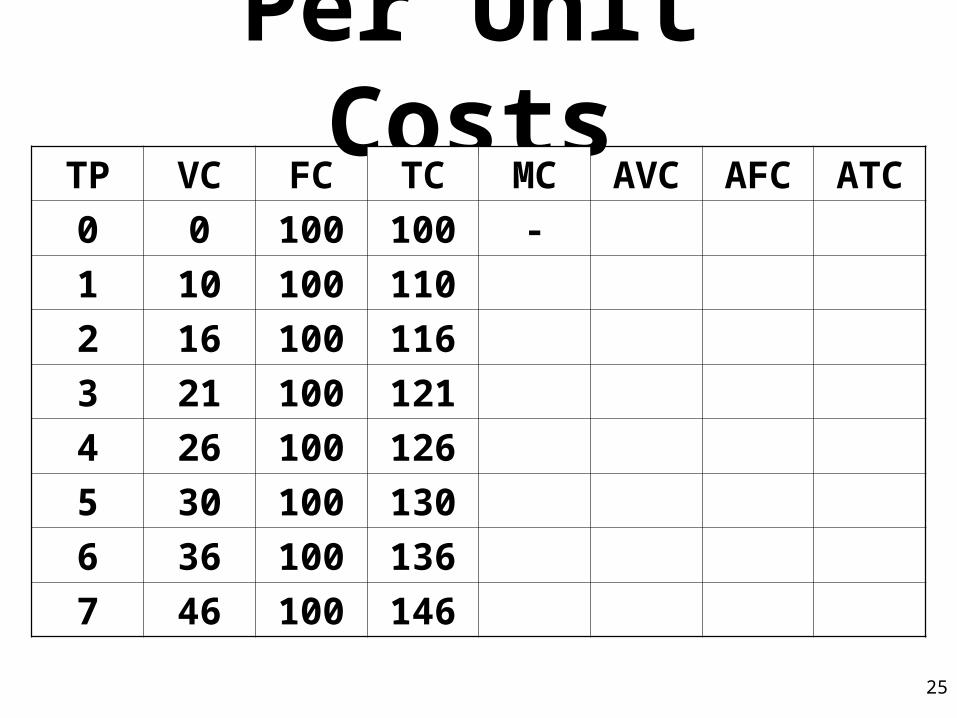
Per Unit CostsTP VC FC TC MC AVC AFC ATC
0 0 100 100 -
1 10 100 110
2 16 100 116
3 21 100 121
4 26 100 126
5 30 100 130
6 36 100 136
7 46 100 146
25
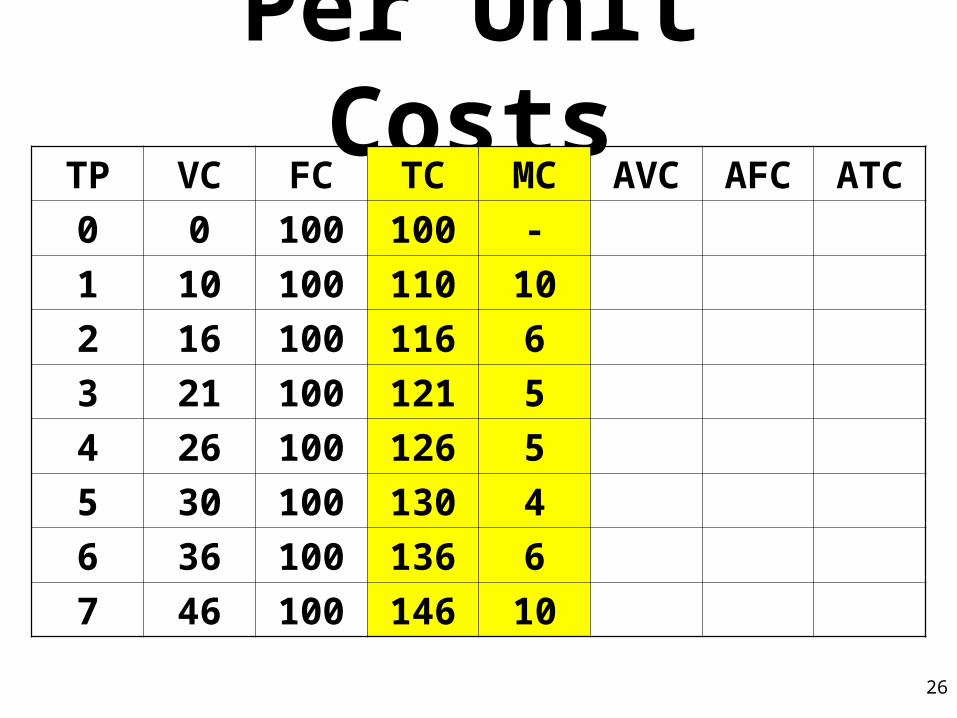
Per Unit CostsTP VC FC TC MC AVC AFC ATC
0 0 100 100 -
1 10 100 110 10
2 16 100 116 6
3 21 100 121 5
4 26 100 126 5
5 30 100 130 4
6 36 100 136 6
7 46 100 146 10
26
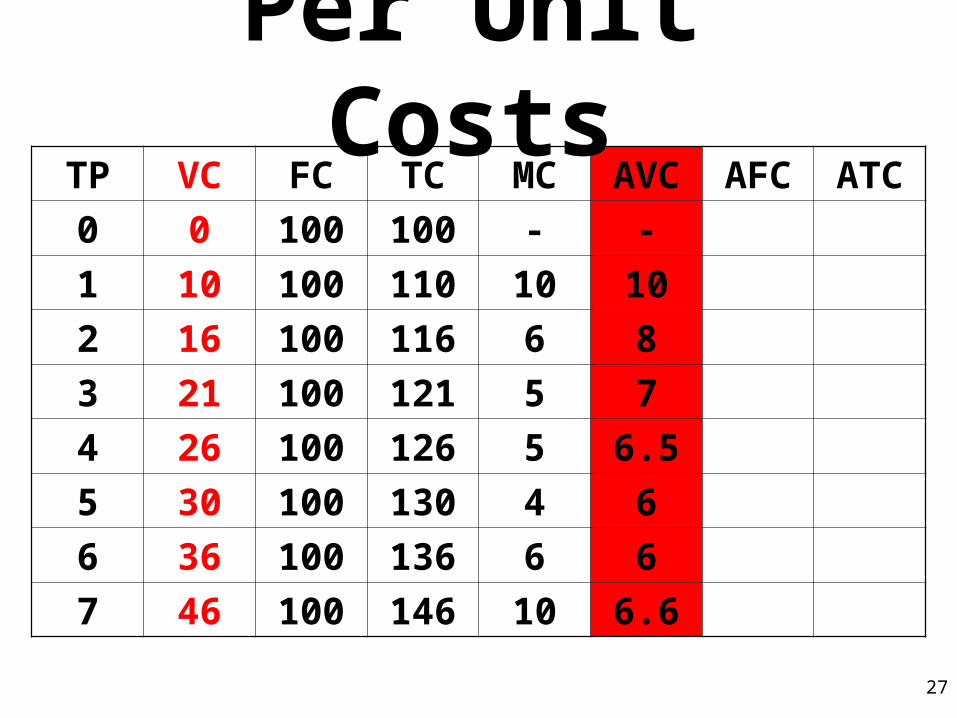
TP VC FC TC MC AVC AFC ATC
0 0 100 100 - -
1 10 100 110 10 10
2 16 100 116 6 8
3 21 100 121 5 7
4 26 100 126 5 6.5
5 30 100 130 4 6
6 36 100 136 6 6
7 46 100 146 10 6.6
Per Unit Costs
27
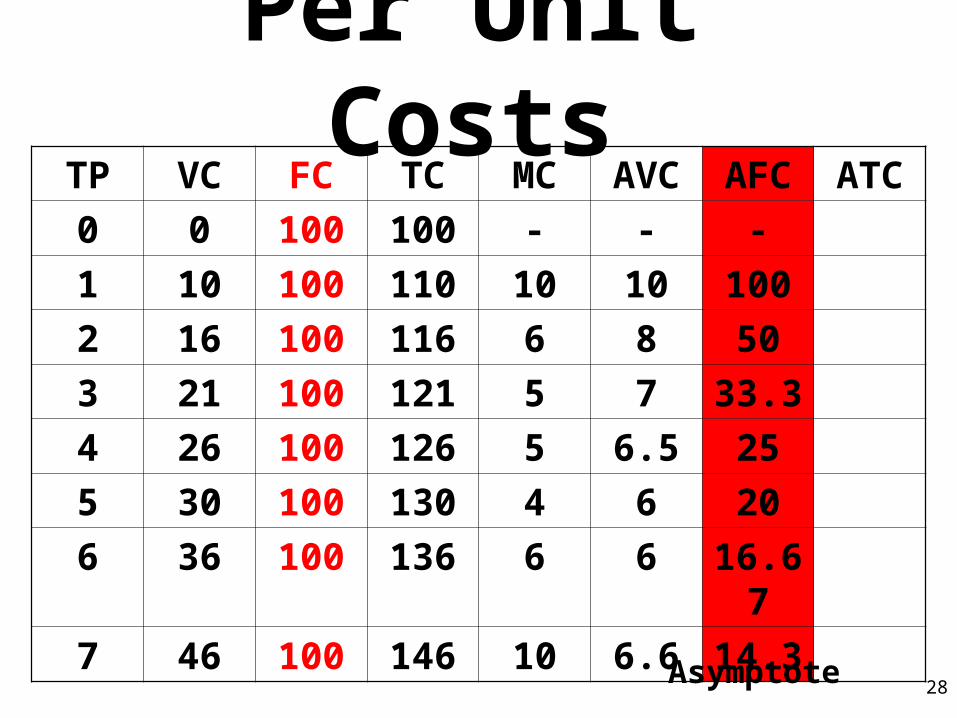
TP VC FC TC MC AVC AFC ATC
0 0 100 100 - - -
1 10 100 110 10 10 100
2 16 100 116 6 8 50
3 21 100 121 5 7 33.3
4 26 100 126 5 6.5 25
5 30 100 130 4 6 20
6 36 100 136 6 6 16.67
7 46 100 146 10 6.6 14.3
Asymptote
Per Unit Costs
28
TP VC FC TC MC AVC AFC ATC
0 0 100 100 - - - -
1 10 100 110 10 10 100 110
2 16 100 116 6 8 50 58
3 21 100 121 5 7 33.3 40.3
4 26 100 126 5 6.5 25 31.5
5 30 100 130 4 6 20 26
6 36 100 136 6 6 16.67 22.67
7 46 100 146 10 6.6 14.3 20.9
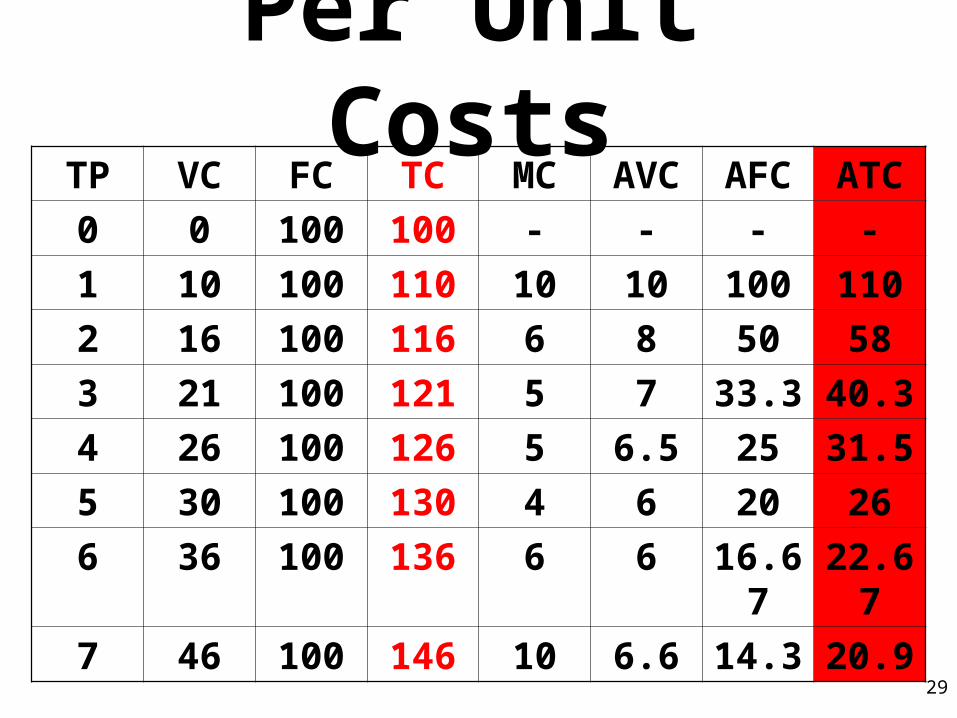
Per Unit Costs
29

TP VC FC TC MC AVC AFC ATC
0 0 100 100 - - - -
1 10 100 110 10 10 100 110
2 16 100 116 6 8 50 58
3 21 100 121 5 7 33.3 40.3
4 26 100 126 5 6.5 25 31.5
5 30 100 130 4 6 20 26
6 36 100 136 6 6 16.67 22.67
7 46 100 146 10 6.6 14.3 20.9
Per Unit Costs
30