Graph theory concepts complex networks presents-rouhollah nabati
107
Introduction to Network Introduction to Network And SNA Theory: And SNA Theory: Basic Concepts Basic Concepts R. Nabati R. Nabati Department of Computer Engineering Department of Computer Engineering Islamic Azad University of Sanandaj Islamic Azad University of Sanandaj www.rnabati.com www.rnabati.com
Transcript of Graph theory concepts complex networks presents-rouhollah nabati

Introduction to Network Introduction to Network And SNA Theory: And SNA Theory:
Basic ConceptsBasic Concepts
R. NabatiR. NabatiDepartment of Computer EngineeringDepartment of Computer EngineeringIslamic Azad University of SanandajIslamic Azad University of Sanandaj
www.rnabati.comwww.rnabati.com

What is a Network?What is a Network? Network = graphNetwork = graph Informally a Informally a graphgraph is a set of nodes is a set of nodes
joined by a set of lines or arrows.joined by a set of lines or arrows.
1 12 3
4 45 56 6
2 3

Graph-based representations
Representing a problem as a graph can provide a different point of view
Representing a problem as a graph can make a problem much simpler More accurately, it can provide the
appropriate tools for solving the problem

What is network theory? Network theory provides a set of
techniques for analysing graphs Complex systems network theory provides
techniques for analysing structure in a system of interacting agents, represented as a network
Applying network theory to a system means using a graph-theoretic representation

What makes a problem graph-like?
There are two components to a graph Nodes and edges
In graph-like problems, these components have natural correspondences to problem elements Entities are nodes and interactions between
entities are edges Most complex systems are graph-like

Friendship Network

Scientific collaboration network

Business ties in US biotech-industry
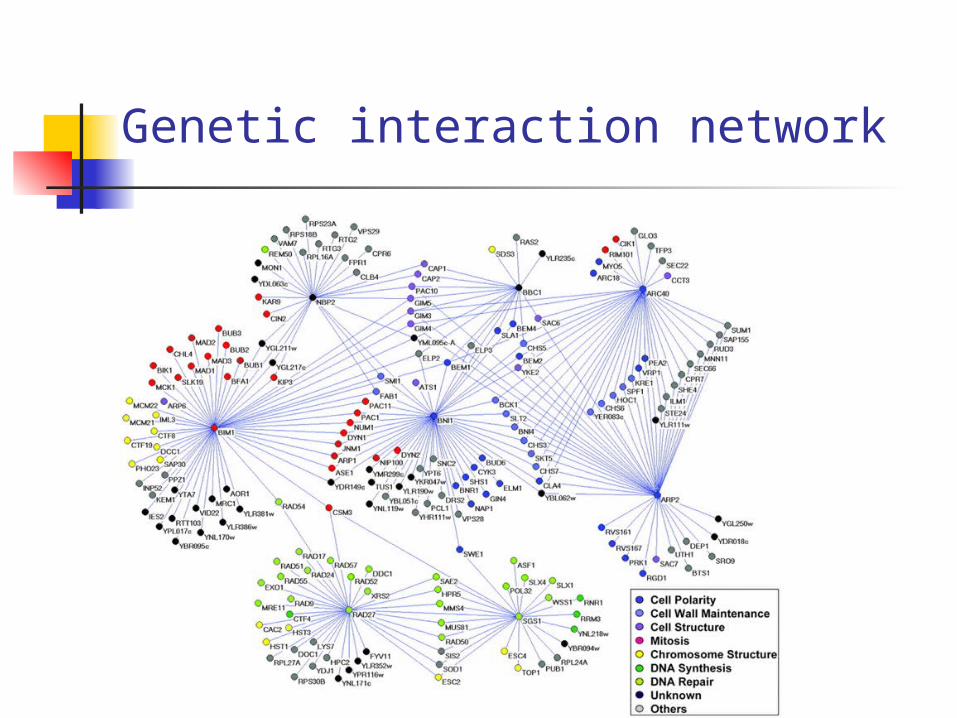
Genetic interaction network

Protein-Protein Interaction Networks

Transportation Networks

Internet

Ecological Networks

Graph Theory - HistoryGraph Theory - HistoryLeonhard Euler's Leonhard Euler's
paper on “paper on “Seven Seven Bridges of Bridges of Königsberg”Königsberg” , ,
published in 1736. published in 1736.


Graph Theory Ch. 1. Fundamental Concept 16
A Model A vertex : a region An edge : a path(bridge) between two
regions
e1 e2
e3
e4
e6
e5
e7
Z
Y
X
W
X
Y
Z
W

Graph Theory - HistoryGraph Theory - HistoryCycles in Polyhedra
Thomas P. Kirkman William R. Hamilton
Hamiltonian cycles in Platonic graphs

Graph Theory - HistoryGraph Theory - History
Gustav Kirchhoff
Trees in Electric Circuits

Graph Theory - HistoryGraph Theory - History
Arthur Cayley James J. Sylvester George Polya
Enumeration of Chemical Isomers

Graph Theory - HistoryGraph Theory - History
Francis Guthrie Auguste DeMorgan
Four Colors of Maps

Definition: GraphDefinition: Graph G is an ordered triple G:=(V, E, f)G is an ordered triple G:=(V, E, f)
V is a set of nodes, points, or vertices. V is a set of nodes, points, or vertices. E is a set, whose elements are known E is a set, whose elements are known
as edges or lines. as edges or lines. f is a function f is a function
maps each element of E maps each element of E to an unordered pair of vertices in V. to an unordered pair of vertices in V.

DefinitionsDefinitions VertexVertex
Basic ElementBasic Element Drawn as a Drawn as a nodenode or a or a dotdot.. VVertex setertex set of of GG is usually denoted by is usually denoted by VV((GG), or ), or
VV EdgeEdge
A set of two elementsA set of two elements Drawn as a line connecting two vertices, called Drawn as a line connecting two vertices, called
end vertices, or endpoints. end vertices, or endpoints. The edge set of G is usually denoted by E(G), The edge set of G is usually denoted by E(G),
or E.or E.

Example
V:={1,2,3,4,5,6} E:={{1,2},{1,5},{2,3},{2,5},{3,4},{4,5},{4,6}}

Simple Graphs Simple graphs are graphs without
multiple edges or self-loops.

Directed Graph (digraph)Directed Graph (digraph) Edges have directionsEdges have directions
An edge is an An edge is an ordered ordered pair of pair of nodesnodes
loop
node
multiple arc
arc

Weighted graphs
1 2 3
4 5 6
.5
1.2
.2
.5
1.5.3
1
4 5 6
2 32
1 35
is a graph for which each edge has an associated weight, usually given by a weight function w: E R.

Structures and structural metrics
Graph structures are used to isolate interesting or important sections of a graph
Structural metrics provide a measurement of a structural property of a graph Global metrics refer to a whole graph Local metrics refer to a single node in a graph

Graph structures Identify interesting sections of a graph
Interesting because they form a significant domain-specific structure, or because they significantly contribute to graph properties
A subset of the nodes and edges in a graph that possess certain characteristics, or relate to each other in particular ways

Connectivity a graph a graph is connected if
you can get from any node to any other by following a sequence of edges OR
any two nodes are connected by a path.
A directed graph is strongly connected if there is a directed path from any node to any other node.

ComponentComponent Every disconnected graph can be Every disconnected graph can be
split up into a number of split up into a number of connected connected componentscomponents..

DegreeDegree
Number of edges incident on a nodeNumber of edges incident on a node
The degree of 5 is 3

Degree (Directed Graphs)Degree (Directed Graphs) In-degree: Number of edges enteringIn-degree: Number of edges entering Out-degree: Number of edges leavingOut-degree: Number of edges leaving
Degree = indeg + outdegDegree = indeg + outdegoutdeg(1)=2 indeg(1)=0
outdeg(2)=2 indeg(2)=2
outdeg(3)=1 indeg(3)=4

Degree: Simple Facts If G is a graph with m edges, then
deg(v) = 2m = 2 |E |
If G is a digraph then indeg(v)= outdeg(v) = |E |
Number of Odd degree Nodes is even

Walks
A walk of length k in a graph is a succession of k(not necessarily different) edges of the form
uv,vw,wx,…,yz.
This walk is denote by uvwx…xz, and is referred toas a walk between u and z.
A walk is closed is u=z.

Graph Theory Ch. 1. Fundamental Concept 35
Chromatic Number The chromatic number of a graph G,
written x(G), is the minimum number of colors needed to label the vertices so that adjacent vertices receive different colors
Red
Green
Blue
Blue
x(G) = 3

PathPath A A pathpath is a walk in which all the edges and is a walk in which all the edges and
all the nodes are different. all the nodes are different.
Walks and Paths 1,2,5,2,3,4 1,2,5,2,3,2,1 1,2,3,4,6
walk of length 5 CW of length 6 path of length 4

Cycle A cycle is a closed walk in which all the
edges are different.
1,2,5,1 2,3,4,5,23-cycle 4-cycle

Special Types of Graphs Empty Graph / Edgeless graphEmpty Graph / Edgeless graph
No edgeNo edge
Null graphNull graph No nodesNo nodes Obviously no edgeObviously no edge

TreesTrees Connected Acyclic Connected Acyclic
GraphGraph
Two nodes have Two nodes have exactlyexactly one path one path between thembetween them
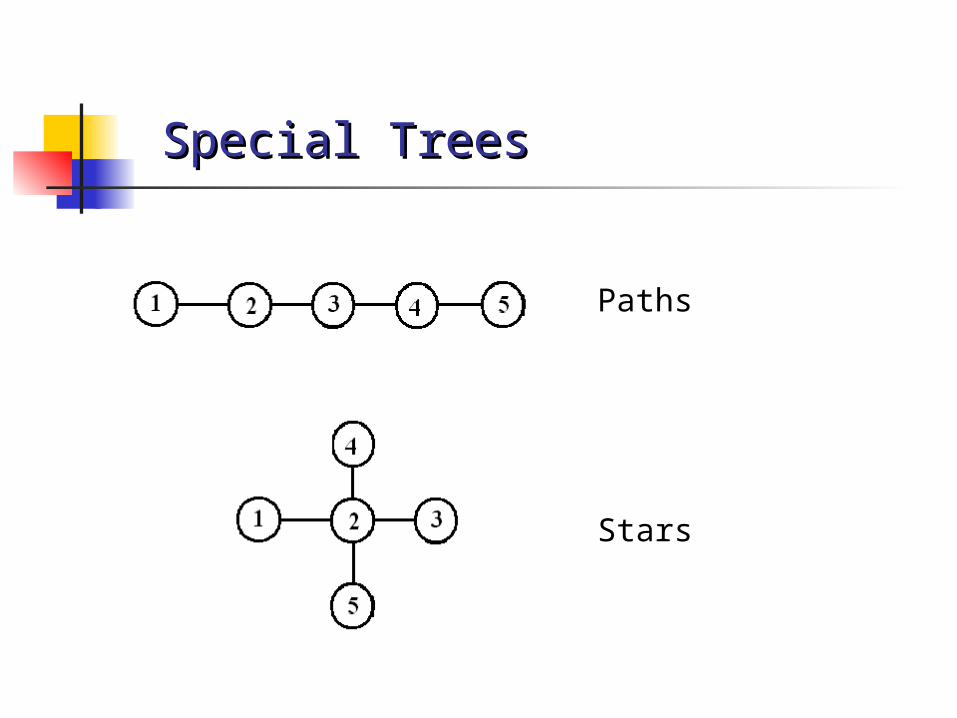
Special TreesSpecial Trees
Paths
Stars

Connected Graph
All nodes have the same degree
Regular

Special Regular Graphs: Cycles
C3 C4 C5

BipartiteBipartite graphgraph VV can be can be
partitioned into 2 partitioned into 2 sets sets VV11 and and VV22 such that (such that (uu,,vv))EE implies implies either either uu VV11 and and vv
VV22 OR OR vv VV1 1 and and uuVV2.2.

Complete GraphComplete Graph Every pair of vertices are adjacentEvery pair of vertices are adjacent Has n(n-1)/2 edgesHas n(n-1)/2 edges

Complete Bipartite GraphComplete Bipartite Graph Bipartite Variation of Complete Bipartite Variation of Complete
GraphGraph Every node of one set is connected Every node of one set is connected
to every other node on the other to every other node on the other setset
Stars

Planar GraphsPlanar Graphs Can be drawn on a plane such that no two Can be drawn on a plane such that no two
edges intersectedges intersect KK44 is the largest complete graph that is planar is the largest complete graph that is planar
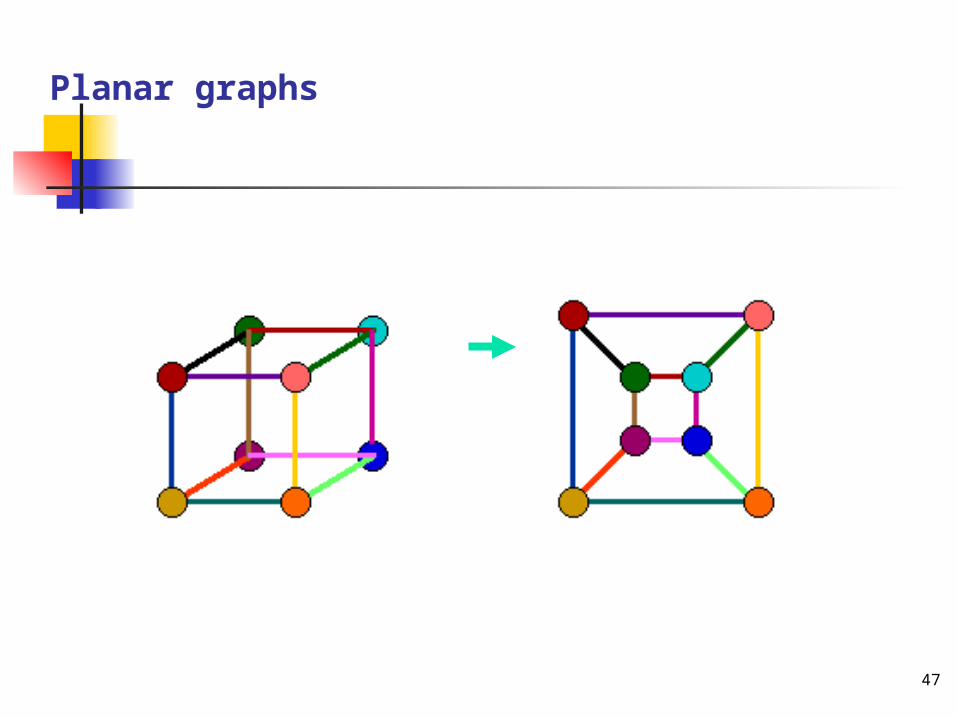
Planar graphs
47

SubgraphSubgraph Vertex and edge sets are subsets Vertex and edge sets are subsets
of those of Gof those of G a a supergraphsupergraph of a graph G is a graph of a graph G is a graph
that contains G as a subgraph. that contains G as a subgraph.

Special Subgraphs: CliquesSpecial Subgraphs: Cliques
A clique is a maximum complete connected subgraph. .
A B
D
H
FE
C
IG

Spanning subgraphSpanning subgraph Subgraph H has the same vertex Subgraph H has the same vertex
set as G. set as G. Possibly not all the edgesPossibly not all the edges ““H spans G”.H spans G”.

Spanning treeSpanning tree Let G be a connected graph. Then Let G be a connected graph. Then
a a spanning treespanning tree in G is a in G is a subgraph of G that includes every subgraph of G that includes every node and is also a tree. node and is also a tree.

IsomorphismIsomorphism Bijection, i.e., a one-to-one mapping:Bijection, i.e., a one-to-one mapping:
f : V(G) -> V(H) f : V(G) -> V(H) u and v from G are adjacent if and only u and v from G are adjacent if and only if f(u) and f(v) are adjacent in H.if f(u) and f(v) are adjacent in H.
If an isomorphism can be constructed If an isomorphism can be constructed between two graphs, then we say those between two graphs, then we say those graphs are graphs are isomorphicisomorphic..

Isomorphism ProblemIsomorphism Problem Determining whether two Determining whether two
graphs are isomorphicgraphs are isomorphic Although these graphs Although these graphs
look very different, they look very different, they are isomorphic; one are isomorphic; one isomorphism between isomorphism between them isthem isf(a)=1 f(b)=6 f(c)=8 f(d)=3 f(a)=1 f(b)=6 f(c)=8 f(d)=3 f(g)=5 f(h)=2 f(i)=4 f(j)=7 f(g)=5 f(h)=2 f(i)=4 f(j)=7

Graph Theory Ch. 1. Fundamental Concept 54
Components 1.2.8
The components of a graph G are its maximal connected subgraphs
An isolated vertex is a vertex of degree 0
r
q
s u v w
t p x
y z

Representation (Matrix)Representation (Matrix)
Incidence MatrixIncidence Matrix V x EV x E [vertex, edges] contains the edge's data [vertex, edges] contains the edge's data
Adjacency MatrixAdjacency Matrix V x VV x V Boolean values (adjacent or not)Boolean values (adjacent or not) Or Edge WeightsOr Edge Weights

MatricesMatrices
1000000601010105111000040010100300011012000001116,45,44,35,23,25,12,1
001000600101151101004001010301010120100101654321

Representation (List)Representation (List) Edge ListEdge List
pairs (ordered if directed) of verticespairs (ordered if directed) of vertices Optionally weight and other data Optionally weight and other data
Adjacency List (node list)Adjacency List (node list)

Implementation of a Graph.Implementation of a Graph. Adjacency-list representation Adjacency-list representation
an array of |an array of |VV | lists, one for each | lists, one for each vertex in vertex in VV. .
For each For each uu VV , , ADJADJ [ [ uu ] points to all ] points to all its adjacent vertices.its adjacent vertices.

Edge and Node ListsEdge and Node ListsEdge List
1 21 22 32 53 34 34 55 35 4
Node List1 2 22 3 53 34 3 55 3 4

Edge List1 2 1.22 4 0.24 5 0.34 1 0.5 5 4 0.56 3 1.5
Edge Lists for Weighted GraphsEdge Lists for Weighted Graphs

Topological Distance
A shortest path is the minimum path A shortest path is the minimum path connecting two nodes. connecting two nodes.
The number of edges in the shortest path The number of edges in the shortest path connecting connecting pp and and qq is the is the topological topological distancedistance between these two nodes, d between these two nodes, dp,qp,q

Degree Centrality
B
ED
C
A
24211
degree
0001000010000111110100110
EDCBA
EDCBA

Betweenness centrality
The number of shortest paths in the graph that pass through the node divided by the total number of shortest paths.
kji
jijkikBC
i j
,
,,,

Betweenness centrality
B
Shortest paths are: AB, AC, ABD, ABE, BC, BD,
BE, CBD, CBE, DBE
B has a BC of 5
A
C
D E
1, ;1,,
1, ;1,,1, ;1,,1, ;1,,1, ;1,,
EDEBDECEBCDBDBCEAEBADADBA

Betweenness centrality
Nodes with a high betweenness centrality are interesting because they control information flow in a network may be required to carry more information
And therefore, such nodes may be the subject of targeted attack

Closeness centrality
j
jidNiCC
,1
The normalised inverse of the sum of topological distances in the graph.

B
ED
C
A
0221220212220111110122110
EDCBA
EDCBA
n
j
jid1
,
64677
Closeness centrality

Closeness centrality
B
ED
C
A Closeness0.671.000.670.570.57
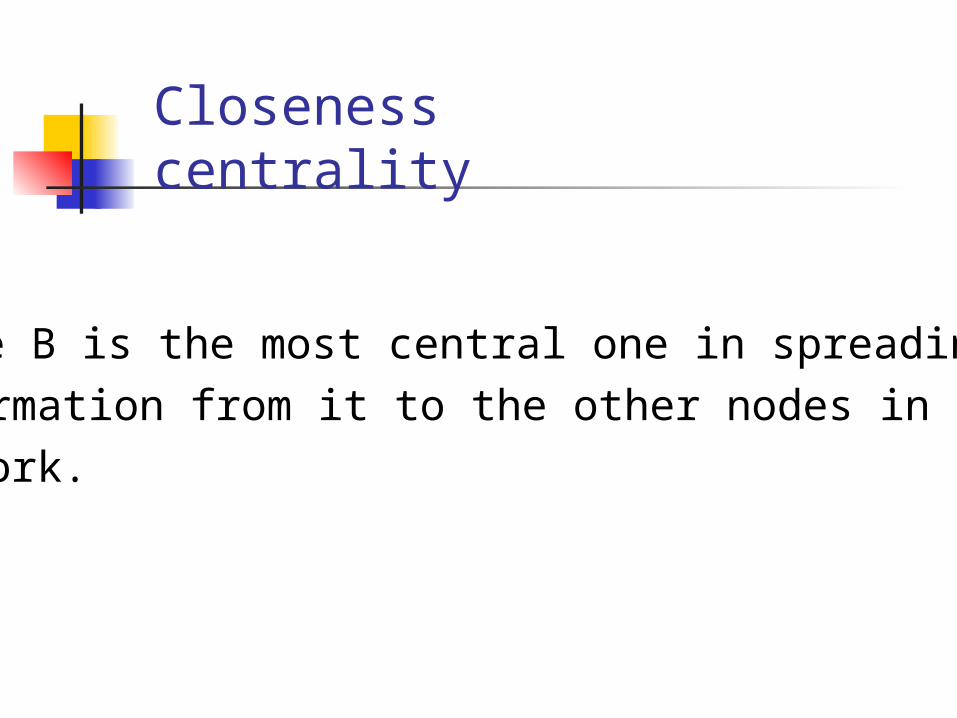
Node B is the most central one in spreading information from it to the other nodes in the network.
Closeness centrality

||VV | x | | x |V |V | matrix D matrix D = ( = ( ddijij ) ) such that such that ddijij is the topological distance between is the topological distance between ii and and jj..
021233620121151101224221012331210123122101654321
Distance MatrixDistance Matrix

A community is defined as a clique in the communicability graph.
Identifying communities is reduced to the “all cliques problem” in the communicability graph.
Communicability Graph

Social (Friendship) Network
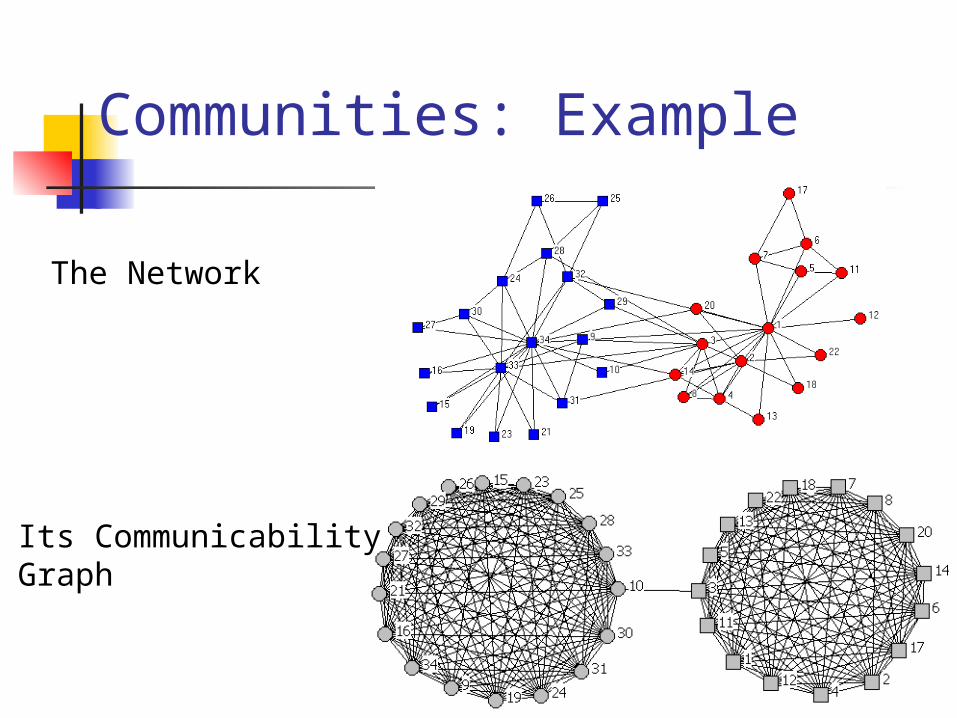
Communities: Example
Communities: Example
The Network
Its Communicability Graph

Communities
Social Networks Metabolic Networks

Social Network Analysis
Introduction

2 5
43
1Diameter
2 5
43
1
Average Path Length
The longest shortest path in a graph
The average of the shortest paths for all pairs of nodes.
76

Characterizing networks:Is everything connected?
77

The adjacency matrix of a network with several components can be written in a block-diagonal form, so that nonzero elements are confined to squares, with all other elements being zero:
CONNECTIVITY OF UNDIRECTED GRAPHS Adjacency Matrix
78

Bridges and Local Bridges0
And edge that joins two nodes A and B in a graph is called a bridge if deleting the edge would cause A and B to lay in two different components
local bridge - in real-world networks (with a giant component) - if deleting an edge between A and B would increase distance > 2
79

Clustering coefficient
80
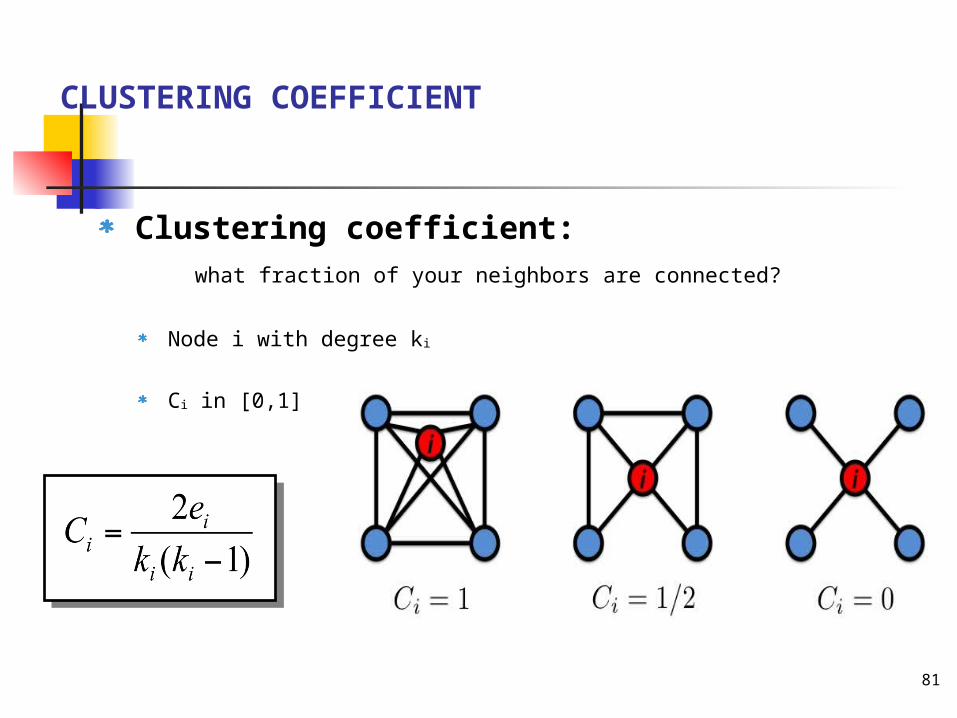
Clustering coefficient: what fraction of your neighbors are connected?
Node i with degree ki
Ci in [0,1]
CLUSTERING COEFFICIENT
81

WWW > directed multigraph with self-interactions
Protein Interactions > undirected unweighted with self-interactions
Collaboration network > undirected multigraph or weighted.
Mobile phone calls > directed, weighted.
Facebook Friendship links > undirected, unweighted.
GRAPHOLOGY: Real networks can have multiple characteristics
82

Undirected networkN=2,018 proteins as nodesL=2,930 binding interactions as links. Average degree <k>=2.90.
Not connected: 185 components the largest (giant component) 1,647 nodes
A CASE STUDY: PROTEIN-PROTEIN INTERACTION NETWORK
83

pk is the probability that a node has degree k.
Nk = # nodes with degree k
pk = Nk / N
A CASE STUDY: PROTEIN-PROTEIN INTERACTION NETWORK
84

dmax=14
<d>=5.61
A CASE STUDY: PROTEIN-PROTEIN INTERACTION NETWORK
85

<C>=0.12
A CASE STUDY: PROTEIN-PROTEIN INTERACTION NETWORK
86
Real network properties
Most nodes have only a small number of neighbors (degree), but there are some nodes with very high degree (power-law degree distribution)
scale-free networks If a node x is connected to y and z, then y and z
are likely to be connected high clustering coefficient
Most nodes are just a few edges away on average. small world networks
Networks from very diverse areas (from internet to biological networks) have similar properties
Is it possible that there is a unifying underlying generative process?
87

The basic random graph model The measurements on real networks are
usually compared against those on “random networks”
The basic Gn,p (Erdös-Renyi) random graph model:
n : the number of vertices 0 ≤ p ≤ 1 for each pair (i,j), generate the edge (i,j)
independently with probability p

Degree distributions
Problem: find the probability distribution that best fits the observed data
degree
frequency
k
fk
fk = fraction of nodes with degree kp(k) = probability of a randomly selected node to have degree k

Power-law distributions The degree distributions of most real-life networks follow a
power law
Right-skewed/Heavy-tail distribution there is a non-negligible fraction of nodes that has very high
degree (hubs) scale-free: no characteristic scale, average is not informative
In stark contrast with the random graph model! Poisson degree distribution, z=np
highly concentrated around the mean the probability of very high degree nodes is exponentially
small
p(k) = Ck-
zkek!
zz)P(k;p(k)

Power-law signature Power-law distribution gives a line in the log-log plot
: power-law exponent (typically 2 ≤ ≤ 3)degree
frequency
log degree
log frequency α
log p(k) = - logk + logC

Power LawsAlbert and Barabasi (1999)
Power-law distributions are straight lines in log-log space.
-- slope being ry=k-r log y = -r log k ly= -r lk
How should random graphs be generated to create a power-law distribution of node degrees?
Hint: Pareto’s* Law: Wealth distribution follows a power law.
Power laws in real networks:(a) WWW hyperlinks(b) co-starring in movies(c) co-authorship of physicists(d) co-authorship of neuroscientists
* Same Velfredo Pareto, who defined Pareto optimality in game theory.

Examples of degree distribution for power laws
Taken from [Newman 2003]

A random graph example

What is a Logarithm? The common or base-10 logarithm of
a number is the power to which 10 must be raised to give the number.
Since 100 = 102, the logarithm of 100 is equal to 2. This is written as:
Log(100) = 2. 1,000,000 = 106 (one million), and
Log (1,000,000) = 6.

Years before present (YBP)Formation of Earth 4.6 x 10⁹ YBPDinosaur extinction 6.5 x 10⁷ YBPFirst hominids 2 x 10⁶ YBPLast great ice age 1 x 10⁴
YBPFirst irrigation of crops 6 x 10³ YBPDeclaration of Independence 2 x 10² YBPEstablishment of UWB 1 x 10 YBP

Data plotted with linear scale
Events from Table I
0.E+001.E+092.E+093.E+094.E+095.E+09
Earth
Dinosa
urs
Homini
ds
Ice A
ge
Irriga
tion
Indepe
ndenc
eUW
B
Year
s be
fore
pre
sent
All except the first two data points are hidden on the axis.

Log (YBP)EVENT YBP Log(YBP)Formation of Earth 4.6 x 10⁹ 9.663Dinosaur extinction 6.5 x 10⁷ 7.813First hominids 2 x 10⁶ 6.301Last great ice age 1 x 10⁴
4.000First irrigation of crops 6 x 10³ 3.778Declaration of Independence 2 x 10² 2.301Establishment of UWB 1 x 10 1.000

Plot using LogsEvents from Table I
02468
10
Earth
Dinosa
urs
Homini
ds
Ice A
ge
Irriga
tion
Indepe
ndenc
eUW
B
Log(
YBP)
All data are well represented despite their wide range.

Your calculator should have a button marked LOG. Make sure you can use it to generate this table.
N N as power of 10 Log (N)1000 103 3.000200 102.301 2.30175 101.875 1.87510 101 1.0005 100.699 0.699

Copyright © by Houghton Mifflin Company, Inc. All rights reserved. 101
x
y
Graph f (x) = log2
xSince the logarithm function is the inverse of the exponential function of the same base, its graph is the reflection of the exponential function in the line y = x.
8342
21
10
–1
–22xx
41
21
y = log2 x
y = xy = 2x
(1, 0)x-intercept
horizontal asymptote y = 0
vertical asymptote x = 0

Example Sketch the graph of the function y =
ln x.Solution We first sketch the graph of y = ex.
11xx
yy
11
yy = = eexx
yy = = ln ln xx
yy = = xx
The required graph is The required graph is the the mirror imagemirror image of the of the graph of graph of yy = = eexx with with respect to the line respect to the line y y == x x::

Exponential distribution Observed in some technological or
collaboration networks Identified by a line in the log-linear plot
p(k) = e-k
log p(k) = - k + log
degree
log frequency λ

104
An Experiment by Milgram (1967) Outcome revealed two fundamental
components of a social network: Very short paths between arbitrary pairs of
nodes
Individuals operating with purely local information are very adept at finding these paths

105
What is the “small world” phenomenon?
Principle that most people in a society are linked by short chains of acquaintances
Sometimes referred to as the “six degrees of separation” theory

ReferencesAldous & Wilson, Graphs and Applications. An Introductory Approach, Springer, 2000. Wasserman & Faust, Social Network Analysis, Cambridge University Press, 2008.Estrada & Rodríguez-Velázquez, Phys. Rev. E 2005, 71, 056103.Estrada & Hatano, Phys. Rev. E. 2008, 77, 036111.

107
QuestionsQuestions??

![Localized Content Based Image Retrievalsg/accio/mir162ss-rahmani.pdf · Localized Content Based Image Retrieval [Extended Abstract] Rouhollah Rahmani, Sally A. Goldman, Hui Zhang,](https://static.fdocuments.in/doc/165x107/5b25dbe67f8b9aaa4d8b45b2/localized-content-based-image-sgacciomir162ss-rahmanipdf-localized-content.jpg)