Graph Clustering Analysis of Protein -Protein …Graph Clustering Analysis of Protein -Protein...
22
Graph Clustering Analysis of Protein-Protein-Interaction Network relate to Zika Virus J. Susymary 1 , R. Lawrance 2 1 Department of Computer Science, Ayya Nadar Janaki Ammal College, Sivakasi, Tamil Nadu, India, [email protected] 2 Department of Computer Applications, Ayya Nadar Janaki Ammal College, Sivakasi, Tamil Nadu, India, [email protected] Abstract. Graph mining is an ongoing aspect notably to dig up unique and interesting facts from data that is pictured as a graph. The objective of this research work is to find protein complexes from the pairwise protein-protein-interaction network relate to zika virus in order to make advance in drug design and therapeutic purpose. Graph data like protein-protein interaction network is ubiquitous in actuality so that graph theory means of analysis to network can advantage supplementary findings of proteins associated with positive topological characteristic have precise biological function. Distinct graph mining techniques such as frequent subgraph mining, clustering, classification is feasible to figure out the protein- protein-interaction networks. Clustering is a specific well-known technique to boast a class of proteins with related biological function. Markov Cluster Algorithm based on flow simulation method over network of proteins linked with zika virus has been analytically gauged and indicated how interesting clusters are raised. These clusters will be the protein complexes that work together to carry out specific biological function in a cell. That means proteins in a cluster will be functionally homogeneous. A comparative analysis of the results obtained from other two graph based clustering algorithms, Molecular Complex Detection Algorithm and Louvain Cluster Algorithm lodged on local neighbourhood density search method and population based stochastic search method respectively, taken to figure out the performance of clustering outcome obtained from Markov Cluster Algorithm. Keywords. Graph mining, graph clustering, protein-protein interaction network, zika virus. 1. INTRODUCTION Graph mining is an augmenting area with a perspective to discover contemporary facts from complex data that can be represented as a graph. Graph data is omnipresent in real world application domains such as science, industry, and more. Graph can illustrate the data that take forms such as vector data, time series data, sequence data, and data with uncertainty. According to the area of exercising, graph can represent data in a broad spectrum that shows relationship between the objects. Bioinformatics is an interdisciplinary field that combines biology, computer science, mathematics, statistics and engineering. The main goal of bioinformatics is to International Journal of Pure and Applied Mathematics Volume 119 No. 16 2018, 4303-4324 ISSN: 1314-3395 (on-line version) url: http://www.acadpubl.eu/hub/ Special Issue http://www.acadpubl.eu/hub/ 4303
Transcript of Graph Clustering Analysis of Protein -Protein …Graph Clustering Analysis of Protein -Protein...

Graph Clustering Analysis of Protein-Protein-Interaction
Network relate to Zika Virus
J. Susymary1, R. Lawrance
2
1Department of Computer Science, Ayya Nadar Janaki Ammal College, Sivakasi, Tamil
Nadu, India, [email protected]
2Department of Computer Applications, Ayya Nadar Janaki Ammal College, Sivakasi,
Tamil Nadu, India, [email protected]
Abstract. Graph mining is an ongoing aspect notably to dig up unique and interesting facts from data
that is pictured as a graph. The objective of this research work is to find protein complexes
from the pairwise protein-protein-interaction network relate to zika virus in order to make
advance in drug design and therapeutic purpose. Graph data like protein-protein interaction
network is ubiquitous in actuality so that graph theory means of analysis to network can
advantage supplementary findings of proteins associated with positive topological
characteristic have precise biological function. Distinct graph mining techniques such as
frequent subgraph mining, clustering, classification is feasible to figure out the protein-
protein-interaction networks. Clustering is a specific well-known technique to boast a class
of proteins with related biological function. Markov Cluster Algorithm based on flow
simulation method over network of proteins linked with zika virus has been analytically
gauged and indicated how interesting clusters are raised. These clusters will be the protein
complexes that work together to carry out specific biological function in a cell. That means
proteins in a cluster will be functionally homogeneous. A comparative analysis of the
results obtained from other two graph based clustering algorithms, Molecular Complex
Detection Algorithm and Louvain Cluster Algorithm lodged on local neighbourhood
density search method and population based stochastic search method respectively, taken
to figure out the performance of clustering outcome obtained from Markov Cluster
Algorithm.
Keywords. Graph mining, graph clustering, protein-protein interaction network, zika
virus.
1. INTRODUCTION
Graph mining is an augmenting area with a perspective to discover contemporary facts
from complex data that can be represented as a graph. Graph data is omnipresent in real
world application domains such as science, industry, and more. Graph can illustrate the
data that take forms such as vector data, time series data, sequence data, and data with
uncertainty. According to the area of exercising, graph can represent data in a broad
spectrum that shows relationship between the objects.
Bioinformatics is an interdisciplinary field that combines biology, computer science,
mathematics, statistics and engineering. The main goal of bioinformatics is to
International Journal of Pure and Applied MathematicsVolume 119 No. 16 2018, 4303-4324ISSN: 1314-3395 (on-line version)url: http://www.acadpubl.eu/hub/Special Issue http://www.acadpubl.eu/hub/
4303

2
computationally analyse biological data. Since, biological data are too complex, graph
modelling and graph theory based analysis have been done to interpret knowledge from
protein-protein interaction.
Protein-protein interaction (PPI) form large networks. It is the pairwise or complex
representation of interacting proteins. Visualization and analysis of protein-protein-
interaction network helps in pin pointrole of interacting proteins and brings a new insight
about the function of proteins individually or as in a group. Several methods available to
analyse protein-protein interaction such as biological methods, vector algebra based
methods, statistical methods and more over graph based methods. Topological property
analysis of protein-protein interaction graph can lead to the better understanding of
functions of proteins individually and as in a group.
1.1 Graph Mining
Graph mining works on capturing topological properties and other relational
characteristics of data that can be represented as graph. It is the process of extracting
subgraphs from graphs to find a useful information regarding the data which the graph is
associated. Many graph mining algorithms have been developed to find insight knowledge
from the networks. Examples include MCODE, Louvain Cluster, MCL etc.
1.2 Graph clustering
Graph clustering is the task of grouping of objects based on some similarity measures.
Graph clustering has two perspectives. Intra graph clustering and inter graph clustering.
Intra graph clustering is the process of grouping objects within a single graph and inter
graph clustering method clusters between graphs. The intra graph clustering method focus
on both vector based and graph based. Vector based clustering is of purely distance based
and graph based clustering is based on the topological properties of the graph.Graph based
clustering modeclearly uses graph theoretical points of graph to cluster the data that is
represented as a graph.
1.3 Graph
A graph is a collection of vertices or nodes or points which are connected by a set of edges
or links or arcs. G= (V, E) is a graph such that, each edge e∈E(G) is a pair of vertices (v1,
v2) ∈ V(G). A vertex is a single point or a connection point in a graph. An edge in a graph
G is an unordered pair of two vertices (v1, v2) such that v1∈V(G) and v2∈V(G).The most
important characteristic of a graph is the degree or connectivity of a vertex. The degree of
a vertex is the number of other vertices connected to it.Clustering Coefficient is the
dimension that spectacle the bias of a graph to be split into clusters. A cluster is a subset of
vertices that encloselarge number of edges connecting these vertices to each other.
Assuming that i is a vertex with degree deg(i) = k in an undirected graph G and that there
are e edges between the k neighbors of i in G, then the Local ClusteringCoefficient of i in
G is given by the equation (1.3.1).
𝐶𝑖 =2ⅇ
𝑘 𝑘−1 (1.3.1)
International Journal of Pure and Applied Mathematics Special Issue
4304

3
Thus, Cimeasures the ratio of the number of edges between the neighbors of i to the total
possible number of such edges, which is k (k- 1)/ 2. It takes values as 0 ≤ Ci≤ 1. The
average Clustering Coefficient of the whole network 𝑐𝑎𝑣𝑒𝑟𝑎𝑔𝑒 is given by the equation
(1.3.2).
𝑐𝑎𝑣𝑒𝑟𝑎𝑔𝑒 =1
𝑁
𝐸𝑖
𝑘𝑖 𝑘𝑖−𝑖
𝑁
𝑖=1 (1.3.2)
where N=|V| is the number of vertices. The closer the local clustering coefficient is to 1,
the more likely it is for the network to form clusters.
The main data structure [1] used to store network representation is adjacency matrix.
Given a graph G such that V(G)= {v1, v2, …, vn}, the adjacency matrix representation of G
is a n×n matrix. If ar, cis the value in the matrix at row r and column c, then ar, c=1 if vr is
adjacent to vc; otherwise, ar, c=0. Adjacency matrices require space of Θ (|n|2)
1.4 Protein-protein Interaction
A cell is composed of several biochemical compounds such as DNA, RNA and proteins
[2]. Proteins are the most important molecule groups in a living cell. The central dogma of
the cell function is that the information from the DNA is transmitted to RNA which is in
turn transmitted to proteins.Proteins are the information molecules which carries
information from one cell to another. Not every protein interacts. Only proteins which
possesses signalling properties will interact with each other.Thus, the function of a living
cell is performed by the interacting proteins.
1.5 Gene Ontology
Gene Ontology (GO)[3], is the structure for the miniature of biology. The GO characterize
notions or classes used to express gene function, and relationships between these notions.
It segregate functions along three facets:
Molecular function: molecular states of gene products
Cellular component: where gene products are effective
Biological process: pathways and larger processes containing the states of
multiple gene products.
One of the primaryneed of the GO is to execute enrichment analysis on gene sets. For
example, obsessed a set of genes that are upregulated under certain conditions, an
enrichment analysis will find which GO terms that are over-represented or under-
representedusing annotations for that gene set.Functional enrichment can be done using
external tools like Geneprof [4].
2. LITERATURE REVIEW
Literature review is the summary and synthesis of previously published research papers
refers on topic for the research. A summary is a recap of the important information of the
International Journal of Pure and Applied Mathematics Special Issue
4305

4
source papers but synthesis is a reorganization or reshuffling of that information. It
includes substantive findings as well as theoretical and methodological contributions to the
selected topic.
Clustering access to protein-protein-interaction networks can be commonlysort as vector
based, which is free of topology and graphbased. Vector basedmethod use traditional
clustering techniques by adopting assumptions of distance between the vertices and do not
consider topology of the network. Graphbased clustering method consider rather topology
of the network, and generallycommit on specific clustering techniques.In graphbased
method, a protein-protein-interaction network is modelled as an undirected graph, where
the vertices correspond to proteins, and the edges correspond tointeracting proteins.In the
existing articles, most of them have used graph based approach to cluster the proteins.
Bader, G., et al. [5] introduce an algorithm, MCODE which establishes local
neighbourhood density search method.This accession detects dense and connected locality
by weighting vertices on the ground of their local neighbourhood density.
Dongen, S, V., [6] introduce an algorithm, MCL which is based on the flow simulation
method. The order to be followed at each vertex is likely by chance known as random
walks. Inter-graph simulation is done by toughening flow where it is strong andlessening it
where it is weak. The inflation parameter influences the number of clusters.
Blondel, V, D., et al. [7] propose a simple method known as Louvain Cluster which is
based on the population based stochastic search method to extract the community structure
of large networks. Louvain cluster is a graph based clustering method which uses quality
function known as modularity.
The goal of this review is to provide a compact overview of the preeminentmeans of
PPInetwork clustering.Table 2.1 shows the overview of PPI clustering methods.
Table 2.1.Overview of PPI Clustering Methods
Method Author Description
MCODE Bader, G., et al. [5] Bottom up approach, returns dense clusters with overlap.
MCL Dongen, S, V., [6] Top down approach, returns arbitrary clusters without overlap.
Louvain
Cluster Blondel, V, D., et al. [7] Top down approach, returns dense clusters without overlap.
Graph based clustering algorithms are application specific. That means, an algorithm
works well in one application may not suitable for another. Among the reviewed
algorithms, MCODE, MCL and Louvain cluster use only topological properties of the
graph and have good performance in large sparse graph. But MCODE having a bottom up
approach, will not assign all the proteins to the clusters. Louvain Cluster, being a
community detection algorithm, return high performance if and only if, the modularity is
high. MCL use only topological properties of the graph to cluster, return clusters without
overlap and have a top down approach with good performance in large sparse graph. It can
be inferred that MCL suit well for the graph theoretical analysis of protein-protein
interaction networks to find group of proteins with related biological process.
International Journal of Pure and Applied Mathematics Special Issue
4306

5
3. DATASET DESCRIPTION
In 1947, a virus has been first discovered in a rhesus monkey in Uganda‟s Zika forest
[8]and [9]. It is named as Zika virus [10]. Some years later the first human case was
reported in Nigeria [11].In India, the zika virus which has no cure or vaccine was found 64
years ago, spread by air travellers. Vigilant attention has been raised against this virus
since it can be spread by aedes aegypti mosquitoes [12] which is a carrier of dengue,
yellow fever, chikungunya etc.At first, the disease linked with this virus are fever, malaise,
skin rash, conjunctivitis, muscle pain, join pain, headache etc. After that it is found that the
virus is linked with virulent form of diseases related to neurological disorders such as
swelling of brain and spinal cord, microcephaly-abnormally small heads and brains in
foetuses [13] etc. The zikavirus is a member of flavivirus genus family known as
flaviviridae. This genome encodes for a polyprotein with three structural proteins and
seven non-structural proteins. Figure 3.1 shows the zika virus genome structure [10].Three
structured proteins include capsid C, pre-membrane/membrane prM, and envelope E and
seven non-structured are NS1, NS2A, NS2B, NS3, NS4A,NS4B and NS5.
Figure 3.1. Zika Virus Genome Structure [10]
Since proteins are the information molecules that carries signals from one protein to
another, which interact with each other, significant biological processes in the human body
can be extremely difficult to understand without extensive analysis of protein-protein
interaction. In order to analyse the effect of virus proteins with the interacting proteins in
the human body, and the resultant biological process after the interaction of these proteins,
an effective graph based clustering on protein-protein interaction has been done with the
virus network.
Biological networks are the starting point of many studies for understanding and curing
human diseases. A protein–protein interaction (PPI) involves two or more proteins binding
together, often to carry out a biological function. A set of protein-protein interactions
occurring at the same time and location of the cell is known as a complex of proteins. A
protein-protein interaction network is a collection of PPIs, often deposited in online
databases.BioGrid [14] is an integrated PPI database of predicted interactions. The
BioGrid database can be accessed directly in R studio and protein-protein interaction
network can be obtained by specifying the protein identifiers.
In a PPI graph, vertices represent proteins and edges represent interaction between proteins.
Since a protein-protein interaction graph possess certain characteristics such as small world
effect, scale free and dissassorative in nature, a forced directed layout model has been used
to obtain the network. Kamada, T., et al. [15] put forward that in the case of protein-protein
interaction graph, the reduction of the number of edge crossings that a graph possesses is
not a good criterion for a layout algorithm to implement. It states that the entire balance of
the design which is relevant to the raised three prime characteristics is fair as crucial, or can
International Journal of Pure and Applied Mathematics Special Issue
4307

6
be consider more crucial than the cutback of edge crossings in the graph of protein-protein
interaction.BioGrid uses this approach to create protein-protein interaction networks.A
Kamada-Kawai model network has been then constructed from the set of non-structured
protein identifiers and the integrated PPI database, BioGrid. The seven non-structured
proteins namely „NS1‟, „NS2A‟, „NS2B‟ „NS3‟, „NS4A‟, „NS4B‟, and „NS5‟ known to be
implicated in zika virus is uploaded to BioGrid and protein-protein interaction
networkrelated to these proteins is obtained by using „igraph‟ [16] package in conjunction
with „ProNet‟
[17] package in R studio development environment. The resulting network contain 264
proteins and 4958 interactions.Figure 3.2 shows a part of the constructed protein-protein-
interaction network relate to zika virus.Figure 3.3 shows the adjacency matrix
representation of the part protein-protein interaction graph of 264 vertices and 4958
edges.The overall topological properties of the protein-protein interaction network with
respect to the original BioGrid network is given in the Table 3.1.
Table 3.1. Topological properties of the PPI Network
Topology PPI Network
Number of nodes 264.0000
Number of edges 4948.0000
Isolated nodes 0.0000
Connected components 1.0000
Network diameter 5.0000
Average path length 2.2858
Avg. number of neighbours 16.3561
Ave. Degree 37.5606
Avg. clustering coefficient 0.3339
Avg. Betweenness 169.0871
4. WORKING PROCESS
The proposed model for finding proteins with related biological processes from protein-
protein-interaction network relate to zika virus consists of four phases:
Pre-processing
Figure 3.2. PPI Network
Figure 3.3. Adjacency matrix
representation of PPI Network
International Journal of Pure and Applied Mathematics Special Issue
4308

7
Clustering model
Post processing
Validation
The pre-processing phase makes the data structure ready for the clustering model. The
algorithm based of the flow simulation method is applied in the clustering model phase.
Then, fine tuning of the clusters will be done in the post processing phase. Finally,
community significance and biological validation of the clusters will be done.
4.1 Pre-processing
In order to obtain fine clusters, the algorithm specifies some pre-processing steps. Figure
4.1.1 shows the compact view of required pre-processing steps.
Figure 4.1.1. Phase 1: Pre-processing
For the explanation, consider the Figure 4.1.2 which is a part of the constructed protein-
protein-interaction network relate to zika virus that contains 9 vertices and 17 edges.Figure
4.1.3 shows the adjacency matrix representation of the Figure 4.1.2.
International Journal of Pure and Applied Mathematics Special Issue
4309

8
Not all, but some vertices of the obtained protein-protein interaction network consist of
multiple edges. Multiple edges mean, edges share same set of vertices. Since the
constructed protein-protein interaction graph is an undirected graph, an edge represented
as a pair of vertices, {A.B} is same as {B, A}. So, it is feasible to remove the multiple
edges by applying simplify function using „igraph‟ object in R development environment.
The simplified network contains 9 vertices and 10 edges. Figure 4.1.4 shows simplified
protein-protein interaction network. The obtained simplified network can be represented in
the form of adjacency matrix. Figure 4.1.5 shows the adjacency matrix representation of
the simplified protein-protein interaction network that contains nine proteins and ten
interactions related to zika virus.
Casting self-loops to each node create a 1 length narrow path. Adding a dependence to the
transition probabilities makes weights appear during odd as well as even powers of matrix,
which in turn makes the path simpler. Figure 4.1.6 shows the protein-protein interaction
network with 9 vertices after adding self-loops. The obtained network can be represented
in the form of adjacency matrix. Figure 4.1.7 shows the adjacency matrix representation of
the protein-protein interaction network related to zika virus after adding self-loops to each
node. After adding self-loops, the 9 × 9 square matrices are diagonally 1.
Figure 4.1.5. Adjacency matrix for the
Simplified PPI Network with 9 vertices and
10 edges
Figure 4.1.4. Simplified PPI
Network with 9 vertices and 10
edges
Figure 4.1.3. Adjacency matrix for the
PPI Network with 9 vertices and 17
edges
Figure 4.1.2. PPI Network with 9
vertices and 17 edges
International Journal of Pure and Applied Mathematics Special Issue
4310

9
To
turn the matrix into a transition probability matrix, normalize the matrix column wise in a
way that each element is obtained by dividing that element by the sum of the elements in
the specific column.Figure 4.1.8 shows the resulting 9×9 matrix after normalization.This
matrix will be the current probability matrix for the calculation of Markov matrix.
Figure 4.1.8. Resulting matrix after normalization
4.2 Clustering Model
Figure 4.2.1 shows the compact view of the clustering model in the phase 2.
Figure 4.1.7. Adjacency matrix
representation of the PPI Network after
adding self-loops
Figure 4.1.6. PPI Network after
adding self-loops
International Journal of Pure and Applied Mathematics Special Issue
4311

10
Figure 4.2.1. Phase 2: Clustering Model
In view of a graph, intra-cluster connections are high, and inter-cluster connections are
less. On account of this,starting from a node, and then randomly traversing to a connected
node, there are more chances to being in cluster than between clusters. Markov Cluster
Algorithm [18] is based on this concept.MCL algorithm comprises of two processes
namely expansion and inflationand are intersperseagain and again. Expansion is done by
taking the Markov Chain transition matrix powers. The expansion parameter is responsible
for the connection in the graph. The inflation parameter is responsible for both
strengthening and weakening of the flow.Figure 4.2.2 shows the matrix obtained for the
protein-protein interaction graph with 9 vertices and 10 edges after applying expansion
parameter 2 in the first iteration. Figure 4.2.3 shows the matrix obtained for the protein-
protein interaction graph with 9 vertices and 10 edges after applying inflation parameter 2
in the first iteration.
Figure 4.2.2. Matrix after applying the expansion parameter 2 in the first iteration
International Journal of Pure and Applied Mathematics Special Issue
4312

11
Figure 4.2.3. Matrix after applying the inflation parameter 2 in the first iteration
MCL Algorithm Convergence: In essence, the Markov Cluster Algorithm converges to a
steady statematrix in which eachelement in a single column has the same value and strictly
homogeneous.For the protein-protein interaction graph with 9 vertices and 10 edges, the
convergence stage occurs after 14 iterations. Figure 4.2.4 shows the resulting equilibrium
state matrix. Figure 4.2.5 shows the corresponding equilibrium state matrix with row and
column name as protein names.
MCL Interpreting Clusters: The resulting clusters are obtained by splitting the
verticesinto two types. Vertices which attract other vertices and vertices that are being
attracted. Vertices that are attracting other vertices and vertices that are being attracted
have positive values within its row.These vertices are grouped together into the same
cluster. Thus, MCL results two clusters for the protein-protein interaction graph with 9
vertices and 10 edges. Figure 4.2.6 shows the resulting row wise cluster from the
equilibrium state matrix for the graph.APP YWHAZ SFN NR3C1 HNRNPA1 MAPK8},
and {HSPA5 YBX1 RAP1} are obtained two clusters. Figure 4.2.7 and Figure 4.2.8 shows
the respected induced subgraph for the resulting two clusters for the protein-protein
interaction graph with 9 vertices and 10 edges.
Figure 4.2.5. Equilibrium State Matrix with
row and column name as proteins
Figure 4.2.4. Equilibrium State
Matrix after 14 iterations
International Journal of Pure and Applied Mathematics Special Issue
4313

12
4.3 Post Processing
The third phase of the proposed model is post processing. Proteins with the identical
biological processendure in alike cluster. Figure 4.3.1 represents the post processing phase.
Figure 4.3.1. Phase 3: Post Processing
The algorithm performsound when diameter of the resulting subgraphis small. Granularity
ofcluster, that is clustering coefficient or transitivity should be good. The inflation
parameter affects cluster granularity.Number of resulting clusters will not be specified in
advance, but granularity of resulting clusters can be alteredwith parameters [21]. Here the
inflation parameter determines the number of clusters.For the whole data, that is, for the
protein-protein interaction network with 264 vertices and 4958 vertices, the inflation
parameter, which should be greater than 0 have been tuned in order to get clusters with
good granularity. Here, there isn‟t a considerable variation of clustering coefficient,
number of clusters and the number of vertices in the resulting clusters for the inflation
parameter up to 1.5. A sensible variation occurs with the inflation parameter between 1.5
and 2.5. According to the clustering coefficient obtained for each cluster, the resultant
clusters for the protein-protein interaction graph are determined. For the inflation
parameter 2.5 onwards, it seems no possible clusters formed.
4.4 Validation
There are two kinds of evaluation that can take place in the graph based clustering model
for the protein-protein interaction network related to zika virus:
Community significance test [22]
Biological validation [22]
4.4.1 Community Significance test
Community significance test is an intuitive assessment of cluster quality. This is relevant
to the evaluation of clustering performance. Mann-Whitney U- test [23]has been done for
Figure 4.2.8.
Subgraph for Cluster
2
Figure 4.2.7.
Subgraph for Cluster
1
Figure 4.2.6. Cluster
interpretation
International Journal of Pure and Applied Mathematics Special Issue
4314

13
the resulting clusters of the protein-protein interaction network with 264 proteins and 4958
interactions.
Mann - Whitney U-test:Mann-Whitney-U-test is a non-parametric evaluation of the null
hypothesis that is uniformlypossible that a randomly picked value from one will be less
than or greater than a randomly picked value from a second sample.It is performed on the
mean degree of the vertices in the cluster and the constructed protein-protein interaction
network. The formulae for the Mann-Whitney-U-test is given in the equations (4.4.1.1)
and (4.4.1.2).
𝑈1 = 𝑅1 −𝑛1 𝑛1+1
2 (4.4.1.1)
Where𝑛1 is sample size for sample 1 and 𝑅1 is sum of ranks in sample 1.
𝑈2 = 𝑅2 −𝑛2 𝑛2+1
2 (4.4.1.2)
Where 𝑛2is sample size for sample 2 and 𝑅2 is sum of ranks in sample 2. Mann-
Whitney𝑈will be the smallest of𝑈1and𝑈2
4.4.2 Biological Validation
It is the validation based on the authenticity of the clusters, which point out the prospect
that the cluster architecture has not emanate by chance. The implication of the derived
clusters is ordinarily measured by p-value.Clusters needs to be validate using the domain
knowledge. That means make sure that clusters make sense biologically. The most
efficient way of computationally performing biological validation is functional enrichment
analysis.Functional enrichment analysis typically makes use of hypergeometric test to
analyse the clusters identified. The method works on the principal that if a set of proteins
represent a protein complex, then those proteins work together to carry out a single
biological function. That is, proteins are functionally homogeneous.The main biological
process of the proteins associated with the interaction of zika virus network is given as
follows:
GO_term GOID Vertices
signal transduction GO:0007165 17
nerve growth factor receptor signalling pathway GO:0048011 17
synaptic transmission GO:0007268 16
response to drug GO:0042493 15 ethanol oxidation GO:0006069 14
energy reserve metabolic process GO:0006112 14
blood coagulation GO:0007596 14 cellular lipid metabolic process GO:0044255 14
cAMP biosynthetic process GO:0006171 13
G-protein coupled receptor protein signalling pathway GO:0007186 13
The list of all proteins in the organism along with the associated GO terms is taken as the
population (P) for the hypergeometric test. The list of all proteins in the cluster with their
corresponding GO terms is taken as the sample (S). This is to check if a particular GO
International Journal of Pure and Applied Mathematics Special Issue
4315

14
term enriches the cluster or cluster is biased to this term. Let the GO term testing be GOt.
The proteins in the population that are annotated with GOt are the successes in the
population (Psu). The proteins in the sample cluster that are annotated with GOt are the
successes in the sample (Ssu). A p-value to quantify the biological significance is
calculated using the hypergeometric principle using the formula (4.4.2.1).
(4.4.2.1)
A threshold 0.05 is used to determine if p-value denotes significance or not. Any GO term
resulting in p-value below or equal to 0.05 is said to significantly enrich the cluster.
5. RESULTS AND DISCUSSION
This section provides the clustering results of protein-protein-interaction network relate to
zika virus from the proposed flow simulation based graph clustering algorithm known as
Markov Cluster Algorithm. The average clustering coefficient of the resulting clusters are
evaluated in order to check the cluster granularity. The clustering results of proposed
model are compared with the clustering results of other graph clustering models such as
MCODE, one of the first algorithm to detect protein complexes which is on local
neighbourhood density search method and Louvain Cluster, a community detection
algorithm which is on population based stochastic search method.Community significance
test and biological validation are done with the resulting clusters.
Figure 5.1 shows the obtained network which contains 264 proteins and 4958 interactions.
In order to keep only unique interactions, the network is simplified by removing multiple
edges and the resulting network contain 264 proteins and 2159 interactions.
Figure 5.1. PPI Network of proteins linked with zika virus
International Journal of Pure and Applied Mathematics Special Issue
4316

15
Molecular Complex Detection (MCODE), is one of the algorithm based on local
neighbourhood density search to detect highly connected clusters was first proposed by
Gary D Bader and Christopher W V Hogue in 2003.It has three phases:Phase 1: Vertex
weighting: The algorithm assigns a weight to each vertex with respect to its local
neighbourhood density.Phase 2: Cluster finding: Takes input as the vertex weighted
graph, then staring from the top weighted vertex, it iteratively moves around the top
weighted vertex.Phase 3: Post processing to filter or add proteins in the resulting clusters.
Remove singly connected vertices and expand cluster cores by one neighbour.Figure 5.2
shows the respected induced subgraph for the resulting three clusters for the protein-
protein interaction graph. Figure 5.3 shows the average clustering coefficient of the
resulting three clusters namely 1, 2, and 3 for the MCODE algorithm.
Figure 5.2. Resulting 3 Clusters of MCODE algorithm for 2159 Interactions
Figure 5.3. MCODE: Average clustering coefficient of clusters
Louvain Cluster Algorithm was introduced byVincent D Blondel, Jean-Loup Guillaume,
Renaud Lambiotte and Etienne Lefebvre. This is a graph clustering algorithm based on
population based stochastic search method which uses quality function known as
modularity. The algorithm comprises of two steps. Initially assign each vertex to a
community on its own. In every step, vertices are reassigned to communities in a local,
greedy way.
0.134966
11
MCODE: Average clustering
coefficient of clusters
1 2 3
International Journal of Pure and Applied Mathematics Special Issue
4317

16
Figure 5.4. Resulting 6 Clusters of Louvain Cluster algorithm for 2159 Interactions
Figure 5.4 shows the respected induced subgraph for the resulting six clusters for the
protein-protein interaction graph. Figure 5.5 shows the average clustering coefficient of the
resulting six clusters namely 1, 2, 3, 4, 5 and 6 for the Louvain Cluster algorithm.
Figure 5.5. Louvain Cluster: Average clustering coefficient of clusters
Markov Cluster algorithm simulates random walks on a 264 × 264 matrix as the adjacency
matrix of a graph. Random walks are determined by applying “Markov Chains”. That is,
by calculating the transition probability matrices[19]. The algorithm iterates the expansion
and inflation step alternatively until an equilibrium or convergence state is attained.
Expansion is done by taking the Markov Chain transition matrix powers. The expansion
parameter is responsible for granting flow to join distinctlocalities of the graph. The
inflation parameter is account for restoring and undermining the connections. Figure 5.6
shows the respected induced subgraph for the resulting four clusters for the protein-protein
interaction graph. Figure 5.7 shows the average clustering coefficient of the resulting four
clusters namely 1, 2, 3 and 4 for the MCL algorithm
Figure 5.6. Resulting 4 Clusters of MCL algorithm for 2159 Interactions
0.205042
0.1
0.1746750.320197
0.2028770.126812
Louvain Cluster: Average clustering
coefficient of clusters
1 2 3 4 5 6
International Journal of Pure and Applied Mathematics Special Issue
4318

17
Figure 5.7. MCL: Average clustering coefficient of clusters
MCODE results 3 clusters with average clustering coefficient 0.7117. But it clusters only
134 proteins out of 264. Louvain Cluster results 6 clusters with average clustering
coefficient 0.1883 and clustered all the 264 proteins without overlap. MCL results 4
clusters with average clustering coefficient 0.5524 and clustered all the 264 proteins
without overlap which would be much better compared to other two algorithms. Figure 5.8
shows the clustering coefficient versus number of clusters obtained for each algorithm and
the number of proteins involved in each cluster for the three algorithms namely MCODE,
Louvain Cluster and MCL.
Figure 5.8. Analysis of MCODE, Louvain Cluster and MCL
Community significance test based on the mean degree of the vertices have been done. The
p-values obtained as the result of Mann-Whitney U-test for the clusters from MCL
Algorithm is given in the Table 5.1.
Table 5.1. Results of Mann Whitney U test for the clusters from MCL Algorithm
Clusters No of
Proteins
Mann Whitney U test based on the mean
degree
0.3606
0.4587
0.7688
0.6213
MCL: Average clustering coefficient of
clusters
1 2 3 4
0
0.5
1
1 2 3 4 5 6
MCODE 0.13 1 1
Louvain Cluster 0.20 0.1 0.17 0.32 0.20 0.12
MCL 0.36 0.45 0.76 0.62
Clu
ster
ing c
oef
fici
ent
Number of Clusters
Clustering coefficient Vs Number of Clusters
MCODE Louvain Cluster MCL
1 2 3 4 5 6
MCODE 12 3 3
Louvain
Cluster35 56 56 29 64 24
MCL 19 14 17 35
050
100150200250
Nu
mb
er o
f p
rote
ins
Number of clusters
Number of proteins Vs
Number of Clusters
MCODE Louvain Cluster MCL
International Journal of Pure and Applied Mathematics Special Issue
4319

18
C1 198 0.026903
C2 14 0.02678676
C3 17 0.03093628
C4 35 2.43653e-05
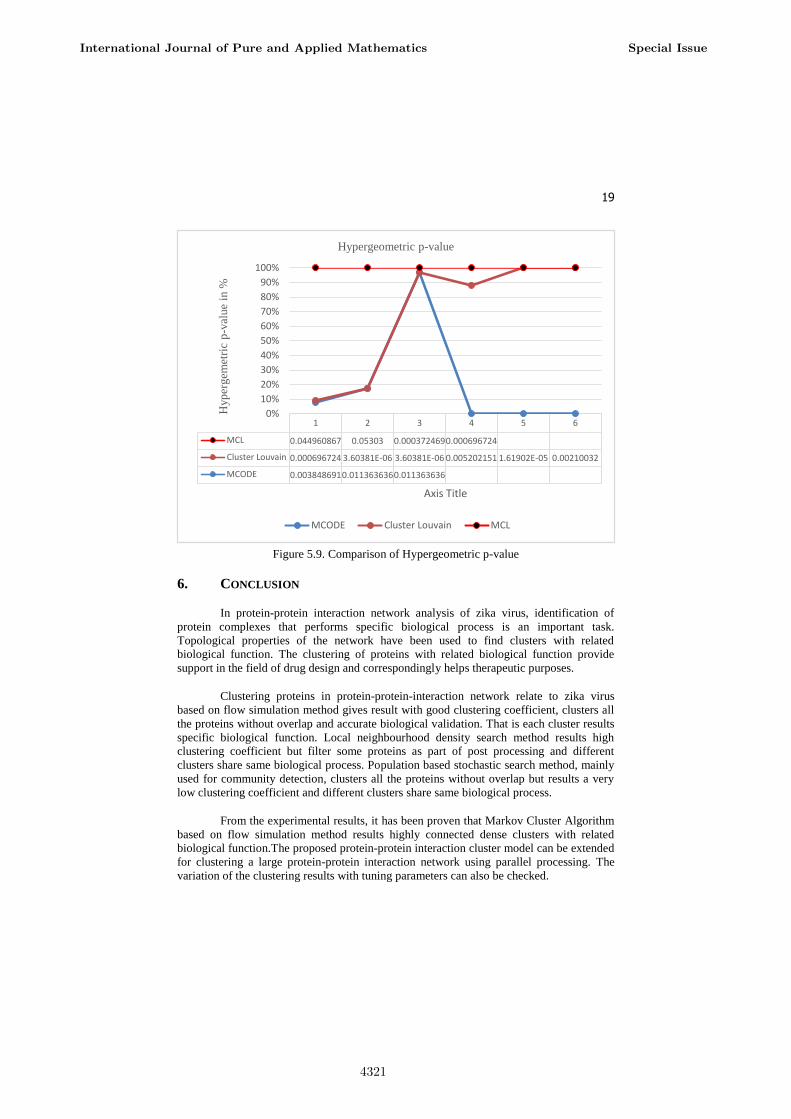
Biological validation of resulting clusters for all the three algorithms have been done.
Resultant clusters from MCL Algorithm found to be more validated with significant
biological process for each cluster.Table 5.2 shows the GO ID and GO term to which each
cluster is significant. Figure 5.9 represents corresponding hypergeometric p-value for each
cluster as part of functional enrichment analysis.
Table 5.2. Comparison of functional homogeneity of clusters from MCODE, Louvain
Cluster and MCL
Algorithm Clusters GO ID GO_term
MCL
C1 GO:0048011 nerve growth factor receptor
signalling pathway
C2 GO:0001869 negative regulation of
complement activation, lectin
pathway
C3 GO:0008152 metabolic process
C4 GO:0044255 cellular lipid metabolic process
MCODE
C1 GO:0044255 cellular lipid metabolic process
C2 GO:0001869
negative regulation of
complement activation, lectin pathway
C3 GO:0001869 negative regulation of
complement activation, lectin
pathway
Louvain
Cluster
C1 GO:0044255 cellular lipid metabolic process
C2 GO:0044255 cellular lipid metabolic process
C3 GO:0044255 cellular lipid metabolic process
C4 GO:0006810 transport
C5 GO:0044255 cellular lipid metabolic process
C6 GO:0006810 transport
International Journal of Pure and Applied Mathematics Special Issue
4320
19
1 2 3 4 5 6
MCL 0.044960867 0.05303 0.0003724690.000696724
Cluster Louvain 0.000696724 3.60381E-06 3.60381E-06 0.005202151 1.61902E-05 0.00210032
MCODE 0.0038486910.0113636360.011363636
0%
10%
20%
30%
40%
50%
60%
70%
80%
90%
100%
Hyp
ergem
etri
c p
-val
ue
in %
Axis Title
Hypergeometric p-value
MCODE Cluster Louvain MCL
Figure 5.9. Comparison of Hypergeometric p-value
6. CONCLUSION
In protein-protein interaction network analysis of zika virus, identification of
protein complexes that performs specific biological process is an important task.
Topological properties of the network have been used to find clusters with related
biological function. The clustering of proteins with related biological function provide
support in the field of drug design and correspondingly helps therapeutic purposes.
Clustering proteins in protein-protein-interaction network relate to zika virus
based on flow simulation method gives result with good clustering coefficient, clusters all
the proteins without overlap and accurate biological validation. That is each cluster results
specific biological function. Local neighbourhood density search method results high
clustering coefficient but filter some proteins as part of post processing and different
clusters share same biological process. Population based stochastic search method, mainly
used for community detection, clusters all the proteins without overlap but results a very
low clustering coefficient and different clusters share same biological process.
From the experimental results, it has been proven that Markov Cluster Algorithm
based on flow simulation method results highly connected dense clusters with related
biological function.The proposed protein-protein interaction cluster model can be extended
for clustering a large protein-protein interaction network using parallel processing. The
variation of the clustering results with tuning parameters can also be checked.
International Journal of Pure and Applied Mathematics Special Issue
4321

20
7. REFERENCES
[1] Thareja, R. 2014. Data Structures Using C.2nd ed. Oxford University Press, New
Delhi. p.393-414.
[2] Przulj, N. 2003. Graph Theory Approaches to Protein Interaction Data Analysis.
In proceedings: Przulj2003GraphTA. p. 2-5, 16-34.
[3] http://www.geneontology.org/
[4] https://www.geneprof.org/GeneProf/
[5] Bader, G. D., and C. W. V. Hogue. 2003. An automated method for finding
molecular complexes in large protein-protein interaction networks.BMC
Bioinformatics. 4, 2. http://doi.org/10.1186/1471-2105-4-2.
[6] Dongen, S. V. 2000. A cluster algorithm for graphs.Journal Report-Information
systems. 10:1-40.
[7] Blondel, V. D., J-L. Guillaume, R.Lambiotte, and E. Lefebvre.2008. Fast
unfolding communities in large networks. J. Stat. Mech. arXiv:0803.0476v2
[physics.soc-ph].
[8] Haddow, A. J., and G. W. Dick.1948. Catches of biting Diptera in Uganda, with
anaesthetized monkeys as bait. Ann. Trop. Med. Parasitol. 42:271-277.
[9] Haddow, A. J., M. C. Williams, J. P. Woodall, D. I. Simpson, and L. K. Goma.
1964. Twelve isolations of Zika virus from Aedes(Stegomyia) Africanus
(Theobald) Taken in and above a Uganda Forest. Bull. World Health Organ. 31:
57-69.
[10] Saiz, J. C., A. Vázquez-Calvo, A. B. Blázquez, T. Merino-Ramos, E. Escribano-
Romero, and M. A. Martín-Acebes. 2016. Zika Virus: The Latest Newcomer.
Front Microbiol. 7:496.doi: 10.3389/fmicb.2016.00496.
[11] Fagbami, A. H. 1979. Zika virus infections in Nigeria: virological and
seroepidemiological investigations in Oyo State.J. Hyg. 83:213-219.
[12] Diagne, C. T., D. Diallo, O. Faye, Y. Ba, A. Gaye, I. Dia, S. C. Weaver, A. A.
Sall,and M, Diallo. 2015.Potential of selected Senegalese Aedes spp. mosquitoes
(Diptera: Culicidae) to transmit Zika virus. BMC Infect. Dis.
15,492.http://doi.org/10.1186/s12879-015-1231-2.
[13] Freitas, B. d-P., J. R. d-O. Dias, J. Prazeres, G. A. Sacramento, A. I. Ko, M. Maia,
and R. Belfort. 2016. Ocular findings in infants with microcephaly associated with
presumed zika virus congenital infection in Salvador.JAMA Ophthalmol.
134,5:529-535.
[14] https://thebiogrid.org/
[15] Kamada, K., and S. Kawai. 1989. An algorithm for drawing general undirected
graphs.Information Processing Letters. 31,1:7-15.
[16] http://igraph.org/r/
[17] S.Rajeswari,K.Suthendran, K.Rajakumar and S.Arumugam ,“An Analysis on
Time Complexity for the MapReduce Models”, Springer LNCS-10398,pp-312-
317,2017.
[18] S.Rajeswari and K.Suthendran, “Chi-Square MapReduce Model for Agricultural
Data”, Journal of Cyber Security and Mobility, Vol.7 (1), pp.13-24, 2018.
[19] S. Rajeswari, K. Suthendran and K. Rajakumar, “A Smart Agricultural Model by
Integrating IoT, Mobile and Cloud-based Big Data Analytics”, International
Journal of Pure and Applied Mathematics, Vol.118,pp. 365-369,2018.
[20] https://cran.r-project.org/web/packages/ProNet/index.html
International Journal of Pure and Applied Mathematics Special Issue
4322

21
[21] Enright, A. J., S. V. Dongen, and C. A. Ouzounis. 2002. An efficient algorithm for
large-scale detection of protein families.Nucleic Acids Res.30,7:1575-1584.
[22] Samatova, N. F., W. Hendrix, J. Jenkins, K. Padmanabhan, and A. Chakraborty.
2014. Practical Graph Mining with R.1sted. CRC Press Taylor & Francis group,
New York. p.9-23,228-230.
[23] Marshall, E., E. Boggis,The Statistics Tutor‟s Quick Guide to Commonly Used
StatisticalTests. University of Sheffield. pp. 1-53. http://www.statstutor.ac.uk
/resources/uploaded/tutorsquickguidetostatistics.pdf.
International Journal of Pure and Applied Mathematics Special Issue
4323

4324