Grains and Oilseeds Outlook - USDA · 2/8/2018 · GRAINS AND OILSEEDS OUTLOOK FOR 2018. 1 Prepared...
17
United States Department of Agriculture Grains and Oilseeds Outlook Friday, February 23, 2018 www.usda.gov/oce/forum
Transcript of Grains and Oilseeds Outlook - USDA · 2/8/2018 · GRAINS AND OILSEEDS OUTLOOK FOR 2018. 1 Prepared...
United States Department of Agriculture
Grains and Oilseeds Outlook
Friday, February 23, 2018
www.usda.gov/oce/forum
- 2 -
Agricultural Outlook Forum 2018 Released: Friday, February 23, 2018
GRAINS AND OILSEEDS OUTLOOK FOR 20181 Prepared by Members of the
Wheat, Feed Grains, Rice, and Oilseeds Interagency Commodity Estimates Committees U.S. Department of Agriculture
Introduction This paper provides USDA’s projections of 2018/19 U.S. supply, demand and prices for wheat, corn, rice, and soybeans and products. Projections presented in this paper include implications of the January 12th Winter Wheat and Canola Seedings report, which estimated winter wheat area declined less than 1 percent from 2017. The projections assume normal weather conditions for spring planting and summer crop development and will be updated in the May 10th World Agricultural Supply and Demand Estimates (WASDE) report. The May WASDE will incorporate farmers’ 2018 planting intentions as indicated in the March 29st Prospective Plantings report and survey-based forecasts for winter wheat production, as well as global, country-by-country supply and demand projections. Among the 3 major crops, for U.S. producers corn and soybean prices are similar to a year ago, despite relatively large stocks of both commodities. In contrast, spring wheat prices are higher relative to 2017. While domestic use of corn is expected to increase driven mostly by expansion in the ethanol sector, U.S. corn exports are expected to face strong competition from Argentina, Brazil, and Ukraine. For wheat, continued large global supplies will maintain strong export competition. Soybean carryin stocks are the highest since 2007/08, but expected growth in exports driven mainly by China results in lower forecast 2018/19 ending stocks in both absolute terms and relative to use. Season-average corn prices received by producers are expected to reach $3.40 per bushel, up 10 cents from the 2017/18 forecast. Soybean prices are expected to decline slightly to $9.25 per bushel while wheat prices are expected to rise to $4.70, up 10 cents per bushel from 2017/18. Given this price outlook, combined corn and soybean area is expected to decline modestly from last year’s record high, while wheat acres are projected to rise. The total 3-crop planted area of 226.5 million acres, if realized, would be up fractionally from final plantings in 2017.
1This paper incorporates contributions by analysts from the World Agricultural Outlook Board, the Economic Research Service, the Farm Service Agency, and the Foreign Agricultural Service.
- 3 -
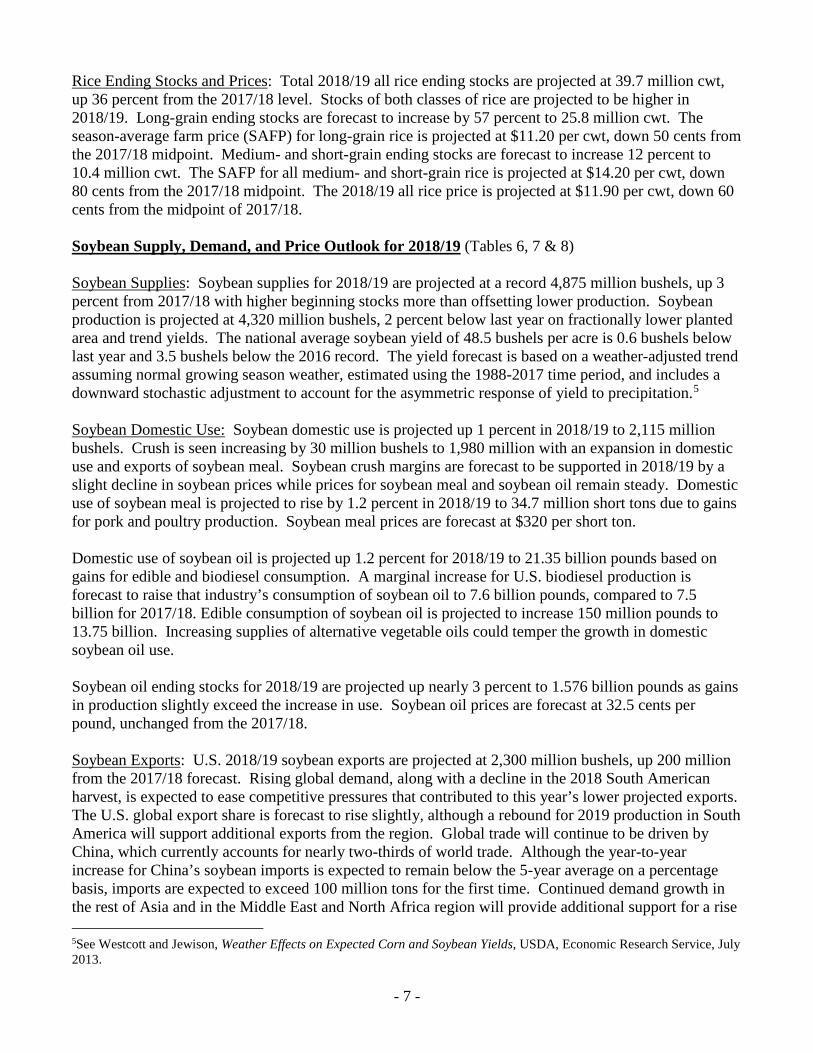
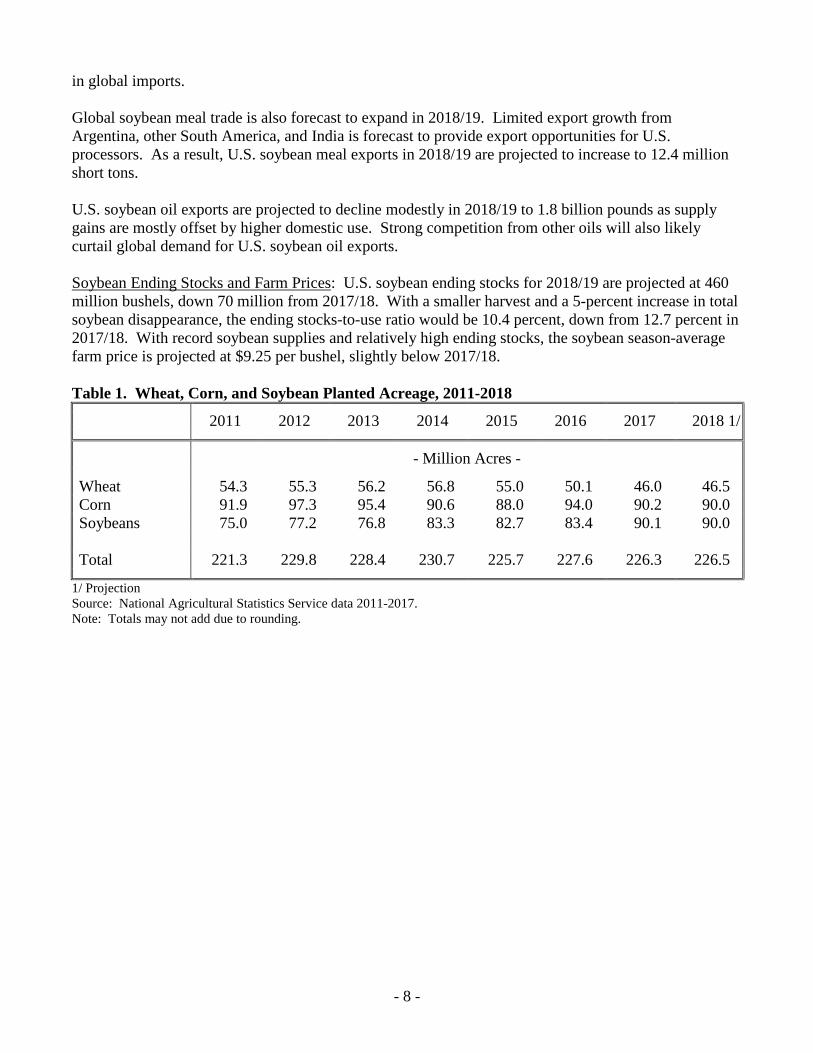
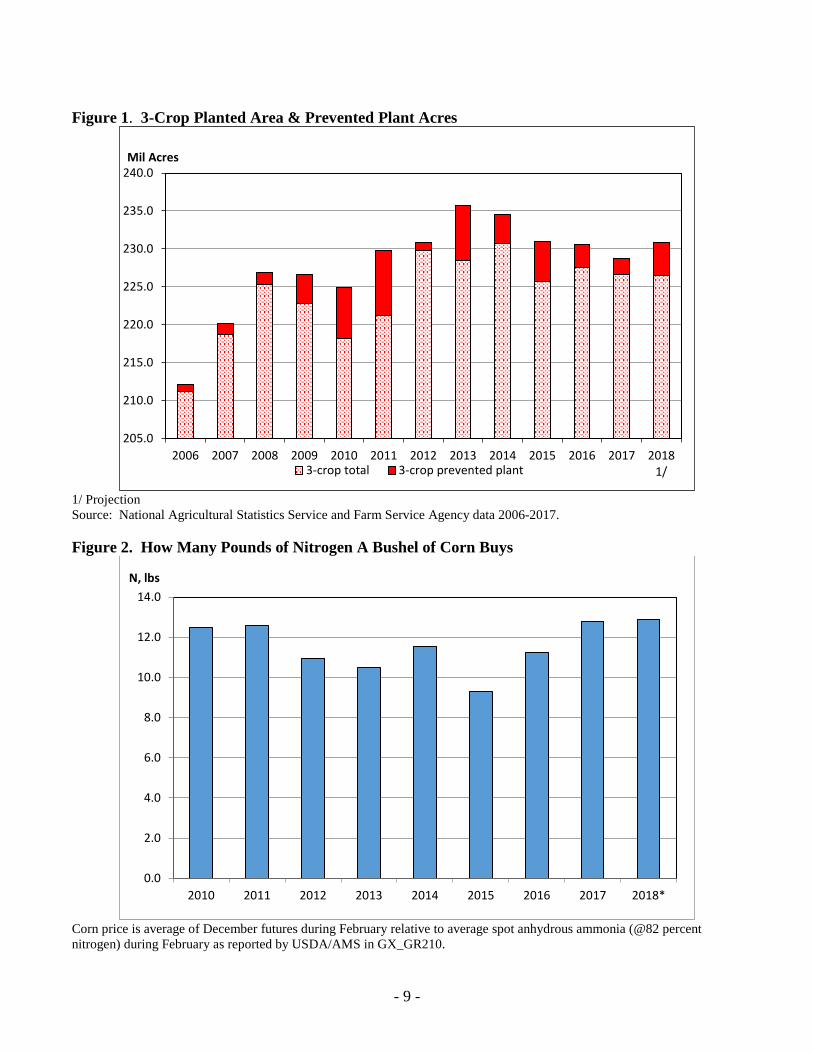
Planted Acreage Outlook for 2018 (Table 1 & Figures 1-5) The 2018 outlook for U.S. plantings of corn and soybeans is driven by price prospects similar to a year ago. In contrast, spring wheat price prospects are up from last year while farmers have indicated winter wheat acres will be down fractionally from last year, but with notable increases in states such as Texas and Kansas. The forecast planted area for the 3 crops at 226.5 million acres, plus an assumption for a normal amount of prevented plant area, suggest a modest rise in combined area in 2018. Prevented plant acres for the 3 crops totaled about 2 million acres in 2017, below the recent historical average for the second consecutive year. Wheat planted area for 2018 is projected up 0.5 million acres to 46.5 million. Winter wheat seeded area in the January 12, 2018, NASS Winter Wheat and Canola Seedings report was 32.6 million acres, down fractionally from last year mostly resulting from a drop in Hard Red Winter (HRW), which was estimated down 0.3 million acres to 23.1 million. Soft Red Winter (SRW) area was estimated up 0.2 million acres to 6.0 million. Winter White (WW) seedings were raised fractionally to 3.6 million. Spring wheat (including Durum) plantings are expected to increase 4 percent. Corn plantings for 2018 are projected at 90.0 million acres, down slightly from last year and virtually unchanged from 2017’s intended plantings. Soybean plantings are expected to total 90.0 million acres, fractionally below a year ago but up 0.5 million from last year’s intentions. Combined corn and soybean area, at 180.0 million acres, is down slightly from a last year’s record high of 180.3 million but 0.5 million above 2017 planting intentions. Forecast increases in wheat and cotton acres, as well as a normal amount of prevented plant acres, are expected to limit expansion in combined corn and soybean area following an increase of 9.6 million acres over the past 2 years. Futures and new crop cash prices for corn and soybeans in both absolute and relative terms are similar to this time a year ago. Through more than half of February, new crop corn futures averaged just under $4.00 per bushel. Soybean prices over the same time period have averaged just over $10.00 per bushel, 2.6 times the corn price and virtually unchanged from a year ago. Forward pricing opportunities for producers portend a similar outlook, with February cash bids for fall 2018 delivery at Illinois elevators2 averaging about $3.60 for corn and $9.65 per bushel for soybeans, compared to $3.65 and $9.85, respectively, during all of February a year ago. Absent any other considerations, current soybean prices relative to corn would be expected to support a continued expansion in soybean acres. However, corn acres are expected to receive some support from lower input prices3 in 2018, as illustrated in Figure 2. Relative to the price of corn, prices for nitrogen fertilizer have declined modestly. For producers focused on managing costs in a relatively low price environment, this is expected to enhance potential net returns. In addition, the potential for a sharp increase in soybean area is dampened by rotational constraints with the possibility of yield drag and increased disease and pest pressure from planting soybeans-on-soybeans. Expected increases in planted acres for other crops will also likely limit soybean area expansion. Total 2018 rice planted acreage is projected at 2.9 million acres, up 17 percent from the prior year. Long grain plantings are expected to increase 20 percent to 2.2 million acres. Improved expected relative returns for long grain rice are behind the increase. Medium and short grain plantings in 2018 are projected to increase 8 percent to 700,000 acres. 2As reported in Illinois Grain Prices in Country Elevators (GX_GR113) 3As reported in Illinois Production Cost Report (GX_GR210)
- 4 -
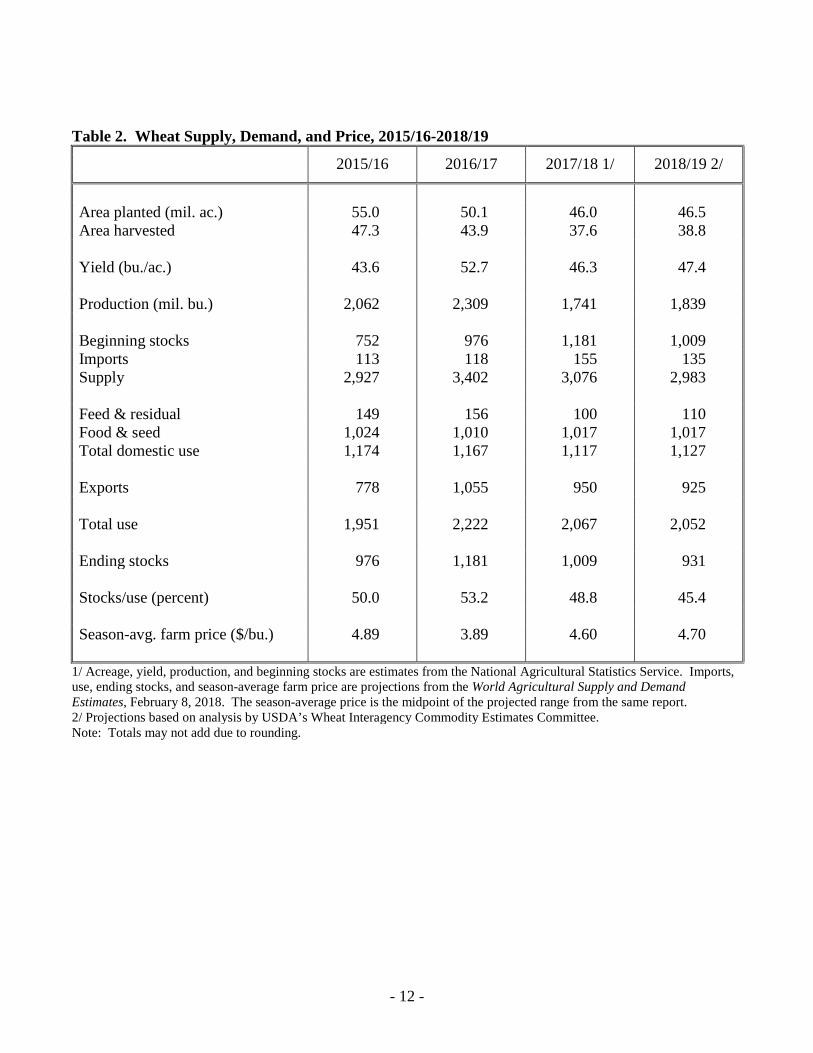
Wheat Supply, Demand, and Price Outlook for 2018/19 (Table 2) Wheat Supplies: Wheat production for the 2018/19 marketing year (MY) is forecast increasing by 98 million bushels and nearly 6 percent, relative to 2017/18. This is largely based on expanded all-wheat planted area. At 46.5 million, area seeded to wheat is up almost 500,000 acres from the previous year despite a slight decline in forecast winter wheat seedings. At 32.6 million acres, 2018 winter wheat seedings are projected to be the lowest in 109 years and incorporate expectations of a 2 percent year-to-year decline in hard red winter plantings. The all-wheat yield for 2018/19 is projected slightly up from the previous year to 47.4 bushels per acre and is based on a 20-year trend. The all-wheat harvested-to-planted ratio is forecast at 83.4 percent indicating expectations for 38.8 million harvested acres. While up from the 2017/18 ratio, the 2018/19 ratio is slightly below the long-term average and reflective of the potential for increased abandonment in the drought-affected winter wheat belt in the Southern Plains. At present, an estimated 42 percent of the 2018/19 winter wheat crop is located in an area experiencing drought. Higher production is more than offset by lower carryin, down 172 million bushels from 2017/18, leaving supplies 93 million bushels lower in this marketing year. The 3 percent decrease in total wheat supply, projected at 2,983 million bushels, compares to total supply of 3,076 million forecast for the 2017/18 marketing year and the 5-year average of near 3,040 million bushels. Wheat Domestic Use: Projected domestic use for 2018/19 is marginally higher, up 10 million bushels from 2017/18 to 1,127 million based on increased feed and residual usage. Food and seed use is forecast to remain level with the current 2017/18 estimate based on food use of 955 million bushels and seed use of 62 million bushels. Wheat Exports: U.S. 2018/19 wheat exports are projected down 25 million bushels from 2017/18 to 925 million. Lower U.S. supplies and continued strong international competition will challenge U.S. wheat exports. The European Union is expected to have a larger crop, while Argentina is anticipated to continue to expand wheat area. Both Australia and Canada are expected to have ample exportable supplies with larger crops as they rebound from reduced 2017/18 yields. Though the Russian crop is expected to be down from the 2017/18 record, exportable supplies will still be abundant due to massive carryin stocks. Global 2018/19 wheat trade is anticipated to reach a record-high while global consumption is projected to continue to grow particularly in the net importing countries of Africa and Asia. While the United States is expected to retain its core markets, expansion into these growing regions will be limited in light of abundant competitor supplies. Wheat Ending Stocks and Farm Prices: U.S. wheat ending stocks for 2018/19 are projected to decline by approximately 8 percent and 78 million bushels from 2017/18. At 931 million bushels, ending stocks for 2018/19 are the lowest since 2014/15 but still above the 5-year average of 902 million bushels. The stocks-to-use ratio, at 45.4 percent, is down from the projected 2017/18 ratio of 48.8 percent, but remains above the 5-year average of 42.7. The 2018/19 season-average farm price is projected at $4.70 per bushel and is up ten cents from the midpoint of the forecast 2017/18 price. Large carryin stocks coupled with continued strong export competition in global markets is expected to temper prospects for significantly higher prices in 2018/19.
- 5 -
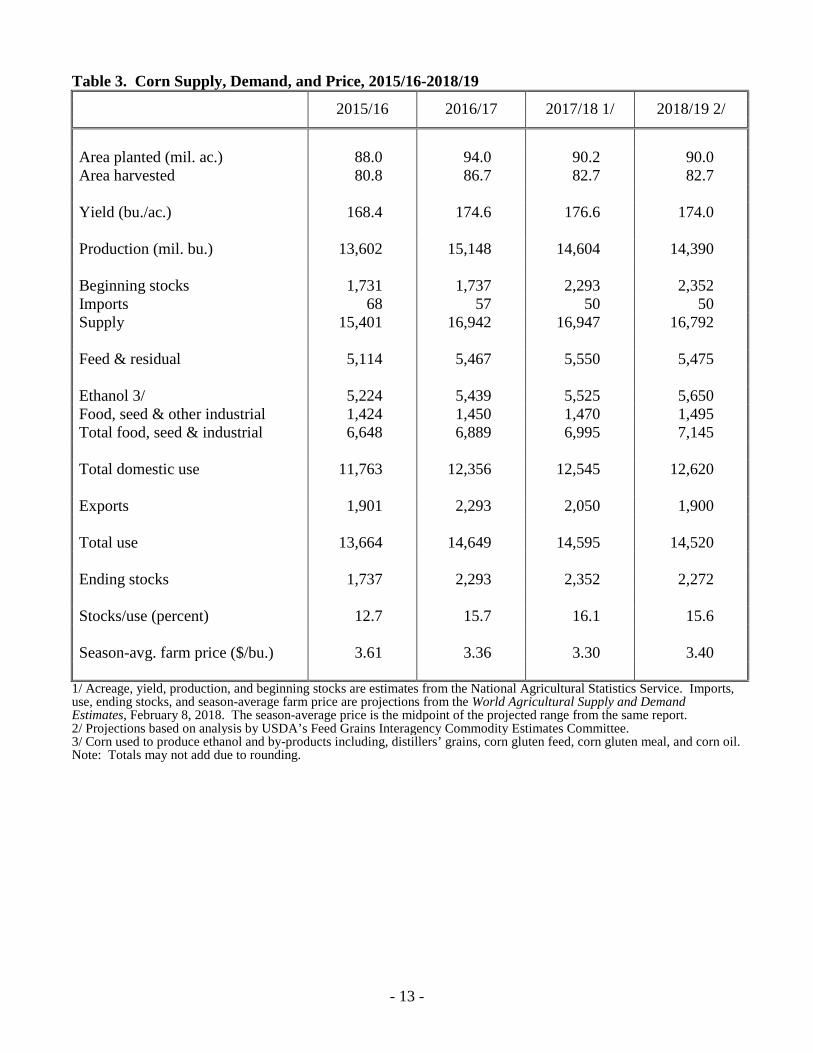
Corn Supply, Demand, and Price Outlook for 2018/19 (Table 3) Corn Supplies: Corn production in 2018 is projected at 14,390 million bushels, 1 percent below a year ago on fractionally lower planted area and a return to trend yield. Corn supplies for 2018/19 decline from the record high in 2017/18, but remain relatively large. Imports are expected to be unchanged from a year ago reflecting expectations of continued demand for imported organic corn and trade destined for southeastern feed markets. The national average corn yield is projected at 174.0 bushels per acre, below last year’s record yield of 176.6 bushels. The yield projection is based on a weather-adjusted trend assuming normal growing season weather, estimated using the 1988-2017 time period, and includes a downward stochastic adjustment to account for the asymmetric response of yield to July precipitation.4 Corn Use: Total corn use for 2018/19 at 14,520 million bushels is down from 2017/18 as a projected decline in exports more than offsets growth in domestic use. Corn Feed and Residual Use: Corn feed and residual use for 2018/19 is projected at 5,475 million bushels, down 75 million bushels from 2017/18. The decline reflects smaller residual disappearance with a reduced crop, an increase in the amount of corn used to produce ethanol, and slightly higher expected prices that are partially offset by expected growth in grain consuming animal units. Corn Food, Seed, and Industrial Use: Food, seed, and industrial (FSI) use of corn in 2018/19 is projected at a record 7,145 million bushels, 150 million bushels higher than 2017/18. Non-ethanol FSI categories are up 25 million bushels in 2018/19 largely reflecting higher corn use for glucose and dextrose. Corn use for beverage and industrial alcohols, as well as use for food, cereals, and other products continue an upward trend mostly based on population growth. Corn Used in Ethanol Production: Corn used for ethanol production is projected at a record 5,650 million bushels for 2018/19, 125 million bushels higher than 2017/18. If realized, this would represent nearly 40 percent of total corn use, a marginal increase from the previous year but below the average of 2011/12 and 2012/13. The Energy Information Administration forecast for gasoline consumption during 2018/19, on a September-August basis, is up about 1 percent from the prior year. Continued low gasoline prices and economic growth support a slight but steady increase in vehicle a miles driven per day and continued consumer purchases of heavier, relatively less fuel efficient vehicles. At the same time, continued growth is expected for U.S. ethanol exports. Corn Exports: Corn exports for 2018/19 are projected at 1,900 million bushels, down 150 million from the 2017/18 forecast. Competition from Argentina, Brazil, and Ukraine is expected to limit U.S. export prospects. Argentina is forecast to increase its exports despite the impact of below trend yields in 2017/18 as corn area has expanded substantially in the last 2 years. Planting is underway for Brazil’s second-crop corn and this crop would be expected to compete with U.S. exports starting in the summer of 2018. At the same time, with normal weather conditions Ukraine is expected to continue export expansion to countries in Asia, dampening prospects for the United States in the region. The U.S. market share of global trade is expected to remain in a range of 30 to 35 percent.
4 For a more detailed explanation see Westcott and Jewison, Weather Effects on Expected Corn and Soybean Yields, USDA, Economic Research Service, July 2013, http://usda.mannlib.cornell.edu/usda/ers/FDS/2010s/2013/FDS-07-26-2013.pdf
- 6 -
Corn Ending Stocks and Farm Prices: U.S. corn ending stocks for 2018/19 are projected at 2,272 million bushels, down 3 percent from 2017/18. The 2018/19 stocks-to-use ratio of 15.6 percent is down from the 16.1 percent forecast for 2017/18, supporting a 10 cent per bushel increase from a year ago in the expected season-average farm price to $3.40 per bushel. Rice Supply, Demand, and Price Outlook for 2018/19 (Tables 4 & 5) Rice Supplies: The 2018/19 outlook is for much larger total U.S. supplies as a substantial increase in production more than offset smaller carryin stocks and a slight decrease in imports. Total 2018 rice planted acreage is projected to increase 17 percent from last year to 2.88 million acres. Long grain plantings are expected to increase 20 percent to 2.18 million acres due to tight ending stocks in 2017/18 and higher expected returns for rice at planting compared with alternative crops, primarily soybeans. Medium- and short-grain plantings in 2018 are expected to increase 8 percent from the prior year to 700,000 acres, with further expansion constrained by available California water supplies. California typically accounts for about 70 percent of U.S. medium- and short-grain production. Assuming a normal harvested-to-planted area relationship, total harvested rice acreage is projected at 2.85 million acres, with 2.16 million acres of long-grain and 0.69 million acres of medium- and short-grain. For all rice, average field yields are forecast to increase 2 percent from 2017 to 7,631 pounds per acre, assuming normal weather and planting dates. This would be the second highest yield on record. Long-grain rice yields are forecast to return to trend, resulting in a yield of 7,449 pounds per acre, up 2 percent from 2017. The medium- and short-grain rice yield is forecast to increase 2 percent from 2017 to 8,200 pounds per acre. Total 2018 rice production is projected to increase by 22 percent to 217.8 million cwt, as both area and yield are projected higher. Long grain rice accounts for more than four-fifths of the production increase. Total supplies of all rice in 2018/19 are projected to increase by 9 percent to 271.7 million cwt, as a much larger crop more than offsets a smaller carryin and slightly lower imports. Supplies of both classes of rice are projected to be larger in 2018/19. Long-grain supplies are projected to increase by 10 percent to 198.8 million cwt due to a much larger crop. Medium- and short-grain supplies are projected at 69.4 million cwt, 6 percent larger than in 2017/18, also due to a larger crop. Rice Domestic Use: All rice total domestic and residual use for 2018/19 is projected to increase 5 percent from 2017/18 to 126.0 million cwt. Long-grain domestic and residual use is projected to increase 5 percent to 98.0 million cwt, mostly due to greater post-harvest and marketing losses associated with a larger crop. Medium- and short-grain domestic and residual use is projected to increase almost 4 percent to 28.0 million cwt, also mostly due to a larger crop in 2018/19. Rice Exports: All rice exports for 2018/19 are projected at 106.0 million cwt, up 6 percent from a year earlier. The increase is primarily due to greater exportable supplies for all classes. Long-grain exports are projected at 75.0 million cwt, up 6 percent from 2017/18. The Western Hemisphere is again expected to account for the bulk of U.S. long-grain exports, with rising shipments expected to Haiti. U.S. medium- and short-grain rice exports are projected at 31.0 million cwt, up 7 percent, with Northeast Asia again expected to account for the majority of these exports. With lower expected prices, exports are expected to rebound to the Middle East and North Africa region.
- 7 -
Rice Ending Stocks and Prices: Total 2018/19 all rice ending stocks are projected at 39.7 million cwt, up 36 percent from the 2017/18 level. Stocks of both classes of rice are projected to be higher in 2018/19. Long-grain ending stocks are forecast to increase by 57 percent to 25.8 million cwt. The season-average farm price (SAFP) for long-grain rice is projected at $11.20 per cwt, down 50 cents from the 2017/18 midpoint. Medium- and short-grain ending stocks are forecast to increase 12 percent to 10.4 million cwt. The SAFP for all medium- and short-grain rice is projected at $14.20 per cwt, down 80 cents from the 2017/18 midpoint. The 2018/19 all rice price is projected at $11.90 per cwt, down 60 cents from the midpoint of 2017/18. Soybean Supply, Demand, and Price Outlook for 2018/19 (Tables 6, 7 & 8) Soybean Supplies: Soybean supplies for 2018/19 are projected at a record 4,875 million bushels, up 3 percent from 2017/18 with higher beginning stocks more than offsetting lower production. Soybean production is projected at 4,320 million bushels, 2 percent below last year on fractionally lower planted area and trend yields. The national average soybean yield of 48.5 bushels per acre is 0.6 bushels below last year and 3.5 bushels below the 2016 record. The yield forecast is based on a weather-adjusted trend assuming normal growing season weather, estimated using the 1988-2017 time period, and includes a downward stochastic adjustment to account for the asymmetric response of yield to precipitation.5 Soybean Domestic Use: Soybean domestic use is projected up 1 percent in 2018/19 to 2,115 million bushels. Crush is seen increasing by 30 million bushels to 1,980 million with an expansion in domestic use and exports of soybean meal. Soybean crush margins are forecast to be supported in 2018/19 by a slight decline in soybean prices while prices for soybean meal and soybean oil remain steady. Domestic use of soybean meal is projected to rise by 1.2 percent in 2018/19 to 34.7 million short tons due to gains for pork and poultry production. Soybean meal prices are forecast at $320 per short ton. Domestic use of soybean oil is projected up 1.2 percent for 2018/19 to 21.35 billion pounds based on gains for edible and biodiesel consumption. A marginal increase for U.S. biodiesel production is forecast to raise that industry’s consumption of soybean oil to 7.6 billion pounds, compared to 7.5 billion for 2017/18. Edible consumption of soybean oil is projected to increase 150 million pounds to 13.75 billion. Increasing supplies of alternative vegetable oils could temper the growth in domestic soybean oil use. Soybean oil ending stocks for 2018/19 are projected up nearly 3 percent to 1.576 billion pounds as gains in production slightly exceed the increase in use. Soybean oil prices are forecast at 32.5 cents per pound, unchanged from the 2017/18. Soybean Exports: U.S. 2018/19 soybean exports are projected at 2,300 million bushels, up 200 million from the 2017/18 forecast. Rising global demand, along with a decline in the 2018 South American harvest, is expected to ease competitive pressures that contributed to this year’s lower projected exports. The U.S. global export share is forecast to rise slightly, although a rebound for 2019 production in South America will support additional exports from the region. Global trade will continue to be driven by China, which currently accounts for nearly two-thirds of world trade. Although the year-to-year increase for China’s soybean imports is expected to remain below the 5-year average on a percentage basis, imports are expected to exceed 100 million tons for the first time. Continued demand growth in the rest of Asia and in the Middle East and North Africa region will provide additional support for a rise 5See Westcott and Jewison, Weather Effects on Expected Corn and Soybean Yields, USDA, Economic Research Service, July 2013.
- 8 -
in global imports. Global soybean meal trade is also forecast to expand in 2018/19. Limited export growth from Argentina, other South America, and India is forecast to provide export opportunities for U.S. processors. As a result, U.S. soybean meal exports in 2018/19 are projected to increase to 12.4 million short tons. U.S. soybean oil exports are projected to decline modestly in 2018/19 to 1.8 billion pounds as supply gains are mostly offset by higher domestic use. Strong competition from other oils will also likely curtail global demand for U.S. soybean oil exports. Soybean Ending Stocks and Farm Prices: U.S. soybean ending stocks for 2018/19 are projected at 460 million bushels, down 70 million from 2017/18. With a smaller harvest and a 5-percent increase in total soybean disappearance, the ending stocks-to-use ratio would be 10.4 percent, down from 12.7 percent in 2017/18. With record soybean supplies and relatively high ending stocks, the soybean season-average farm price is projected at $9.25 per bushel, slightly below 2017/18. Table 1. Wheat, Corn, and Soybean Planted Acreage, 2011-2018 2011 2012 2013 2014 2015 2016 2017 2018 1/ - Million Acres - Wheat 54.3 55.3 56.2 56.8 55.0 50.1 46.0 46.5 Corn 91.9 97.3 95.4 90.6 88.0 94.0 90.2 90.0 Soybeans 75.0 77.2 76.8 83.3 82.7 83.4 90.1 90.0 Total 221.3 229.8 228.4 230.7 225.7 227.6 226.3 226.5
1/ Projection Source: National Agricultural Statistics Service data 2011-2017. Note: Totals may not add due to rounding.
- 9 -
Figure 1. 3-Crop Planted Area & Prevented Plant Acres
1/ Projection Source: National Agricultural Statistics Service and Farm Service Agency data 2006-2017. Figure 2. How Many Pounds of Nitrogen A Bushel of Corn Buys
Corn price is average of December futures during February relative to average spot anhydrous ammonia (@82 percent nitrogen) during February as reported by USDA/AMS in GX_GR210.
205.0
210.0
215.0
220.0
225.0
230.0
235.0
240.0
2006 2007 2008 2009 2010 2011 2012 2013 2014 2015 2016 2017 20181/
Mil Acres
3-crop total 3-crop prevented plant
0.0
2.0
4.0
6.0
8.0
10.0
12.0
14.0
2010 2011 2012 2013 2014 2015 2016 2017 2018*
N, lbs
- 10 -
Figure 3. Illinois New Crop Delivery Soybean-to-Corn Ratio During February
Average of high and low values for IL as reported by AMS in GX_GR113. *Value for 2018 is average of month to date. Figure 4. Cotton-to-Corn Futures Ratio During February
New crop is the December contract for cotton and corn. *Value for 2018 is average of month to date.
2.00
4.00
6.00
8.00
10.00
12.00
14.00
1.50
1.70
1.90
2.10
2.30
2.50
2.70
2.90
2007 2008 2009 2010 2011 2012 2013 2014 2015 2016 2017 2018*
Soybeans, $ buRatio
Ratio Soybean Cash
0.00
1.00
2.00
3.00
4.00
5.00
6.00
7.00
0.00
0.05
0.10
0.15
0.20
0.25
0.30
1996
1997
1998
1999
2000
2001
2002
2003
2004
2005
2006
2007
2008
2009
2010
2011
2012
2013
2014
2015
2016
2017
2018
*
Corn Price, $/buRatio
Cotton/Corn Ratio Corn Futures
- 11 -
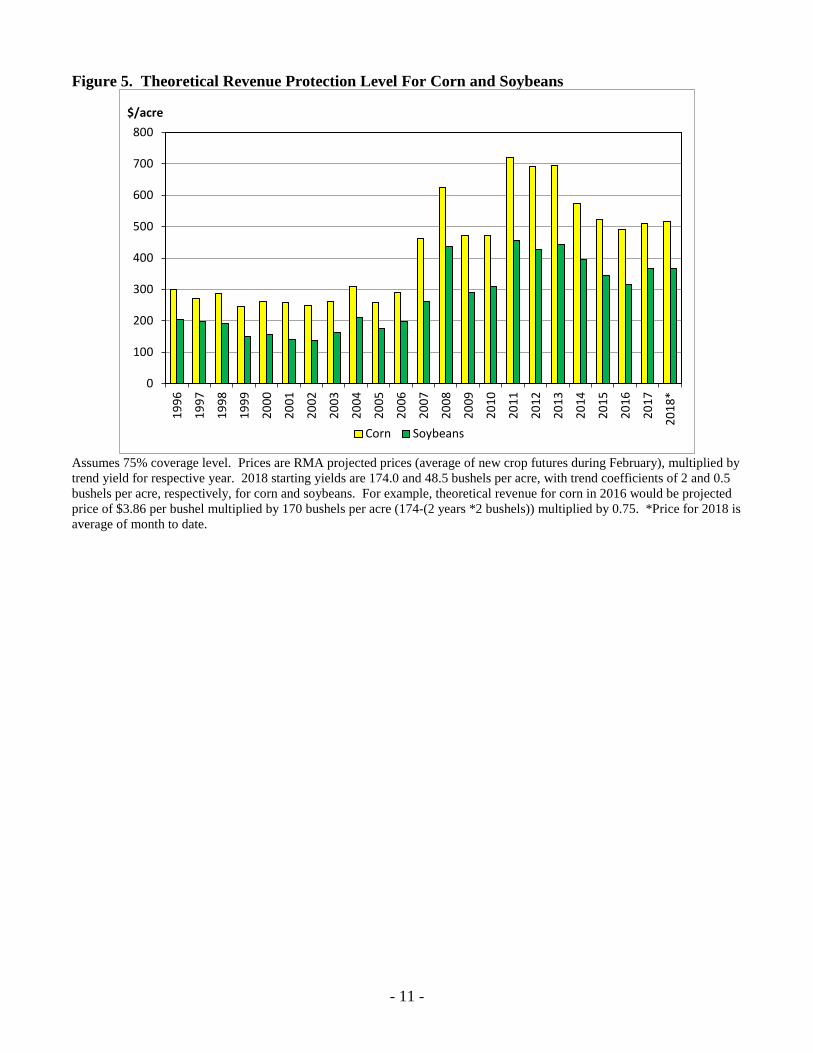
Figure 5. Theoretical Revenue Protection Level For Corn and Soybeans
Assumes 75% coverage level. Prices are RMA projected prices (average of new crop futures during February), multiplied by trend yield for respective year. 2018 starting yields are 174.0 and 48.5 bushels per acre, with trend coefficients of 2 and 0.5 bushels per acre, respectively, for corn and soybeans. For example, theoretical revenue for corn in 2016 would be projected price of $3.86 per bushel multiplied by 170 bushels per acre (174-(2 years *2 bushels)) multiplied by 0.75. *Price for 2018 is average of month to date.
0
100
200
300
400
500
600
700
800
1996
1997
1998
1999
2000
2001
2002
2003
2004
2005
2006
2007
2008
2009
2010
2011
2012
2013
2014
2015
2016
2017
2018
*
$/acre
Corn Soybeans
- 12 -
Table 2. Wheat Supply, Demand, and Price, 2015/16-2018/19 2015/16 2016/17 2017/18 1/ 2018/19 2/ Area planted (mil. ac.) 55.0 50.1 46.0 46.5 Area harvested 47.3 43.9 37.6 38.8 Yield (bu./ac.) 43.6 52.7 46.3 47.4 Production (mil. bu.) 2,062 2,309 1,741 1,839 Beginning stocks 752 976 1,181 1,009 Imports 113 118 155 135 Supply 2,927 3,402 3,076 2,983 Feed & residual 149 156 100 110 Food & seed 1,024 1,010 1,017 1,017 Total domestic use 1,174 1,167 1,117 1,127 Exports 778 1,055 950 925 Total use 1,951 2,222 2,067 2,052 Ending stocks 976 1,181 1,009 931 Stocks/use (percent) 50.0 53.2 48.8 45.4 Season-avg. farm price ($/bu.) 4.89 3.89 4.60 4.70
1/ Acreage, yield, production, and beginning stocks are estimates from the National Agricultural Statistics Service. Imports, use, ending stocks, and season-average farm price are projections from the World Agricultural Supply and Demand Estimates, February 8, 2018. The season-average price is the midpoint of the projected range from the same report. 2/ Projections based on analysis by USDA’s Wheat Interagency Commodity Estimates Committee. Note: Totals may not add due to rounding.
- 13 -
Table 3. Corn Supply, Demand, and Price, 2015/16-2018/19 2015/16 2016/17 2017/18 1/ 2018/19 2/ Area planted (mil. ac.) 88.0 94.0 90.2 90.0 Area harvested 80.8 86.7 82.7 82.7 Yield (bu./ac.) 168.4 174.6 176.6 174.0 Production (mil. bu.) 13,602 15,148 14,604 14,390 Beginning stocks 1,731 1,737 2,293 2,352 Imports 68 57 50 50 Supply 15,401 16,942 16,947 16,792 Feed & residual 5,114 5,467 5,550 5,475 Ethanol 3/ 5,224 5,439 5,525 5,650 Food, seed & other industrial 1,424 1,450 1,470 1,495 Total food, seed & industrial 6,648 6,889 6,995 7,145 Total domestic use 11,763 12,356 12,545 12,620 Exports 1,901 2,293 2,050 1,900 Total use 13,664 14,649 14,595 14,520 Ending stocks 1,737 2,293 2,352 2,272 Stocks/use (percent) 12.7 15.7 16.1 15.6 Season-avg. farm price ($/bu.) 3.61 3.36 3.30 3.40
1/ Acreage, yield, production, and beginning stocks are estimates from the National Agricultural Statistics Service. Imports, use, ending stocks, and season-average farm price are projections from the World Agricultural Supply and Demand Estimates, February 8, 2018. The season-average price is the midpoint of the projected range from the same report. 2/ Projections based on analysis by USDA’s Feed Grains Interagency Commodity Estimates Committee. 3/ Corn used to produce ethanol and by-products including, distillers’ grains, corn gluten feed, corn gluten meal, and corn oil. Note: Totals may not add due to rounding.

- 14 -
Table 4. Rice Supply, Demand, and Price, 2015/16-2018/19 All Rice 2015/16 2016/17 2017/181/ 2018/19 2/ Area planted (mil. ac.) 2.63 3.15 2.46 2.88 Area harvested 2.59 3.10 2.37 2.85 Yield (pounds/ac.) 7,472 7,237 7,507 7,631 Production (mil. cwt) 193.1 224.1 178.2 217.8 Beginning stocks 48.5 46.5 46.0 29.2 Imports 24.1 23.5 24.9 24.7 Supply 265.8 294.1 249.2 271.7 Total domestic & residual use 112.4 131.4 120.0 126.0 Exports 107.0 116.7 100.0 106.0 Total use 219.3 248.0 220.0 232.0 Ending stocks 46.5 46.0 29.2 39.7 Stocks/use (percent) 21.2 18.5 13.3 17.1 Season avg. farm price ($/cwt.) 12.20 10.40 12.50 11.90
1/ Acreage, yield, production, and beginning stocks are estimates from the National Agricultural Statistics Service. Imports, use, ending stocks, and season-average farm price are projections from the World Agricultural Supply and Demand Estimates, February 8, 2018. The season-average farm price is the midpoint of the projected price range from the same report. 2/ Projections based on the analysis by USDA’s Rice Interagency Commodity Estimates Committee. Note: Totals may not add due to rounding.
- 15 -
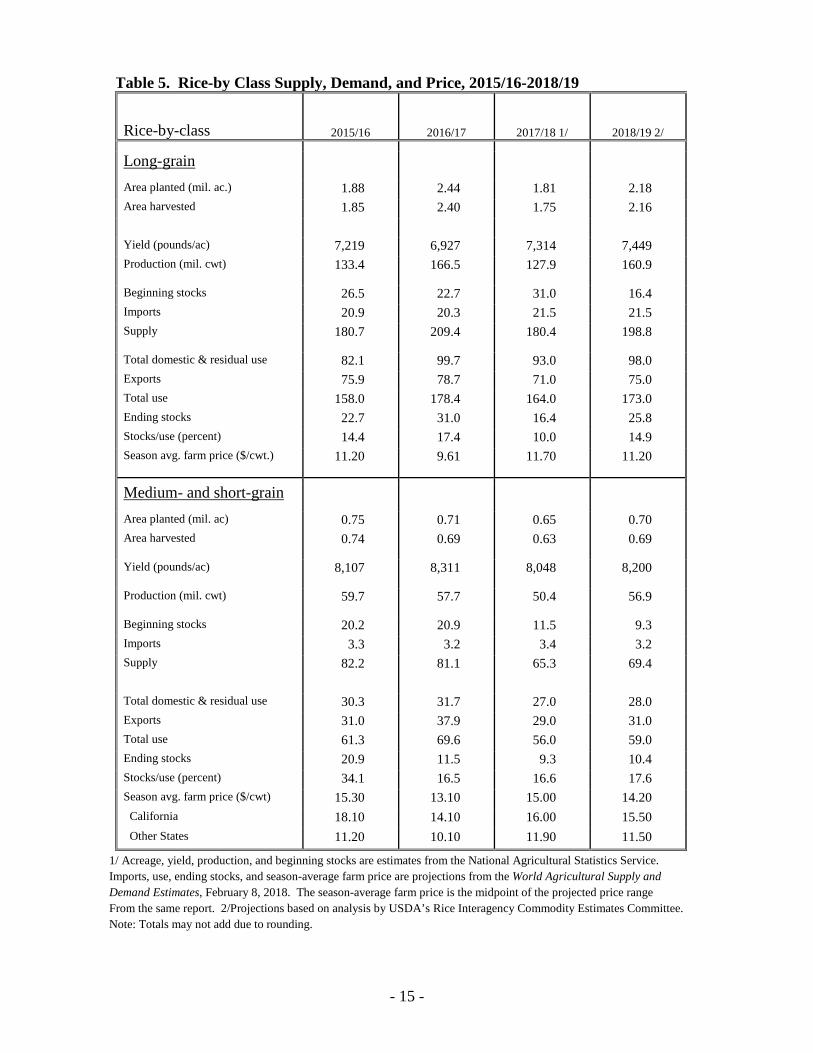
Table 5. Rice-by Class Supply, Demand, and Price, 2015/16-2018/19
Rice-by-class 2015/16 2016/17 2017/18 1/ 2018/19 2/ Long-grain
Area planted (mil. ac.) 1.88 2.44 1.81 2.18 Area harvested 1.85 2.40 1.75 2.16 Yield (pounds/ac) 7,219 6,927 7,314 7,449 Production (mil. cwt) 133.4 166.5 127.9 160.9
Beginning stocks 26.5 22.7 31.0 16.4 Imports 20.9 20.3 21.5 21.5 Supply 180.7 209.4 180.4 198.8
Total domestic & residual use 82.1 99.7 93.0 98.0 Exports 75.9 78.7 71.0 75.0 Total use 158.0 178.4 164.0 173.0 Ending stocks 22.7
31.0 16.4 25.8
Stocks/use (percent) 14.4 17.4 10.0 14.9 Season avg. farm price ($/cwt.) 11.20 9.61 11.70 11.20
Medium- and short-grain
Area planted (mil. ac) 0.75 0.71 0.65 0.70 Area harvested 0.74 0.69 0.63 0.69
Yield (pounds/ac) 8,107 8,311 8,048 8,200
Production (mil. cwt) 59.7 57.7 50.4 56.9
Beginning stocks 20.2 20.9 11.5 9.3 Imports 3.3 3.2 3.4 3.2 Supply 82.2 81.1 65.3 69.4
Total domestic & residual use 30.3 31.7 27.0 28.0 Exports 31.0 37.9 29.0 31.0 Total use 61.3 69.6 56.0 59.0 Ending stocks 20.9 11.5 9.3 10.4 Stocks/use (percent) 34.1 16.5 16.6 17.6 Season avg. farm price ($/cwt) 15.30 13.10 15.00 14.20 California 18.10 14.10 16.00 15.50 Other States 11.20 10.10 11.90 11.50
1/ Acreage, yield, production, and beginning stocks are estimates from the National Agricultural Statistics Service. Imports, use, ending stocks, and season-average farm price are projections from the World Agricultural Supply and Demand Estimates, February 8, 2018. The season-average farm price is the midpoint of the projected price range From the same report. 2/Projections based on analysis by USDA’s Rice Interagency Commodity Estimates Committee. Note: Totals may not add due to rounding.
- 16 -
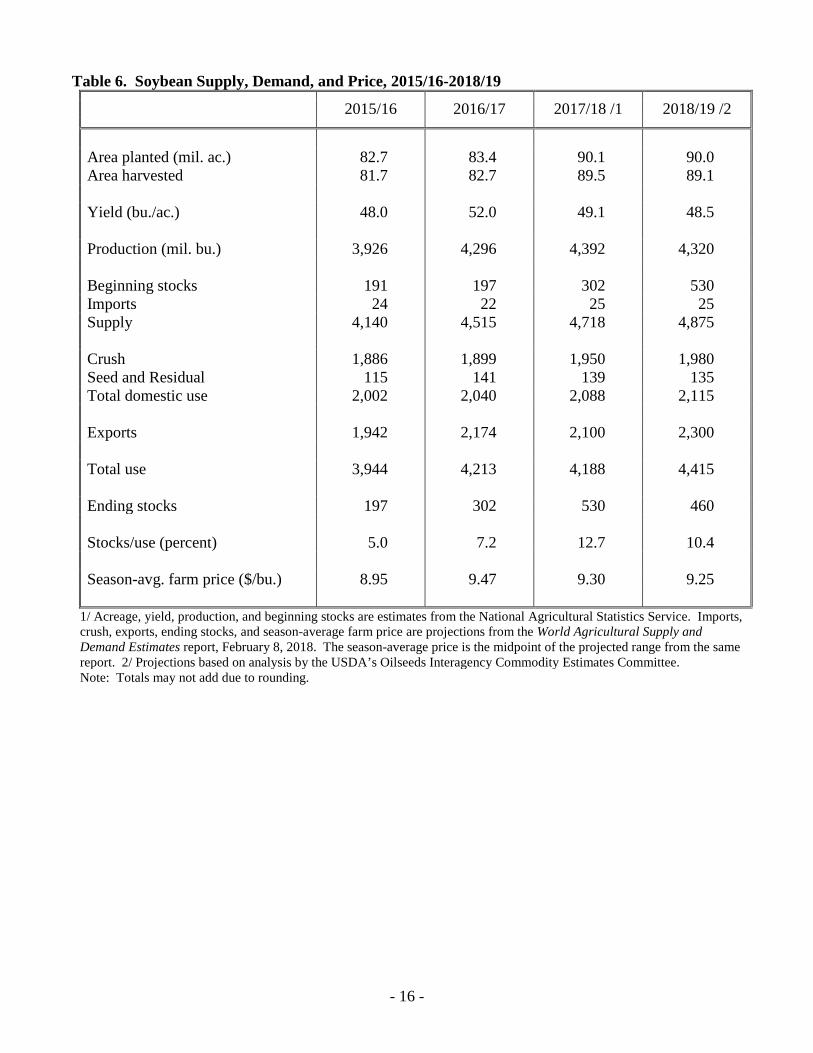
Table 6. Soybean Supply, Demand, and Price, 2015/16-2018/19 2015/16 2016/17 2017/18 /1 2018/19 /2 Area planted (mil. ac.) 82.7 83.4 90.1 90.0 Area harvested 81.7 82.7 89.5 89.1 Yield (bu./ac.) 48.0 52.0 49.1 48.5 Production (mil. bu.) 3,926 4,296 4,392 4,320 Beginning stocks 191 197 302 530 Imports 24 22 25 25 Supply 4,140 4,515 4,718 4,875 Crush 1,886 1,899 1,950 1,980 Seed and Residual 115 141 139 135 Total domestic use 2,002 2,040 2,088 2,115 Exports 1,942 2,174 2,100 2,300 Total use 3,944 4,213 4,188 4,415 Ending stocks 197 302 530 460 Stocks/use (percent) 5.0 7.2 12.7 10.4 Season-avg. farm price ($/bu.) 8.95 9.47 9.30 9.25
1/ Acreage, yield, production, and beginning stocks are estimates from the National Agricultural Statistics Service. Imports, crush, exports, ending stocks, and season-average farm price are projections from the World Agricultural Supply and Demand Estimates report, February 8, 2018. The season-average price is the midpoint of the projected range from the same report. 2/ Projections based on analysis by the USDA’s Oilseeds Interagency Commodity Estimates Committee. Note: Totals may not add due to rounding.

- 17 -
Table 7. Soybean Meal Supply, Demand, and Price, 2015/16-2018/19 2015/16 2016/17 2017/18 /1 2018/19 /2 Production (thou. short tons) 44,672 44,733 46,099 46,800 Beginning stocks 260 264 401 300 Imports 403 349 300 300 Supply 45,336 45,347 46,800 47,400 Domestic Use 33,118 33,345 34,300 34,700 Exports 11,954 11,601 12,200 12,400 Total use 45,072 44,946 46,500 47,100 Ending stocks 264 401 300 300 Avg. price ($/short ton) 3/ 324.56 316.88 320.00 320.00
1/ Beginning stocks, production, imports, use, ending stocks, and average price are projections from the World Agricultural Supply and Demand Estimates, February 8, 2018. Price is the midpoint of the projected range from the same report. 2/ Projections based on analysis by the USDA’s Oilseeds Interagency Commodity Estimates Committee. 3/ The average price is for 48-percent protein meal at Decatur, Illinois. Note: Totals may not add due to rounding.
Table 8. Soybean Oil Supply, Demand, and Price, 2015/16-2018/19
2015/16 2016/17 2017/18 /1 2018/19 /2 Production (mil. lbs.) 21,950 22,099 22,525 22,890 Beginning stocks 1,855 1,687 1,711 1,536 Imports 287 319 300 300 Supply 24,092 24,104 24,536 24,726 Domestic Use 20,162 19,837 21,100 21,350 Biodiesel 3/ 5,670 6,200 7,500 7,600 Food, Feed, Other Industrial 14,492 13,637 13,600 13,750 Exports 2,243 2,556 1,900 1,800 Total use 22,405 22,393 23,000 23,150 Ending stocks 1,687 1,711 1,536 1,576 Avg. price (cents/lb.) 4/ 29.9 32.5 32.5 32.5
1/ Beginning stocks, production, imports, use, ending stocks, and average price are projections from the World Agricultural Supply and Demand Estimates, February 8, 2018. Price is the midpoint of the projected range from the same report. 2/ Projections based on analysis by the USDA’s Oilseeds Interagency Commodity Estimates Committee. 3/ Reflects only biodiesel made from methyl ester as reported by the U.S. Energy Information Administration. 4/ The average price is for crude soybean oil at Decatur, Illinois. Note: Totals may not add due to rounding.