Grade 8 Spotlight on Science Skills - nbed.nb.caweb1.nbed.nb.ca/sites/ASD-E/STEMeast/Spotlight on...
30
Scientific Skill Extending Thinking Spotlight on Science Skills Grade 8
Transcript of Grade 8 Spotlight on Science Skills - nbed.nb.caweb1.nbed.nb.ca/sites/ASD-E/STEMeast/Spotlight on...

Scientific Skill � Extending Thinking
Spotlight on Science Skills
Grade 8

Acknowledgements The New Brunswick Department of Education and Early Childhood Development gratefully acknowledges the contributions of the following groups and individuals toward the development of the New Brunswick Spotlight on Science Skills – Grade 8. • Development Team:
• Judson Waye – ASD-N • Adam Hayward – ASD-N
• NB Department of Education and Early Childhood Development
• Kathy Hildebrand, Learning Specialist, Science and Mathematics
• Science Learning Specialists and science teachers of New Brunswick who provided invaluable input
and feedback throughout the development and implementation of this document.
2015 Department of Education and Early Childhood Development
Educational Programs and Services

Objective The Atlantic provinces’ science curriculum is guided by the vision that all students will have an opportunity to develop scientific literacy.
Scientific literacy is an evolving combination of the science-related attitudes, skills, and knowledge that students need to develop inquiry, problem-solving, and decision-making abilities, to become lifelong learners, and to maintain a sense of wonder about the world around them. Foundation for the Atlantic Canada Science Curriculum, page 11
The Spotlight on Science Skills series of documents: ! Clusters the existing Atlantic Canada skill outcomes into nine scientific practices
(questioning, predicting/hypothesizing, variables, experimental design, collecting data/observations, organizing/displaying data, analyzing data, making conclusions, applying learning).
! Provides educators with an elaboration of the scientific practice including explanations of specialized terminology. It indicates what students have learned in previous grades and what the focus is for learning in the current grade.
! Provides a list of achievement indicators with an accompanying rubric for each scientific practice to further clarify expectations and guide educators in determining whether their students have met the outcome.
Overview of Outcomes GCO: Plan & Perform (PP) - Ask questions, make predictions about objects and events and develop fair tests to investigate those questions. Observe and investigate their environment and record the results SCO: PP1 - Propose scientific questions SCO: PP2 - State a prediction and a hypothesis based on an observed pattern of events SCO: PP3 - Identify major variables to control and test in investigations SCO: PP4 - Plan a set of steps to solve a practical problem SCO: PP5 - Record observations and collect relevant data GCO: Analyze & Explain (AE) - Interpret findings from investigations using appropriate methods. Work collaboratively to carry out science-related activities, and communicate ideas, procedures and results. SCO: AE1 - Classify by Attributes & Display of Relevant Data SCO: AE2 - Analysis of Data Representations: Trends, Discrepancies & Sources of Error SCO: AE3 - Conclusions SCO: AE4 - Applications of Learning

Scientific Skill - Questioning
New Brunswick Spotlight on Science Skills: Grade 8 April 2015
4
GCO: Plan & Perform (PP) Ask questions, make predictions about objects and events and develop fair tests to investigate those questions. Observe and investigate their environment and record the results SCO: PP1 Propose scientific questions Scope and Sequence of Outcomes
Grades 4-6 Grades 7-9 Grades 10-12
204-1 Propose questions to investigate and practical problems to solve
208-2 Identify questions to investigate arising from practical problems and issues
212-1 Identify questions to investigate that arise from practical problems and issues
204-2 Rephrase questions in a testable form
208-1 Rephrase questions in a testable form and clearly define practical problems 212-2 Define and delimit
problems to facilitate investigations 208-3 Define and delimit
questions and problems to facilitate investigation
Elaboration Guiding Questions: • What do I want my students to learn? • What do I want my students to understand and be able to do? Before writing a testable question, students will be able to pose an initial scientific question. Scientific questions may have different purposes: for research, leading to an innovation, or designing an experiment. If the question is a yes or no answer or an opinion, students should be encouraged to rewrite the question to be unbiased.
Research Innovation Experiment/Investigation How does a tuning fork make salt jump?
How might we make this better?
What happens if I use another tuning fork?
Will there be a full moon tonight?
What type of fertilizer will make grass grow greener?
What changes can be made to make this work more efficiently?
From an initial scientific question, students are able to alter a scientific problem or question into a testable form. A testable question is one that can be answered by designing and conducting an experiment. In order for a question to be deemed testable, the question must clearly identify the variable to test and the variable to measure. Testable questions are always about changing one thing to see what the effect is on another thing. Testable questions have two parts: Independent and Dependent Variables The independent variable (IV) is the variable that will be changed by the scientist. A good experiment has only one independent variable. The dependent variable (DV) is the variable being measured in the experiment.
• Scaffold 1- Does changing __IV___ affect __DV___?
Connection to Communication
• Communicate questions, ideas, intentions, plans, and results, using lists, notes in point form, sentences, data tables, graphs, drawings, oral language and other means.

Scientific Skill - Questioning
New Brunswick Spotlight on Science Skills: Grade 8 April 2015
5
• Scaffold 2 - How does changing __IV___ affect __DV___? • Scaffold 3 - If I change __IV___, will it affect __DV___?
e.g., If they wash their hands (variable to be tested/IV), will the number of days students are absent decrease (variable to measure/DV)?
Initial Scientific Question Testable Question
What happens if I use another tuning fork? If we use different types of tuning forks, will the rate of sound vibrations be the same?
What changes can be made to make this work more efficiently?
Does changing the type of light bulb affect energy consumption?
Students should understand that precise language is very important to writing a good testable question. Students should replace terms such as “better” and “improve” with the specific measure to be improved. For example:
“If I change the wheels, will it improve how the car rolls?” is not precise language, since the variable to be measured is not specific and is open to interpretation.
“If I change the wheels, will it increase the distance travelled?” is an appropriate statement because it indicates what will be measured. Achievement Indicators Guiding Questions: • What evidence will I look for to know that learning occurred? • What should students demonstrate to show their understanding of the Scientific Process Skill? Use the following set of indicators as a guide to determine whether students have met the corresponding specific outcome.
i. Write questions using language that suggests an investigation ii. Develop testable questions that indicate the variable to test (independent variable) iii. Develop testable questions that indicate the variable to be measured/observed
(dependent variable) iv. Use language that is precise and relevant to the question
Achievement Rubric Exceeding- 4 Meeting - 3 Approaching - 2 Working Below - 1
Testable Question
Testable and measureable/ observable using specific language
Testable and measureable/ observable form but not specific to the parameters
Any other answer
Scientific Skill - Predicting and Hypothesizing
New Brunswick Spotlight on Science Skills: Grade 8 April 2015
6
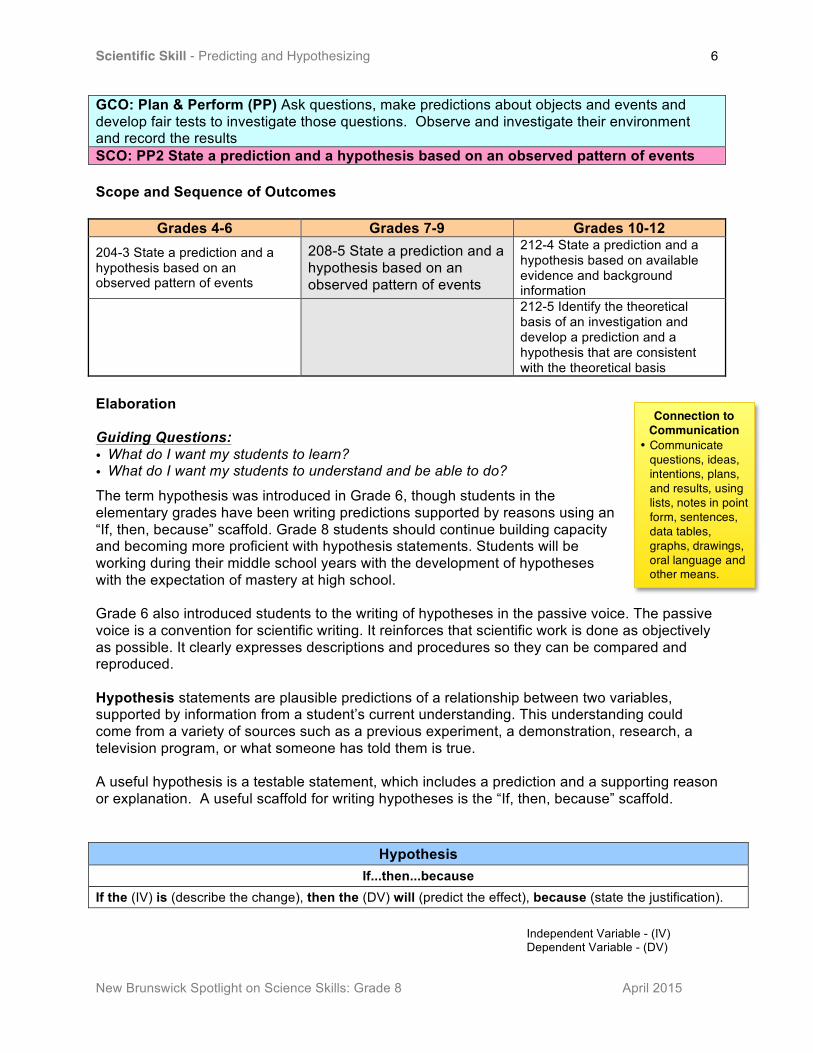
GCO: Plan & Perform (PP) Ask questions, make predictions about objects and events and develop fair tests to investigate those questions. Observe and investigate their environment and record the results SCO: PP2 State a prediction and a hypothesis based on an observed pattern of events Scope and Sequence of Outcomes
Grades 4-6 Grades 7-9 Grades 10-12 204-3 State a prediction and a hypothesis based on an observed pattern of events
208-5 State a prediction and a hypothesis based on an observed pattern of events
212-4 State a prediction and a hypothesis based on available evidence and background information
212-5 Identify the theoretical basis of an investigation and develop a prediction and a hypothesis that are consistent with the theoretical basis
Elaboration Guiding Questions: • What do I want my students to learn? • What do I want my students to understand and be able to do?
The term hypothesis was introduced in Grade 6, though students in the elementary grades have been writing predictions supported by reasons using an “If, then, because” scaffold. Grade 8 students should continue building capacity and becoming more proficient with hypothesis statements. Students will be working during their middle school years with the development of hypotheses with the expectation of mastery at high school. Grade 6 also introduced students to the writing of hypotheses in the passive voice. The passive voice is a convention for scientific writing. It reinforces that scientific work is done as objectively as possible. It clearly expresses descriptions and procedures so they can be compared and reproduced. Hypothesis statements are plausible predictions of a relationship between two variables, supported by information from a student’s current understanding. This understanding could come from a variety of sources such as a previous experiment, a demonstration, research, a television program, or what someone has told them is true. A useful hypothesis is a testable statement, which includes a prediction and a supporting reason or explanation. A useful scaffold for writing hypotheses is the “If, then, because” scaffold.
Hypothesis If...then...because
If the (IV) is (describe the change), then the (DV) will (predict the effect), because (state the justification). Independent Variable - (IV) Dependent Variable - (DV)
Connection to Communication
• Communicate questions, ideas, intentions, plans, and results, using lists, notes in point form, sentences, data tables, graphs, drawings, oral language and other means.

Scientific Skill - Predicting and Hypothesizing
New Brunswick Spotlight on Science Skills: Grade 8 April 2015
7
Hypothesis examples:
• If exposure to UV light is increased then more people will get skin cancer, because research shows that people in warmer climates get more skin cancer than people in cold climates. (supported by research)
• If the cones of a tree are pink rather than yellow, then flies will lay more eggs in them, because initial observations seem to show this trend. (supported by observations)
• If salt concentrations in soil are increased then the rate of plant growth will decrease, because plants growing near salt water are smaller. (supported by research or observations)
• If air temperature is reduced, then leaf colour will change, because leaves change colour in the fall when it starts to get cooler. (supported by observations)
Students have been using an “If, then, because” scaffold in the elementary grades for writing predictions with a supporting reason. In Grade 8, a hypothesis will be specific with variables that may be more conceptually advanced, and possibly requiring more factors to be deliberately controlled than in previous grades.
For example:
Grade 6 Grade 7 Grade 8 If the amount of fertilizer is increased then the grass will grow tall faster, because the fertilizer will provide more nutrients that have been shown to support growth.
If the amount of fertilizer (20-20-20) is increased then the rate of growth (height) of the grass will increase, because it will provide extra nitrogen which the manufacturer has said will increase growth.
As the amount of fertilizer (20-20-20) is increased there will be a peak in the rate of growth (height) of the grass, because research indicates too much phosphorus inhibits plant growth.
A hypothesis is a tentative statement, which the results of the investigation will support or not. Students have a tendency to want their hypothesis to be proven correct. Results may be expected or unexpected. The hypothesis is not found to be “wrong”, but rather supported or unsupported. The conclusion will be equally correct whether or not the evidence supports the hypothesis. Furthermore, when the hypothesis is supported, it does not necessarily mean the hypothesis is correct. For example:
Hypothesis
If exposure to UV light is increased then more people will get skin cancer, because research shows that people in warmer climates get more skin cancer than people in cold climates.
! If supported
One must still consider that factors other than exposure to UV light may be responsible for or contribute to skin cancer.
! If not supported
There may be more than one factor necessary for skin cancer to occur, such as exposure to skin cancer and genetic predisposition to cancer.

Scientific Skill - Predicting and Hypothesizing
New Brunswick Spotlight on Science Skills: Grade 8 April 2015
8
Depending on the context, estimation is a skill that can enhance the ability to make an accurate scientific prediction. Estimation is a strategy for determining approximate values or quantities, usually by referring to benchmarks or using referents, or for determining the reasonableness of calculated values. Based on the grade level standards (cross-curricular with Math), students should use estimation strategies where appropriate. Achievement Indicators Guiding Questions: • What evidence will I look for to know that learning occurred? • What should students demonstrate to show their understanding of the Scientific Process
Skill? Use the following set of indicators as a guide to determine whether students have met the corresponding specific outcome.
i. Write prediction or hypothesis statements that are testable (suggesting a test of how the two variables are related).
ii. Write hypothesis statements using the “If, then, because” format, including a plausible reason (from previous learning and/or research); tentative words such as evidence suggests and may may be used.
iii. Write prediction and hypothesis statements in passive voice. Achievement Rubric Exceeding- 4 Meeting - 3 Approaching - 2 Working Below - 1
Prediction and Hypothesis
• Makes a prediction or hypothesis statement which is testable; is specific with details
• Makes a hypothesis using any format: ! relevant to the
question ! testable ! includes a
plausible reason (refers to research)
• Written in passive voice
• Makes a prediction or hypothesis statement which is testable and specific
• Makes a hypothesis using an “If, then, because” scaffold: ! relevant to the
question ! testable ! includes a
plausible reason with some detail (may refer to readings or research)
• Written passive voice
• Prediction or hypothesis is testable but is not specific
• Makes a hypothesis using an “If, then, because” scaffold including a reason which may be relevant but lacks detail
• Not written in passive voice
Prediction or hypothesis is not clearly testable
Makes a hypothesis, but the reason is not clearly expressed, missing, or irrelevant
Any other answer
Scientific Skill - Identifying Variables
New Brunswick Spotlight on Science Skills: Grade 8 April 2015
9
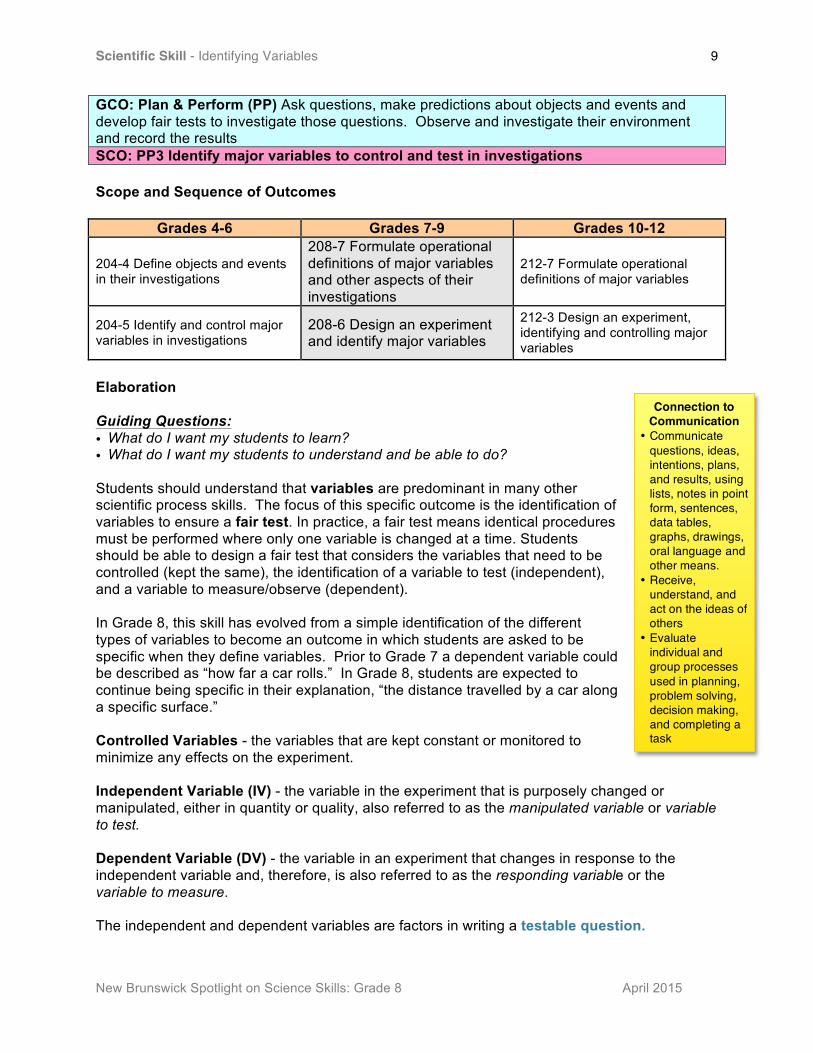
GCO: Plan & Perform (PP) Ask questions, make predictions about objects and events and develop fair tests to investigate those questions. Observe and investigate their environment and record the results SCO: PP3 Identify major variables to control and test in investigations Scope and Sequence of Outcomes
Grades 4-6 Grades 7-9 Grades 10-12
204-4 Define objects and events in their investigations
208-7 Formulate operational definitions of major variables and other aspects of their investigations
212-7 Formulate operational definitions of major variables
204-5 Identify and control major variables in investigations
208-6 Design an experiment and identify major variables
212-3 Design an experiment, identifying and controlling major variables
Elaboration Guiding Questions: • What do I want my students to learn? • What do I want my students to understand and be able to do? Students should understand that variables are predominant in many other scientific process skills. The focus of this specific outcome is the identification of variables to ensure a fair test. In practice, a fair test means identical procedures must be performed where only one variable is changed at a time. Students should be able to design a fair test that considers the variables that need to be controlled (kept the same), the identification of a variable to test (independent), and a variable to measure/observe (dependent). In Grade 8, this skill has evolved from a simple identification of the different types of variables to become an outcome in which students are asked to be specific when they define variables. Prior to Grade 7 a dependent variable could be described as “how far a car rolls.” In Grade 8, students are expected to continue being specific in their explanation, “the distance travelled by a car along a specific surface.” Controlled Variables - the variables that are kept constant or monitored to minimize any effects on the experiment. Independent Variable (IV) - the variable in the experiment that is purposely changed or manipulated, either in quantity or quality, also referred to as the manipulated variable or variable to test. Dependent Variable (DV) - the variable in an experiment that changes in response to the independent variable and, therefore, is also referred to as the responding variable or the variable to measure. The independent and dependent variables are factors in writing a testable question.
Connection to Communication
• Communicate questions, ideas, intentions, plans, and results, using lists, notes in point form, sentences, data tables, graphs, drawings, oral language and other means.
• Receive, understand, and act on the ideas of others
• Evaluate individual and group processes used in planning, problem solving, decision making, and completing a task
Scientific Skill - Identifying Variables
New Brunswick Spotlight on Science Skills: Grade 8 April 2015
10
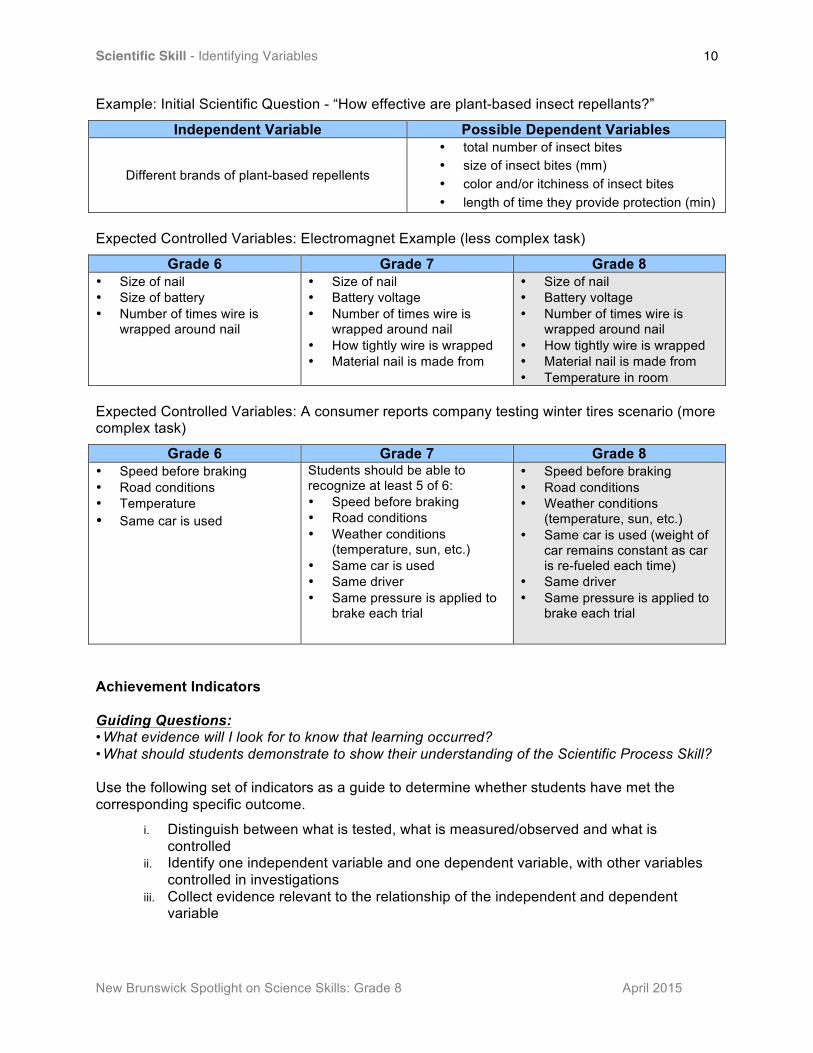
Example: Initial Scientific Question - “How effective are plant-based insect repellants?”
Independent Variable Possible Dependent Variables
Different brands of plant-based repellents
• total number of insect bites • size of insect bites (mm) • color and/or itchiness of insect bites • length of time they provide protection (min)
Expected Controlled Variables: Electromagnet Example (less complex task)
Grade 6 Grade 7 Grade 8 • Size of nail • Size of battery • Number of times wire is
wrapped around nail
• Size of nail • Battery voltage • Number of times wire is
wrapped around nail • How tightly wire is wrapped • Material nail is made from
• Size of nail • Battery voltage • Number of times wire is
wrapped around nail • How tightly wire is wrapped • Material nail is made from • Temperature in room
Expected Controlled Variables: A consumer reports company testing winter tires scenario (more complex task)
Grade 6 Grade 7 Grade 8 • Speed before braking • Road conditions • Temperature • Same car is used
Students should be able to recognize at least 5 of 6: • Speed before braking • Road conditions • Weather conditions
(temperature, sun, etc.) • Same car is used • Same driver • Same pressure is applied to
brake each trial
• Speed before braking • Road conditions • Weather conditions
(temperature, sun, etc.) • Same car is used (weight of
car remains constant as car is re-fueled each time)
• Same driver • Same pressure is applied to
brake each trial
Achievement Indicators Guiding Questions: • What evidence will I look for to know that learning occurred? • What should students demonstrate to show their understanding of the Scientific Process Skill? Use the following set of indicators as a guide to determine whether students have met the corresponding specific outcome.
i. Distinguish between what is tested, what is measured/observed and what is controlled
ii. Identify one independent variable and one dependent variable, with other variables controlled in investigations
iii. Collect evidence relevant to the relationship of the independent and dependent variable

Scientific Skill - Identifying Variables
New Brunswick Spotlight on Science Skills: Grade 8 April 2015
11
Achievement Rubric
Exceeding- 4 Meeting - 3 Approaching - 2 Working Below - 1
Controlled
Depending on the complexity of the investigation, most or all of the necessary variables are controlled and described in detail
Depending on the complexity of the investigation, most or all of the necessary variables are controlled
Only controls some of the relevant variables
Controls variables that are not relevant to the investigation
Any other answer
Independent
Students identify one independent variable (variable to be tested) that fits the question
Students identify one independent variable (variable to be tested) not relevant to the question
Any other answer
Dependent
Students identify one dependent variable (variable to be measured) that fits the question and is explained
Students identify one dependent variable (variable to be measured) that fits the question
Students identify one dependent variable (variable to be measured) not relevant to the question
Any other answer

Scientific Skill - Designing Investigations
New Brunswick Spotlight on Science Skills: Grade 8 April 2015
12
GCO: Plan & Perform (PP) Ask questions, make predictions about objects and events and develop fair tests to investigate those questions. Observe and investigate their environment and record the results SCO: PP4 Plan a set of steps to solve a practical problem Scope and Sequence of Outcomes
Grades 4-6 Grades 7-9 Grades 10-12 204-6 Identify various methods for finding answers to given problems, and ultimately select one that is appropriate
208-4 Propose alternative solutions to a given practical problem, select one, and develop a plan
204-7 Plan a set of steps to solve a practical problem and carry out a fair test of a science-related idea
208-6 Design an experiment and identify major variables
212-3 Design an experiment, identifying and controlling major variables 212-6 Design an experiment and identify specific variables
204-8 Identify appropriate tools, instruments, and materials to complete their investigations
208-8 Select appropriate methods and tools for collecting data for solving problems
212-9 Develop appropriate sample procedures
205-8 Identify and use a variety of sources and technologies to gather pertinent information
209-5 Select and integrate information from various print and electronic sources or from several parts of the same source
213-7 Select and integrate information from various print and electronic sources or from several parts of the same source
Elaboration Guiding Questions: • What do I want my students to learn? • What do I want my students to understand and be able to do? Students should be able to design a plan that they will use to fairly test an initial idea or question in a safe manner. In practice, a fair test means identical procedures must be performed where only one variable is changed at a time. The focus of these outcomes is the planning of steps and experimental design. There are a variety of components that make up experimental design. Requirements of experimental design:
• Identification of needed equipment and materials • Identification of variables (Controls & Independent/Dependent) • Planning a set of steps:
• to test a single question • minimize bias through design • which may incorporate multiple trials to increase accuracy • that can be repeated by someone else
Connection to Communication
• Communicate questions, ideas, intentions, plans, and results, using lists, notes in point form, sentences data tables, graphs, drawings, oral language and other means
• Work co-operatively with team members to develop and carry out a plan, and troubleshoot problems as they arise
• Receive, understand, and act on the ideas of others
• Evaluate individual and group processes used in planning, problem solving, decision making, and completing a task
• Ensure safety of self and others

Scientific Skill - Designing Investigations
New Brunswick Spotlight on Science Skills: Grade 8 April 2015
13
Students are also expected to follow and carry out procedures safely (both teacher-directed and student-designed) using appropriate materials and tools effectively. In Grade 8 students are introduced to using control and experimental groups to fairly test their investigation. Control Group: The group in an experiment that receives the exact treatment as the experimental group except it does not receive any change of the independent variable. It is the group to which the experimental groups are compared Experimental Groups: The groups or trials in an experiment that changes in response to independent variable. First introduced in Grade 6, students in Grade 8 should continue to build proficiency to minimize bias and to incorporate multiple trials in the design of investigations. Bias Holding a scientific bias means to unfairly favour one variable against another. In order for a test to be deemed fair it must be done in a way that eliminates one variable having an advantage. Identical procedures must be uniformly performed. For example, every time you release your paper airplane it’s uniformly performed, regardless of the type of paper used. Multiple Trials It is often important to perform multiple trials of an experiment to ensure that the results are accurate, reliable, and reproducible. If the variable was accidentally changed in the first trial, this becomes obvious in the following trials and can be corrected in future trials. The number of trials required depends on the amount of time to conduct the experiment and the nature of the task.
Grade 8 Language Arts Reading and Writing Standards Form: Instructions/Procedures Purpose: to tell how to do something Goal or aim: identifies topic by title or opening statement(s) Materials/Ingredients: lists materials Method/process: includes key steps in correct order with adequate details focusing on how/when Conclusion or Evaluation: includes a closing statement or an evaluation which may be a photograph or drawing of the completed item Special Features
• May include headings, illustrations, diagrams or labels • Numbered-steps or words showing sequence (first, next, then) • Point form or full sentences starting with sequence word or verbs • Present tense often written as commands • Technical language – verbs, adverbs and adjectives (e.g., whip the cooled cream vigorously)

Scientific Skill - Designing Investigations
New Brunswick Spotlight on Science Skills: Grade 8 April 2015
14
Achievement Indicators Guiding Questions: • What evidence will I look for to know that learning occurred? • What should students demonstrate to show their understanding of the Scientific Process Skill? Use the following set of indicators as a guide to determine whether students have met the corresponding specific outcome.
i. Plan procedures with a set of steps to test a single question ii. Plan procedures to minimize experimental bias iii. Plan procedures to use multiple trials to increase accuracy, if appropriate iv. Plan procedures with enough detail they can be repeated by someone else v. Plan procedures identifying needed equipment and materials vi. Plan procedures identifying relevant measurements and/or observations to be made vii. Plan procedures with one independent and one dependent variable and written in a way
that controls other major variables

Scientific Skill - Designing Investigations
New Brunswick Spotlight on Science Skills: Grade 8 April 2015
15
Achievement Rubric Exceeding- 4 Meeting - 3 Approaching - 2 Working Below - 1
Planning an investigation
Independently, students perform: • Procedures have a
set of steps to test a single question
• Procedural design minimizes experimental bias
• Procedural design uses multiple trials to increase accuracy (if appropriate)
• Procedures are detailed enough to be repeated by someone else
• Procedures identify needed equipment and materials
• Procedures identify relevant measurements and/or observations to be made
• Procedures have one independent and one dependent variable and is written in a way that controls other major variables
• Procedures have an experimental group compared to a control group
Independently, students perform: • Procedures have a
set of steps to test a single question
• Procedural design minimizes experimental bias
• Procedural design uses multiple trials to increase accuracy (if appropriate)
• Procedures are detailed enough to be repeated by someone else
• Procedures identify needed equipment and materials
• Procedures identify relevant measurements and/or observations to be made
• Procedures have one independent and one dependent variable and is written in a way that controls other major variables
Independently, students perform: • Procedures have a
set of steps to test a single question
• Procedures are detailed enough to be repeated by someone else
• Procedures identify needed equipment and materials
• Procedures identify relevant measurements and/or observations to be made
• Procedures have one independent and one dependent variable and is written in a way that controls other major variables
Independently students perform 3-4 of the following: • Procedures have a
set of steps to test a single question
• Procedures are detailed enough to be repeated by someone else
• Procedures identify needed equipment and materials
• Procedures identify relevant measurements and/or observations to be made
• Procedures have one independent and one dependent variable and is written in a way that controls other major variables
Students may require support using control and experimental groups
Students may require support with: • Procedural design
minimizes experimental bias
• Procedural design uses multiple trials to increase accuracy (if appropriate)
Students require support with other achievement indicators
Any other answer

Scientific Skill - Collecting and Recording Data
New Brunswick Spotlight on Science Skills: Grade 8 April 2015
16
GCO: Plan & Perform (PP) Ask questions, make predictions about objects and events and develop fair tests to investigate those questions. Observe and investigate their environment and record the results SCO: PP5 Recording observations and collecting relevant data Scope and Sequence of Outcomes
Grades 4-6 Grades 7-9 Grades 10-12 205-5 Make observations and collect information relevant to a given question or problem 209-4 Organize data, using a
format that is appropriate to the task or experiment
205-7 Record observations using a single word, notes in point form, sentences, and simple diagrams and charts
212-3 Use instruments effectively and accurately for collecting data
Elaboration Guiding Questions: • What do I want my students to learn? • What do I want my students to understand and be able to do? By Grade 8, students should be proficient at recording appropriate observations. It should be understood that students are able to record all relevant information (quantitative and qualitative data) in an appropriate format based on the specific task. In Grade 8 recorded observations should continue to be precise and specific to the given task. Quantitative Data - Data that can be measured; numbers with unit of measurement are recorded. Examples include: length, height, area, volume, weight, speed, time, temperature, humidity, sound level, cost, age, and so on. Students should understand that they must accurately use scientific devices and equipment to measure. In Grade 8, when the proposed question suggests that variables should be measured, then proper use of an appropriate instrument is critical to the evidence. For example, when measuring the volume of a liquid, students should choose a graduated cylinder rather than a standard beaker. Qualitative Data - Data that can be observed but not measured. It usually describes characteristics or qualities. Examples include: colour, odour, texture, appearance, or data that is described by category (e.g., the colour of the sky) Students should be able to distinguish their observations from making an inference. Observations require you to use one or more of your five senses to notice or determine something. Inferences are statements that combine observations with other knowledge. For example: you see steam rising from a cup of coffee
! “steam is rising from the cup of coffee” (observation) ! “the coffee is hot” (inference).
Connection to Communication
• Communicate questions, ideas, intentions, plans, and results, using lists, notes in point form, sentences data tables, graphs, drawings, oral language and other means
• Receive, understand, and act on the ideas of others
• Evaluate individual and group processes used in planning, problem solving, decision making, and completing a task
• Ensure safety of self and others
Scientific Skill - Collecting and Recording Data
New Brunswick Spotlight on Science Skills: Grade 8 April 2015
17
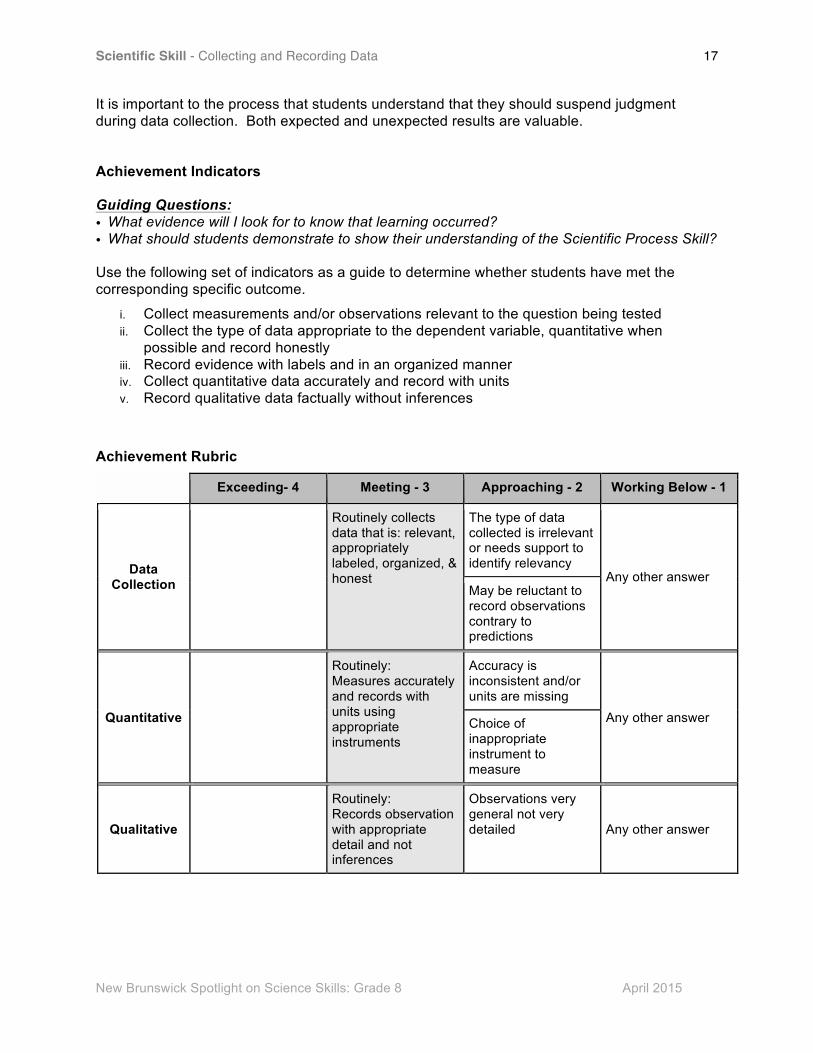
It is important to the process that students understand that they should suspend judgment during data collection. Both expected and unexpected results are valuable. Achievement Indicators Guiding Questions: • What evidence will I look for to know that learning occurred? • What should students demonstrate to show their understanding of the Scientific Process Skill? Use the following set of indicators as a guide to determine whether students have met the corresponding specific outcome.
i. Collect measurements and/or observations relevant to the question being tested ii. Collect the type of data appropriate to the dependent variable, quantitative when
possible and record honestly iii. Record evidence with labels and in an organized manner iv. Collect quantitative data accurately and record with units v. Record qualitative data factually without inferences
Achievement Rubric
Exceeding- 4 Meeting - 3 Approaching - 2 Working Below - 1
Data Collection
Routinely collects data that is: relevant, appropriately labeled, organized, & honest
The type of data collected is irrelevant or needs support to identify relevancy
Any other answer May be reluctant to record observations contrary to predictions
Quantitative
Routinely: Measures accurately and records with units using appropriate instruments
Accuracy is inconsistent and/or units are missing
Any other answer Choice of inappropriate instrument to measure
Qualitative
Routinely: Records observation with appropriate detail and not inferences
Observations very general not very detailed Any other answer

Scientific Skill - Organizing and Displaying Data
New Brunswick Spotlight on Science Skills: Grade 8 April 2015
18
GCO: Analyze & Explain (AE) Interpret findings from investigations using appropriate methods. Work collaboratively to carry out science-related activities, and communicate ideas, procedures and results. SCO: AE1 Classify by Attributes & Display of Relevant Data Scope and Sequence of Outcomes
Grades 4-6 Grades 7-9 Grades 10-12
206-1 Classify according to several attributes and create a chart or diagram that shows the method of classification
210-1 Use or construct a classification key
214-1 Describe and apply classification systems and nomenclature used in the sciences 214-2 Identify limitations of a given classification system and identify alternative ways of classifying and accommodate anomalies
206-2 Compile and display data, by hand or by computer, in a variety of formats including frequency tallies, tables, and bar graphs
210-2 Compile and display data, by hand or computer, in a variety of formats, including diagrams, flow charts, tables, bar graphs, line graphs, and scatter plots
214-3 Compile and display evidence and information, by hand or computer, in a variety of formats, including diagrams, flow charts, tables, graphs, and scatter plots
210-3 Identify strengths and weaknesses of different methods of collecting and displaying data
Elaboration Guiding Questions: • What do I want my students to learn? • What do I want my students to understand and be able to do? This outcome is about organizing information after data collection. Organizing qualitative information: students need to be able to identify and classify according to attributes. The classification requires students to use sorting rules consistent with math standards. Beginning in Grade 2 math students are expected to sort objects using two attributes. In Grades 6 and 7, science students are using classification charts and dichotomous keys to sort and identify plant and animal species. At Grade 8, it is expected that students can use these types of charts to sort and classify regardless of the task. Organizing quantitative data: students need to be able to take quantitative data and display it in an appropriate format. The focus is taking raw data and creating charts or graphs that are appropriate to the task. Please refer to the Math curriculum for standards expected at each
Connection to Communication
• Communicate questions, ideas, intentions, plans, and results, using lists, notes in point form, sentences data tables, graphs, drawings, oral language and other means
• Evaluate individual and group processes used in planning, problem solving, decision making, and completing a task

Scientific Skill - Organizing and Displaying Data
New Brunswick Spotlight on Science Skills: Grade 8 April 2015
19
level.
The distinction between continuous and discrete data should be emphasized as students make use of line graphs. This was introduced in math in Grade 6. Continuous data includes an infinite number of values between two points and is shown by joining the data points. Discrete data has finite values (i.e., data that can be counted such as the number of pets), and the data between the points have no value. As a result the points in the graph should not be connected and no inferences can be made about values between two data points. Grade 8 students should be using appropriate graphs and they should recognize that the choice of scale can emphasize or de-emphasize trends based on the type of data that they have collected. This is also a mathematics outcome at Grade 8 (SP1). Grade 3 Math Standard Single Bar Graph
Grade 5 Math Standard Double Bar Graph
Grade 6 Math Standard Line Graph
Legend
Title
Axis label
Axis label
Intervals
Scale

Scientific Skill - Organizing and Displaying Data
New Brunswick Spotlight on Science Skills: Grade 8 April 2015
20
Achievement Indicators Guiding Questions: • What evidence will I look for to know that learning occurred? • What should students demonstrate to show their understanding of the Scientific Process Skill?
Use the following set of indicators as a guide to determine whether students have met the corresponding specific outcome.
i. Identify relevant characteristics that distinguish or are in common across a variety of items or organisms.
ii. Organize and display information about characteristics appropriately (e.g., Venn diagram, tree diagram)
iii. Use charts or graphs with appropriate titles and labels a. Graphs require data to be correctly displayed, correct scale, appropriate labels (x
and y axis), and an overall title b. Charts include all necessary headings and units
iv. Differentiate between discrete and continuous data and use the appropriate type of graph based on the data (e.g., bar graph, double bar graph, line graph, pictograph)
Achievement Rubric Exceeding- 4 Meeting - 3 Approaching - 2 Working Below - 1
Identify Relevant Attributes
Identifies relevant characteristics of items or organisms and group by similarities and/or differences
Includes characteristics not relevant to the questions or problem
Any other answer
Displaying Appropriately
Takes the initiative to display the data in various ways that reveal various patterns
Information is organized and displayed in a way appropriate to the data so that patterns and trends are apparent (Venn diagram, bar graph, etc.)
The type of organization of data selected does not reveal patterns and trends or is inappropriate to the type of data
Any other answer
Use of conventions with displays
Graphs with proper x and y axis (Convention in science is for IV on the x axis and the DV on the y axis)
Charts and graphs have all appropriate titles and labels and information is plotted correctly
Data or information is plotted correctly but has a minor error in the labels
Any other answer

Scientific Skill - Reflecting and Analyzing
New Brunswick Spotlight on Science Skills: Grade 8 April 2015
21
GCO: Analyze & Explain (AE) Interpret findings from investigations using appropriate methods. Work collaboratively to carry out science-related activities, and communicate ideas, procedures and results. SCO: AE2 Analysis of Data Representations: Trends, Discrepancies & Sources of Error Scope and Sequence of Outcomes
Grades 4-6 Grades 7-9 Grades 10-12
206-3 Identify and suggest explanations for patterns and discrepancies in data
210-4 Predict the value of a variable by interpolating and extrapolating from graphical data
214-6 Apply and assess methods of prediction
210-9 Calculate theoretical values of a variable
210-6 Interpret patterns and trends in data, and infer and explain relationships among the variables
214-5 Interpret patterns and trends in data, and infer or calculate linear and non-linear relationships among variables
210-7 Identify and suggest explanations for, discrepancies in data
214-7 Compare theoretical and empirical values and account for discrepancies
210-5 Identify the line of best fit on a scatter plot and interpolate or extrapolate based on the line of best fit
214-4 Identify a line of best fit on a scatter plot and interpolate or extrapolate based on line of best fit
210-10 Identify potential sources and determine the amount of error in measurement
214-10 Identify and explain sources of error and uncertainty in measurement and express results in a form that acknowledges the degree of uncertainty
214-8 Evaluate the relevance, reliability, and adequacy of data and data collection methods
Elaboration Guiding Questions: • What do I want my students to learn? • What do I want my students to understand and be able to do? This outcome is asking students to analyze data. Interpreting data is a critical-thinking process used by scientific researchers to review the data gathered in the course of an investigation. Drawing conclusions is a separate outcome though it is expected that they would be learned together. By Grade 6 students are expected to identify and explain patterns/trends in data. Students are expected to suggest a reasonable explanation(s) noting possible sources of error. Students should be able to describe the relationship the pattern/trend indicates. Interpreting data involves sorting into useful arrangements, looking for similarities and differences, thinking about missing data or errors, and summarizing what the data might mean.
Connection to Communication
• Communicate questions, ideas, intentions, plans, and results, using lists, notes in point form, sentences data tables, graphs, drawings, oral language and other means
Scientific Skill - Reflecting and Analyzing
New Brunswick Spotlight on Science Skills: Grade 8 April 2015
22
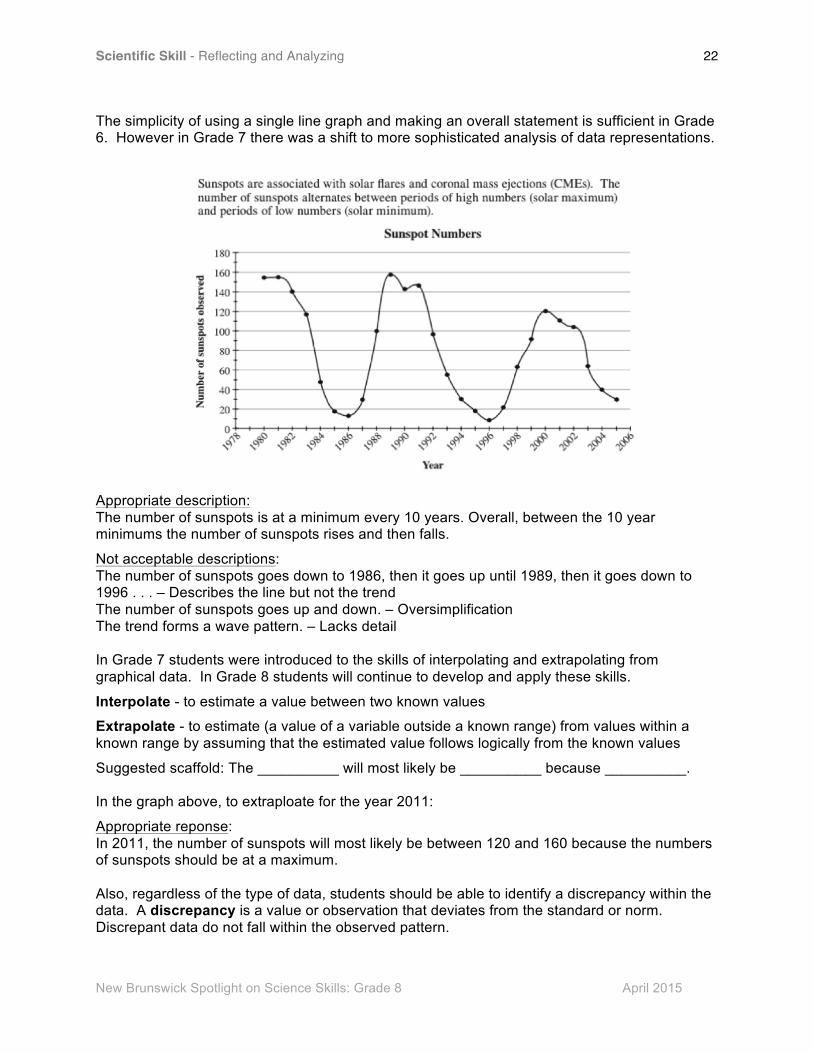
The simplicity of using a single line graph and making an overall statement is sufficient in Grade 6. However in Grade 7 there was a shift to more sophisticated analysis of data representations.
Appropriate description: The number of sunspots is at a minimum every 10 years. Overall, between the 10 year minimums the number of sunspots rises and then falls.
Not acceptable descriptions: The number of sunspots goes down to 1986, then it goes up until 1989, then it goes down to 1996 . . . – Describes the line but not the trend The number of sunspots goes up and down. – Oversimplification The trend forms a wave pattern. – Lacks detail In Grade 7 students were introduced to the skills of interpolating and extrapolating from graphical data. In Grade 8 students will continue to develop and apply these skills.
Interpolate - to estimate a value between two known values
Extrapolate - to estimate (a value of a variable outside a known range) from values within a known range by assuming that the estimated value follows logically from the known values
Suggested scaffold: The __________ will most likely be __________ because __________. In the graph above, to extraploate for the year 2011:
Appropriate reponse: In 2011, the number of sunspots will most likely be between 120 and 160 because the numbers of sunspots should be at a maximum. Also, regardless of the type of data, students should be able to identify a discrepancy within the data. A discrepancy is a value or observation that deviates from the standard or norm. Discrepant data do not fall within the observed pattern.

Scientific Skill - Reflecting and Analyzing
New Brunswick Spotlight on Science Skills: Grade 8 April 2015
23
*It should be noted scatter plots and the analysis of a line of best fit does not appear in the math curriculum until Grade 10. That being said, students should be making a deeper analysis via interpolation and extrapolation. Since students are expected to use line graphs with continuous data sets, the skill has expanded past the simple interpretation of the pattern or trend that is presented to predicting values between or beyond known values. Given the nature of middle level science, students will not be calculating theoretical values of variables. Students have been expected to identify sources of error in previous grades. Usually this has involved identifying factors that are difficult to keep consistent from trial to trial. For example: the amount of force and angle used by a human to launch a paper airplane. Students understand the use of devices and/or technologies can minimize such errors. For example, using a heart rate monitor is more accurate than using two fingers to determine pulse rate. The misconception for students is that use of technology completely eliminates errors and students neglect to realize that devices and technologies have error. For example, even a digital scale has an amount of error identified in its manual (i.e., +/- 0.1g) in a given temperature range. In Grade 8, students are expected to not only identify the sources of error but also attempt to calculate the amount of error in measurements arising from experimental design. For example, when students are using a stopwatch there are several milliseconds of error based on the reaction time of the person using the stopwatch. Students should identify and attempt to calculate these errors. Achievement Indicators Guiding Questions: • What evidence will I look for to know that learning occurred? • What should students demonstrate to show their understanding of the Scientific Process Skill? Use the following set of indicators as a guide to determine whether students have met the corresponding specific outcome.
i. Identify and explain a general pattern/trend/relationship from the observed and organized data
ii. Identify a discrepancy in data and note possible sources of error. iii. Use interpolation and/or extrapolation to identify values consistent with the pattern/trend. iv. Identify sources of error and suggest a reasonable amount of error in measurement
Scientific Skill - Reflecting and Analyzing
New Brunswick Spotlight on Science Skills: Grade 8 April 2015
24
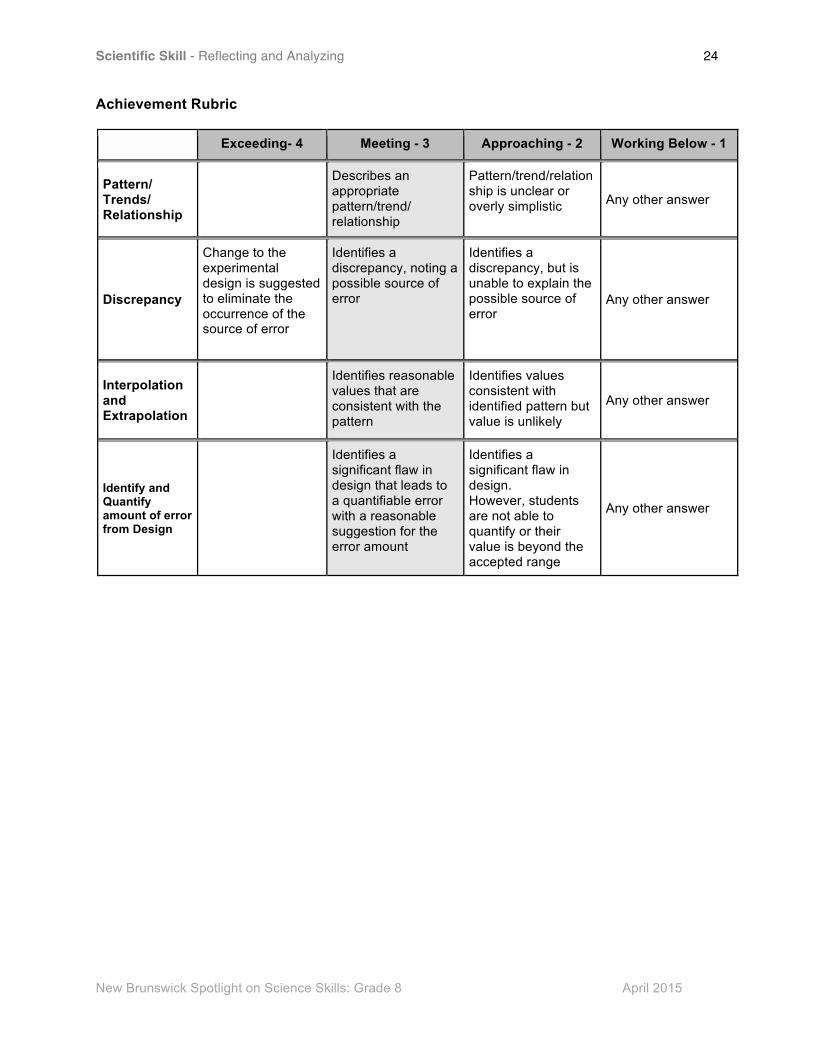
Achievement Rubric Exceeding- 4 Meeting - 3 Approaching - 2 Working Below - 1
Pattern/ Trends/ Relationship
Describes an appropriate pattern/trend/ relationship
Pattern/trend/relationship is unclear or overly simplistic Any other answer
Discrepancy
Change to the experimental design is suggested to eliminate the occurrence of the source of error
Identifies a discrepancy, noting a possible source of error
Identifies a discrepancy, but is unable to explain the possible source of error
Any other answer
Interpolation and Extrapolation
Identifies reasonable values that are consistent with the pattern
Identifies values consistent with identified pattern but value is unlikely
Any other answer
Identify and Quantify amount of error from Design
Identifies a significant flaw in design that leads to a quantifiable error with a reasonable suggestion for the error amount
Identifies a significant flaw in design. However, students are not able to quantify or their value is beyond the accepted range
Any other answer

Scientific Skill - Drawing Conclusions
New Brunswick Spotlight on Science Skills: Grade 8 April 2015
25
GCO: Analyze & Explain (AE) Interpret findings from investigations using appropriate methods. Work collaboratively to carry out science-related activities, and communicate ideas, procedures and results. SCO: AE3 Conclusions Scope and Sequence of Outcomes
Grades 4-6 Grades 7-9 Grades 10-12
206-5 Draw a conclusion, based on evidence gathered through research and observation, that answers an initial question
210-11 State a conclusion, based on experimental data, and explain how evidence gathered supports or refutes an initial idea
210-11 Provide a statement that addresses or answers the question investigated in light of a the link between data and the conclusion 214-12 Explain how data supports or refutes the hypothesis or prediction
Elaboration Guiding Questions: • What do I want my students to learn? • What do I want my students to understand and be able to do? Students should use information from readings, from previous learning, prior knowledge, and from evidence gained through investigation to draw conclusions. To make simple conclusions means that students are able make a statement based upon logic and the evidence available. It means to come to a determination of what is factual about one thing, based upon knowledge, evidence, and/or facts about something different but related. In Grade 8 students should, whenever possible, be using analyzed experimental data as the main support of their argument. Whether the prediction/hypothesis is supported or refuted is not a measure of success or failure since scientific knowledge is advanced by either result. Where possible students should compare the results of their investigation to those of others, recognize that results may vary and explain why. Comparison of findings to those of similar investigations can add weight to the conclusion. The conclusion: • will be framed around the initial question that was tested. As the student analyzes the data
it is important to ask the question: Did the change made (independent variable) cause the effect that was measured (dependent variable)?
• must either confirm, deny, or acknowledge uncertainty about the relationship between the two variables. The prediction/hypothesis may be supported or refuted based on the data.
• must either confirm or deny a relationship between the two variables and then describe the statistical data that support the final conclusion. If the data support your hypothesis - but it is believed it is not because of the independent variable, this distinction will need to be made.
• may comment on whether the investigation was a fair test and suggest improvements to experimental design.
Connection to Communication
• Communicate questions, ideas, intentions, plans, and results, using lists, notes in point form, sentences data tables, graphs, drawings, oral language and other means
• Defend a given position on an issue or problem on the basis of their findings

Scientific Skill - Drawing Conclusions
New Brunswick Spotlight on Science Skills: Grade 8 April 2015
26
Achievement Indicators Guiding Questions: • What evidence will I look for to know that learning occurred? • What should students demonstrate to show their understanding of the Scientific Process Skill? Use the following set of indicators as a guide to determine whether students have met the corresponding specific outcome.
i. Make a conclusion based on logic and available evidence ii. Make a conclusion that answers the initial question iii. Include a statement that their data either supports or refutes their initial
prediction/hypothesis iv. Justify this claim by providing evidence from data collected v. Compare the results of their investigation to those of others and recognize that results
may vary Achievement Rubric Exceeding- 4 Meeting - 3 Approaching - 2 Working Below - 1
Conclusion
• Reflects science understanding beyond that made available to students, indicating additional independent research
• Distinguishes if independent variable is actual cause to support/refute the hypothesis
• Reflects science understanding and gives some reason for results based on evidence
• States a relationship between variables and supporting evidence
• Is relevant to initial question and prediction/hypothesis
• May include suggestions to improve experimental design
• Compares findings of other similar investigations, if appropriate
Restates only the recorded results and observations or is a result of flawed reasoning
Any other answer
Scientific Skill � Extending Thinking
New Brunswick Spotlight on Science Skills: Grade 8 April 2015
27
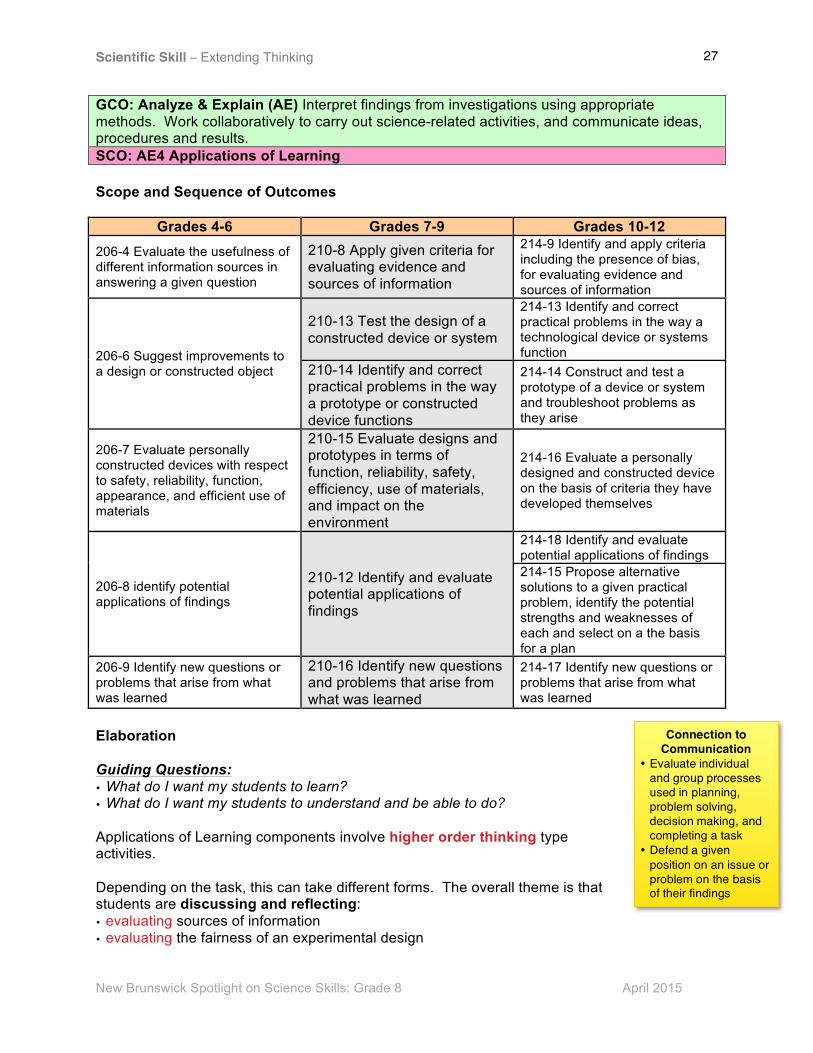
GCO: Analyze & Explain (AE) Interpret findings from investigations using appropriate methods. Work collaboratively to carry out science-related activities, and communicate ideas, procedures and results. SCO: AE4 Applications of Learning Scope and Sequence of Outcomes
Grades 4-6 Grades 7-9 Grades 10-12 206-4 Evaluate the usefulness of different information sources in answering a given question
210-8 Apply given criteria for evaluating evidence and sources of information
214-9 Identify and apply criteria including the presence of bias, for evaluating evidence and sources of information
206-6 Suggest improvements to a design or constructed object
210-13 Test the design of a constructed device or system
214-13 Identify and correct practical problems in the way a technological device or systems function
210-14 Identify and correct practical problems in the way a prototype or constructed device functions
214-14 Construct and test a prototype of a device or system and troubleshoot problems as they arise
206-7 Evaluate personally constructed devices with respect to safety, reliability, function, appearance, and efficient use of materials
210-15 Evaluate designs and prototypes in terms of function, reliability, safety, efficiency, use of materials, and impact on the environment
214-16 Evaluate a personally designed and constructed device on the basis of criteria they have developed themselves
206-8 identify potential applications of findings
210-12 Identify and evaluate potential applications of findings
214-18 Identify and evaluate potential applications of findings 214-15 Propose alternative solutions to a given practical problem, identify the potential strengths and weaknesses of each and select on a the basis for a plan
206-9 Identify new questions or problems that arise from what was learned
210-16 Identify new questions and problems that arise from what was learned
214-17 Identify new questions or problems that arise from what was learned
Elaboration Guiding Questions: • What do I want my students to learn? • What do I want my students to understand and be able to do? Applications of Learning components involve higher order thinking type activities. Depending on the task, this can take different forms. The overall theme is that students are discussing and reflecting: • evaluating sources of information • evaluating the fairness of an experimental design
Connection to Communication
• Evaluate individual and group processes used in planning, problem solving, decision making, and completing a task
• Defend a given position on an issue or problem on the basis of their findings

Scientific Skill � Extending Thinking
New Brunswick Spotlight on Science Skills: Grade 8 April 2015
28
• evaluating the usefulness of a constructed design • applying conclusions reached to real world scenarios • extending those initial ideas by creating new questions to test • evaluating their own/other’s thinking and explanation in terms of plausibility and scientific
evidence Students should be engaged in metacognition which is, put simply, thinking about one’s thinking. The burden of learning does not fall on the teacher alone. Students need to be aware of what they need to do to learn, to self-monitor. It includes: • The awareness of the need to connect how new knowledge relates to what one already knows • Opportunities for self-assessment such as explaining their thinking via discussions (with
varying views) or journal writing • Opportunities to test one’s ideas such as with investigations or designing items Achievement Indicators Guiding Questions: • What evidence will I look for to know that learning occurred? • What should students demonstrate to show their understanding of the Scientific Process Skill? Use the following set of indicators as a guide to determine whether students have met the corresponding specific outcome.
i. Demonstrate higher order thinking, depending on the task, communicated during discussion and/or reflection
Achievement Rubric Exceeding- 4 Meeting - 3 Approaching - 2 Working Below - 1
Applications of Learning
Generally demonstrates evidence of one or more of the following: • Justifies statements
by making connections to scientific knowledge,
• Displays evaluation of the concept taking into account other scientific knowledge,
• Identifies how findings can be applied to other situations
• Evaluates the relevancy and reliability of sources
• Extends idea to foster a new idea
Needs support or prompting to: • Justify statements
by making connections to scientific knowledge,
• Display evaluation of the concept taking into account other scientific knowledge,
• Identify how findings can be applied to other situations
• Evaluate the relevancy and reliability of sources
• Extend an idea to foster a new idea
Any other answer
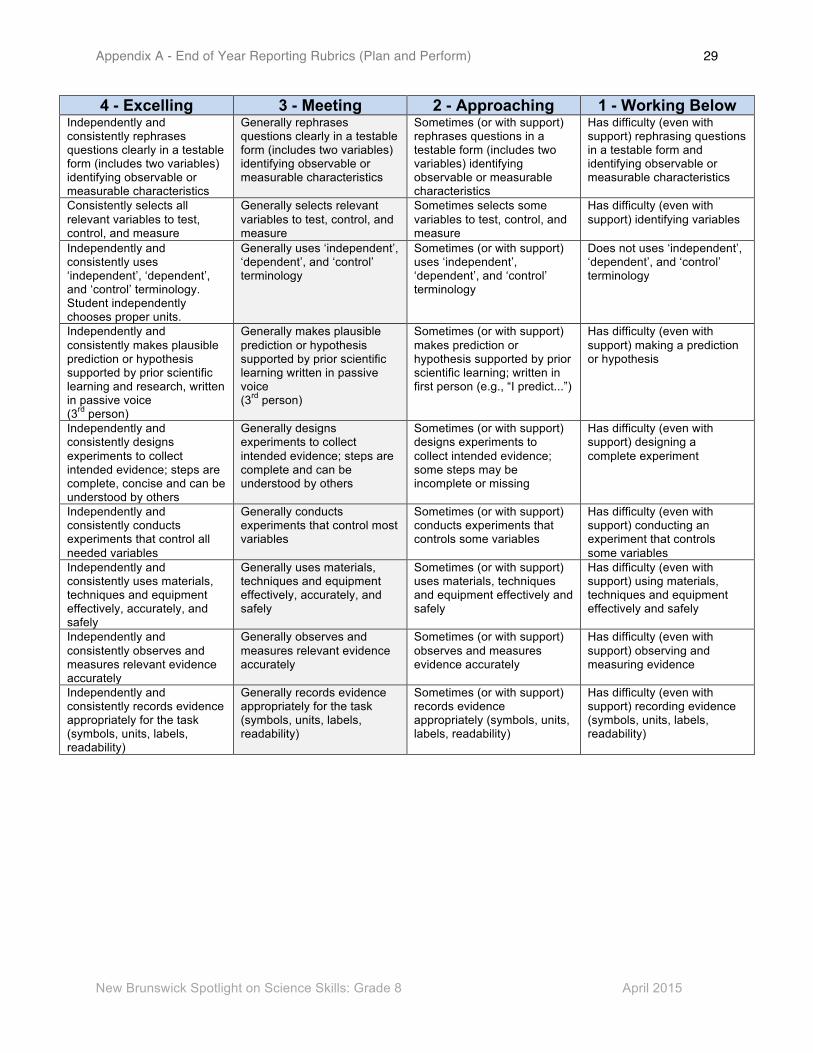
Appendix A - End of Year Reporting Rubrics (Plan and Perform)
New Brunswick Spotlight on Science Skills: Grade 8 April 2015
29
4 - Excelling 3 - Meeting 2 - Approaching 1 - Working Below Independently and consistently rephrases questions clearly in a testable form (includes two variables) identifying observable or measurable characteristics
Generally rephrases questions clearly in a testable form (includes two variables) identifying observable or measurable characteristics
Sometimes (or with support) rephrases questions in a testable form (includes two variables) identifying observable or measurable characteristics
Has difficulty (even with support) rephrasing questions in a testable form and identifying observable or measurable characteristics
Consistently selects all relevant variables to test, control, and measure
Generally selects relevant variables to test, control, and measure
Sometimes selects some variables to test, control, and measure
Has difficulty (even with support) identifying variables
Independently and consistently uses ‘independent’, ‘dependent’, and ‘control’ terminology. Student independently chooses proper units.
Generally uses ‘independent’, ‘dependent’, and ‘control’ terminology
Sometimes (or with support) uses ‘independent’, ‘dependent’, and ‘control’ terminology
Does not uses ‘independent’, ‘dependent’, and ‘control’ terminology
Independently and consistently makes plausible prediction or hypothesis supported by prior scientific learning and research, written in passive voice (3rd person)
Generally makes plausible prediction or hypothesis supported by prior scientific learning written in passive voice (3rd person)
Sometimes (or with support) makes prediction or hypothesis supported by prior scientific learning; written in first person (e.g., “I predict...”)
Has difficulty (even with support) making a prediction or hypothesis
Independently and consistently designs experiments to collect intended evidence; steps are complete, concise and can be understood by others
Generally designs experiments to collect intended evidence; steps are complete and can be understood by others
Sometimes (or with support) designs experiments to collect intended evidence; some steps may be incomplete or missing
Has difficulty (even with support) designing a complete experiment
Independently and consistently conducts experiments that control all needed variables
Generally conducts experiments that control most variables
Sometimes (or with support) conducts experiments that controls some variables
Has difficulty (even with support) conducting an experiment that controls some variables
Independently and consistently uses materials, techniques and equipment effectively, accurately, and safely
Generally uses materials, techniques and equipment effectively, accurately, and safely
Sometimes (or with support) uses materials, techniques and equipment effectively and safely
Has difficulty (even with support) using materials, techniques and equipment effectively and safely
Independently and consistently observes and measures relevant evidence accurately
Generally observes and measures relevant evidence accurately
Sometimes (or with support) observes and measures evidence accurately
Has difficulty (even with support) observing and measuring evidence
Independently and consistently records evidence appropriately for the task (symbols, units, labels, readability)
Generally records evidence appropriately for the task (symbols, units, labels, readability)
Sometimes (or with support) records evidence appropriately (symbols, units, labels, readability)
Has difficulty (even with support) recording evidence (symbols, units, labels, readability)

Appendix B - End of Year Reporting Rubrics (Analyze and Explain)
New Brunswick Spotlight on Science Skills: Grade 8 April 2015
30
4 - Excelling 3 - Meeting 2 - Approaching 1 - Working Below Consistently organizes evidence effectively and efficiently
Generally organizes evidence appropriately and effectively
Sometimes (or with support) organizes evidence appropriately
Has difficulty (even with support) organizing evidence appropriately
Consistently organizes evidence effectively and efficiently
Generally organizes evidence appropriately and effectively
Sometimes (or with support) organizes evidence appropriately
Has difficulty (even with support) organizing evidence appropriately
Independently and consistently makes predictions using data patterns and relationships
Generally makes predictions using data patterns and relationships
Sometimes (or with support) makes a prediction using data patterns
Has difficulty (even with support) making a prediction using data patterns
Independently and consistently states a conclusion based on data and explains how evidence supports or refutes an initial idea
Generally states a conclusion based on data and explains how evidence supports or refutes an initial idea
Sometimes (or with support) states a conclusion based on data
Has difficulty (even with support) stating a conclusion based on data
Independently and consistently identifies strengths and weaknesses of data collection and organization.
Generally identifies strengths and weaknesses of data collection and organization
Sometimes (or with support) identifies a strength or weakness of data collection and/or organization
Has difficulty identifying a strength or weakness of data collection and/or organization
Independently and consistently identifies and explains possible source(s) of error and discrepancies in data with suggestions for improved experimental design
Generally identifies possible source(s) of error and discrepancies in data
Sometimes (or with support) identifies some possible source(s) of error
Has difficulty (even with support) identifying a possible source of error
Independently and consistently identifies 2 or more new testable questions that arise from what was learned
Generally identifies 1-2 new questions that arise from what was learned (sometimes contains opinion)
Sometimes (or with support) identifies another question that arises from what was learned (often contains opinion)
Has difficulty (even with support) identifying another question that arises from what was learned (contain opinion)
Independently and consistently tests, evaluates and corrects problems of a constructed device and re-tests
Generally tests, evaluates and corrects problems of a constructed device
Sometimes (or with support) tests and identifies problems of a constructed device
Has difficulty (even with support) testing a constructed device
Consistently communicates questions, procedures, and results clearly, effectively and efficiently
Generally communicates questions, procedures, and results clearly and effectively
Sometimes (or with support) communicates questions, procedures, and results
Has difficulty (even with support) communicating questions, procedures, and results
Independently and consistently defends a position on an issue in a logical, reasoned way
Generally defends a position on an issue based on their findings
Sometimes (or with support) defends a position on an issue
Has difficulty (even with support) defending a position on an issue
Always uses specific science vocabulary appropriately
Generally uses specific science vocabulary appropriately
Sometimes uses science vocabulary appropriately
Rarely uses science vocabulary appropriately
Independently and consistently applies findings to other situations
Generally identifies and evaluates how findings can be applied to other situations
Sometimes (or with support) identifies how findings can be applied to another situation
Has difficulty (even with support) identifying how findings can be applied to another situation