GRADE 7 CURRICULUM GUIDE - Dinwiddie County Public … · 2016-09-20 · Investigate and describe...
54
7 th Grade Math Curriculum Dinwiddie County Public Schools provides each student the opportunity to become a productive citizen, engaging the entire community in the educational needs of our children.
Transcript of GRADE 7 CURRICULUM GUIDE - Dinwiddie County Public … · 2016-09-20 · Investigate and describe...
7th
Grade
Math Curriculum
Dinwiddie County Public Schools provides each
student the opportunity to become a productive citizen,
engaging the entire community in the educational
needs of our children.
2 Updated: 8-29-16
Dinwiddie County Public Schools
7th
Grade Math Curriculum
The DCPS scope and sequence/pacing guide contains key topics that must be cross referenced continuously with the
VDOE enhanced scope and sequence and VDOE curriculum framework.
Once taught, target skills should be cumulatively reviewed throughout the school year; emphasis should be placed on
covering skills that were most challenging according to assessment results.
Weekly math drills should start during the first nine weeks.
Manipulatives should be utilized throughout the entire school year to enhance number sense and promote mastery of concepts
and facts.
Daily thirty minute blocks should be dedicated to reviewing previously taught concepts and skills.
Use of PowerSchool Assessment should be incorporated into math instruction and assessment paying close attention to
technology enhanced items, terminology, and Webb’s DOK.
DOE LINKS
Mathematics SOL Curriculum Framework
Mathematical Instructional Resources
3 Updated: 8-29-16
ine
Weeks
Approximate # of
Days Taught
Topic Targeted SOL DOE
Curriculum Framework
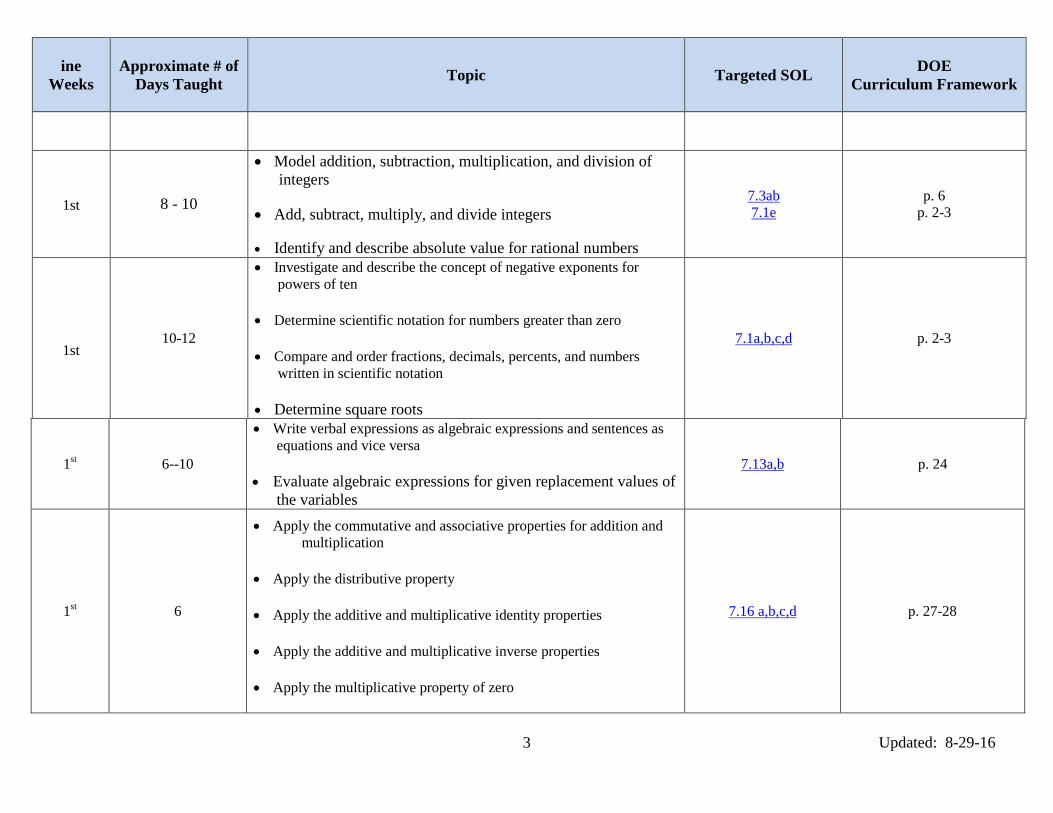
1st
8 - 10
Model addition, subtraction, multiplication, and division of
integers
Add, subtract, multiply, and divide integers
Identify and describe absolute value for rational numbers
7.3ab
7.1e
p. 6
p. 2-3
1st 10-12
Investigate and describe the concept of negative exponents for
powers of ten
Determine scientific notation for numbers greater than zero
Compare and order fractions, decimals, percents, and numbers
written in scientific notation
Determine square roots
7.1a,b,c,d p. 2-3
1st 6--10
Write verbal expressions as algebraic expressions and sentences as
equations and vice versa
Evaluate algebraic expressions for given replacement values of
the variables
7.13a,b p. 24
1st 6
Apply the commutative and associative properties for addition and
multiplication
Apply the distributive property
Apply the additive and multiplicative identity properties
Apply the additive and multiplicative inverse properties
Apply the multiplicative property of zero
7.16 a,b,c,d p. 27-28
4 Updated: 8-29-16
Nine
Weeks
Approximate # of
Days Taught
Topic Targeted SOL DOE
Curriculum Framework
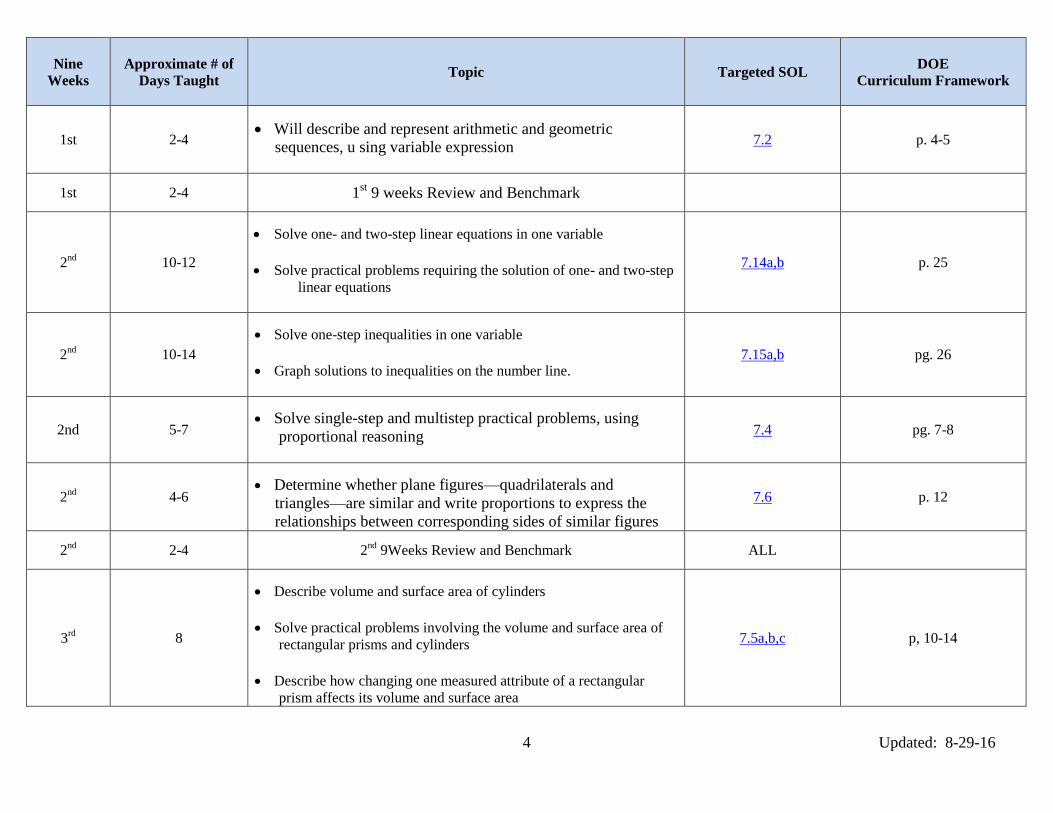
1st 2-4
Will describe and represent arithmetic and geometric
sequences, u sing variable expression
7.2 p. 4-5
1st 2-4 1st 9 weeks Review and Benchmark
2nd
10-12
Solve one- and two-step linear equations in one variable
Solve practical problems requiring the solution of one- and two-step
linear equations
7.14a,b p. 25
2nd
10-14
Solve one-step inequalities in one variable
Graph solutions to inequalities on the number line.
7.15a,b pg. 26
2nd 5-7
Solve single-step and multistep practical problems, using
proportional reasoning
7.4 pg. 7-8
2nd
4-6
Determine whether plane figures—quadrilaterals and
triangles—are similar and write proportions to express the
relationships between corresponding sides of similar figures
7.6 p. 12
2nd
2-4 2nd
9Weeks Review and Benchmark ALL
3rd
8
Describe volume and surface area of cylinders
Solve practical problems involving the volume and surface area of
rectangular prisms and cylinders
Describe how changing one measured attribute of a rectangular
prism affects its volume and surface area
7.5a,b,c p, 10-14

5 Updated: 8-29-16
Nine
Weeks
Approximate # of
Days Taught
Topic Targeted SOL Curriculum Framework
3rd
4
Compare and contrast the following quadrilaterals based on
properties: parallelogram, rectangle, square, rhombus, and
trapezoid
7.7 p. 15
3rd
8-10
Given a polygon in the coordinate plane, will represent
transformations (reflections, dilations, rotations, and
translations) by graphing in the coordinate plane
7.8 p. 16
3rd
5
Investigate and describe the difference between the
experimental probability and theoretical probability of an
event
7.9 p. 18
3rd
7
Determine the probability of compound events, using the
Fundamental (Basic) Counting Principle
7.10 p. 19
3rd
4 3rd
9Weeks Review and Benchmark ALL
4th 10
Given data for a practical situation, construct and analyze
histograms
Compare and contrast histograms with other types of graphs
presenting information from the same data set.
7.11 ab p. 20-21
4th 10 Represent relationships with tables, graphs, rules, and words 7.12
Post Testing / Remediation / SOL Testing / STEAM ALL

6 Updated: 8-29-16
Curriculum Information
Essential Knowledge and Skills
Key Vocabulary
Essential Questions and Understandings
Teacher Notes and Elaborations
SOL Reporting Category
Number, Number Sense Computation
and Estimation
Focus
Integer Operations and Proportional
Reasoning
Virginia SOL 7.3
The student will
a. model addition, subtraction,
multiplication and division of
integers; and
b. add, subtract, multiply, and divide
integers.*
*SOL test items measuring Objective
7.3b will be completed without the use
of a calculator.
The student will use problem solving,
mathematical communication,
mathematical reasoning, connections
and representations to:
Model addition, subtraction,
multiplication and division of integers
using pictorial representations of
concrete manipulatives.
Formulate rules for addition,
subtraction, multiplication, and division
of integers.
Add, subtract, multiply and divide
integers.
Simplify numerical expressions
involving addition, subtraction,
multiplication and division of integers
using order of operations.
Solve practical problems involving
addition, subtraction, multiplication,
and division with integers.
Cognitive Level (Bloom’s Taxonomy, Revised)
Apply – Add, Subtract, Multiply, Divide,
Solve
Analyze – Model
Create – Formulate
Key Vocabulary absolute value integers opposites
Essential Questions and Understandings
The sums, differences, products and quotients of integers are either positive, zero, or
negative. How can this be demonstrated?
This can be demonstrated through the use of patterns and models.
Teacher Notes and Elaborations
The set of integers is the set of whole numbers and their opposites (…–3, –2, –1, 0, 1, 2,
3…). Integers are used in practical situations such as temperature changes (above/below
zero), balance a checking account (deposits/withdrawals), and changes in altitude
(above /below sea level).
Concrete experiences in formulating rules for adding and subtracting integers should be
explored by examining patterns using calculators, along a number line, and using
manipulatives, such as two-color counters, or by using algebra tiles. Concrete experiences
in formulating rules for multiplying and dividing integers should be explored by examining
patterns using calculators, along a number line, and using manipulatives, such as two-color
counters, or by using algebra tiles.
For example the following model represents the number sentence 3 6 18 .
–18 –15 –12 –9 –6 –3 0
The absolute value of an integer is the distance on a number line that a number is from zero.
It is always written as a positive number. Students should recognize and be able to read the
symbol for absolute value (e.g., 7 7 is read as “The absolute value of negative seven
equals seven.”).
Open ended questions should be used to promote deeper understanding of integers.
Example:
Name a number that can be placed in the blank to make the value of the expression a
negative number.
( 14) _______ (answer: Any number greater than 14 )
(continued)

7 Updated: 8-29-16
Curriculum Information
Essential Questions and Understandings
Teacher Notes and Elaborations
SOL Reporting Category
Number, Number Sense Computation
and Estimation
Focus
Integer Operations and Proportional
Reasoning
Virginia SOL 7.3
The student will
a. model addition, subtraction,
multiplication and division of
integers; and
b. add, subtract, multiply, and divide
integers.*
*SOL test items measuring Objective
7.3b will be completed without the use
of a calculator.
Teacher Notes and Elaborations (continued)
The order of operations is a convention that defines the computation order to follow in simplifying an expression. In grades 5 and 6,
students simplify expressions by using the order of operations in a demonstrated step-by-step approach.
The order of operations is as follows:
- First, complete all operations within grouping symbols**. If there are grouping symbols within other grouping symbols, do the
innermost operation first.
- Second, evaluate all exponential expressions.
- Third, multiply and/or divide in order from left to right.
- Fourth, add and/or subtract in order from left to right.
**Parentheses ( ), brackets [ ], braces {}, absolute value , and the division bar – as in 3 4
5 6
should be treated as grouping symbols.
The overuse of the acronym PEMDAS tends to reinforce inaccurate use of the order of operations. Students frequently multiply before
dividing and add before subtracting because they do not understand the correct order of operations.
Example:
4 2(3 5)
4 2(8)
2(8)
16
8 Updated: 8-29-16
Curriculum Information
Resources Sample Instructional Strategies and Activities
SOL Reporting Category
Number, Number Sense Computation
and Estimation
Focus
Integer Operations and Proportional
Reasoning
Virginia SOL 7.3
Foundational Objectives
6.3
The student will
a. identify and represent integers;
b. order and compare integers; and
c. identify and describe absolute value
of integers.
6.8
The student will evaluate whole number
numerical expressions, using the order
of operations.
Text:
Mathematics Course 2 VA Grade 7,
©2012, Prentice Hall, Pearson
Education
VDOE Enhanced Scope and Sequence
Sample Lesson Plans
http://www.doe.virginia.gov/testing/sol/sco
pe_sequence/mathematics_2009/index.php
Mathematics SOL Resources
www.doe.virginia.gov/instruction/mathema
tics/index.shtml
Use real-life examples such as weather maps to demonstrate positive and negative
temperatures, stock market to illustrate gains and losses, banking examples involving
credits and debits, and problems involving sea level to understand ways in which
positives and negatives are used.
Students think about how they would figure their bank balance, if they wrote a check for
an amount larger than their balance (i.e. $100 – $125 = $25 ). Discuss how subtracting
an integer produces the same answer as adding the opposite.
Have the students work in groups of four to investigate integers. Give each group a
number line showing 20 to +20 and a deck of cards with the face cards removed. Each
student starts at zero. As a student is dealt a card face up, the student moves that number
of places: red is negative, black is positive. The first student to reach negative 20 or
positive 20 wins.
9 Updated: 8-29-16
Curriculum Information
Essential Knowledge and Skills
Key Vocabulary
Essential Questions and Understandings
Teacher Notes and Elaborations
SOL Reporting Category
Number, Number Sense, Computation
and Estimation
Focus
Proportional Reasoning
Virginia SOL 7.1
The student will
a. investigate and describe the concept
of negative exponents for powers of
ten;
b. determine scientific notation for
numbers greater than zero;*
c. compare and order fractions,
decimals, percents and numbers
written in scientific notation;*
d. determine square roots;* and
e. identify and describe absolute value
for rational numbers.
*SOL test items measuring Objective
7.1b-d will be completed without the
use of a calculator.
The student will use problem solving,
mathematical communication,
mathematical reasoning, connections
and representations to:
Recognize powers of 10 with negative
exponents by examining patterns.
Write a power of 10 with a negative
exponent in fraction and decimal form.
Recognize a number greater than zero
in scientific notation.
Write a number greater than zero in
scientific notation.
Compare and determine equivalent
relationships between numbers larger
than zero, written in scientific notation.
Order no more than three numbers
greater than zero written in scientific
notation.
Represent a number in fraction,
decimal, and percent forms.
Compare, order, and determine
equivalent relationships among
fractions, decimals, and percents.
Decimals are limited to the thousandths
place, and percents are limited to the
tenths place. Ordering is limited to no
more than four numbers.
Compare and order fractions,
decimals, percents, and numbers written
in scientific notation.
Determine the square root of a perfect
square less than or equal to 400 without
the use of a calculator.
Demonstrate absolute value using a
number line.
Determine the absolute value of a
rational number.
(continued)
Essential Questions and Understandings
When should scientific notation be used?
Scientific notation should be used whenever the situation calls for use of very large
or very small numbers.
How are fractions, decimals and percents related?
Any rational number can be represented in fraction, decimal and percent form.
What does a negative exponent mean when the base is 10?
A base of 10 raised to a negative exponent represents a number between 0 and 1.
How is taking a square root different from squaring a number?
Squaring a number and taking a square root are inverse operations.
Why is the absolute value of a number positive?
The absolute value of a number represents distance from zero on a number line
regardless of direction. Distance is positive.
Teacher Notes and Elaborations
Scientific notation is used to represent very large and very small numbers. A number is in
scientific notation when it is written in the form: a ∙ 10n where 1 a 10 and n is an
integer. A number written in scientific notation is the product of two factors, a decimal
greater than or equal to one but less than 10, and a power of 10 (e.g., 3.1 ∙ 10 5 = 310,000
and 2.85 ∙ 10-4
= 0.000285).
Percent means “per hundred”. A number followed by a percent symbol (%) is equivalent to
that number with a denominator of 100 (e.g., 3 60
5 100 ,
600.60
100 , 0.60 = 60%).
Equivalent relationships among fractions, decimals, and percents can be determined by
using manipulatives (e.g., fraction bars, Base-10 blocks, fraction circles, graph paper,
number lines and calculators).
Multiple experiences should be provided when numbers are represented in different formats
for comparing and/or ordering.
An exponent tells how many times the base is used as a factor. In the expression 32, 3 is the
base and 2 is the exponent. Negative exponents for powers of 10 are used to represent
numbers between 0 and 1 (e.g., 3 1 1 1
1010 10 10
and 3
3
110
10
and 3
10.001
10 ).
(continued)
10 Updated: 8-29-16
Curriculum Information
Essential Knowledge and Skills
Key Vocabulary
Essential Questions and Understandings
Teacher Notes and Elaborations
SOL Reporting Category
Number, Number Sense, Computation
and Estimation
Focus
Proportional Reasoning
Virginia SOL 7.1
The student will
a. investigate and describe the concept
of negative exponents for powers of
ten;
b. determine scientific notation for
numbers greater than zero;*
c. compare and order fractions,
decimals, percents and numbers
written in scientific notation;*
d. determine square roots;* and
e. identify and describe absolute value
for rational numbers.
*SOL test items measuring Objective
7.1b-d will be completed without the
use of a calculator.
(continued)
Show that the distance between two
rational numbers on the number line is
the absolute value of their difference,
and apply this principle to solve
practical problems.
Cognitive Level (Bloom’s Taxonomy, Revised)
Remember – Write
Understand – Recognize
Apply – Demonstrate, Order
Analyze – Compare
Evaluate - Determine
Key Vocabulary
absolute value
exponent
percent
perfect square
rational number
scientific notation
square root
Teacher Notes and Elaborations (continued)
Negative exponents for powers of 10 can be investigated through patterns such as:
2
1
0
10 100
10 10
10 1
1
1
1 110 0.1
1010
2
2
1 110 0.01
10010
A square root of a number is a number which, when multiplied by itself, produces the given
number (e.g., 121 is 11 since 11 ∙ 11 = 121). A whole number that can be named as a
product of a number with itself is a perfect square (e.g., 81 = 9 ∙ 9, where 81 is a perfect
square; 0 = 0 ∙ 0, where 0 is a perfect square.).
The square root of a number can be represented geometrically as the length of a side of the
square.
Any real number raised to the zero power is 1. The only exception to this rule is zero itself
(00 1 ). Zero raised to the zero power is undefined.
A rational number is any number that can be expressed in the form a
b, where b ≠ 0.
When converting a negative mixed number into an improper fraction the distributive
property applies.
b b
a ac c
therefore b b
a ac c
Example:
2 2 30
4 means 4 or 7 7 7
(continued)
11 Updated: 8-29-16
Curriculum Information
Essential Questions and Understandings
Teacher Notes and Elaborations
SOL Reporting Category
Number, Number Sense, Computation
and Estimation
Focus
Proportional Reasoning
Virginia SOL 7.1
The student will
a. investigate and describe the concept
of negative exponents for powers of
ten;
b. determine scientific notation for
numbers greater than zero;*
c. compare and order fractions,
decimals, percents and numbers
written in scientific notation;*
d. determine square roots;* and
e. identify and describe absolute value
for rational numbers.
*SOL test items measuring Objective
7.1b-d will be completed without the
use of a calculator.
Teacher Notes and Elaborations (continued)
The absolute value of a number is the distance from 0 on the number line regardless of direction
(e.g., 1 1
2 2 ,
1 1
2 2
,
1 1
2 2
, and
1 1
2 2 ).
The distance between two rational numbers on the number line is the absolute value of their difference.
Example 1: The distance between 5 and 2 is 5 2 3 or 2 5 3 .
Example 2: The distance between 3.5 and ( 7.4 ) is 3.5 7.4 10.9 or 7.4 3.5 10.9 .
Example 3: The distance between ( 4 ) and ( 1 ) is 4 1 3 or 1 4 3 .
Example 4: The distance between 2
13
and 1
45
is 2 1 8
1 4 23 5 15 or
1 2 84 1 2
5 3 15 .

12 Updated: 8-29-16
Curriculum Information
Resources Sample Instructional Strategies and Activities
SOL Reporting Category
Number, Number Sense, Computation
and Estimation
Focus
Proportional Reasoning
Virginia SOL 7.1
Foundational Objectives
6.2b, c, d The student will
b. identify a given fraction, decimal or
percent from a representation;
c. demonstrate equivalent relationships
among fractions, decimals, and
percents; and
d. compare and order fractions,
decimals, and percents.
6.3 The student will
a. identify and represent integers;
b. order and compare integers; and
c. identify and describe absolute value
of integers.
6.5 The student will investigate and
describe concepts of positive exponents
and perfect squares.
5.2 The student will
a. recognize and name fractions in
decimal form and vice versa; and
b. compare and order fractions and
decimals in a given set from least to
greatest and greatest to least.
5.3 The student will identify and
describe the characteristics of prime
and composite numbers; and even and
odd numbers.
4.1b The student will compare two
whole numbers through millions, using
symbols (>, <, or =).
(continued)
Text:
Mathematics Course 2 VA Grade 7,
©2012, Prentice Hall, Pearson
Education
VDOE Enhanced Scope and Sequence
Sample Lesson Plans
http://www.doe.virginia.gov/testing/sol/sco
pe_sequence/mathematics_2009/index.php
Mathematics SOL Resources
www.doe.virginia.gov/instruction/mathema
tics/index.shtml
Foundational Objectives (continued)
4.2 The student will
a. compare and order fractions and mixed
numbers;
b. represent equivalent fractions; and
c. identify the division statement that
represents a fraction.
4.3c, d The student will
c. compare and order decimals; and
d. given a model, write the decimal and
fraction equivalents.
4.5a The student will determine common
multiples and factors, including least
common multiple and greatest common
factor.
Students, working in pairs, take turns giving each other a percent, a decimal, and a
fraction to order from the least to the greatest.
The students will work in pairs using grid paper and colored pencils, to practice
converting fractions to decimals and percents. Each pair will design a color pattern on
the grid paper. Have pairs exchange patterns. Then have the group members determine
the fraction of the total grid covered by each color. They should then express the part as
a decimal and a percent.
Use manipulatives such as tiles, base ten blocks, counters, grid paper, geoboards, and
calculators to demonstrate relationships among fractions, decimals, and percents and
identify fractional parts of sets.
Use play money to have students show relationships of fractional and decimal value of
pennies, nickels, dimes, quarters 70 7
100 10 = ___dimes = $___.
On a number line mark 0, 1
2, and 1. Give each student a copy of the number line and a
chip. Name a fraction, decimal, or percent and have students place their chip on the
number line approximately where the fraction would be located. Check answers and
discuss differences. Repeat as many times as needed with different fractions.
Explore percents as numerical displays in graphs, newspapers, and periodicals to
understand real-life applications.
13 Updated: 8-29-16
Curriculum Information
Essential Knowledge and Skills
Key Vocabulary
Essential Questions and Understandings
Teacher Notes and Elaborations
SOL Reporting Category
Probability, Statistics, Patterns,
Functions, and Algebra
Focus
Linear Equations
Virginia SOL 7.13
The student will
a. write verbal expressions as
algebraic expressions and sentences
as equations and vice versa; and
b. evaluate algebraic expressions for
given replacement values of the
variables.
The student will use problem solving,
mathematical communication,
mathematical reasoning, connections
and representations to:
Write verbal expressions as algebraic
expressions. Expressions will be limited
to no more than two operations.
Write verbal sentences as algebraic
equations. Equations will contain no
more than one variable term.
Translate algebraic expressions and
equations to verbal expressions and
sentences. Expressions will be limited
to no more than two operations.
Identify examples of expressions and
equations.
Apply the order of operations to
evaluate expressions for given
replacement values (integers, fractions,
and decimals) of the variables. Limit
the number of replacements to no more
than three per expression.
Cognitive Level (Bloom’s Taxonomy, Revised)
Remember – Write
Understand – Identify, Translate
Apply - Apply
Key Vocabulary
algebraic equation coefficient
algebraic expression
constant
expression
grouping symbols
order of operations
substitution
term
variable
variable expression
verbal expression
verbal sentence
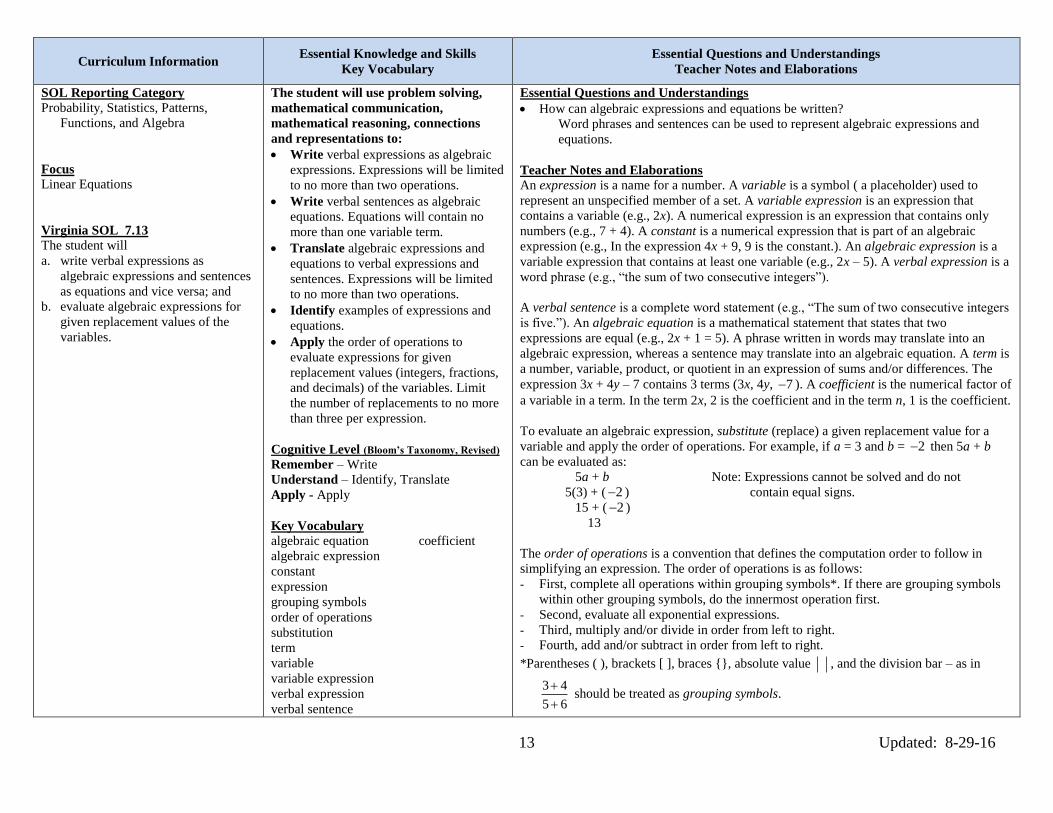
Essential Questions and Understandings
How can algebraic expressions and equations be written?
Word phrases and sentences can be used to represent algebraic expressions and
equations.
Teacher Notes and Elaborations
An expression is a name for a number. A variable is a symbol ( a placeholder) used to
represent an unspecified member of a set. A variable expression is an expression that
contains a variable (e.g., 2x). A numerical expression is an expression that contains only
numbers (e.g., 7 + 4). A constant is a numerical expression that is part of an algebraic
expression (e.g., In the expression 4x + 9, 9 is the constant.). An algebraic expression is a
variable expression that contains at least one variable (e.g., 2x – 5). A verbal expression is a
word phrase (e.g., “the sum of two consecutive integers”).
A verbal sentence is a complete word statement (e.g., “The sum of two consecutive integers
is five.”). An algebraic equation is a mathematical statement that states that two
expressions are equal (e.g., 2x + 1 = 5). A phrase written in words may translate into an
algebraic expression, whereas a sentence may translate into an algebraic equation. A term is
a number, variable, product, or quotient in an expression of sums and/or differences. The
expression 3x + 4y – 7 contains 3 terms (3x, 4y, 7 ). A coefficient is the numerical factor of
a variable in a term. In the term 2x, 2 is the coefficient and in the term n, 1 is the coefficient.
To evaluate an algebraic expression, substitute (replace) a given replacement value for a
variable and apply the order of operations. For example, if a = 3 and b = 2 then 5a + b
can be evaluated as:
5a + b Note: Expressions cannot be solved and do not
5(3) + ( 2 ) contain equal signs.
15 + ( 2 )
13
The order of operations is a convention that defines the computation order to follow in
simplifying an expression. The order of operations is as follows:
- First, complete all operations within grouping symbols*. If there are grouping symbols
within other grouping symbols, do the innermost operation first.
- Second, evaluate all exponential expressions.
- Third, multiply and/or divide in order from left to right.
- Fourth, add and/or subtract in order from left to right.
*Parentheses ( ), brackets [ ], braces {}, absolute value , and the division bar – as in
3 4
5 6
should be treated as grouping symbols.

14 Updated: 8-29-16
Curriculum Information
Resources
Sample Instructional Strategies and Activities
SOL Reporting Category
Probability, Statistics, Patterns,
Functions, and Algebra
Focus
Linear Equations
Virginia SOL 7.13
Foundational Objectives
6.8
The student will evaluate whole number
numerical expressions, using the order
of operations.
5.7
The student will evaluate whole number
numerical expressions using the order
of operations limited to parentheses,
addition, subtraction, multiplication,
and division.
5.18a, b
The student will
a. investigate and describe the concept
of variable; and
b. write an open sentence to represent
a given mathematical relationship
using a variable.
4.16a
The student will recognize and
demonstrate the meaning of equality in
an equation.
Text:
Mathematics Course 2 VA Grade 7,
©2012, Prentice Hall, Pearson
Education
VDOE Enhanced Scope and Sequence
Sample Lesson Plans
http://www.doe.virginia.gov/testing/sol/sco
pe_sequence/mathematics_2009/index.php
Mathematics SOL Resources
www.doe.virginia.gov/instruction/mathema
tics/index.shtml
Use algebra tiles to model algebraic expressions.
Use counters and cups to represent algebraic expressions. Each counter may represent
one unit and each cup represents the unknown value. Students should model expressions
such as:
"the sum of four and a number" with four counters and a cup.
"twice a number" with two cups.
Students, working in pairs, construct a cross-number puzzle whose answers are the
solutions to equations. Clues will be given as word expressions. Student pairs will
exchange their puzzles with other pairs and, then try to solve the puzzles.
The students, working in pairs using index cards and pencils, convert word phrases into
algebraic expressions. Each student will write a phrase for his or her age on the index
card, for example, "I am 14 years younger than three times my sister's age." Next, the
students will exchange cards and write each phrase as an expression in algebraic form.

15 Updated: 8-29-16
Curriculum Information
Essential Knowledge and Skills
Key Vocabulary
Essential Questions and Understandings
Teacher Notes and Elaborations
SOL Reporting Category
Probability, Statistics, Patterns,
Functions, and Algebra
Focus
Linear Equations
Virginia SOL 7.16
The student will apply the following
properties of operations with real
numbers:
a. the commutative and associative
properties for addition and
multiplication;
b. the distributive property;
c. the additive and multiplicative
identity properties;
d. the additive and multiplicative
inverse properties; and
e. the multiplicative property of zero.
The student will use problem solving,
mathematical communication,
mathematical reasoning, connections
and representations to:
Identify properties of operations used
in simplifying expressions.
Apply the properties of operations to
simplify expressions.
Cognitive Level (Bloom’s Taxonomy, Revised)
Remember – Identify
Apply – Apply
Key Vocabulary
additive identity property (identity property
of addition
additive inverse property (inverse property
of addition)
associative property of addition
associative property of multiplication
commutative property of addition
commutative property of multiplication
distributive property
identity elements
inverses
multiplicative identity property (identity
property of multiplication)
multiplicative inverse property (inverse
property of multiplication)
multiplicative property of zero
reciprocal
Essential Questions and Understandings
Why is it important to apply properties of operations when simplifying expressions?
Using the properties of operations with real numbers helps with understanding
mathematical relationships.
Teacher Notes and Elaborations
The commutative property of addition states that changing the order of the addends does not
change the sum (e.g., 5 + 4 = 4 + 5, (2 3) 6 6 (2 3) ). The commutative property of
multiplication states that changing the order of the factors does not change the product
(e.g., 5 ∙ 4 = 4 ∙ 5, (2 3)6 6(2 3) ).
The associative property of addition states that regrouping the addends does not change the
sum [e.g., 5 + (4 + 3) = (5 + 4) + 3]. The associative property of multiplication states that
regrouping the factors does not change the product [e.g., 5(4 ∙ 3) = (5 ∙ 4)3].
Subtraction and division are neither commutative nor associative.
The distributive property states that the product of a number and the sum (or difference) of
two other numbers equals the sum (or difference) of the products of the number and each
other number [e.g., 5(3 + 7) = (5 ∙ 3) + (5 ∙ 7), or 5(3 – 7) = (5 ∙ 3) – (5 ∙ 7)].
Identity elements are numbers that combine with other numbers without changing the other
numbers. The additive identity is zero (0). The multiplicative identity is one (1). The
additive identity property states that the sum of any real number and zero is equal to the
given real number (e.g., 5 + 0 = 5). The multiplicative identity property states that the
product of any real number and one is equal to the given real number (e.g., 8 ∙ 1 = 8).
There are no identity elements for subtraction and division.
Inverses are numbers that combine with other numbers and result in identity elements
[e.g., 5 ( 5) 0 ; 1
5 15 ]. The additive inverse property states that the sum of a number
and its additive inverse always equals zero (e.g., 5 ( 5) 0 ). The multiplicative inverse
property states that the product of a number and its multiplicative inverse ( or reciprocal)
always equals one (e.g., 1
4 14 ). Zero has no multiplicative inverse.
(continued)

16 Updated: 8-29-16
Curriculum Information
Essential Questions and Understandings
Teacher Notes and Elaborations
SOL Reporting Category
Probability, Statistics, Patterns,
Functions, and Algebra
Focus
Linear Equations
Virginia SOL 7.16
The student will apply the following
properties of operations with real
numbers:
a. the commutative and associative
properties for addition and
multiplication;
b. the distributive property;
c. the additive and multiplicative
identity properties;
d. the additive and multiplicative
inverse properties; and
e. the multiplicative property of zero.
Teacher Notes and Elaborations (continued)
The multiplicative property of zero states that the product of any real number and zero is zero. Division by zero is not a possible arithmetic
operation. Division by zero is undefined.
Examples such as the following should be using in instruction to identify and apply properties of operations.
Example 1:
Step 1: 25 (7)( 4 )
Step 2: 7( 25 )( 4 ) Between step 1 and step 2 the Commutative property of multiplication was applied.
Step 3: 7[( 25 )( 4 )] Between step 2 and step 3 the Associative property of multiplication was applied.
Step 4: 7(100)
Step 5: 700
Example 2:
Step 1: 2 2
73 3
Step 2: 0 + 7 Between step 1 and step 2 the Additive inverse property was applied.
Step 3: 7 Between step 2 and step 3 the Additive identity property was applied.
Example 3:
3(4 6) 12 18 The Distributive property is shown in this equation.
17 Updated: 8-29-16
Curriculum Information
Resources
Sample Instructional Strategies and Activities
SOL Reporting Category
Probability, Statistics, Patterns,
Functions, and Algebra
Focus
Linear Equations
Virginia SOL 7.16
Foundational Objectives
6.19
The student will investigate and
recognize
a. the identity properties for addition
and multiplication;
b. the multiplicative property of zero;
and
c. the inverse property for
multiplication.
5.19
The student will investigate and
recognize the distributive property of
multiplication over addition.
4.16b
The student will investigate and
describe the associative property for
addition and multiplication.
3.20
The student will
a. investigate the identity and the
commutative properties for addition
and multiplication; and
b. identify examples of the identity
and commutative properties for
addition and multiplication.
Text:
Mathematics Course 2 VA Grade 7,
©2012, Prentice Hall, Pearson
Education
VDOE Enhanced Scope and Sequence
Sample Lesson Plans
http://www.doe.virginia.gov/testing/sol/sco
pe_sequence/mathematics_2009/index.php
Mathematics SOL Resources
www.doe.virginia.gov/instruction/mathema
tics/index.shtml
Students work in pairs. They will select an index card containing an expression and its
simplified form, missing the operations, and grouping symbols. In order to arrive at the
given value, the students will arrange the operations in correct order. For example:
Expression: 5 3 2 When simplified is equal to 25
Answer: 5(3 + 2)
Justification: Distributive property

18 Updated: 8-29-16
Curriculum Information
Essential Knowledge and Skills
Key Vocabulary
Essential Questions and Understandings
Teacher Notes and Elaborations
SOL Reporting Category
Number, Number Sense, Computation
and Estimation
Focus
Proportional Reasoning
Virginia SOL 7.2
The student will describe and represent,
arithmetic and geometric sequences
using variable expressions.
The student will use problem solving,
mathematical communication,
mathematical reasoning, connections
and representations to:
Analyze arithmetic and geometric
sequences to discover a variety of
patterns.
Identify the common difference in an
arithmetic sequence.
Identify the common ratio in a
geometric sequence.
Given an arithmetic or geometric
sequence, write a variable expression to
describe the relationship between two
consecutive terms in the sequence.
Cognitive Level (Bloom’s Taxonomy, Revised)
Remember – Identify, Write
Analyze – Analyze
Key Vocabulary
arithmetic sequence
common difference
common ratio
consecutive terms
geometric sequence
variable expression
Essential Questions and Understandings
What are arithmetic sequences?
In an arithmetic sequence, the numbers are found by using a common difference.
What are geometric sequences?
In a geometric sequence, the numbers are found by using a common ratio.
When are variable expressions used?
Variable expressions can express the relationship between two consecutive terms in
a sequence. Teacher Notes and Elaborations
In the numeric pattern of an arithmetic sequence, students must determine the difference,
called the “common difference”, between each succeeding number in order to determine
what is added to each previous number to obtain the next number.
Sample arithmetic sequences include:
4, 7, 10, 13, … (The common difference is 3)
10, 3, 4 , 11 , … (The common difference is 7 )
6 , 1 , 4, 9, … (The common difference is 5)
In geometric sequences, students must determine what each number is multiplied by in
order to obtain the next number in the geometric sequence. This multiplier is called the
“common ratio”.
Sample geometric sequences include:
2, 4, 8, 16, 32,… (The common ratio is 2)
1, 5, 25, 125, 625,… (The common ratio is 5)
80, 20, 5, 1.25,…. (The common ratio is 1
4)
By using manipulatives to build patterns that model sequences, numeric expressions for
each step number can be written using the same pattern. A variable expression can then be
written to express the relationship between two consecutive terms of a sequence.
- If n represents a number in the sequence 3, 6, 9, 12, …, the next term in the sequence
can be determined using the variable expression n + 3.
- If n represents a number in the sequence 1, 5, 25, 125, …, the next term in the
sequence can be determined by using the variable expression 5n.
Consecutive terms immediately follow each other in some order. For example 5 and 6 are
consecutive whole numbers, 2 and 4 are consecutive even numbers.
19 Updated: 8-29-16
Curriculum Information
Resources
Sample Instructional Strategies and Activities
SOL Reporting Category
Number, Number Sense, Computation
and Estimation
Focus
Proportional Reasoning
Virginia SOL 7.2
Foundational Objectives
6.17
The student will identify and extend
geometric and arithmetic sequences.
5.17
The student will describe the
relationship found in a number pattern
and express the relationship.
4.15
The student will recognize, create, and
extend numerical and geometric
patterns.
Text:
Mathematics Course 2 VA Grade 7,
©2012, Prentice Hall, Pearson
Education
VDOE Enhanced Scope and Sequence
Sample Lesson Plans
http://www.doe.virginia.gov/testing/sol/sco
pe_sequence/mathematics_2009/index.php
Mathematics SOL Resources
www.doe.virginia.gov/instruction/mathema
tics/index.shtml

20 Updated: 8-29-16
Curriculum Information
Essential Knowledge and Skills
Key Vocabulary
Essential Questions and Understandings
Teacher Notes and Elaborations
SOL Reporting Category
Probability, Statistics, Patterns,
Functions, and Algebra
Focus
Linear Equations
Virginia SOL 7.14
The student will
a. solve one- and two-step linear
equations in one variable; and
b. solve practical problems requiring
the solution of one- and two-step
linear equations.
The student will use problem solving,
mathematical communication,
mathematical reasoning, connections
and representations to:
Represent and demonstrate steps for
solving one- and two-step equations in
one variable using concrete materials,
pictorial representations, and algebraic
sentences.
Translate word problems/practical
problems into algebraic equations and
solve them.
Solve one- and two-step linear
equations in one variable.
Solve practical problems that require
the solution of a one- or two-step linear
equation.
Cognitive Level (Bloom’s Taxonomy, Revised)
Remember – Describe
Understand – Identify, Order
Apply – Solve, Demonstrate, Represent
Key Vocabulary
inverse operations
Essential Questions and Understandings
When solving an equation, why is it important to perform identical operations on each
side of the equal sign?
An operation that is performed on one side of an equation must be performed on the
other side to maintain equality.
Teacher Notes and Elaborations
An equation is a mathematical sentence that states that two expressions are equal.
Inverse operations are pairs of operations that undo each other. The inverse operation for
addition is subtraction and the inverse operation for multiplication is division.
A one-step equation is defined as an equation that requires the use of one operation to solve
(e.g., 3 4x ).
A two-step equation is defined as an equation that requires the use of two operations to
solve (e.g., 2x + 1 = -5; -7 = 3x – 2; 7
43
x ; 2( 2) 14x ;
42
x ).
The following demonstrates steps for solving a two-step equation algebraically.
2( 2) 14x
2( 2) 14
2 2
x multiplicative inverse
2 7x
2 ( 2) 7 ( 2)x additive inverse
x + 0 = 5
x = 5
Practical problems can be translated into equations in order to solve the problems.

21 Updated: 8-29-16
Curriculum Information
Resources
Sample Instructional Strategies and Activities
SOL Reporting Category
Probability, Statistics, Patterns,
Functions, and Algebra
Focus
Linear Equations
Virginia SOL 7.14
Foundational Objectives
6.18
The student will solve one-step linear
equations in one variable involving
whole number coefficients and positive
rational solutions.
5.18
The student will
a. investigate and describe the concept
of variable;
b. write an open sentence to represent
a given mathematical relationship
using a variable;
c. model one-step linear equations in
one variable using addition and
subtraction; and
d. create a problem situation based on
a given open sentence, using a
single variable.
4.16a
The student will recognize and
demonstrate the meaning of equality in
an equation.
Text:
Mathematics Course 2 VA Grade 7,
©2012, Prentice Hall, Pearson
Education
VDOE Enhanced Scope and Sequence
Sample Lesson Plans
http://www.doe.virginia.gov/testing/sol/sco
pe_sequence/mathematics_2009/index.php
Mathematics SOL Resources
www.doe.virginia.gov/instruction/mathema
tics/index.shtml
Use balance scales to model equations.
Use 2-color counters and cups to model equations.
Students will write one- or two-step equations on index cards. They will switch cards
with a partner and try to solve their equations.
Students use Algeblocks or algebra tiles to solve one- and two-step equation.

22 Updated: 8-29-16
Curriculum Information
Essential Knowledge and Skills
Key Vocabulary
Essential Questions and Understandings
Teacher Notes and Elaborations
SOL Reporting Category
Probability, Statistics, Patterns,
Functions, and Algebra
Focus
Linear Equations
Virginia SOL 7.15
The student will
a. solve one-step inequalities in one
variable and
b. graph solutions to inequalities on
the number line.
The student will use problem solving,
mathematical communication,
mathematical reasoning, connections
and representations to:
Represent and demonstrate steps in
solving inequalities in one variable,
using concrete materials, pictorial
representations, and algebraic
sentences.
Graph solutions to inequalities on the
number line.
Identify a numerical value that satisfies
the inequality.
Cognitive Level (Bloom’s Taxonomy, Revised)
Remember – Describe
Apply – Represent, Demonstrate
Key Vocabulary
inequality
inverse operations
Essential Questions and Understandings
How are the procedures for solving equations and inequalities the same?
The procedures are the same except for the case when an inequality is multiplied or
divided on both sides by a negative number. Then the inequality sign is changed
from less than to greater than, or greater than to less than.
How is the solution to an inequality different from that of a linear equation?
In an inequality, there can be more than one value for the variable that makes the
inequality true.
Teacher Notes and Elaborations
An inequality is a mathematical sentence that states that one quantity is less than (or greater
than) another quantity. An inequality is a mathematical sentence that compares two
expressions using one of the symbols <, >, , , or .
A one-step inequality is defined as an inequality that requires the use of one operation to
solve (e.g., 4 9x ).
Inverse operations are pairs of operations that undo each other. The inverse operation for
addition is subtraction and the inverse operation for multiplication is division.
When both expressions of an inequality are multiplied or divided by a negative number, the
inequality symbol reverses (e.g., 3 15x is equivalent to 5x ). To illustrate why an
inequality is reversed when multiplying or dividing with a negative number, use the
inequality –x < 0, or “the opposite of a number is less than zero.” For this to be true, the
original number must be greater than zero. Because the graph of 3 is to the right of the
graph of 2, 3 > 2. Multiplying both numbers by 1 gives 3 and 2 . Because the graph of
3 is to the left of the graph of 2 , 3 < 2 , that is, the inequality is reversed.
Solutions to inequalities can be represented using a number line.
Inequalities using the < or > symbols are represented on a number line with an open circle
on the number and a shaded line over the solution set.
Ex: x < 5 or 5 > x. Graphing can be used to demonstrate that both inequalities represent
the same solution set.
1 2 3 4 5 6
(continued)
23 Updated: 8-29-16
Curriculum Information
Essential Questions and Understandings
Teacher Notes and Elaborations
SOL Reporting Category
Probability, Statistics, Patterns,
Functions, and Algebra
Focus
Linear Equations
Virginia SOL 7.15
The student will
a. solve one-step inequalities in one
variable and
b. graph solutions to inequalities on
the number line.
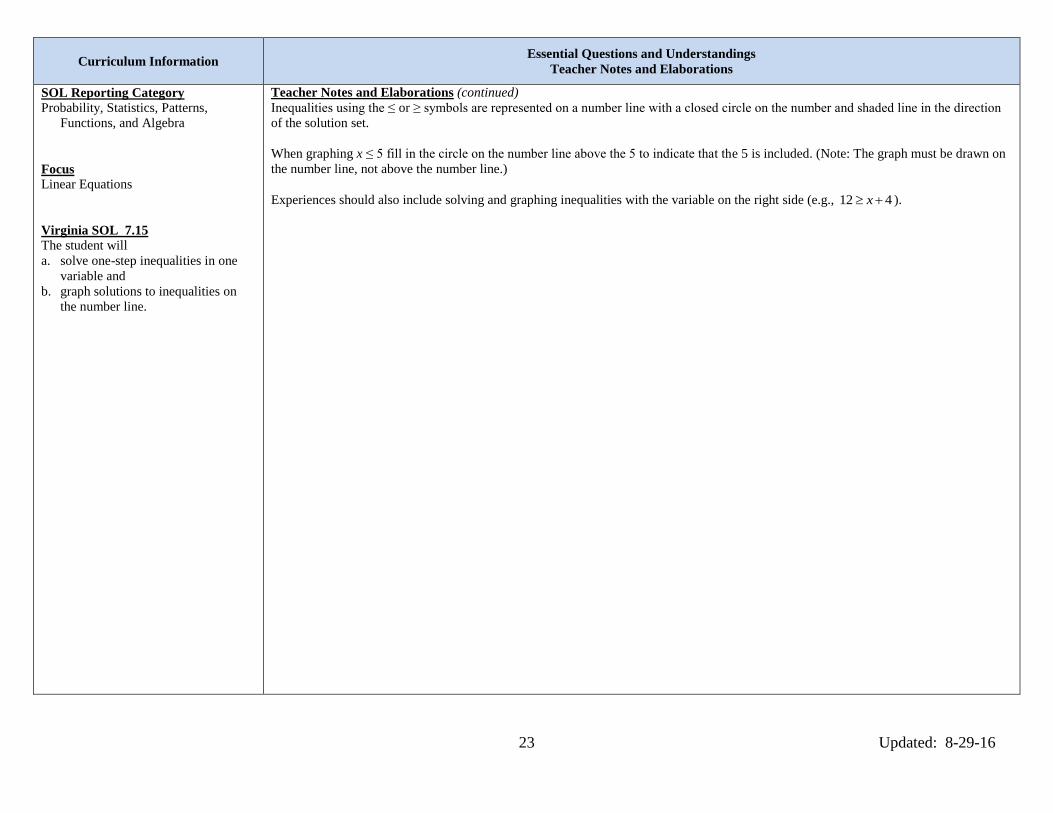
Teacher Notes and Elaborations (continued)
Inequalities using the ≤ or ≥ symbols are represented on a number line with a closed circle on the number and shaded line in the direction
of the solution set.
When graphing x ≤ 5 fill in the circle on the number line above the 5 to indicate that the 5 is included. (Note: The graph must be drawn on
the number line, not above the number line.)
Experiences should also include solving and graphing inequalities with the variable on the right side (e.g., 12 4x ).
24 Updated: 8-29-16
Curriculum Information
Resources
Sample Instructional Strategies and Activities
SOL Reporting Category
Probability, Statistics, Patterns,
Functions, and Algebra
Focus
Linear Equations
Virginia SOL 7.15
Foundational Objectives
6.20
The student will graph inequalities on a
number line.
Text:
Mathematics Course 2 VA Grade 7,
©2012, Prentice Hall, Pearson
Education
VDOE Enhanced Scope and Sequence
Sample Lesson Plans
http://www.doe.virginia.gov/testing/sol/sco
pe_sequence/mathematics_2009/index.php
Mathematics SOL Resources
www.doe.virginia.gov/instruction/mathema
tics/index.shtml
Use 2-color counters and cups to model inequalities.
Students will write one-step inequalities on index cards. They will switch cards with a
partner and try to solve the one-step inequalities.
Students use Algeblocks or algebra tiles to solve one-step inequalities.
25 Updated: 8-29-16
Curriculum Information
Essential Knowledge and Skills
Key Vocabulary
Essential Questions and Understandings
Teacher Notes and Elaborations
SOL Reporting Category Number, Number Sense, Computation
and Estimation
Focus
Integer Operations and Proportional
Reasoning
Virginia SOL 7.4
The student will solve single-step and
multi-step practical problems, using
proportional reasoning.
The student will use problem solving,
mathematical communication,
mathematical reasoning, connections
and representations to:
Write proportions that represent
equivalent relationships between two
sets.
Solve a proportion to find a missing
term.
Apply proportions to convert units of
measurement between the U.S.
Customary System and the metric
system. Calculators may be used.
Apply proportions to solve problems
that involve percents.
Apply proportions to solve practical
problems, including scale drawings.
Scale factors shall have denominators
no greater than 12 and decimals no less
than tenths. Calculators may be used.
Using 10% as a benchmark, mentally
compute 5%, 10%, 15%, or 20% in a
practical situation such as tips, tax and
discounts.
Solve problems involving tips, tax, and
discounts. Limit problems to only one
percent computation per problem.
Cognitive Level (Bloom’s Taxonomy, Revised)
Remember – Write
Apply – Apply, Compute, Solve
Key Vocabulary
discount (amount of discount) means
equivalent extremes
percent proportion rate (discount rate, tax rate, unit rate) tip
ratio sale price (discount price) scale factor
tax
Essential Questions and Understandings
What makes two quantities proportional?
Two quantities are proportional, when one quantity is a constant multiple of the
other.
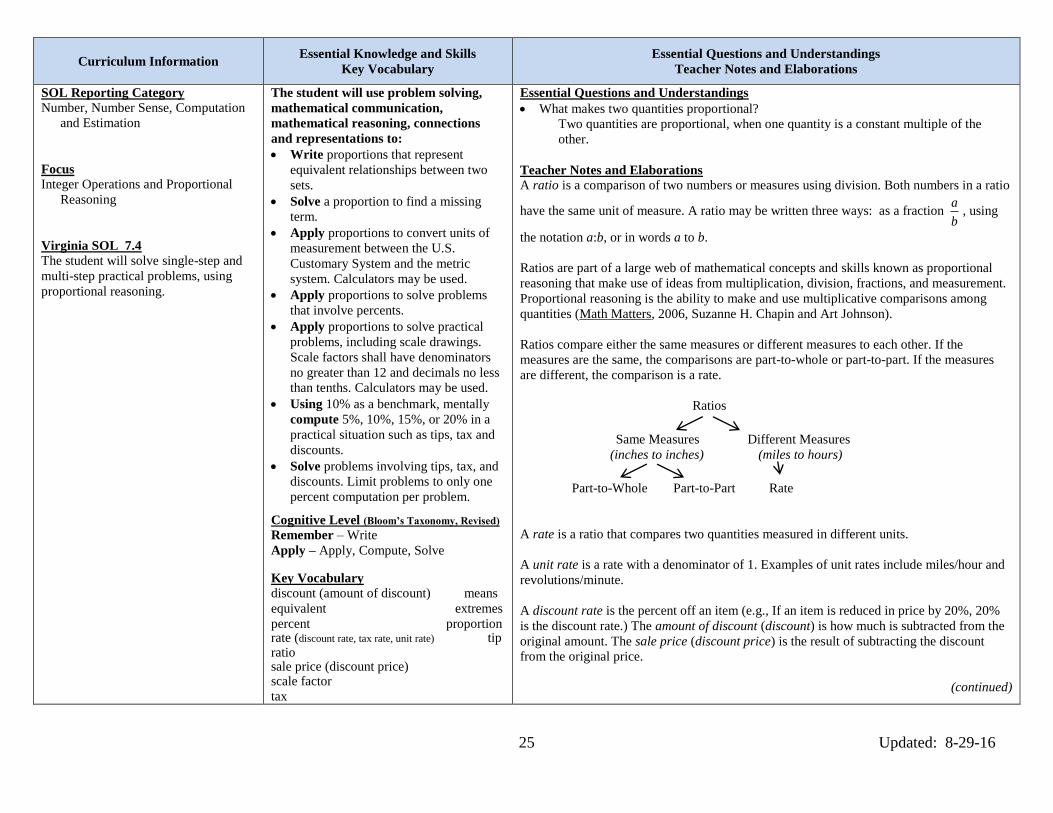
Teacher Notes and Elaborations
A ratio is a comparison of two numbers or measures using division. Both numbers in a ratio
have the same unit of measure. A ratio may be written three ways: as a fraction a
b, using
the notation a:b, or in words a to b.
Ratios are part of a large web of mathematical concepts and skills known as proportional
reasoning that make use of ideas from multiplication, division, fractions, and measurement.
Proportional reasoning is the ability to make and use multiplicative comparisons among
quantities (Math Matters, 2006, Suzanne H. Chapin and Art Johnson).
Ratios compare either the same measures or different measures to each other. If the
measures are the same, the comparisons are part-to-whole or part-to-part. If the measures
are different, the comparison is a rate.
Ratios
Same Measures Different Measures
(inches to inches) (miles to hours)
Part-to-Whole Part-to-Part Rate
A rate is a ratio that compares two quantities measured in different units.
A unit rate is a rate with a denominator of 1. Examples of unit rates include miles/hour and
revolutions/minute.
A discount rate is the percent off an item (e.g., If an item is reduced in price by 20%, 20%
is the discount rate.) The amount of discount (discount) is how much is subtracted from the
original amount. The sale price (discount price) is the result of subtracting the discount
from the original price.
(continued)
26 Updated: 8-29-16
Curriculum Information
Essential Questions and Understandings
Teacher Notes and Elaborations
SOL Reporting Category Number, Number Sense, Computation
and Estimation
Focus
Integer Operations and Proportional
Reasoning
Virginia SOL 7.4
The student will solve single-step and
multi-step practical problems, using
proportional reasoning.
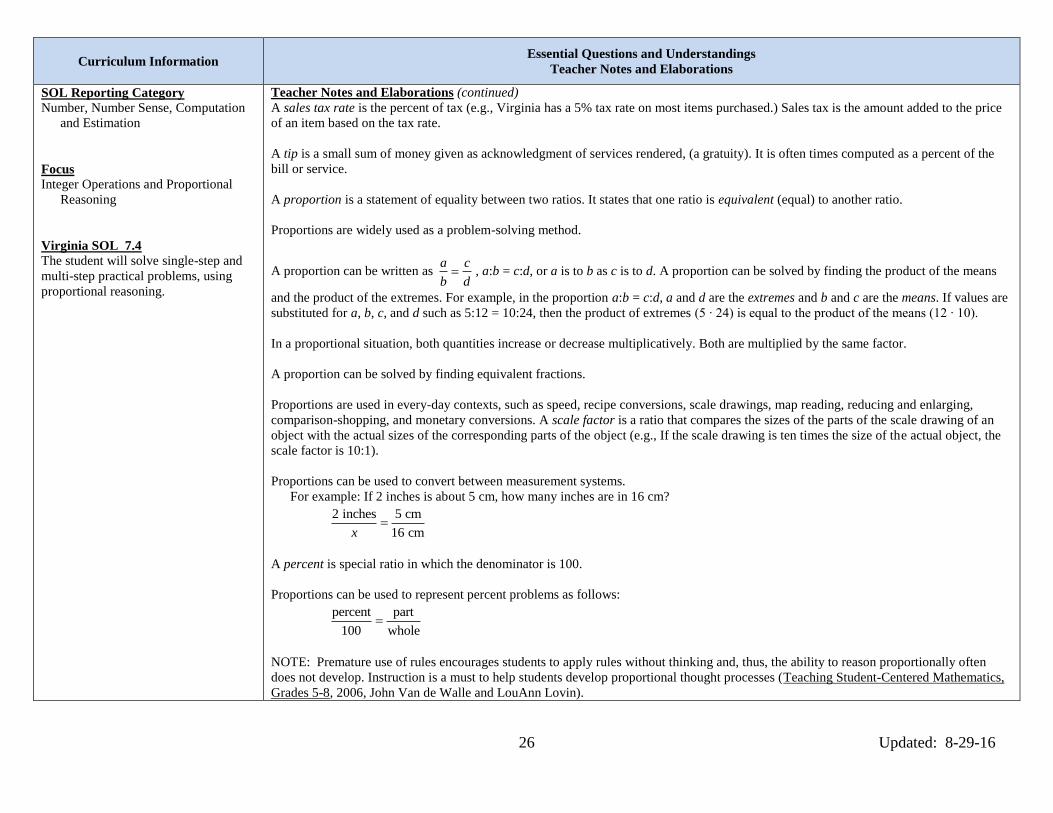
Teacher Notes and Elaborations (continued)
A sales tax rate is the percent of tax (e.g., Virginia has a 5% tax rate on most items purchased.) Sales tax is the amount added to the price
of an item based on the tax rate.
A tip is a small sum of money given as acknowledgment of services rendered, (a gratuity). It is often times computed as a percent of the
bill or service.
A proportion is a statement of equality between two ratios. It states that one ratio is equivalent (equal) to another ratio.
Proportions are widely used as a problem-solving method.
A proportion can be written as a c
b d , a:b = c:d, or a is to b as c is to d. A proportion can be solved by finding the product of the means
and the product of the extremes. For example, in the proportion a:b = c:d, a and d are the extremes and b and c are the means. If values are
substituted for a, b, c, and d such as 5:12 = 10:24, then the product of extremes (5 ∙ 24) is equal to the product of the means (12 ∙ 10).
In a proportional situation, both quantities increase or decrease multiplicatively. Both are multiplied by the same factor.
A proportion can be solved by finding equivalent fractions.
Proportions are used in every-day contexts, such as speed, recipe conversions, scale drawings, map reading, reducing and enlarging,
comparison-shopping, and monetary conversions. A scale factor is a ratio that compares the sizes of the parts of the scale drawing of an
object with the actual sizes of the corresponding parts of the object (e.g., If the scale drawing is ten times the size of the actual object, the
scale factor is 10:1).
Proportions can be used to convert between measurement systems.
For example: If 2 inches is about 5 cm, how many inches are in 16 cm?
2 inches 5 cm
16 cmx
A percent is special ratio in which the denominator is 100.
Proportions can be used to represent percent problems as follows:
percent part
100 whole
NOTE: Premature use of rules encourages students to apply rules without thinking and, thus, the ability to reason proportionally often
does not develop. Instruction is a must to help students develop proportional thought processes (Teaching Student-Centered Mathematics,
Grades 5-8, 2006, John Van de Walle and LouAnn Lovin).
27 Updated: 8-29-16
Curriculum Information
Resources
Sample Instructional Strategies and Activities
SOL Reporting Category Number, Number Sense, Computation
and Estimation
Focus
Integer Operations and Proportional
Reasoning
Virginia SOL 7.4
Foundational Objectives
6.1 The student will describe and
compare data, using ratios, and will use
appropriate notations such as a
b, a to b,
and a:b.
6.2a The student will investigate and
describe fractions, decimals and
percents as ratios.
6.6b The student will estimate
solutions and then solve single-step and
multi-step practical problems involving
addition, subtraction, multiplication,
and division of fractions.
6.7 The student will solve single-step
and multi-step practical problems
involving addition, subtraction,
multiplication, and division of
decimals.
5.5b The student will create and solve
single-step and multi-step practical
problems involving decimals.
5.6 The student will solve single-step
and multi-step practical problems
involving addition and subtraction with
fractions and mixed numbers and
express answers in simplest form.
(continued)
Text:
Mathematics Course 2 VA Grade 7,
©2012, Prentice Hall, Pearson
Education
VDOE Enhanced Scope and Sequence
Sample Lesson Plans
http://www.doe.virginia.gov/testing/sol/sco
pe_sequence/mathematics_2009/index.php
Mathematics SOL Resources
www.doe.virginia.gov/instruction/mathema
tics/index.shtml
Foundational Objectives (continued)
4.4d The student will solve single-step and
multi-step addition, subtraction, and
multiplication problems with whole
numbers.
4.5d The student will solve single-step and
multi-step practical problems involving
addition and subtraction with fractions and
with decimals.
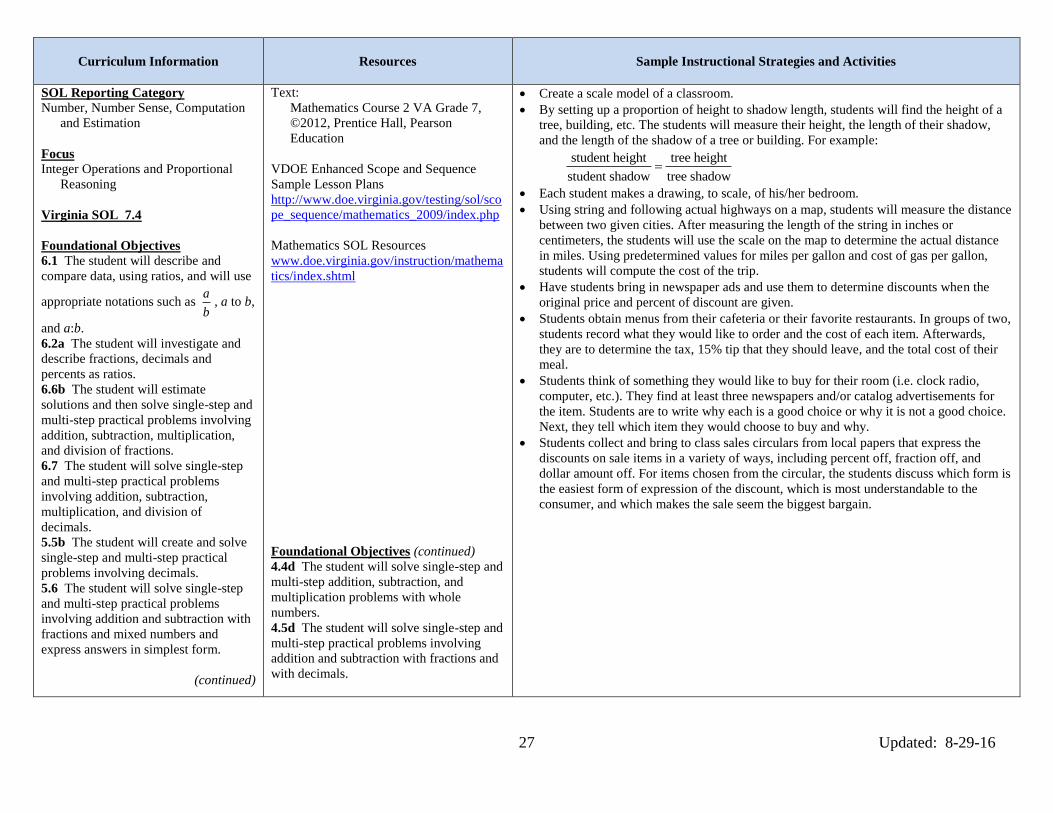
Create a scale model of a classroom.
By setting up a proportion of height to shadow length, students will find the height of a
tree, building, etc. The students will measure their height, the length of their shadow,
and the length of the shadow of a tree or building. For example:
student height tree height
student shadow tree shadow
Each student makes a drawing, to scale, of his/her bedroom.
Using string and following actual highways on a map, students will measure the distance
between two given cities. After measuring the length of the string in inches or
centimeters, the students will use the scale on the map to determine the actual distance
in miles. Using predetermined values for miles per gallon and cost of gas per gallon,
students will compute the cost of the trip.
Have students bring in newspaper ads and use them to determine discounts when the
original price and percent of discount are given.
Students obtain menus from their cafeteria or their favorite restaurants. In groups of two,
students record what they would like to order and the cost of each item. Afterwards,
they are to determine the tax, 15% tip that they should leave, and the total cost of their
meal.
Students think of something they would like to buy for their room (i.e. clock radio,
computer, etc.). They find at least three newspapers and/or catalog advertisements for
the item. Students are to write why each is a good choice or why it is not a good choice.
Next, they tell which item they would choose to buy and why.
Students collect and bring to class sales circulars from local papers that express the
discounts on sale items in a variety of ways, including percent off, fraction off, and
dollar amount off. For items chosen from the circular, the students discuss which form is
the easiest form of expression of the discount, which is most understandable to the
consumer, and which makes the sale seem the biggest bargain.
28 Updated: 8-29-16
Curriculum Information
Essential Knowledge and Skills
Key Vocabulary
Essential Questions and Understandings
Teacher Notes and Elaborations
SOL Reporting Category
Measurement and Geometry
Focus
Proportional Reasoning
Virginia SOL 7.6
The student will determine whether
plane figures (quadrilaterals and
triangles) are similar and write
proportions to express the relationships
between corresponding sides of similar
figures.
The student will use problem solving,
mathematical communication,
mathematical reasoning, connections
and representations to:
Identify corresponding sides and
corresponding and congruent angles of
similar figures using the traditional
notation of curved lines for the angles.
Write proportions to express the
relationships between the lengths of
corresponding sides of similar figures.
Determine if quadrilaterals or triangles
are similar by examining congruence of
corresponding angles and
proportionality of corresponding sides.
Given two similar figures, write
similarity statements using symbols
such as ΔABC ~ ΔDEF, ∠A
corresponds to ∠D, and AB
corresponds to DE .
Cognitive Level (Bloom’s Taxonomy, Revised)
Remember – Identify
Evaluate – Determine
Key Vocabulary
corresponding parts
congruent
hatch mark
polygon
proportion
ratio
similar figures
Essential Questions and Understandings
How do polygons that are similar compare to polygons that are congruent?
Congruent polygons have the same size and shape. Similar polygons have the same
shape, and corresponding angles between the similar figures are congruent.
However, the lengths of the corresponding sides are proportional. All congruent
polygons are considered similar with the ratio of the corresponding sides being 1:1.
Teacher Notes and Elaborations
The symbol ~ is used to indicate that two polygons (a closed plane figure constructed with
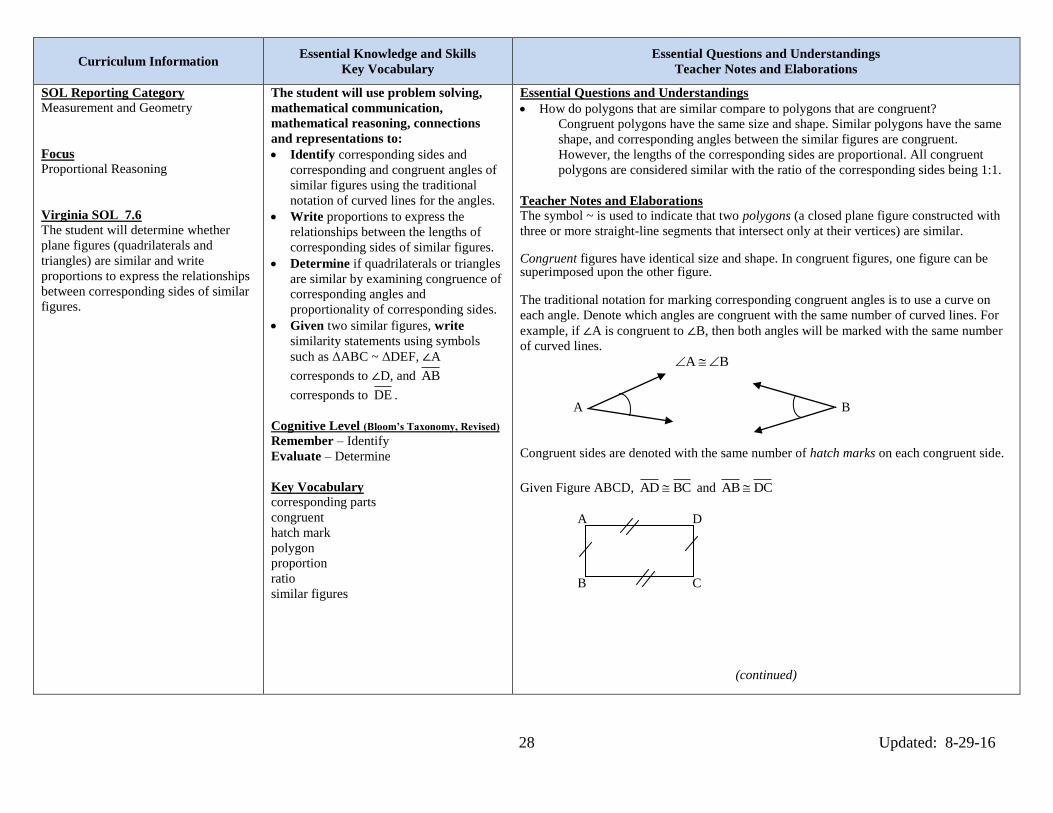
three or more straight-line segments that intersect only at their vertices) are similar. Congruent figures have identical size and shape. In congruent figures, one figure can be superimposed upon the other figure. The traditional notation for marking corresponding congruent angles is to use a curve on
each angle. Denote which angles are congruent with the same number of curved lines. For
example, if ∠A is congruent to ∠B, then both angles will be marked with the same number
of curved lines.
A B
A B
Congruent sides are denoted with the same number of hatch marks on each congruent side.
Given Figure ABCD, AD BC and AB DC
A D
B C
(continued)

29 Updated: 8-29-16
Curriculum Information
Essential Questions and Understandings
Teacher Notes and Elaborations
SOL Reporting Category
Measurement and Geometry
Focus
Proportional Reasoning
Virginia SOL 7.6
The student will determine whether
plane figures (quadrilaterals and
triangles) are similar and write
proportions to express the relationships
between corresponding sides of similar
figures.
Teacher Notes and Elaborations (continued)
In another example, a side on a polygon with two hatch marks is congruent to the side with two hatch marks on a congruent polygon.
Based on the following figures, it can be concluded that MA RO .
M A R O
H T S K
Corresponding parts is a one-to-one mapping between two figures. Similar figures are the same shape, but not always the same size.
ΔABC ~ ΔDEF. Therefore:
A corresponds to D and A D
B corresponds to E and B E
C corresponds to F and C F
AB BC AC
= =DE EF DF
A proportion is a statement of equality between two ratios. It states that one ratio (comparison) is equivalent to another ratio. Proportions
can be written to express these relationships and solved to find a missing length if the others are known.
Two polygons are similar if corresponding (matching) angles are congruent and the lengths of corresponding sides are proportional.
L 12
O M 9
8 6 A
4 3
H T
E 16 V 12
L M O A
V T
E H
LO OV VE EL 4
= = =MA AT TH HM 3
Therefore Quad LOVE ~ Quad MATH
(continued)
30 Updated: 8-29-16
Curriculum Information
Essential Questions and Understandings
Teacher Notes and Elaborations
SOL Reporting Category
Measurement and Geometry
Focus
Proportional Reasoning
Virginia SOL 7.6
The student will determine whether
plane figures (quadrilaterals and
triangles) are similar and write
proportions to express the relationships
between corresponding sides of similar
figures.
Teacher Notes and Elaborations (continued)
Congruent figures have corresponding parts that have equal measures while similar figures have corresponding angles congruent but
corresponding sides with proportional measures.
Congruent polygons have the same size and shape. Congruent polygons are similar polygons for which the ratio of the corresponding sides
is 1:1.
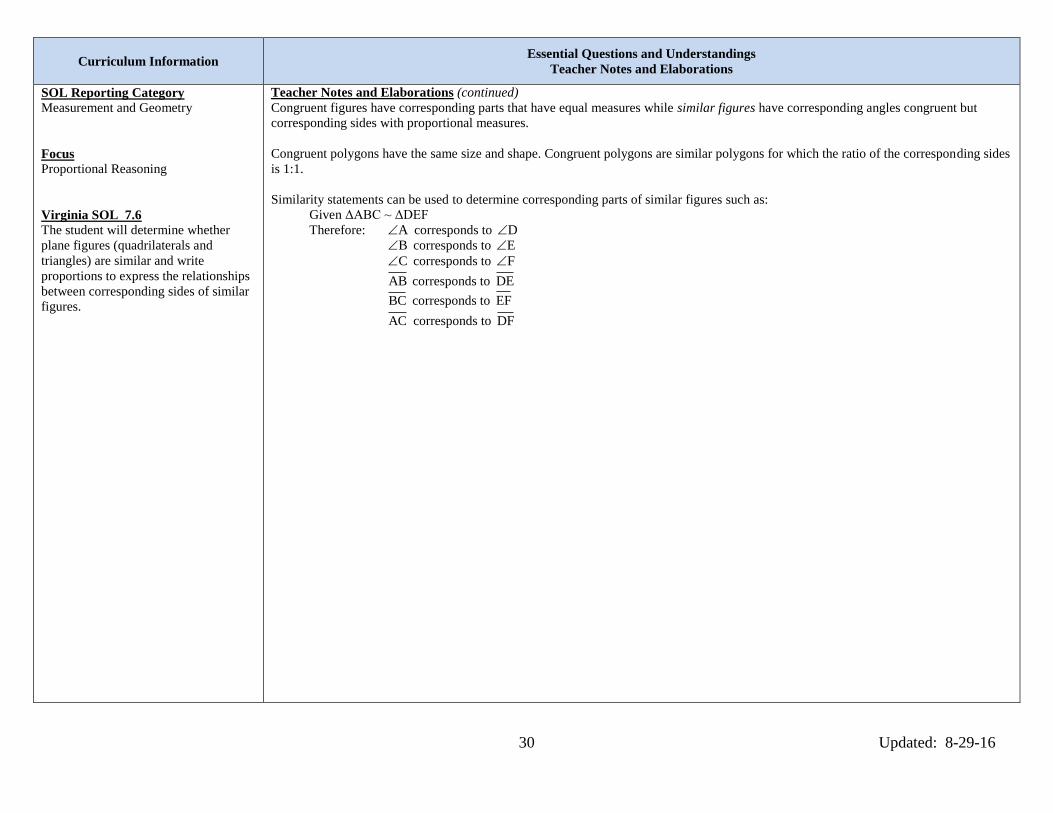
Similarity statements can be used to determine corresponding parts of similar figures such as:
Given ΔABC ~ ΔDEF
Therefore: A corresponds to D
B corresponds to E
C corresponds to F
AB corresponds to DE
BC corresponds to EF
AC corresponds to DF

31 Updated: 8-29-16
Curriculum Information
Resources Sample Instructional Strategies and Activities
SOL Reporting Category
Measurement and Geometry
Focus
Proportional Reasoning
Virginia SOL 7.6
Foundational Objectives
6.12
The student will determine congruence
of segments, angles, and polygons.
5.11
The student will measure right, acute,
obtuse, and straight angles.
5.12 The student will classify
a. angles as right, acute, obtuse, or
straight; and
b. triangles as right, acute, obtuse,
equilateral, scalene, or isosceles.
4.10
The student will
a. identify and describe representations
of points, lines, line segments, rays,
and angles, including endpoints and
vertices; and
b. identify representations of lines that
illustrate intersection, parallelism,
and perpendicularity.
Text:
Mathematics Course 2 VA Grade 7,
©2012, Prentice Hall, Pearson
Education
VDOE Enhanced Scope and Sequence
Sample Lesson Plans
http://www.doe.virginia.gov/testing/sol/sco
pe_sequence/mathematics_2009/index.php
Mathematics SOL Resources
www.doe.virginia.gov/instruction/mathema
tics/index.shtml
Each student is given two rectangular cards to see if they are similar. The students
measure the cards in inches and compare the two ratios to see if they are equal. If they
are not similar, one of the cards is cut so they are similar.
Students are given several quadrilaterals and asked to identify which are similar.
Students must identify congruency and proportionality to support their decisions.
32 Updated: 8-29-16
Curriculum Information
Essential Knowledge and Skills
Key Vocabulary
Essential Questions and Understandings
Teacher Notes and Elaborations
SOL Reporting Category
Measurement and Geometry
Focus
Proportional Reasoning
Virginia SOL 7.5
The student will
a. describe volume and surface area of
cylinders;
b. solve practical problems involving
the volume and surface area of
rectangular prisms and cylinders;
and
c. describe how changing one
measured attribute of a rectangular
prism affects its volume and surface
area.
Pacing
Unit 8: Measurement
Time: 12 Blocks
The student will use problem solving,
mathematical communication,
mathematical reasoning, connections
and representations to:
Determine if a practical problem
involving a rectangular prism or
cylinder represents the application of
volume or surface area.
Find the surface area of a rectangular
prism.
Solve practical problems that require
finding the surface area of a rectangular
prism.
Develop a procedure and formula for
finding the surface area of a cylinder.
Find the surface area of a cylinder.
Solve practical problems that require
finding the surface area of a cylinder.
Find the volume of a rectangular prism.
Solve practical problems that require
finding the volume of a rectangular
prism.
Develop a procedure and formula for
finding the volume of a cylinder.
Find the volume of a cylinder.
Solve practical problems that require
finding the volume of a cylinder.
Describe how the volume of a
rectangular prism is affected when one
measured attribute is multiplied by a
scale factor. Problems will be limited to
changing attributes by scale factors
(e.g., 1
2, 2, 3, 5, and 10) only.
(continued)
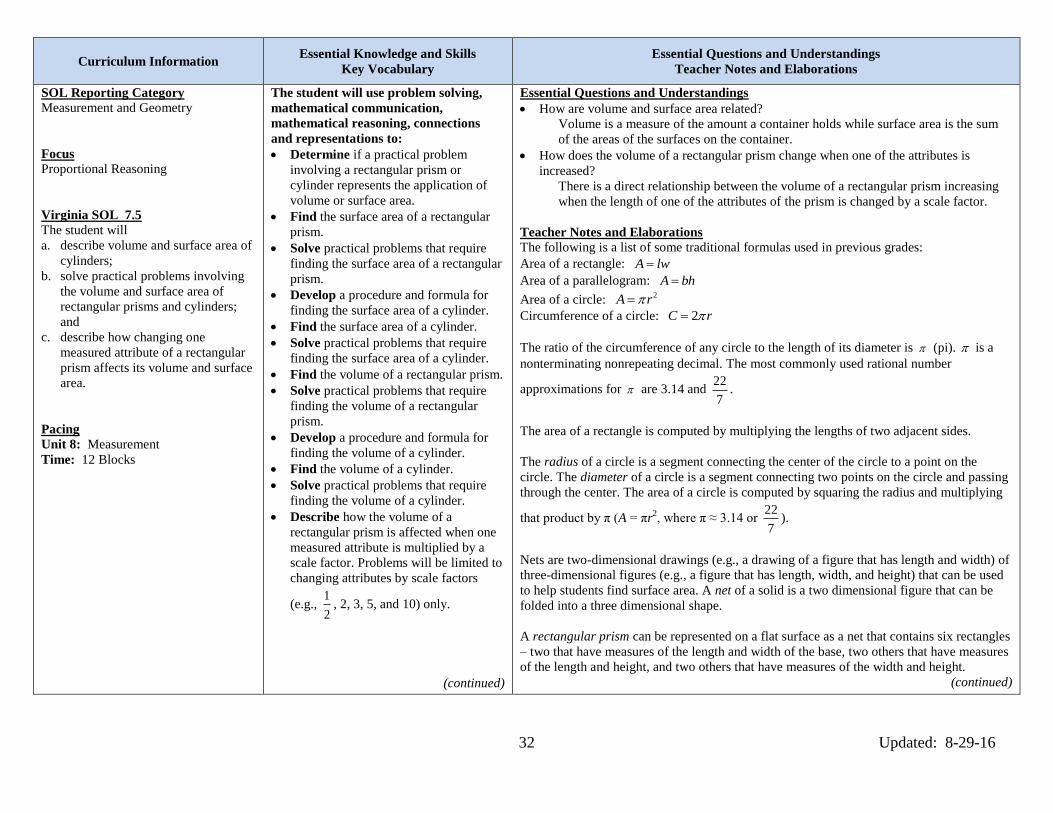
Essential Questions and Understandings
How are volume and surface area related?
Volume is a measure of the amount a container holds while surface area is the sum
of the areas of the surfaces on the container.
How does the volume of a rectangular prism change when one of the attributes is
increased?
There is a direct relationship between the volume of a rectangular prism increasing
when the length of one of the attributes of the prism is changed by a scale factor.
Teacher Notes and Elaborations
The following is a list of some traditional formulas used in previous grades:
Area of a rectangle: A lw
Area of a parallelogram: A bh
Area of a circle: 2A r
Circumference of a circle: 2C r
The ratio of the circumference of any circle to the length of its diameter is (pi). is a
nonterminating nonrepeating decimal. The most commonly used rational number
approximations for are 3.14 and 22
7.
The area of a rectangle is computed by multiplying the lengths of two adjacent sides.
The radius of a circle is a segment connecting the center of the circle to a point on the
circle. The diameter of a circle is a segment connecting two points on the circle and passing
through the center. The area of a circle is computed by squaring the radius and multiplying
that product by π (A = πr2, where π ≈ 3.14 or
22
7).
Nets are two-dimensional drawings (e.g., a drawing of a figure that has length and width) of
three-dimensional figures (e.g., a figure that has length, width, and height) that can be used
to help students find surface area. A net of a solid is a two dimensional figure that can be
folded into a three dimensional shape.
A rectangular prism can be represented on a flat surface as a net that contains six rectangles
– two that have measures of the length and width of the base, two others that have measures
of the length and height, and two others that have measures of the width and height.
(continued)

33 Updated: 8-29-16
Curriculum Information
Essential Knowledge and Skills
Key Vocabulary
Essential Questions and Understandings
Teacher Notes and Elaborations
SOL Reporting Category
Measurement and Geometry
Focus
Proportional Reasoning
Virginia SOL 7.5
The student will
a. describe volume and surface area of
cylinders;
b. solve practical problems involving
the volume and surface area of
rectangular prisms and cylinders;
and
c. describe how changing one
measured attribute of a rectangular
prism affects its volume and surface
area.
Pacing
Unit 8: Measurement
Time: 12 Blocks
(continued)
Describe how the surface area of a
rectangular prism is affected when one
measured attribute is multiplied by a
scale factor. Problems will be limited to
changing attributes by scale factors
(e.g., 1
2, 2, 3, 5, and 10) only.
Cognitive Level (Bloom’s Taxonomy, Revised)
Remember – Find
Understand – Describe
Analyze – Solve
Evaluate – Determine
Create - Develop
Key Vocabulary
base
cube
cylinder
diameter
face
formula
height
length
net
pi ( )
radius
rectangular prism
scale factor
surface area
volume
width
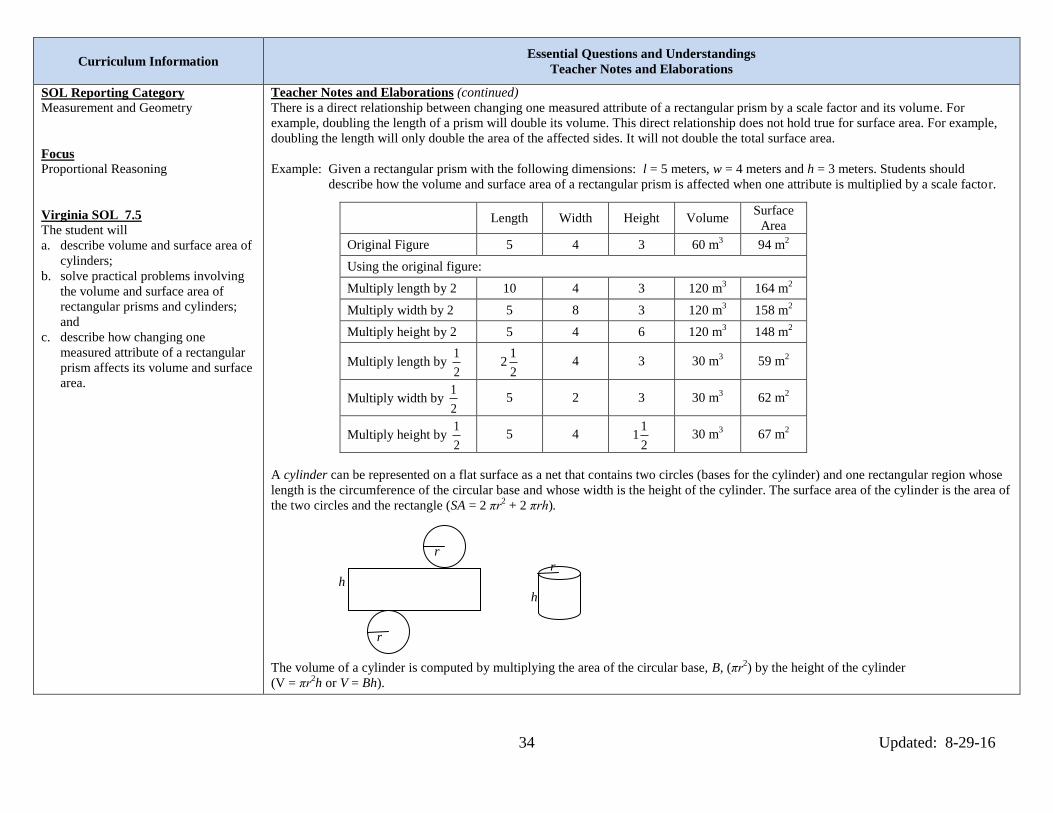
Teacher Notes and Elaborations (continued)
A face is a flat side of a solid figure. Surface area of any solid figure is the total area of the
surface of the solid. The surface area of a rectangular prism is the sum of the areas of all six
faces (SA = 2lw + 2lh + 2wh).
l
w w
h h h
w l l
A formula is an equation that shows a mathematical relationship. Some formulas used in
determining measurements in geometry use B to represent the area of the base of the solid
figure.
The base of a solid figure is the bottom, side or face of the solid figure.
The volume of a solid is the total amount of space inside a three-dimensional object. A unit
for measuring volume is the cubic unit.
The volume of a rectangular prism is computed by multiplying the area of the base, B,
(length times width) by the height of the prism (V = lwh or V = Bh).
A cube is a rectangular prism in which every face is a square and every edge is the same
length.
A scale factor is a ratio that compares the sizes of the parts of the scale drawing of an object
with the actual sizes of the corresponding parts of the object (e.g., If the scale drawing is ten
times the size of the actual object, the scale factor is 10).
(continued)
34 Updated: 8-29-16
Curriculum Information
Essential Questions and Understandings
Teacher Notes and Elaborations
SOL Reporting Category
Measurement and Geometry
Focus
Proportional Reasoning
Virginia SOL 7.5
The student will
a. describe volume and surface area of
cylinders;
b. solve practical problems involving
the volume and surface area of
rectangular prisms and cylinders;
and
c. describe how changing one
measured attribute of a rectangular
prism affects its volume and surface
area.
Teacher Notes and Elaborations (continued)
There is a direct relationship between changing one measured attribute of a rectangular prism by a scale factor and its volume. For
example, doubling the length of a prism will double its volume. This direct relationship does not hold true for surface area. For example,
doubling the length will only double the area of the affected sides. It will not double the total surface area.
Example: Given a rectangular prism with the following dimensions: l = 5 meters, w = 4 meters and h = 3 meters. Students should
describe how the volume and surface area of a rectangular prism is affected when one attribute is multiplied by a scale factor.
A cylinder can be represented on a flat surface as a net that contains two circles (bases for the cylinder) and one rectangular region whose
length is the circumference of the circular base and whose width is the height of the cylinder. The surface area of the cylinder is the area of
the two circles and the rectangle (SA = 2 πr2 + 2 πrh).
r
r
h
h
r
The volume of a cylinder is computed by multiplying the area of the circular base, B, (πr2) by the height of the cylinder
(V = πr2h or V = Bh).
Length Width Height Volume Surface
Area
Original Figure 5 4 3 60 m3 94 m
2
Using the original figure:
Multiply length by 2 10 4 3 120 m3 164 m
2
Multiply width by 2 5 8 3 120 m3 158 m
2
Multiply height by 2 5 4 6 120 m3 148 m
2
Multiply length by 1
2
12
2 4 3 30 m
3 59 m
2
Multiply width by 1
2 5 2 3 30 m
3 62 m
2
Multiply height by 1
2 5 4
11
2 30 m
3 67 m
2
35 Updated: 8-29-16
Curriculum Information
Resources
Sample Instructional Strategies and Activities
SOL Reporting Category
Measurement and Geometry
Focus
Proportional Reasoning
Virginia SOL 7.5
Foundational Objectives
6.10
The student will
a. define pi (π) as the ratio of the
circumference of a circle to its
diameter;
b. solve practical problems involving
circumference and area of a circle,
given the diameter or radius;
c. solve practical problems involving
area and perimeter; and
d. describe and determine the volume
and surface area of a rectangular
prism.
5.8a, b
The student will
a. find perimeter, area, and volume in
standard units of measure; and
b. differentiate among perimeter, area,
and volume and identify whether the
application of the concept of
perimeter, area, or volume is
appropriate for a given situation.
5.9
The student will identify and describe
the diameter, radius, chord, and
circumference of a circle.
Text:
Mathematics Course 2 VA Grade 7,
©2012, Prentice Hall, Pearson
Education
VDOE Enhanced Scope and Sequence
Sample Lesson Plans
http://www.doe.virginia.gov/testing/sol/sco
pe_sequence/mathematics_2009/index.php
Mathematics SOL Resources
www.doe.virginia.gov/instruction/mathema
tics/index.shtml
Students bring in cereal and oatmeal boxes from home and cut them apart to determine
the surface area.
Students stack unit cubes in various ways and find the surface areas of the structures
they have built. They sketch their figures and discuss which figure has the largest
surface area and which has the smallest surface area.
The students will work in groups of three or four using 1” cubes and 1” by 1” grid
paper. Have the students design the cubes on the grid paper in a 3 x 5 rectangle. The
students will then figure the area of the rectangle by counting the cubes. Next have the
students add a second layer of cubes to the rectangle and give the area. Add the areas in
order to determine the volume. Continue adding layers until the students arrive at the
formula V= (area of base) h.
Three-dimensional models may be built from pictures showing the top, side and/or
bottom views. Pictures may be line drawings or drawings on dot paper. Volume can then
be determined by counting the cubes. Surface area can be determined by counting all
outside faces.
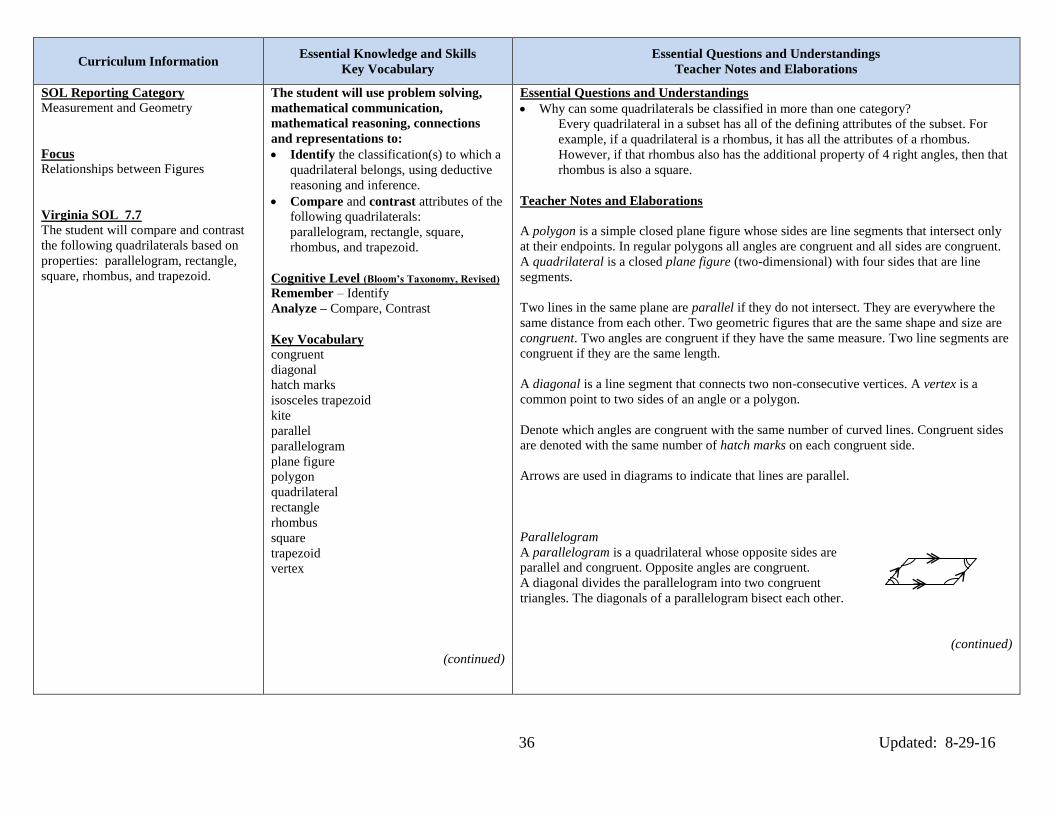
36 Updated: 8-29-16
Curriculum Information
Essential Knowledge and Skills
Key Vocabulary
Essential Questions and Understandings
Teacher Notes and Elaborations
SOL Reporting Category
Measurement and Geometry
Focus
Relationships between Figures
Virginia SOL 7.7
The student will compare and contrast
the following quadrilaterals based on
properties: parallelogram, rectangle,
square, rhombus, and trapezoid.
The student will use problem solving,
mathematical communication,
mathematical reasoning, connections
and representations to:
Identify the classification(s) to which a
quadrilateral belongs, using deductive
reasoning and inference.
Compare and contrast attributes of the
following quadrilaterals:
parallelogram, rectangle, square,
rhombus, and trapezoid.
Cognitive Level (Bloom’s Taxonomy, Revised)
Remember – Identify
Analyze – Compare, Contrast
Key Vocabulary
congruent
diagonal
hatch marks
isosceles trapezoid
kite
parallel
parallelogram
plane figure
polygon
quadrilateral
rectangle
rhombus
square
trapezoid
vertex
(continued)
Essential Questions and Understandings
Why can some quadrilaterals be classified in more than one category?
Every quadrilateral in a subset has all of the defining attributes of the subset. For
example, if a quadrilateral is a rhombus, it has all the attributes of a rhombus.
However, if that rhombus also has the additional property of 4 right angles, then that
rhombus is also a square.
Teacher Notes and Elaborations
A polygon is a simple closed plane figure whose sides are line segments that intersect only
at their endpoints. In regular polygons all angles are congruent and all sides are congruent.
A quadrilateral is a closed plane figure (two-dimensional) with four sides that are line
segments.
Two lines in the same plane are parallel if they do not intersect. They are everywhere the
same distance from each other. Two geometric figures that are the same shape and size are
congruent. Two angles are congruent if they have the same measure. Two line segments are
congruent if they are the same length.
A diagonal is a line segment that connects two non-consecutive vertices. A vertex is a
common point to two sides of an angle or a polygon.
Denote which angles are congruent with the same number of curved lines. Congruent sides
are denoted with the same number of hatch marks on each congruent side.
Arrows are used in diagrams to indicate that lines are parallel.
Parallelogram
A parallelogram is a quadrilateral whose opposite sides are
parallel and congruent. Opposite angles are congruent.
A diagonal divides the parallelogram into two congruent
triangles. The diagonals of a parallelogram bisect each other.
(continued)
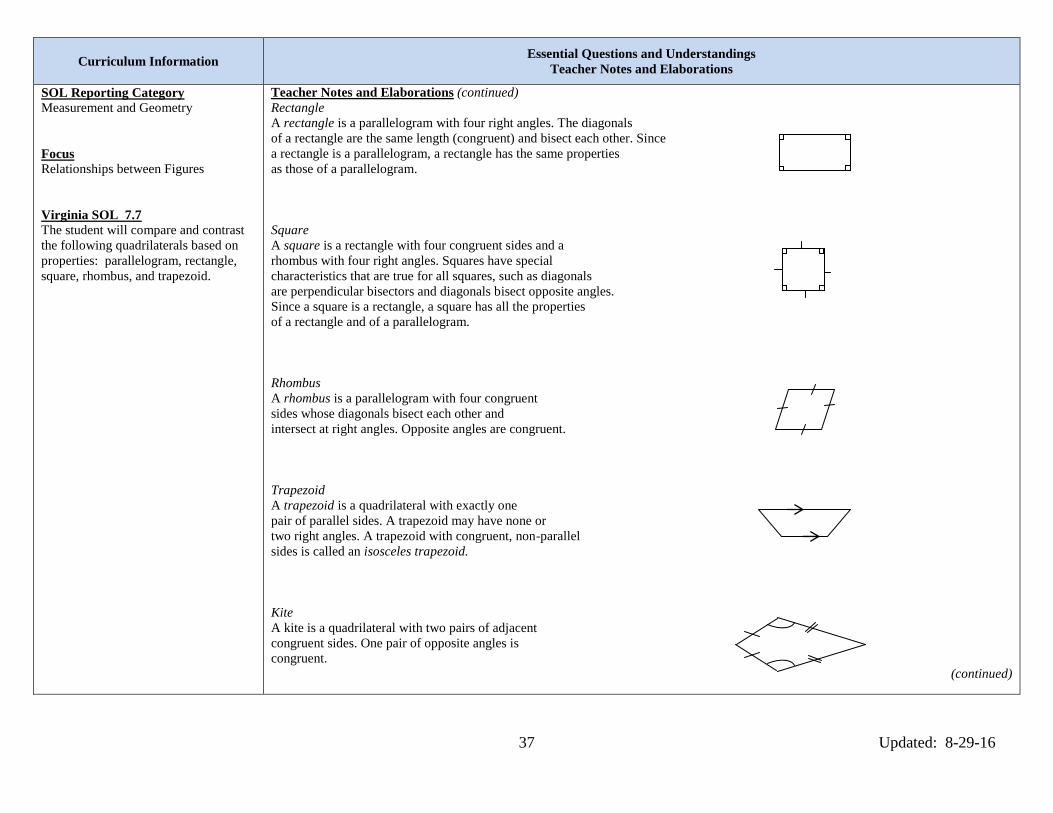
37 Updated: 8-29-16
Curriculum Information
Essential Questions and Understandings
Teacher Notes and Elaborations
SOL Reporting Category
Measurement and Geometry
Focus
Relationships between Figures
Virginia SOL 7.7
The student will compare and contrast
the following quadrilaterals based on
properties: parallelogram, rectangle,
square, rhombus, and trapezoid.
Teacher Notes and Elaborations (continued)
Rectangle
A rectangle is a parallelogram with four right angles. The diagonals
of a rectangle are the same length (congruent) and bisect each other. Since
a rectangle is a parallelogram, a rectangle has the same properties
as those of a parallelogram.
Square
A square is a rectangle with four congruent sides and a
rhombus with four right angles. Squares have special
characteristics that are true for all squares, such as diagonals
are perpendicular bisectors and diagonals bisect opposite angles.
Since a square is a rectangle, a square has all the properties
of a rectangle and of a parallelogram.
Rhombus
A rhombus is a parallelogram with four congruent
sides whose diagonals bisect each other and
intersect at right angles. Opposite angles are congruent.
Trapezoid
A trapezoid is a quadrilateral with exactly one
pair of parallel sides. A trapezoid may have none or
two right angles. A trapezoid with congruent, non-parallel
sides is called an isosceles trapezoid.
Kite
A kite is a quadrilateral with two pairs of adjacent
congruent sides. One pair of opposite angles is
congruent.
(continued)

38 Updated: 8-29-16
Curriculum Information
Essential Questions and Understandings
Teacher Notes and Elaborations
SOL Reporting Category
Measurement and Geometry
Focus
Relationships between Figures
Virginia SOL 7.7
The student will compare and contrast
the following quadrilaterals based on
properties: parallelogram, rectangle,
square, rhombus, and trapezoid.
Teacher Notes and Elaborations (continued)
Quadrilaterals can be sorted according to common attributes, using a variety of materials. A chart, graphic organizer, or a Venn diagram
can be made to organize quadrilaterals according to attributes such as sides and/or angles.
Quadrilaterals
Parallelograms
Trapezoids
Rectangles Squares Rhombi
Isosceles
Trapezoids
Kites
39 Updated: 8-29-16
Curriculum Information
Resources
Sample Instructional Strategies and Activities
SOL Reporting Category
Measurement and Geometry
Focus
Relationships between Figures
Virginia SOL 7.7
Foundational Objectives
6.13
The student will describe and identify
properties of quadrilaterals.
5.13a
The student, using plane figures
(square, rectangle, triangle,
parallelogram, rhombus, and trapezoid),
will develop definitions of these plane
figures.
4.10b
The student will identify
representations of lines that illustrate
intersection, parallelism, and
perpendicularity.
4.12
The student will
a. define polygon; and
b. identify polygons with 10 or fewer
sides.
Text:
Mathematics Course 2 VA Grade 7,
©2012, Prentice Hall, Pearson
Education
VDOE Enhanced Scope and Sequence
Sample Lesson Plans
http://www.doe.virginia.gov/testing/sol/sco
pe_sequence/mathematics_2009/index.php
Mathematics SOL Resources
www.doe.virginia.gov/instruction/mathema
tics/index.shtml
Have students locate and make lists of where different geometric shapes are found.
Students search for parallelograms, rectangles, squares, rhombi, and trapezoids. Students
will describe the characteristics of each quadrilateral and how the shapes are alike and
different.
Prepare a bulletin board with shapes and the appropriate name of each shape. Each day,
a student will go to the bulletin board and place the correct name under the appropriate
shape.
Make a flow chart demonstrating the relationships among all quadrilaterals.
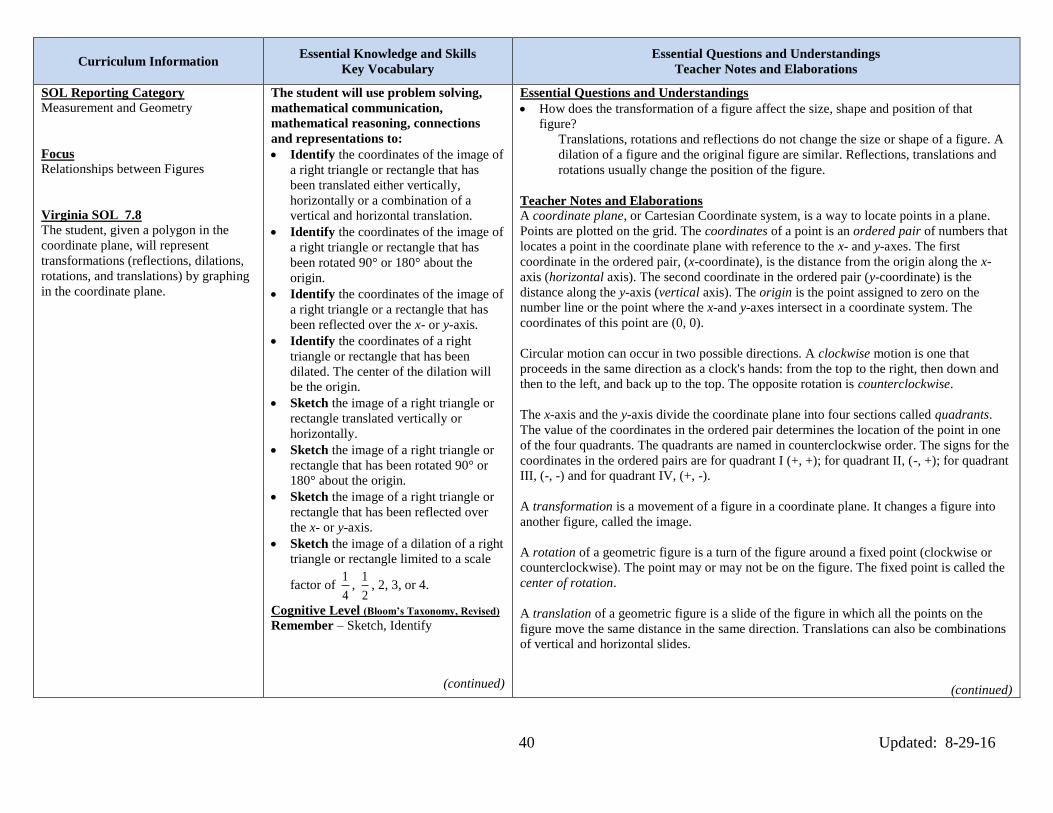
40 Updated: 8-29-16
Curriculum Information
Essential Knowledge and Skills
Key Vocabulary
Essential Questions and Understandings
Teacher Notes and Elaborations
SOL Reporting Category
Measurement and Geometry
Focus
Relationships between Figures
Virginia SOL 7.8
The student, given a polygon in the
coordinate plane, will represent
transformations (reflections, dilations,
rotations, and translations) by graphing
in the coordinate plane.
The student will use problem solving,
mathematical communication,
mathematical reasoning, connections
and representations to:
Identify the coordinates of the image of
a right triangle or rectangle that has
been translated either vertically,
horizontally or a combination of a
vertical and horizontal translation.
Identify the coordinates of the image of
a right triangle or rectangle that has
been rotated 90° or 180° about the
origin.
Identify the coordinates of the image of
a right triangle or a rectangle that has
been reflected over the x- or y-axis.
Identify the coordinates of a right
triangle or rectangle that has been
dilated. The center of the dilation will
be the origin.
Sketch the image of a right triangle or
rectangle translated vertically or
horizontally.
Sketch the image of a right triangle or
rectangle that has been rotated 90° or
180° about the origin.
Sketch the image of a right triangle or
rectangle that has been reflected over
the x- or y-axis.
Sketch the image of a dilation of a right
triangle or rectangle limited to a scale
factor of 1
4,
1
2, 2, 3, or 4.
Cognitive Level (Bloom’s Taxonomy, Revised)
Remember – Sketch, Identify
(continued)
Essential Questions and Understandings
How does the transformation of a figure affect the size, shape and position of that
figure?
Translations, rotations and reflections do not change the size or shape of a figure. A
dilation of a figure and the original figure are similar. Reflections, translations and
rotations usually change the position of the figure.
Teacher Notes and Elaborations
A coordinate plane, or Cartesian Coordinate system, is a way to locate points in a plane.
Points are plotted on the grid. The coordinates of a point is an ordered pair of numbers that
locates a point in the coordinate plane with reference to the x- and y-axes. The first
coordinate in the ordered pair, (x-coordinate), is the distance from the origin along the x-
axis (horizontal axis). The second coordinate in the ordered pair (y-coordinate) is the
distance along the y-axis (vertical axis). The origin is the point assigned to zero on the
number line or the point where the x-and y-axes intersect in a coordinate system. The
coordinates of this point are (0, 0).
Circular motion can occur in two possible directions. A clockwise motion is one that
proceeds in the same direction as a clock's hands: from the top to the right, then down and
then to the left, and back up to the top. The opposite rotation is counterclockwise.
The x-axis and the y-axis divide the coordinate plane into four sections called quadrants.
The value of the coordinates in the ordered pair determines the location of the point in one
of the four quadrants. The quadrants are named in counterclockwise order. The signs for the
coordinates in the ordered pairs are for quadrant I (+, +); for quadrant II, (-, +); for quadrant
III, (-, -) and for quadrant IV, (+, -).
A transformation is a movement of a figure in a coordinate plane. It changes a figure into
another figure, called the image.
A rotation of a geometric figure is a turn of the figure around a fixed point (clockwise or
counterclockwise). The point may or may not be on the figure. The fixed point is called the
center of rotation.
A translation of a geometric figure is a slide of the figure in which all the points on the
figure move the same distance in the same direction. Translations can also be combinations
of vertical and horizontal slides.
(continued)

41 Updated: 8-29-16
Curriculum Information
Essential Knowledge and Skills
Key Vocabulary
Essential Questions and Understandings
Teacher Notes and Elaborations
SOL Reporting Category
Measurement and Geometry
Focus
Relationships between Figures
Virginia SOL 7.8
The student, given a polygon in the
coordinate plane, will represent
transformations (reflections, dilations,
rotations, and translations) by graphing
in the coordinate plane.
(continued)
Key Vocabulary center of rotation
clockwise
coordinate plane
coordinates (ordered pair)
counterclockwise
dilation
horizontal axis (x-axis)
image
origin
preimage
quadrant
reflection
rotation
scale factor
transformation
translation
vertical axis (y-axis)
Teacher Notes and Elaborations (continued)
A reflection is a transformation that reflects (flips) a figure across a line in the plane. It
creates a mirror image of a figure on the opposite side of a line. Each point on the reflected
figure is the same distance from the line as the corresponding point in the original figure.
A dilation of a geometric figure is a transformation that changes the size of a figure by a
scale factor to create a similar figure. The scale factor is the ratio of corresponding side
lengths of a figure and its image after dilation.
The image of a polygon is the resulting polygon after the transformation. The preimage is
the polygon before the transformation.
A transformation of preimage point A can be denoted as the image A (read as “A prime”).
When a geometric figure is translated on a coordinate plane, the new vertices are labeled as
follows: point A corresponds to A , point B corresponds to B , and so on. Sometimes
double prime ( A ) and triple prime ( A ) notations are used.
When applying transformations, experiences should include plotting the points in the
coordinate plane and identifying the coordinates in list format.
Example: ( 7,3),( 7, 2),( 1, 2) .
42 Updated: 8-29-16
Curriculum Information
Resources
Sample Instructional Strategies and Activities
SOL Reporting Category
Measurement and Geometry
Focus
Relationships between Figures
Virginia SOL 7.8
Foundational Objectives
6.11
The student will
a. identify the coordinates of a point in
a coordinate plane; and
b. graph ordered pairs in a coordinate
plane.
6.12
The student will determine congruence
of segments, angles, and polygons.
4.11
The student will
a. investigate congruence of plane
figures after geometric
transformations, such as reflection,
translation, and rotation, using
mirrors, paper folding, and tracing;
and
b. recognize the images of figures
resulting from geometric
transformations, such as translation,
reflection, and rotation.
Text:
Mathematics Course 2 VA Grade 7,
©2012, Prentice Hall, Pearson
Education
VDOE Enhanced Scope and Sequence
Sample Lesson Plans
http://www.doe.virginia.gov/testing/sol/sco
pe_sequence/mathematics_2009/index.php
Mathematics SOL Resources
www.doe.virginia.gov/instruction/mathema
tics/index.shtml
Use patty paper to trace figures to determine the type of transformation.
Bring in advertisements from flyers, newspapers, and coupon mailers. Have students
identify different types of transformations found in the ads.
Wallpaper samples can be used to illustrate different transformations.

43 Updated: 8-29-16
Curriculum Information
Essential Knowledge and Skills
Key Vocabulary
Essential Questions and Understandings
Teacher Notes and Elaborations
SOL Reporting Category
Probability, Statistics, Patterns,
Functions, and Algebra
Focus
Applications of Statistics and
Probability
Virginia SOL 7.9
The student will investigate and
describe the difference between the
experimental probability and theoretical
probability of an event.
Pacing
Unit 10: Probability
Time: 6 Blocks
The student will use problem solving,
mathematical communication,
mathematical reasoning, connections
and representations to:
Determine the theoretical probability
of an event.
Determine the experimental probability
of an event.
Describe changes in the experimental
probability as the number of trials
increases.
Investigate and describe the difference
between the probability of an event
found through experiment or simulation
versus the theoretical probability of that
same event.
Cognitive Level (Bloom’s Taxonomy, Revised)
Remember – Describe
Evaluate – Investigate, Determine
Key Vocabulary
event
experimental probability
Law of Large Numbers
outcome
probability
sample space
sampling
simulation
theoretical probability
Essential Questions and Understandings
What is the difference between the theoretical and experimental probability of an event?
Theoretical probability of an event is the expected probability and can be found with
a formula. The experimental probability of an event is determined by carrying out a
simulation or an experiment. In experimental probability, as the number of trials
increases, the experimental probability gets closer to the theoretical probability.
Teacher Notes and Elaborations
The probability of an event occurring is a ratio expressing the chance or likelihood that a
certain event will occur, given the number of possible outcomes (results) of an experiment.
An event is a subset of a sample space. The sample space is the set of all possible outcomes
of an experiment.
The theoretical probability of an event is the expected probability and can be found with a
formula.
Theoretical probability of an event number of possible favorable outcomes
total number of possible outcomes
The experimental probability of an event is determined by carrying out a simulation or an
experiment. The experimental probability is found by repeating an experiment many times
and using the ratio.
Experimental probability number of times desired outcomes occur
total number of trials in the experiment
Experimental probability is not exact since the results may vary if the experiment is
repeated.
In experimental probability, as the number of trials increases, the experimental probability
gets closer to the theoretical probability (Law of Large Numbers).
Experiences should include comparing the difference between the probability of an event
found through an experiment or simulation and the theoretical probability of the same event.
An important use of experimental probability is to make predictions about a large group of
people based on the results of a poll or survey. This technique, called sampling, is used
when it is impossible to question every member of a group.
44 Updated: 8-29-16
Curriculum Information
Resources
Sample Instructional Strategies and Activities
SOL Reporting Category
Probability, Statistics, Patterns,
Functions, and Algebra
Focus
Applications of Statistics and
Probability
Virginia SOL 7.9
Foundational Objectives
6.16
The student will
a. compare and contrast dependent and
independent events; and
b. determine probabilities for
dependent and independent events.
5.14
The student will make predictions and
determine the probability of an outcome
by constructing a sample space.
4.13
The student will
a. predict the likelihood of an outcome
of a simple event; and
b. represent probability as a number
between zero and one, inclusive.
Text:
Mathematics Course 2 VA Grade 7,
©2012, Prentice Hall, Pearson
Education
VDOE Enhanced Scope and Sequence
Sample Lesson Plans
http://www.doe.virginia.gov/testing/sol/sco
pe_sequence/mathematics_2009/index.php
Mathematics SOL Resources
www.doe.virginia.gov/instruction/mathema
tics/index.shtml
Plan and carry out experiments that use concrete materials (e.g., coins, spinners, number
cubes, etc.) to determine an experimental probability of an event.
Students form large groups and, then, break into pairs of students. Each pair of students
is given one number cube with faces labeled 1-6 and a score sheet. One student in each
pair tosses the number cube 20 times, while the other student tallies the results on the
score sheet. Students then reverse roles. Upon completion students should return to their
larger group to compare and discuss their results. In particular, they should decide
whether the chance of tossing a 1, 2, or 3 is the same as the chance of tossing a 4, 5, or a
6 and why? Compile the results from all classes. Describe how these results approach
the theoretical probability of the events.
Using two number cubes, work with the class to list all the possible outcomes of rolling
both cubes. Students work in pairs with two number cubes. Rolling the number cubes 10
times students list their outcomes. The two students compare their results with the
results from the list (table) of all possible outcomes. Discuss with students how close
their results were to the original results. Have students do the experiment 10 more times
adding these results to the first 10 and again compare results with the original results.
Ask, “Are your results any closer to the original results?” Do the experiment 10 more
times and compare results.
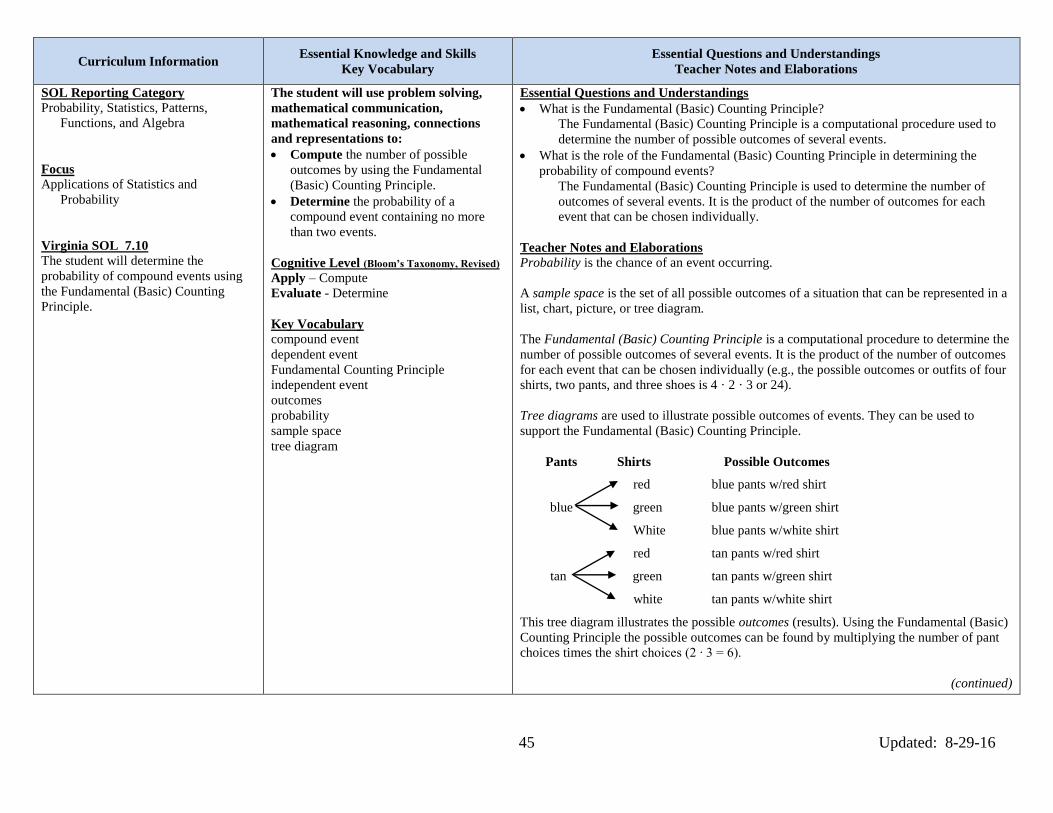
45 Updated: 8-29-16
Curriculum Information
Essential Knowledge and Skills
Key Vocabulary
Essential Questions and Understandings
Teacher Notes and Elaborations
SOL Reporting Category
Probability, Statistics, Patterns,
Functions, and Algebra
Focus
Applications of Statistics and
Probability
Virginia SOL 7.10
The student will determine the
probability of compound events using
the Fundamental (Basic) Counting
Principle.
The student will use problem solving,
mathematical communication,
mathematical reasoning, connections
and representations to:
Compute the number of possible
outcomes by using the Fundamental
(Basic) Counting Principle.
Determine the probability of a
compound event containing no more
than two events.
Cognitive Level (Bloom’s Taxonomy, Revised)
Apply – Compute
Evaluate - Determine
Key Vocabulary
compound event
dependent event
Fundamental Counting Principle
independent event
outcomes
probability
sample space
tree diagram
Essential Questions and Understandings
What is the Fundamental (Basic) Counting Principle?
The Fundamental (Basic) Counting Principle is a computational procedure used to
determine the number of possible outcomes of several events.
What is the role of the Fundamental (Basic) Counting Principle in determining the
probability of compound events?
The Fundamental (Basic) Counting Principle is used to determine the number of
outcomes of several events. It is the product of the number of outcomes for each
event that can be chosen individually.
Teacher Notes and Elaborations
Probability is the chance of an event occurring.
A sample space is the set of all possible outcomes of a situation that can be represented in a
list, chart, picture, or tree diagram.
The Fundamental (Basic) Counting Principle is a computational procedure to determine the
number of possible outcomes of several events. It is the product of the number of outcomes
for each event that can be chosen individually (e.g., the possible outcomes or outfits of four
shirts, two pants, and three shoes is 4 · 2 · 3 or 24).
Tree diagrams are used to illustrate possible outcomes of events. They can be used to
support the Fundamental (Basic) Counting Principle.
Pants Shirts Possible Outcomes
red blue pants w/red shirt
blue green blue pants w/green shirt
White blue pants w/white shirt
red tan pants w/red shirt
tan green tan pants w/green shirt
white tan pants w/white shirt
This tree diagram illustrates the possible outcomes (results). Using the Fundamental (Basic)
Counting Principle the possible outcomes can be found by multiplying the number of pant
choices times the shirt choices (2 ∙ 3 = 6).
(continued)

46 Updated: 8-29-16
Curriculum Information
Essential Questions and Understandings
Teacher Notes and Elaborations
SOL Reporting Category
Probability, Statistics, Patterns,
Functions, and Algebra
Focus
Applications of Statistics and
Probability
Virginia SOL 7.10
The student will determine the
probability of compound events using
the Fundamental (Basic) Counting
Principle.
Teacher Notes and Elaborations (continued)
Events are independent when the outcome of one has no effect on the outcome of the other. For example, rolling a number cube and
flipping a coin are independent events.
Events are dependent when the outcome of one event is influenced by the outcome of the other. For example, when drawing two marbles
from a bag, not replacing the first after it is drawn affects the outcome of the second draw.
A compound event combines two or more simple events (independent or dependent). For example, a bag contains 4 red, 3 green and 2 blue
marbles. What is the probability of selecting a green and then a blue marble (with or without replacement)?
With replacement (independent) the probability is: 3 2 6
9 9 81 which can be simplified to
2
27.
Without replacement (dependent) the probability is: 3 2 6
9 8 72 which can be simplified to
1
12.
The probability of an event can be represented as a ratio (the equivalent fraction, decimal, or percent) or plotted on a number line.
Example: If a die is rolled twice what is the theoretical probability of the number being even on the first roll and greater than 4 on the
second roll.
1 2 1
2 6 6 or 0.16 or approximately 16.7%
The value of this probability can also be plotted on a number line.
0 1

47 Updated: 8-29-16
Curriculum Information
Resources
Sample Instructional Strategies and Activities
SOL Reporting Category
Probability, Statistics, Patterns,
Functions, and Algebra
Focus
Applications of Statistics and
Probability
Virginia SOL 7.10
Foundational Objectives
6.16
The student will
a. compare and contrast dependent and
independent events; and
b. determine probabilities for
dependent and independent events.
5.14
The student will make predictions and
determine the probability of an outcome
by constructing a sample space.
4.13
The student will
a. predict the likelihood of an outcome
of a simple event; and
b. represent probability as a number
between zero and one, inclusive.
Text:
Mathematics Course 2 VA Grade 7,
©2012, Prentice Hall, Pearson
Education
VDOE Enhanced Scope and Sequence
Sample Lesson Plans
http://www.doe.virginia.gov/testing/sol/sco
pe_sequence/mathematics_2009/index.php
Mathematics SOL Resources
www.doe.virginia.gov/instruction/mathema
tics/index.shtml
The standard Virginia state license plate has three letters followed by four digits. How
many different license plates are possible if the digits and letters can be repeated?
(175,760,000) How many are possible if they cannot be repeated? (78,624,000)
Students will list several items of clothing and then determine the different outfits that
they could create with these items.
Obtain three chips; one with sides marked A and B, one with B and C, and one with A
and C. All chips will be flipped at the same time. Make a tree diagram to show all
possible results. Determine probability that none of the chips matches or that at least two
will match. Similar experiments may be done with spinners, flipping coins, and number
cubes.
Students study the chances of winning in the Virginia Lottery Pick 3 and Pick 4 daily
events using the Basic Counting Principle. They compare the chances of winning with
the size of the prize.
Bring in menus from various restaurants. Have students determine the possible number
of meals using various combinations. For example, how many meals with an entrée and
a drink are possible?
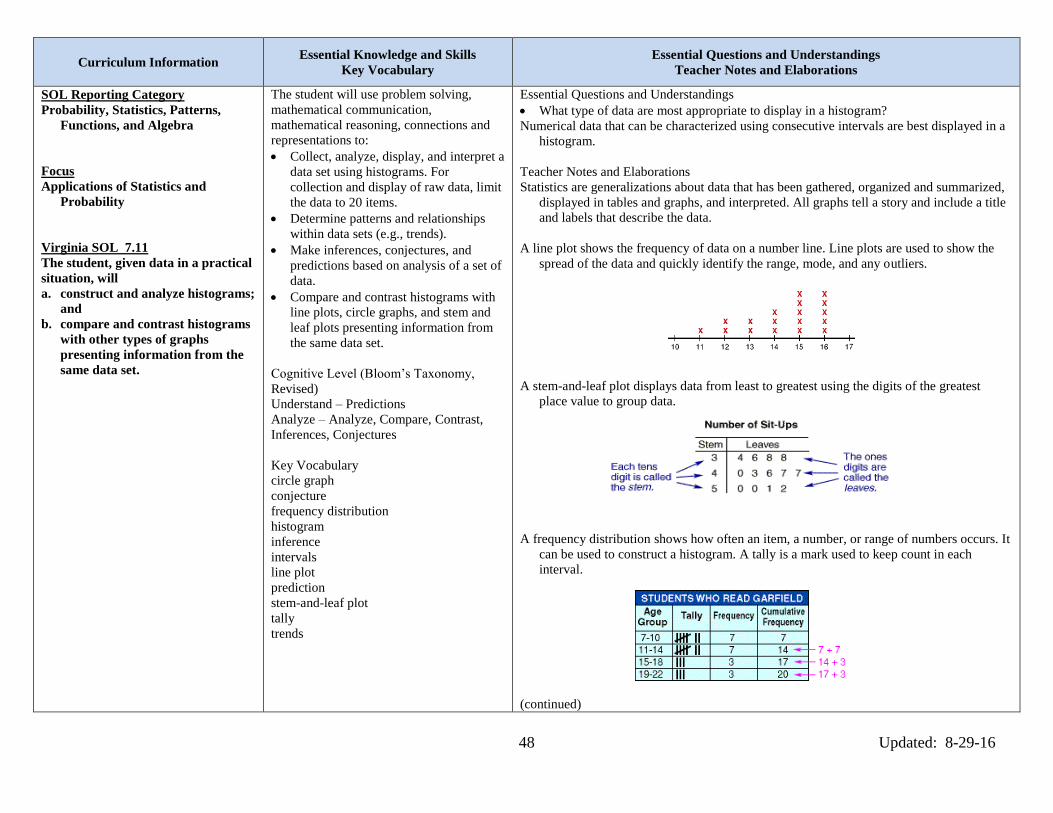
48 Updated: 8-29-16
Curriculum Information
Essential Knowledge and Skills
Key Vocabulary
Essential Questions and Understandings
Teacher Notes and Elaborations
SOL Reporting Category
Probability, Statistics, Patterns,
Functions, and Algebra
Focus
Applications of Statistics and
Probability
Virginia SOL 7.11
The student, given data in a practical
situation, will
a. construct and analyze histograms;
and
b. compare and contrast histograms
with other types of graphs
presenting information from the
same data set.
The student will use problem solving,
mathematical communication,
mathematical reasoning, connections and
representations to:
Collect, analyze, display, and interpret a
data set using histograms. For
collection and display of raw data, limit
the data to 20 items.
Determine patterns and relationships
within data sets (e.g., trends).
Make inferences, conjectures, and
predictions based on analysis of a set of
data.
Compare and contrast histograms with
line plots, circle graphs, and stem and
leaf plots presenting information from
the same data set.
Cognitive Level (Bloom’s Taxonomy,
Revised)
Understand – Predictions
Analyze – Analyze, Compare, Contrast,
Inferences, Conjectures
Key Vocabulary
circle graph
conjecture
frequency distribution
histogram
inference
intervals
line plot
prediction
stem-and-leaf plot
tally
trends
Essential Questions and Understandings
What type of data are most appropriate to display in a histogram?
Numerical data that can be characterized using consecutive intervals are best displayed in a
histogram.
Teacher Notes and Elaborations
Statistics are generalizations about data that has been gathered, organized and summarized,
displayed in tables and graphs, and interpreted. All graphs tell a story and include a title
and labels that describe the data.
A line plot shows the frequency of data on a number line. Line plots are used to show the
spread of the data and quickly identify the range, mode, and any outliers.
A stem-and-leaf plot displays data from least to greatest using the digits of the greatest
place value to group data.
A frequency distribution shows how often an item, a number, or range of numbers occurs. It
can be used to construct a histogram. A tally is a mark used to keep count in each
interval.
(continued)
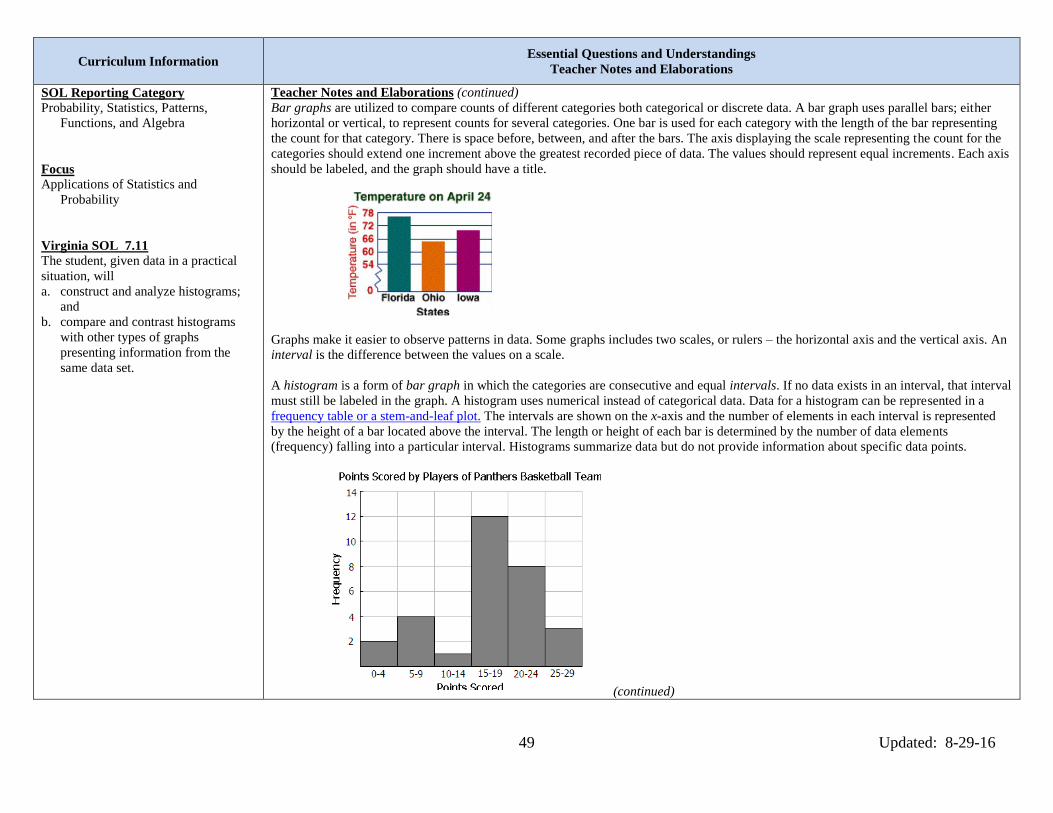
49 Updated: 8-29-16
Curriculum Information
Essential Questions and Understandings
Teacher Notes and Elaborations
SOL Reporting Category
Probability, Statistics, Patterns,
Functions, and Algebra
Focus
Applications of Statistics and
Probability
Virginia SOL 7.11
The student, given data in a practical
situation, will
a. construct and analyze histograms;
and
b. compare and contrast histograms
with other types of graphs
presenting information from the
same data set.
Teacher Notes and Elaborations (continued)
Bar graphs are utilized to compare counts of different categories both categorical or discrete data. A bar graph uses parallel bars; either
horizontal or vertical, to represent counts for several categories. One bar is used for each category with the length of the bar representing
the count for that category. There is space before, between, and after the bars. The axis displaying the scale representing the count for the
categories should extend one increment above the greatest recorded piece of data. The values should represent equal increments. Each axis
should be labeled, and the graph should have a title.
Graphs make it easier to observe patterns in data. Some graphs includes two scales, or rulers – the horizontal axis and the vertical axis. An
interval is the difference between the values on a scale.
A histogram is a form of bar graph in which the categories are consecutive and equal intervals. If no data exists in an interval, that interval
must still be labeled in the graph. A histogram uses numerical instead of categorical data. Data for a histogram can be represented in a
frequency table or a stem-and-leaf plot. The intervals are shown on the x-axis and the number of elements in each interval is represented
by the height of a bar located above the interval. The length or height of each bar is determined by the number of data elements
(frequency) falling into a particular interval. Histograms summarize data but do not provide information about specific data points.
(continued)
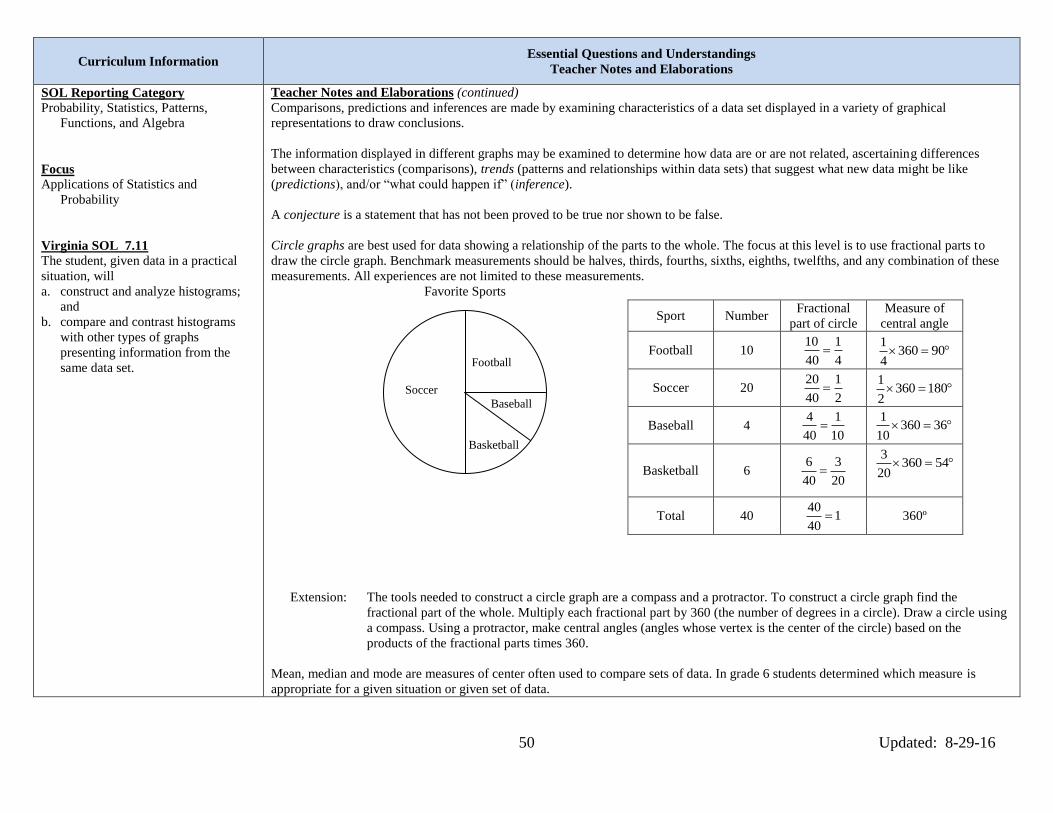
50 Updated: 8-29-16
Curriculum Information
Essential Questions and Understandings
Teacher Notes and Elaborations
SOL Reporting Category
Probability, Statistics, Patterns,
Functions, and Algebra
Focus
Applications of Statistics and
Probability
Virginia SOL 7.11
The student, given data in a practical
situation, will
a. construct and analyze histograms;
and
b. compare and contrast histograms
with other types of graphs
presenting information from the
same data set.
Teacher Notes and Elaborations (continued)
Comparisons, predictions and inferences are made by examining characteristics of a data set displayed in a variety of graphical
representations to draw conclusions.
The information displayed in different graphs may be examined to determine how data are or are not related, ascertaining differences
between characteristics (comparisons), trends (patterns and relationships within data sets) that suggest what new data might be like
(predictions), and/or “what could happen if” (inference).
A conjecture is a statement that has not been proved to be true nor shown to be false.
Circle graphs are best used for data showing a relationship of the parts to the whole. The focus at this level is to use fractional parts to
draw the circle graph. Benchmark measurements should be halves, thirds, fourths, sixths, eighths, twelfths, and any combination of these
measurements. All experiences are not limited to these measurements.
Favorite Sports
Football
Soccer
Baseball
Basketball
Extension: The tools needed to construct a circle graph are a compass and a protractor. To construct a circle graph find the
fractional part of the whole. Multiply each fractional part by 360 (the number of degrees in a circle). Draw a circle using
a compass. Using a protractor, make central angles (angles whose vertex is the center of the circle) based on the
products of the fractional parts times 360.
Mean, median and mode are measures of center often used to compare sets of data. In grade 6 students determined which measure is
appropriate for a given situation or given set of data.
Sport Number Fractional
part of circle
Measure of
central angle
Football 10 10 1
40 4
1360 90
4
Soccer 20 20 1
40 2
1360 180
2
Baseball 4 4 1
40 10
1360 36
10
Basketball 6 6 3
40 20
3360 54
20
Total 40 40
140
360º

51 Updated: 8-29-16
Curriculum Information
Resources
Sample Instructional Strategies and Activities
SOL Reporting Category
Probability, Statistics, Patterns,
Functions, and Algebra
Focus
Applications of Statistics and
Probability
Virginia SOL 7.11
Foundational Objectives
6.14
The student, given a problem situation,
will
a. construct circle graphs;
b. draw conclusions and make
predictions, using circle graphs; and
c. compare and contrast graphs that
present information from the same
data set.
6.15
The student will
a. describe mean as balance point; and
b. decide which measure of center is
appropriate for a given purpose.
5.15
The student, given a problem situation,
will collect, organize, and interpret data
in a variety of forms, using stem-and-
leaf plots and line graphs.
4.14
The student will collect, organize,
display, and interpret data from a
variety of graphs.
Text:
Mathematics Course 2 VA Grade 7,
©2012, Prentice Hall, Pearson
Education
VDOE Enhanced Scope and Sequence
Sample Lesson Plans
http://www.doe.virginia.gov/testing/sol/sco
pe_sequence/mathematics_2009/index.php
Mathematics SOL Resources
www.doe.virginia.gov/instruction/mathema
tics/index.shtml
Students research to find the ages of the Presidents when they took office. Construct a
histogram displaying this data. What can the students determine about the ages of the
Presidents when they took office?
Students are asked to predict how many metals the United States will win in the next
Olympics. They write their prediction on a Post-It-Note and an explanation of their
reasoning. The predictions are collected and displayed on line plot, stem-and-leaf plots,
circle graphs, or histograms. Discuss which graph will best display this data and why it
is the best choice.
Students collect data on topics that interest them, display their findings using a
histogram. Compare this histogram with a line plot, stem-and-leaf plot, or circle graph
displaying the same data. Possible topics include the following:
- number of minutes spent on homework per week;
- allowances of each student in the class; or
- number of hours of television watched per week.
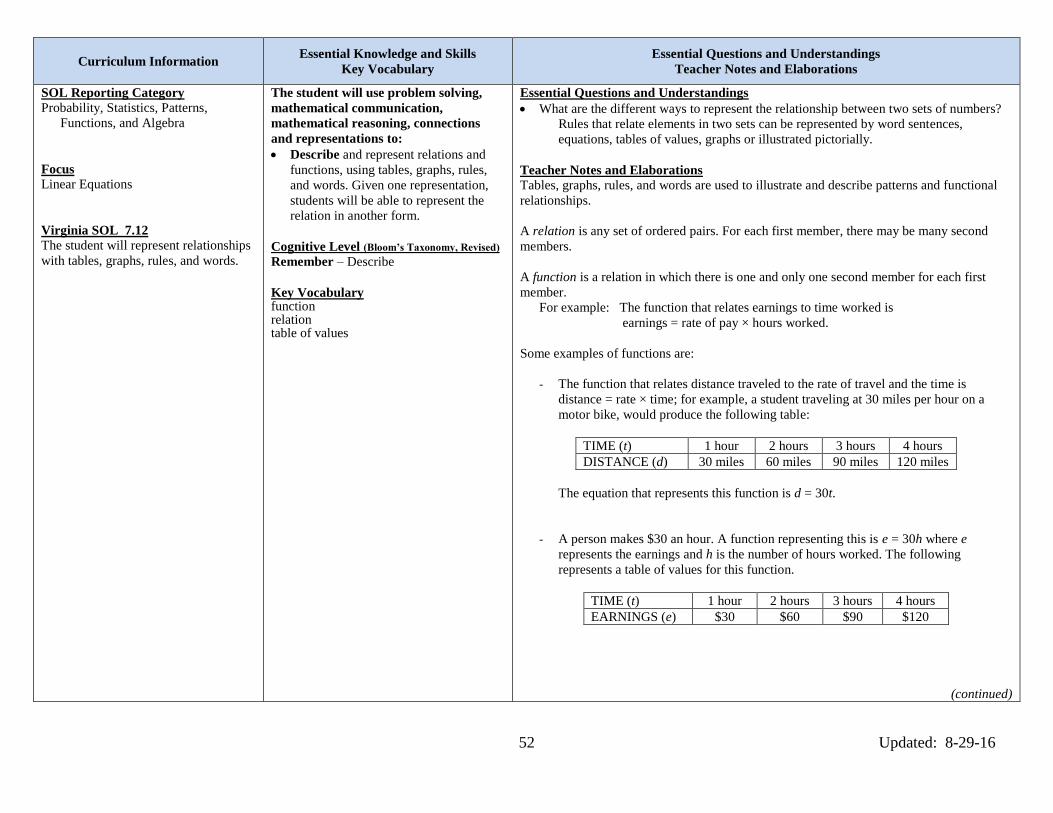
52 Updated: 8-29-16
Curriculum Information
Essential Knowledge and Skills
Key Vocabulary
Essential Questions and Understandings
Teacher Notes and Elaborations
SOL Reporting Category
Probability, Statistics, Patterns,
Functions, and Algebra
Focus
Linear Equations
Virginia SOL 7.12
The student will represent relationships
with tables, graphs, rules, and words.
The student will use problem solving,
mathematical communication,
mathematical reasoning, connections
and representations to:
Describe and represent relations and
functions, using tables, graphs, rules,
and words. Given one representation,
students will be able to represent the
relation in another form.
Cognitive Level (Bloom’s Taxonomy, Revised)
Remember – Describe
Key Vocabulary function relation table of values
Essential Questions and Understandings
What are the different ways to represent the relationship between two sets of numbers?
Rules that relate elements in two sets can be represented by word sentences,
equations, tables of values, graphs or illustrated pictorially.
Teacher Notes and Elaborations
Tables, graphs, rules, and words are used to illustrate and describe patterns and functional
relationships.
A relation is any set of ordered pairs. For each first member, there may be many second
members.
A function is a relation in which there is one and only one second member for each first
member.
For example: The function that relates earnings to time worked is
earnings = rate of pay × hours worked.
Some examples of functions are:
- The function that relates distance traveled to the rate of travel and the time is
distance = rate × time; for example, a student traveling at 30 miles per hour on a
motor bike, would produce the following table:
TIME (t) 1 hour 2 hours 3 hours 4 hours
DISTANCE (d) 30 miles 60 miles 90 miles 120 miles
The equation that represents this function is d = 30t.
- A person makes $30 an hour. A function representing this is e = 30h where e
represents the earnings and h is the number of hours worked. The following
represents a table of values for this function.
TIME (t) 1 hour 2 hours 3 hours 4 hours
EARNINGS (e) $30 $60 $90 $120
(continued)

53 Updated: 8-29-16
Curriculum Information
Essential Questions and Understandings
Teacher Notes and Elaborations
SOL Reporting Category
Probability, Statistics, Patterns,
Functions, and Algebra
Focus
Linear Equations
Virginia SOL 7.12
The student will represent relationships
with tables, graphs, rules, and words.
Teacher Notes and Elaborations (continued)
A table of values is the data used to make a graph in the coordinate system. The values are used to graph points.
Graphs may be constructed from ordered pairs represented in a table.
The ordered pairs in the following table are ( 2,0), ( 1,1), (0,2), (1,3), (2,4) .
The equation represented in this table and graph is 2y x .
Rules that relate elements in two sets can be represented by word sentences, equations, tables of values, graphs, or illustrated pictorially.
As a table of values, a function has a unique value assigned to the second variable for each value of the first variable. As a graph, a
function is any curve (including straight lines) such that any vertical line would pass through the curve only once (vertical line test).
Some relations are functions; all functions are relations.
x + 2
2 0
1 1
0 2
1 3
2 4
-9 -8 -7 -6 -5 -4 -3 -2 -1 1 2 3 4 5 6 7 8 9
-10
-9
-8
-7
-6
-5
-4
-3
-2
-1
1
2
3
4
5
6
7
8
9
10
x
y
54 Updated: 8-29-16
Curriculum Information
Resources
Sample Instructional Strategies and Activities
SOL Reporting Category
Probability, Statistics, Patterns,
Functions, and Algebra
Focus
Linear Equations
Virginia SOL 7.12
Foundational Objectives
6.17
The student will identify and extend
geometric and arithmetic sequences.
5.17
The student will describe the
relationship found in a number pattern
and express the relationship.
4.15
The student will recognize, create, and
extend numerical and geometric
patterns.
Text:
Mathematics Course 2 VA Grade 7,
©2012, Prentice Hall, Pearson
Education
VDOE Enhanced Scope and Sequence
Sample Lesson Plans
http://www.doe.virginia.gov/testing/sol/sco
pe_sequence/mathematics_2009/index.php
Mathematics SOL Resources
www.doe.virginia.gov/instruction/mathema
tics/index.shtml
A student can text 150 letters in one minute.
Create a table to illustrate this relationship.
Write a function rule to represent the relationship between the number of letters and the
time in which they are typed.
Use your rule to determine the number of letters typed in 15 minutes.
How long will it take the student to type 2,850 letters?