GP Cluster Level Comparators - AWMSG Cluster Level... · As the ultimate aim of the work,...
23
GP Cluster Level Comparators October 2014
Transcript of GP Cluster Level Comparators - AWMSG Cluster Level... · As the ultimate aim of the work,...

GP Cluster Level Comparators
October 2014

This report has been prepared by the Welsh Analytical Prescribing Support Unit (WAPSU), part of the All Wales Therapeutics and Toxicology Centre (AWTTC), with support from the All Wales Prescribing Advisory Group (AWPAG), and has subsequently been endorsed by the All Wales Medicines Strategy Group (AWMSG). Please direct any queries to AWTTC: All Wales Therapeutics and Toxicology Centre University Hospital Llandough Penlan Road Llandough Vale of Glamorgan CF64 2XX [email protected] 029 2071 6900 This document should be cited as: All Wales Medicines Strategy Group. GP Cluster Level Comparators. October 2014.

GP Cluster Level Comparators
Page 1 of 21
CONTENTS 1.0 INTRODUCTION ....................................................................................................... 2
2.0 OPTIMISING COMPARATORS ................................................................................ 3
2.1 Disease prevalence ............................................................................................... 3
2.2 Deprivation ............................................................................................................ 3
2.2.1 Index of Multiple Deprivation .......................................................................... 3
3.0 METHOD................................................................................................................... 4
3.1 Variable selection .................................................................................................. 4
3.2 Determining similarity of GP clusters .................................................................... 4
3.3 Grouping GP clusters ............................................................................................ 4
REFERENCES................................................................................................................ 5
APPENDIX 1: ANALYSIS OF GP CLUSTER LEVEL DATA FOR RESPIRATORY
PRESCRIBING ............................................................................................................... 6
Primary care cluster prescribing data: All respiratory products ................................... 6
APPENDIX 2: WELSH GP CLUSTERS WITH EIGHT MOST SIMILAR CLUSTERS ... 10
APPENDIX 3: DENDROGRAM OF GP CLUSTER GROUPING .................................. 21
All Wales Medicines Strategy Group
Page 2 of 21
1.0 INTRODUCTION This report outlines a proposed method for the development of cluster group comparators, based on socio-economic similarity and disease prevalence, to enable benchmarking of prescribing. The respiratory therapeutic area is used here to illustrate the method, due to the impact of respiratory illness on the population, the high cost of prescribing respiratory items, recent changes in the evidence base and the potential for prescribing review. Historically, patients or prescribing units (which account for patient population size, age and sex) have been used to present prescribing data. The overall aim of this work is to enable health boards and localities to benchmark their prescribing, taking into account additional variables such as disease prevalence and deprivation to add context to the data. There are limitations to the interpretation of prescribing data for therapeutic areas, as the model is not intended to explain variations in prescribing, and it should be recognised that a variety of other factors, both national and local, can influence prescribing behaviour. Particularly when interpreting respiratory data, it is important to account for outcomes such as admission and exacerbation rates. The report highlights:
The methodology of producing comparators for each GP cluster in Wales based on disease prevalence and socio-economic data, for the purposes of benchmarking prescribing with demographically similar areas;
Respiratory prescribing data for GP cluster groups in Wales presented in eight groups of the most similar clusters based on respiratory disease prevalence and deprivation. This is presented as an example, and will enable GP cluster groups and health boards to compare their prescribing rates with areas of a similar demographic profile, and may highlight where variations in prescribing are due to prescribing practice and not due to variations in disease prevalence and other demographic factors.
The next stages in this project will include:
A detailed respiratory prescribing report incorporating the GP cluster level comparators. The report will include prescribing data at national, health board and GP cluster level, presented in a way that allows GP clusters to benchmark against their most similar comparators in terms of disease prevalence and deprivation;
Production of sets of homogenous GP cluster comparators for other therapeutic areas, such as cardiovascular disease and diabetes;
As the ultimate aim of the work, production of GP cluster comparators for various therapeutic areas for the purpose of benchmarking on a platform such as a dashboard. It is intended that the dashboard will enable prescribing leads to use an interactive tool to look at their prescribing data, with an option to benchmark within a group of similar GP clusters based on disease prevalence and/or other socio-economic factors.
GP clusters are groups of 4–13 practices in a geographical area with patient numbers ranging from 20,000 to 100,000. The Public Health Wales Observatory produced a set of profiles in 2013 to support the development of GP clusters. GP clusters do not have specific geographical confines; however, the GP clusters work in partnership with other health and social care agencies who are confined to administrative or geographical boundaries such as health boards and local authorities1.

GP Cluster Level Comparators
Page 3 of 21
2.0 OPTIMISING COMPARATORS To make realistic comparisons of primary care prescribing between Wales and England, between the health boards and between the 64 established GP clusters in Wales, consideration of all confounding factors is essential. It would be useful for Wales as a whole, and for health boards and cluster groups within Wales, to have comparators, which are similar in terms of disease prevalence and socio-economic variables, in order to appropriately benchmark prescribing data and influence prescribing behaviour accordingly. The intention is to utilise this method of presenting prescribing data for a range of therapeutic areas, such as cardiovascular, endocrine and mental health, if it is considered useful. The method could also potentially be applied to Clinical Commissioning Groups (CCGs) in England in order to make comparisons between Welsh health boards and English CCGs. In this paper, overall respiratory prescribing for GP clusters is analysed and therefore relevant variables for comparators are respiratory disease prevalence and deprivation. Other considerations It may be appropriate to view comparators in the context of other differences in practice, especially when making comparisons with areas in England or other nations. These could include local initiatives, dispensing GP practices, procurement costs, prescription charge exemptions and differences between local guidelines and formularies. 2.1 Disease prevalence Disease prevalence varies across the health boards in Wales, and data on prevalence are available at GP cluster level from the GP Cluster Profiles 20131. The source of the data is Audit+ – a non-mandatory analysis tool for GP practices used by more than 95% of GP practices in Wales to submit data weekly. Audit+ provides a count of patients with the identified chronic condition by 10-year age groups and sex. Another possible source of disease prevalence data would be the Quality and Outcomes Framework (QOF), as chronic conditions are defined in the same way in both. QOF data is used primarily to monitor GP practice performance against a contract; secondary use of QOF data must be interpreted with caution1. 2.2 Deprivation The link between poor health and deprivation is well recognised and people in the most deprived areas have higher levels of mental illness, hearing and sight problems, and in particular chronic conditions such as respiratory disease, cardiovascular disease and arthritis2. In Wales, the majority of deprived areas are found in areas of Cardiff, Swansea and Newport, the Welsh valleys and areas of the North Wales coast3. While disease prevalence gives a straightforward measure of the proportion of the population with a condition, deprivation can have a more complex effect on prescribing levels through factors such as behavioural determinants, access to services and education4. 2.2.1 Index of Multiple Deprivation Deprivation is multi-dimensional and takes into account many factors, which include income, housing, employment, general health, education, access to services, community safety and physical environment. The four countries of the UK each have their own index of multiple deprivation (IMD), each with slightly different ways of weighting certain factors. However, around half of the weight of each IMD comes from employment and income; factors which are common to all four countries and are major drivers of deprivation. Therefore, it may be appropriate to use the countries’ IMDs for purposes of comparison if the differences in weightings are adjusted for5.
All Wales Medicines Strategy Group
Page 4 of 21
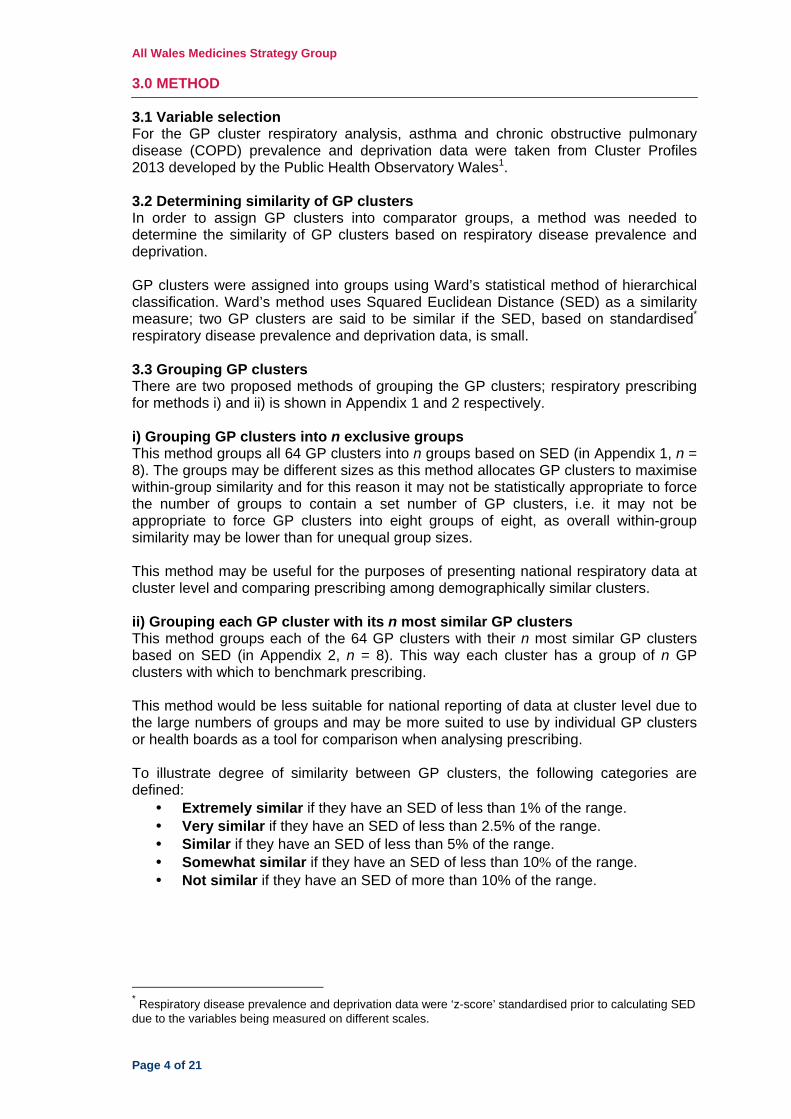
3.0 METHOD 3.1 Variable selection For the GP cluster respiratory analysis, asthma and chronic obstructive pulmonary disease (COPD) prevalence and deprivation data were taken from Cluster Profiles 2013 developed by the Public Health Observatory Wales1. 3.2 Determining similarity of GP clusters In order to assign GP clusters into comparator groups, a method was needed to determine the similarity of GP clusters based on respiratory disease prevalence and deprivation. GP clusters were assigned into groups using Ward’s statistical method of hierarchical classification. Ward’s method uses Squared Euclidean Distance (SED) as a similarity measure; two GP clusters are said to be similar if the SED, based on standardised* respiratory disease prevalence and deprivation data, is small. 3.3 Grouping GP clusters There are two proposed methods of grouping the GP clusters; respiratory prescribing for methods i) and ii) is shown in Appendix 1 and 2 respectively. i) Grouping GP clusters into n exclusive groups This method groups all 64 GP clusters into n groups based on SED (in Appendix 1, n = 8). The groups may be different sizes as this method allocates GP clusters to maximise within-group similarity and for this reason it may not be statistically appropriate to force the number of groups to contain a set number of GP clusters, i.e. it may not be appropriate to force GP clusters into eight groups of eight, as overall within-group similarity may be lower than for unequal group sizes. This method may be useful for the purposes of presenting national respiratory data at cluster level and comparing prescribing among demographically similar clusters. ii) Grouping each GP cluster with its n most similar GP clusters This method groups each of the 64 GP clusters with their n most similar GP clusters based on SED (in Appendix 2, n = 8). This way each cluster has a group of n GP clusters with which to benchmark prescribing. This method would be less suitable for national reporting of data at cluster level due to the large numbers of groups and may be more suited to use by individual GP clusters or health boards as a tool for comparison when analysing prescribing. To illustrate degree of similarity between GP clusters, the following categories are defined:
• Extremely similar if they have an SED of less than 1% of the range. • Very similar if they have an SED of less than 2.5% of the range. • Similar if they have an SED of less than 5% of the range. • Somewhat similar if they have an SED of less than 10% of the range. • Not similar if they have an SED of more than 10% of the range.
* Respiratory disease prevalence and deprivation data were ‘z-score’ standardised prior to calculating SED due to the variables being measured on different scales.

GP Cluster Level Comparators
Page 5 of 21
REFERENCES 1 NHS Wales. GP Cluster Profiles 2013. 2013. Available at:
http://www.wales.nhs.uk/sitesplus/922/page/67714. Accessed May 2014. 2 Public Health England. Health Profile 2010 - North East. 2014. Available at:
http://www.apho.org.uk/resource/item.aspx?RID=95362. Accessed May 2014. 3 Public Health Wales Observatory. Wales and its Local Health Boards:
Demography Profile. 2014. Available at: http://www.wales.nhs.uk/sitesplus/922/page/49931. Accessed May 2014.
4 National Public Health Service for Wales. Deprivation and Health. 2004. Available at: http://www2.nphs.wales.nhs.uk:8080/HIATDocs.nsf/public/2EAEBE01733430F8802576EA004BC063/$file/Deprivationreport10Dec04.pdf. Accessed Aug 2014.
5 Office for National Statistics. UK indices of multiple deprivation - a way to make comparisons across constituent countries easier. 2012. Available at: http://www.ons.gov.uk/ons/rel/hsq/health-statistics-quarterly/no--53--spring-2012/uk-indices-of-multiple-deprivation.html. Accessed Mar 2014.

All Wales Medicines Strategy Group
Page 6 of 21
APPENDIX 1: ANALYSIS OF GP CLUSTER LEVEL DATA FOR RESPIRATORY PRESCRIBING Appendix 1 shows the Welsh GP clusters assigned to eight groups based on their statistical similarity according to figures from the Welsh Index of Multiple Deprivation and asthma and COPD prevalence. Prescribing data can be presented nationally at cluster level, factoring in disease prevalence and deprivation variables to allow a GP cluster to benchmark within these groups. Other prescribing measures such as quantities or daily defined doses could be explored as a way of presenting the data in the most appropriate way and this may change depending on the specific area or products being analysed. The model can also be manipulated to look specifically at an area of prevalence e.g. COPD when looking at respiratory products used primarily in COPD treatment, although limitations of the prescribing data mean that specific products cannot be linked to an indication or diagnosis. Below is a proposed way of presenting respiratory prescribing data for GP cluster analysis in Wales. Each figure presents respiratory prescribing data for a group of clusters, allocated using the classification methodology described in Section 3.3 (i). Group assignment is represented visually in the dendrogram in Appendix 3. The graphs show prescribing of all respiratory product items per 1,000 prescribing units (PUs) for each group of demographically similar GP clusters for the period April 2013–March 2014. From the figures below it can be clearly seen that there is variation in prescribing within cluster groups, which is due to reasons other than disease prevalence and/or deprivation, and only local knowledge can help to interpret this. Presentation of prescribing data in this format should help to direct review of prescribing in specific areas. Primary care cluster prescribing data: All respiratory products (1 April 2013–31 March 2014)
Figure 1. Group 1: Respiratory items per 1,000 PUs
0
200
400
600
800
1,000
1,200
Item
s/1,
000
PUs

GP Cluster Level Comparators
Page 7 of 21
Figure 2. Group 2: Respiratory items per 1,000 PUs
Figure 3. Group 3: Respiratory items per 1,000 PUs
Figure 4. Group 4: Respiratory items per 1,000 PUs
0
200
400
600
800
1,000
1,200
1,400
1,600
Item
s/1,
000
PUs
0
200
400
600
800
1,000
1,200
1,400
1,600
Item
s/1,
000
PUs
0
200
400
600
800
1,000
1,200
1,400
1,600
1,800
2,000
Item
s/1,
000
PUs

All Wales Medicines Strategy Group
Page 8 of 21
Figure 5. Group 5: Respiratory items per 1,000 PUs
Figure 6. Group 6: Respiratory items per 1,000 PUs
Figure 7. Group 7: Respiratory items per 1,000 PUs
0
200
400
600
800
1,000
1,200
1,400
1,600
1,800
2,000
Item
s/1,
000
PUs
0
200
400
600
800
1,000
1,200
1,400
1,600
1,800
2,000
Item
s/1,
000
PUs
0
200
400
600
800
1,000
1,200
1,400
1,600
Item
s/1,
000
PUs

GP Cluster Level Comparators
Page 9 of 21
Figure 8. Group 8: Respiratory items per 1,000 PUs
0
200
400
600
800
1,000
1,200
1,400
Item
s/1,
000
PUs

All Wales Medicines Strategy Group
Page 10 of 21
APPENDIX 2: WELSH GP CLUSTERS WITH EIGHT MOST SIMILAR CLUSTERS Appendix 2 shows each of the Welsh GP clusters with the eight most similar clusters as determined by the SED based on the Welsh Index of Multiple Deprivation and asthma and COPD prevalence. The smaller the SED, the more similar the groups. This method of grouping GP clusters may be more useful for individual GP clusters or health boards to benchmark their prescribing. Presenting national data in this format may not be appropriate due to the need for 64 separate groups of eight clusters.
Anglesey Arfon Central & South Denbighshire Conwy East Conwy West Deeside, Hawarden &
Saltney
West & North Wrexham 0.285
Deeside, Hawarden & Saltney
0.040 Dwyfor 0.457 South Wrexham 0.272 South Pembrokeshire 0.333 Arfon 0.040
Amman/ Gwendraeth 0.658 South Wrexham 0.253 Conwy West 0.612 Wrexham Town 0.344 Mid Powys 0.349 South
Pembrokeshire 0.179
Upper Valleys 0.842 Newport Central 0.257 Mid Powys 0.640 Holywell & Flint 0.416 Wrexham Town 0.592 South Wrexham 0.229
Torfaen North 1.043 South Ceredigion 0.292 North Powys 1.151 Penderi 0.585 Central & South
Denbighshire 0.612 South Ceredigion 0.244
Neath 1.470 Bridgend East Network 0.334 South
Pembrokeshire 1.221 Torfaen North 0.680 South Powys 0.658 Wrexham Town 0.296
Bridgend West Network 1.651 South
Pembrokeshire 0.364 Meirionnydd 1.268 North Pembrokeshire 0.706 North Powys 0.713 Newport
Central 0.320
North Pembrokeshire 1.885 Wrexham Town 0.368 South Powys 1.324 North Taf Ely 0.753 Holywell & Flint 0.833 North Powys 0.380
Conwy East 1.892 North Powys 0.414 South Ceredigion 1.418 Newport East 0.849 South
Ceredigion 0.839 South Taf Ely 0.412
= Extremely similar (SED < 1% of range)
= Very similar (SED < 2.5% of range)
= Similar (SED < 5% of range)
= Somewhat similar (SED < 10% of range)
= Not similar (SED >10% of range)

GP Cluster Level Comparators
Page 11 of 21
Dwyfor Holywell & Flint
Meirionnydd Mold, Buckley & Caergwle North Denbighshire South Wrexham
Mid Powys 0.261 North Taf Ely 0.156 North Pembrokeshire 0.547 South Powys 0.705 North Cynon 2.063 Wrexham Town 0.038
North Powys 0.436 Wrexham Town 0.238 South Powys 0.617 Taf/Teifi/Tywi 0.761 South Cynon 2.814 Deeside, Hawarden & Saltney
0.229
Central & South Denbighshire 0.457 South
Wrexham 0.315 Conwy West 0.912 Bridgend East Network 0.917 Blaenau Gwent
East 3.448 Arfon 0.253
South Ceredigion 0.521 Conwy East 0.416 Mid Powys 1.103 North
Pembrokeshire 1.016 North Merthyr Tydfil 3.513 Conwy East 0.272
Monmouthshire North 0.683 Caerphilly
South 0.497 North Powys 1.173 North Powys 1.038 South Rhondda 3.738 Holywell & Flint 0.315
South Pembrokeshire 0.780 Newport West 0.620 Mold, Buckley
& Caergwle 1.232 Meirionnydd 1.232 Blaenau Gwent West 3.778 North Taf Ely 0.349
South Powys 0.859 Caerphilly East 0.790 West & North Wrexham 1.256 South
Ceredigion 1.375 South Merthyr Tydfil 4.099 North
Pembrokeshire 0.430
Conwy West 0.925 South Pembrokeshire 0.793 Central & South
Denbighshire 1.268 Monmouthshire North 1.389 Caerphilly
North 4.430 South Pembrokeshire 0.470
= Extremely similar (SED < 1% of range)
= Very similar (SED < 2.5% of range)
= Similar (SED < 5% of range)
= Somewhat similar (SED < 10% of range)
= Not similar (SED >10% of range)

All Wales Medicines Strategy Group
Page 12 of 21
West & North Wrexham Wrexham Town Mid Powys North Powys South Powys Amman/Gwendraeth
Anglesey 0.285 South Wrexham 0.038 North Powys 0.104 South Ceredigion 0.050 North Powys 0.138 Upper Valleys 0.036
North Pembrokeshire 1.035 Holywell & Flint 0.238 South
Ceredigion 0.166 Mid Powys 0.104 North Pembrokeshire 0.249 Anglesey 0.658
Meirionnydd 1.256 Deeside, Hawarden & Saltney
0.296 South Pembrokeshire 0.191 South Powys 0.138 Mid Powys 0.278 Neath 0.779
Torfaen North 1.623 North Pembrokeshire 0.337 Dwyfor 0.261 Monmouthshire
North 0.220 South Ceredigion 0.302 Bridgend West
Network 0.857
Conwy East 1.770 North Taf Ely 0.341 South Powys 0.278 South Pembrokeshire 0.308 Arfon 0.472 Afan 0.930
Amman/ Gwendraeth 1.800 Conwy East 0.344 Conwy West 0.349
Deeside, Hawarden & Saltney
0.380 South Pembrokeshire 0.485 Bridgend North
Network 0.997
Mold, Buckley & Caergwle 2.002 Arfon 0.368 Monmouthshire
North 0.482 Arfon 0.414 Deeside, Hawarden & Saltney
0.495 Torfaen North 1.071
South Powys 2.058 South Pembrokeshire 0.386
Deeside, Hawarden & Saltney
0.509 Dwyfor 0.436 Wrexham Town 0.577 CityHealth 1.222
= Extremely similar (SED < 1% of range)
= Very similar (SED < 2.5% of range)
= Similar (SED < 5% of range)
= Somewhat similar (SED < 10% of range)
= Not similar (SED >10% of range)

GP Cluster Level Comparators
Page 13 of 21
Llanelli North Ceredigion North Pembrokeshire South Ceredigion South Pembrokeshire Taf/Teifi/Tywi
Cardiff East 0.140 Western Vale 1.699 South Powys 0.249 North Powys 0.050 Deeside, Hawarden & Saltney
0.179 Eastern Vale 0.307
Newport West 0.163 South Taf Ely 1.805 Wrexham Town 0.337 Monmouthshire North 0.111 Mid Powys 0.191 Cardiff South
West 0.313
Newport East 0.224 BayHealth 1.881 South Wrexham 0.430 Mid Powys 0.166 South Ceredigion 0.234 Monmouthshire
North 0.475
Cwmtawe 0.752 Dwyfor 1.906 Meirionnydd 0.547 South Pembrokeshire 0.234 North Powys 0.308 Bridgend East
Network 0.504
Caerphilly East 0.765 Monmouthshire North 2.193 Arfon 0.650
Deeside, Hawarden & Saltney
0.244 Conwy West 0.333 Western Vale 0.592
North Taf Ely 0.802 Eastern Vale 2.253 North Powys 0.704 Arfon 0.292 Arfon 0.364 BayHealth 0.653
Penderi 0.870 Monmouthshire South 2.298 Conwy East 0.706 South Powys 0.302 Wrexham Town 0.386 Cardiff South
East 0.707
Caerphilly South 0.934 South
Ceredigion 2.582 Deeside, Hawarden & Saltney
0.716 South Taf Ely 0.321 Caerphilly South 0.468 Monmouthshire
South 0.738
= Extremely similar (SED < 1% of range)
= Very similar (SED < 2.5% of range)
= Similar (SED < 5% of range)
= Somewhat similar (SED < 10% of range)
= Not similar (SED >10% of range)

All Wales Medicines Strategy Group
Page 14 of 21
Afan BayHealth Bridgend East Network Bridgend North Network Bridgend West Network CityHealth
CityHealth 0.453 Monmouth-shire South 0.131 Arfon 0.334 Upper Valleys 0.670 Torfaen North 0.271 Bridgend West
Network 0.350
Upper Valleys 0.689 Eastern Vale 0.192 Cardiff South West 0.429 Afan 0.848 CityHealth 0.350 Afan 0.453
Bridgend North Network 0.848 Western Vale 0.235 Taf/Teifi/Tywi 0.504 Amman/
Gwendraeth 0.997 Cardiff West 0.507 Torfaen North 0.621
Amman/ Gwendraeth 0.930 Cardiff South
East 0.354 Cwmtawe 0.554 CityHealth 2.311 Cardiff North 0.766 Penderi 0.703
Bridgend West Network 1.078 South Taf Ely 0.355
Deeside, Hawarden & Saltney
0.602 Anglesey 2.415 Amman/ Gwendraeth 0.857 Blaenau Gwent
West 0.763
Blaenau Gwent West 1.240 Monmouth-
shire North 0.392 Newport Central 0.614 Bridgend West
Network 2.843 Torfaen South 0.920 Caerphilly North 0.966
Caerphilly North 1.618 Cardiff South West 0.595 South Powys 0.715 Blaenau Gwent
West 3.064 Upper Valleys 0.996 Upper Valleys 1.161
Torfaen North 1.629 Taf/Teifi/Tywi 0.653 South Wrexham 0.776 Neath 3.205 Afan 1.078 Amman/
Gwendraeth 1.222
= Extremely similar (SED < 1% of range)
= Very similar (SED < 2.5% of range)
= Similar (SED < 5% of range)
= Somewhat similar (SED < 10% of range)
= Not similar (SED >10% of range)

GP Cluster Level Comparators
Page 15 of 21
Cwmtawe Llwchwr Neath Penderi Upper Valleys Cardiff East
Newport Central 0.226 Neath 2.080 Amman/Gwendraeth 0.779 Newport East 0.327 Amman/Gwendraeth 0.036 Llanelli 0.140
Arfon 0.458 Torfaen South 3.235 Bridgend West Network 1.092 Blaenau
Gwent West 0.355 Bridgend North Network 0.670 Newport East 0.158
Cardiff East 0.543 Cardiff West 4.110 Upper Valleys 1.103 Caerphilly North 0.363 Afan 0.689 Newport
West 0.524
Bridgend East Network 0.554 Cardiff North 4.289 Anglesey 1.470 Conwy East 0.585 Anglesey 0.842 Cwmtawe 0.543
Deeside, Hawarden & Saltney
0.624 Bridgend East Network 4.774 Torfaen North 1.517 Newport West 0.682 Bridgend West
Network 0.996 Penderi 0.833
South Wrexham 0.662 Mold, Buckley
& Caergwle 4.781 Torfaen South 1.706 CityHealth 0.703 Neath 1.103 Cardiff North 0.886
Llanelli 0.752 Bridgend West Network 4.839 Cardiff West 1.789 Torfaen North 0.769 CityHealth 1.161 Cardiff West 0.954
Cardiff South West 0.857 Cardiff South
West 5.060 Llwchwr 2.080 Cardiff East 0.833 Torfaen North 1.269 Conwy East 0.958
= Extremely similar (SED < 1% of range)
= Very similar (SED < 2.5% of range)
= Similar (SED < 5% of range)
= Somewhat similar (SED < 10% of range)
= Not similar (SED >10% of range)

All Wales Medicines Strategy Group
Page 16 of 21
Cardiff South East City & Cardiff South Cardiff North Cardiff South West Cardiff West Central Vale
Monmouthshire South 0.080 Central Vale 2.467 Cardiff West 0.103 Taf/Teifi/Tywi 0.313 Cardiff North 0.103 City & Cardiff
South 2.467
BayHealth 0.354 North Ceredigion 3.854 Torfaen South 0.301 Bridgend East
Network 0.429 Torfaen South 0.125 Llanelli 4.471
Eastern Vale 0.363 Caerphilly East 4.167 Bridgend West Network 0.766 Cardiff South
East 0.531 Torfaen North 0.369 Newport West 4.752
Western Vale 0.499 Caerphilly South 4.414 Torfaen North 0.807 BayHealth 0.595 Bridgend West
Network 0.507 Caerphilly East 4.870
Cardiff South West 0.531 South Taf Ely 5.099 Cardiff East 0.886 Eastern Vale 0.650 Cardiff East 0.954 Caerphilly
South 5.371
Taf/Teifi/Tywi 0.707 North Taf Ely 5.688 Cwmtawe 1.061 Newport Central 0.655 Cwmtawe 1.009 Cardiff East 5.454
Monmouthshire North 1.192 Newport
Central 6.161 Newport East 1.180 Monmouthshire South 0.656 Conwy East 1.094 Newport East 5.877
South Taf Ely 1.370 South Pembrokeshire 6.237 CityHealth 1.556 Monmouthshire
North 0.841 Newport East 1.132 North Taf Ely 6.224
= Extremely similar (SED < 1% of range)
= Very similar (SED < 2.5% of range)
= Similar (SED < 5% of range)
= Somewhat similar (SED < 10% of range)
= Not similar (SED >10% of range)

GP Cluster Level Comparators
Page 17 of 21
Eastern Vale Western Vale North Cynon North Merthyr Tydfil North Rhondda North Taf Ely
Western Vale 0.052 Eastern Vale 0.052 South Merthyr Tydfil 0.615 Blaenau Gwent
East 0.031 North Merthyr Tydfil 0.768 Caerphilly
South 0.098
BayHealth 0.192 BayHealth 0.235 South Rhondda 0.770 North Rhondda 0.768 Blaenau
Gwent East 0.807 Holywell & Flint 0.156
Monmouthshire South 0.215 Monmouthshire
South 0.259 North Rhondda 0.907 North Cynon 0.937 North Cynon 0.907 Caerphilly East 0.256
Taf/Teifi/Tywi 0.307 Monmouthshire North 0.444 North Merthyr
Tydfil 0.937 South Cynon 1.614 South Merthyr Tydfil 1.130 Wrexham Town 0.341
Monmouthshire North 0.356 Cardiff South
East 0.499 Blaenau Gwent East 1.006 South
Rhondda 2.466 South Rhondda 1.198 South
Wrexham 0.349
Cardiff South East 0.363 Taf/Teifi/Tywi 0.592 Caerphilly
North 1.736 South Merthyr Tydfil 2.504 Caerphilly
North 3.081 South Pembrokeshire 0.521
Cardiff South West 0.650 South Taf Ely 0.795 Blaenau Gwent
West 1.856 North Denbighshire 3.513 Blaenau
Gwent West 3.742 Newport West 0.524
South Taf Ely 0.745 South Ceredigion 0.977 North
Denbighshire 2.063 Caerphilly North 4.931 South Cynon 3.896
Deeside, Hawarden & Saltney
0.537
= Extremely similar (SED < 1% of range)
= Very similar (SED < 2.5% of range)
= Similar (SED < 5% of range)
= Somewhat similar (SED < 10% of range)
= Not similar (SED >10% of range)

All Wales Medicines Strategy Group
Page 18 of 21
South Cynon South Merthyr Tydfil South Rhondda South Taf Ely Blaenau Gwent East Blaenau Gwent West
Blaenau Gwent East 1.317 South
Rhondda 0.349 South Merthyr Tydfil 0.349 Monmouthshire
North 0.239 North Merthyr Tydfil 0.031 Caerphilly
North 0.083
North Merthyr Tydfil 1.614 Caerphilly
North 0.562 Caerphilly North 0.669 South
Ceredigion 0.321 North Rhondda 0.807 Penderi 0.355
North Denbighshire 2.814 North Cynon 0.615 North Cynon 0.770 BayHealth 0.355 North Cynon 1.006 CityHealth 0.763
North Cynon 3.118 Blaenau Gwent West 0.865 Blaenau
Gwent West 0.961 Newport Central 0.356 South Cynon 1.317 South Merthyr
Tydfil 0.865
North Rhondda 3.896 North Rhondda 1.130 North Rhondda 1.198 Deeside, Hawarden & Saltney
0.412 South Rhondda 2.363 South Rhondda 0.961
South Rhondda 4.900 Penderi 1.202 Penderi 1.901 Arfon 0.485 South Merthyr Tydfil 2.610 Afan 1.240
South Merthyr Tydfil 6.096 Newport West 1.265 Blaenau
Gwent East 2.363 South Pembrokeshire 0.564 North
Denbighshire 3.448 Newport East 1.298
Blaenau Gwent West 8.227 Holywell &
Flint 1.742 North Merthyr Tydfil 2.466 North Powys 0.622 Caerphilly
North 4.951 Conwy East 1.355
= Extremely similar (SED < 1% of range)
= Very similar (SED < 2.5% of range)
= Similar (SED < 5% of range)
= Somewhat similar (SED < 10% of range)
= Not similar (SED >10% of range)

GP Cluster Level Comparators
Page 19 of 21
Caerphilly East Caerphilly North Caerphilly South Monmouthshire North Monmouthshire South Newport Central
Caerphilly South 0.072 Blaenau
Gwent West 0.083 Caerphilly East 0.072 South Ceredigion 0.111 Cardiff South
East 0.080 Cwmtawe 0.226
North Taf Ely 0.256 Penderi 0.363 North Taf Ely 0.098 North Powys 0.220 BayHealth 0.131 Arfon 0.257
Deeside, Hawarden & Saltney
0.468 South Merthyr Tydfil 0.562 South
Pembrokeshire 0.468 South Taf Ely 0.239 Eastern Vale 0.215 Deeside, Hawarden & Saltney
0.320
Newport Central 0.537 South
Rhondda 0.669 Holywell & Flint 0.497 Eastern Vale 0.356 Western Vale 0.259 South Taf Ely 0.356
South Pembrokeshire 0.595 CityHealth 0.966
Deeside, Hawarden & Saltney
0.518 BayHealth 0.392 Cardiff South West 0.656 Caerphilly East 0.537
Arfon 0.674 Newport East 1.107 South Wrexham 0.604 Western Vale 0.444 Taf/Teifi/Tywi 0.738 Bridgend East
Network 0.614
South Wrexham 0.677 Newport West 1.361 Wrexham Town 0.628 Taf/Teifi/Tywi 0.475 Monmouthshire
North 0.844 Cardiff South West 0.655
South Taf Ely 0.712 Conwy East 1.612 Newport West 0.753 Arfon 0.478 South Taf Ely 0.918 Monmouthshire North 0.704
= Extremely similar (SED < 1% of range)
= Very similar (SED < 2.5% of range)
= Similar (SED < 5% of range)
= Somewhat similar (SED < 10% of range)
= Not similar (SED >10% of range)

All Wales Medicines Strategy Group
Page 20 of 21
Newport East Newport West Torfaen North Torfaen South
Cardiff East 0.158 Llanelli 0.163 Bridgend West Network 0.271 Cardiff West 0.125
Llanelli 0.224 Newport East 0.367 Cardiff West 0.369 Cardiff North 0.301
Penderi 0.327 Cardiff East 0.524 Torfaen South 0.585 Torfaen North 0.585
Newport West 0.367 North Taf Ely 0.524 CityHealth 0.621 Bridgend East Network 0.871
Conwy East 0.849 Holywell & Flint 0.620 Conwy East 0.680 Cwmtawe 0.895
Caerphilly North 1.107 Penderi 0.682 Penderi 0.769 Bridgend West
Network 0.920
Cardiff West 1.132 Caerphilly South 0.753 Cardiff North 0.807 Conwy East 1.191
Cwmtawe 1.135 Caerphilly East 0.795 Anglesey 1.043 Cardiff East 1.358
= Extremely similar (SED < 1% of range)
= Very similar (SED < 2.5% of range)
= Similar (SED < 5% of range)
= Somewhat similar (SED < 10% of range)
= Not similar (SED >10% of range)

GP Cluster Level Comparators
Page 21 of 21
APPENDIX 3: DENDROGRAM OF GP CLUSTER GROUPING