GP Bullhound Market Update Tech Sector Offers Silver ... · GP Bullhound Market Update . Tech...
30
1 October 2011 GP Bullhound Market Update Tech Sector Offers Silver Lining to Eurozone Clouds Alessandro Casartelli [email protected] Office: +44 207 101 7594 Manish Madhvani [email protected] Office: +44 207 101 7567 Julien Oussadon [email protected] Office: +44 207 101 7587
Transcript of GP Bullhound Market Update Tech Sector Offers Silver ... · GP Bullhound Market Update . Tech...
1
October 2011 GP Bullhound Market Update Tech Sector Offers Silver Lining to Eurozone Clouds
Alessandro Casartelli [email protected] Office: +44 207 101 7594
Manish Madhvani [email protected] Office: +44 207 101 7567
Julien Oussadon [email protected] Office: +44 207 101 7587
2
TABLE OF CONTENTS
1 GENERAL ECONOMIC ENVIRONMENT
2 M&A AND IPO MARKET
3 DIGITAL MEDIA TRENDS
3
SLOW GDP RECOVERY AFTER THE FINANCIAL CRISIS
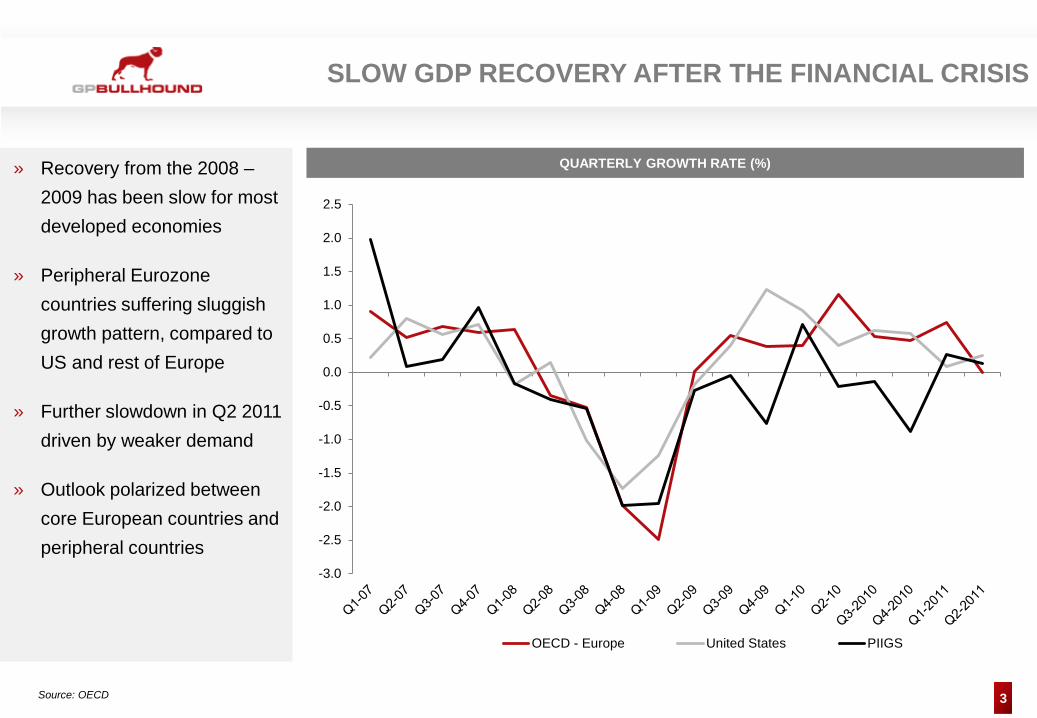
QUARTERLY GROWTH RATE (%)
Source: OECD
» Recovery from the 2008 – 2009 has been slow for most developed economies
» Peripheral Eurozone countries suffering sluggish growth pattern, compared to US and rest of Europe
» Further slowdown in Q2 2011 driven by weaker demand
» Outlook polarized between core European countries and peripheral countries
-3.0
-2.5
-2.0
-1.5
-1.0
-0.5
0.0
0.5
1.0
1.5
2.0
2.5
OECD - Europe United States PIIGS
4
EQUITY INDICES SUFFERED A BATTERING SINCE THIS SUMMER
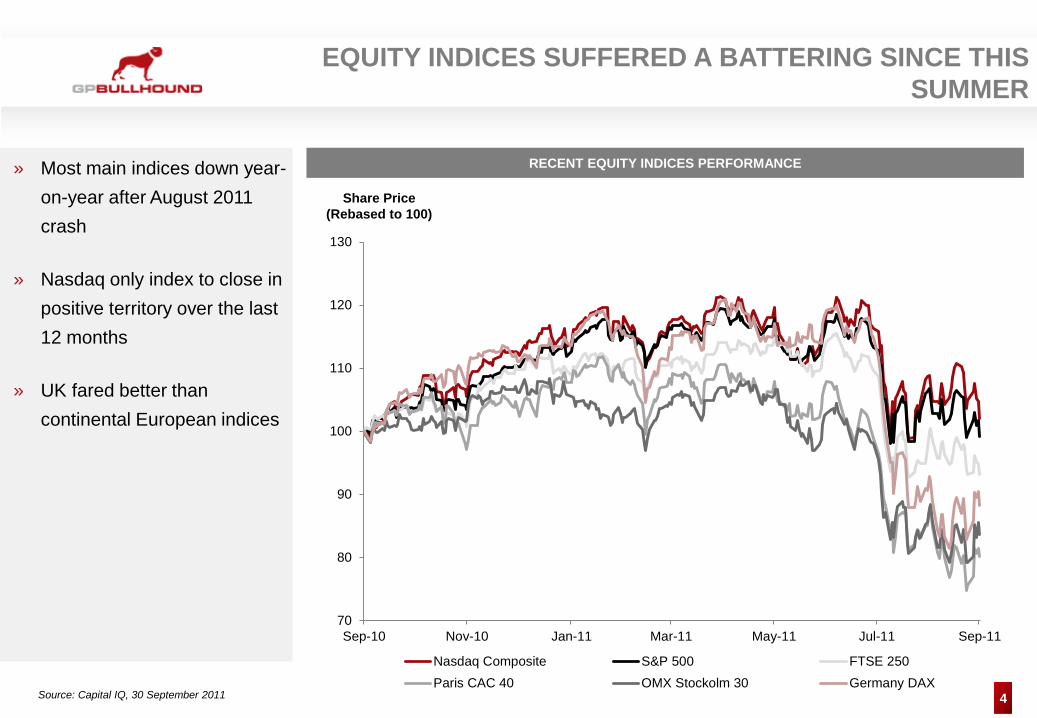
RECENT EQUITY INDICES PERFORMANCE
Source: Capital IQ, 30 September 2011
» Most main indices down year-on-year after August 2011 crash
» Nasdaq only index to close in positive territory over the last 12 months
» UK fared better than continental European indices
70
80
90
100
110
120
130
Sep-10 Nov-10 Jan-11 Mar-11 May-11 Jul-11 Sep-11
Nasdaq Composite S&P 500 FTSE 250Paris CAC 40 OMX Stockolm 30 Germany DAX
Share Price (Rebased to 100)
5
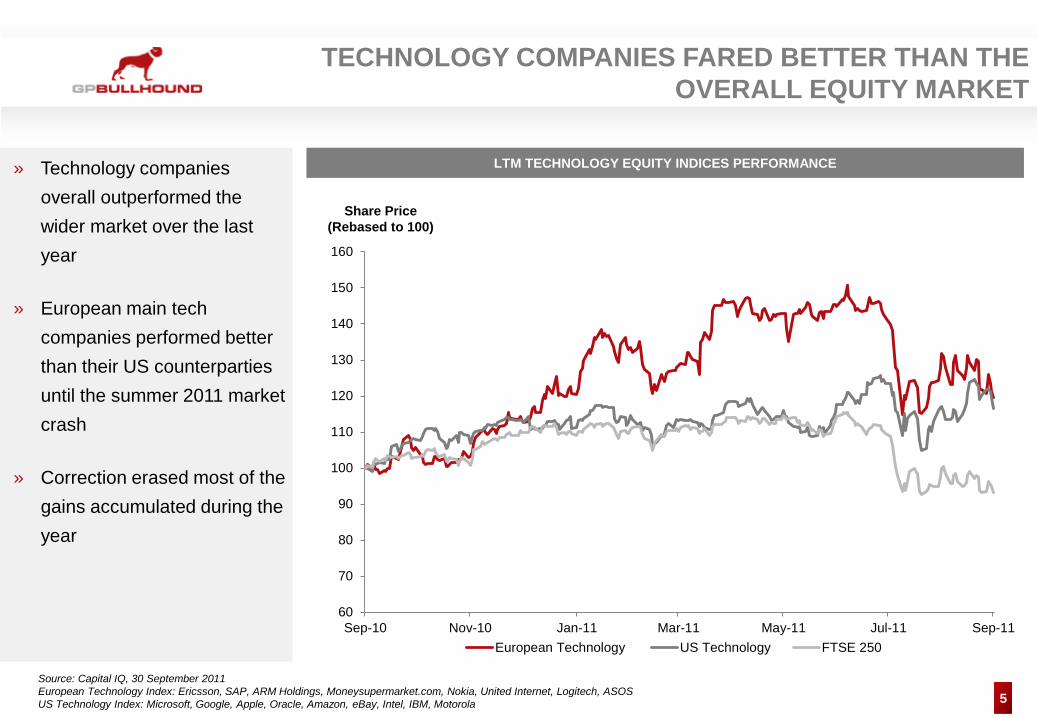
TECHNOLOGY COMPANIES FARED BETTER THAN THE OVERALL EQUITY MARKET
LTM TECHNOLOGY EQUITY INDICES PERFORMANCE
Source: Capital IQ, 30 September 2011 European Technology Index: Ericsson, SAP, ARM Holdings, Moneysupermarket.com, Nokia, United Internet, Logitech, ASOS US Technology Index: Microsoft, Google, Apple, Oracle, Amazon, eBay, Intel, IBM, Motorola
» Technology companies overall outperformed the wider market over the last year
» European main tech companies performed better than their US counterparties until the summer 2011 market crash
» Correction erased most of the gains accumulated during the year
60
70
80
90
100
110
120
130
140
150
160
Sep-10 Nov-10 Jan-11 Mar-11 May-11 Jul-11 Sep-11European Technology US Technology FTSE 250
Share Price (Rebased to 100)
6
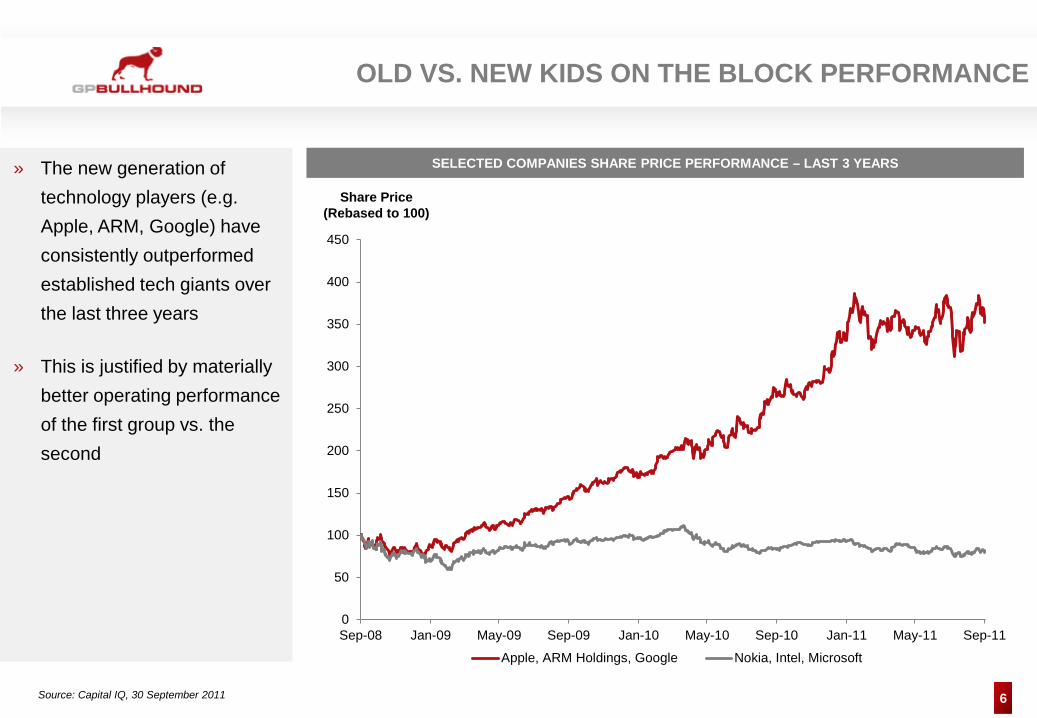
OLD VS. NEW KIDS ON THE BLOCK PERFORMANCE
SELECTED COMPANIES SHARE PRICE PERFORMANCE – LAST 3 YEARS
Source: Capital IQ, 30 September 2011
» The new generation of technology players (e.g. Apple, ARM, Google) have consistently outperformed established tech giants over the last three years
» This is justified by materially better operating performance of the first group vs. the second
0
50
100
150
200
250
300
350
400
450
Sep-08 Jan-09 May-09 Sep-09 Jan-10 May-10 Sep-10 Jan-11 May-11 Sep-11
Apple, ARM Holdings, Google Nokia, Intel, Microsoft
Share Price (Rebased to 100)
7
0.0x
2.0x
4.0x
6.0x
8.0x
10.0x
Q2 09 Q3 09 Q4 09 Q1 10 Q2 10 Q3 10 Q4 10 Q1 11 Q2 11 Q3 11
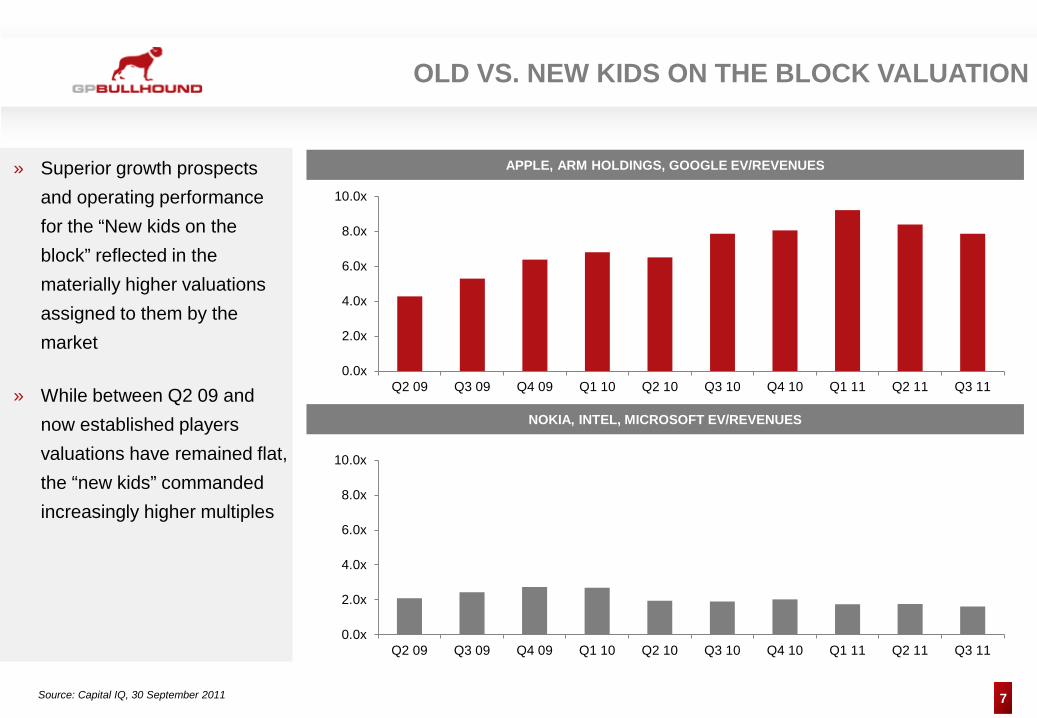
OLD VS. NEW KIDS ON THE BLOCK VALUATION
NOKIA, INTEL, MICROSOFT EV/REVENUES
Source: Capital IQ, 30 September 2011
APPLE, ARM HOLDINGS, GOOGLE EV/REVENUES
0.0x
2.0x
4.0x
6.0x
8.0x
10.0x
Q2 09 Q3 09 Q4 09 Q1 10 Q2 10 Q3 10 Q4 10 Q1 11 Q2 11 Q3 11
» Superior growth prospects and operating performance for the “New kids on the block” reflected in the materially higher valuations assigned to them by the market
» While between Q2 09 and now established players valuations have remained flat, the “new kids” commanded increasingly higher multiples
8
TABLE OF CONTENTS
1 GENERAL ECONOMIC ENVIRONMENT
2 M&A AND IPO MARKET
3 DIGITAL MEDIA TRENDS
9
$315m
$855m
$464m$230m
$358m
$1,137m $1,153m$913m
$2,207m
$665m
$322m$444m
$234m
$1,383m
$380m
$823m
$1,746m
$396m
$860m$641m
2007 2008 2009 2010 2011 YTD
23 212 39 293 36 197 27 264 48 150 26 200 33 172 47 218 30 173 34 194
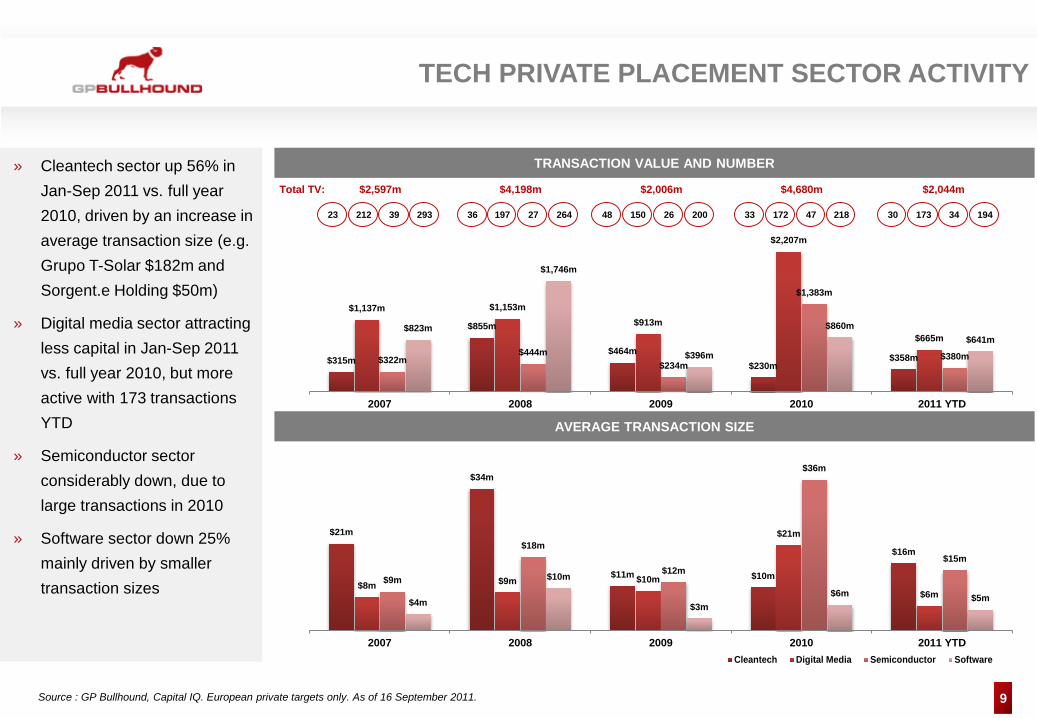
TECH PRIVATE PLACEMENT SECTOR ACTIVITY
TRANSACTION VALUE AND NUMBER
Source : GP Bullhound, Capital IQ. European private targets only. As of 16 September 2011.
» Cleantech sector up 56% in Jan-Sep 2011 vs. full year 2010, driven by an increase in average transaction size (e.g. Grupo T-Solar $182m and Sorgent.e Holding $50m)
» Digital media sector attracting less capital in Jan-Sep 2011 vs. full year 2010, but more active with 173 transactions YTD
» Semiconductor sector considerably down, due to large transactions in 2010
» Software sector down 25% mainly driven by smaller transaction sizes
AVERAGE TRANSACTION SIZE
Cleantech Digital Media Semiconductor Software
$21m
$34m
$11m $10m
$16m
$8m $9m $10m
$21m
$6m$9m
$18m
$12m
$36m
$15m
$4m
$10m
$3m$6m $5m
2007 2008 2009 2010 2011 YTD
$2,597m $4,198m $2,006m $4,680m $2,044m Total TV:
10
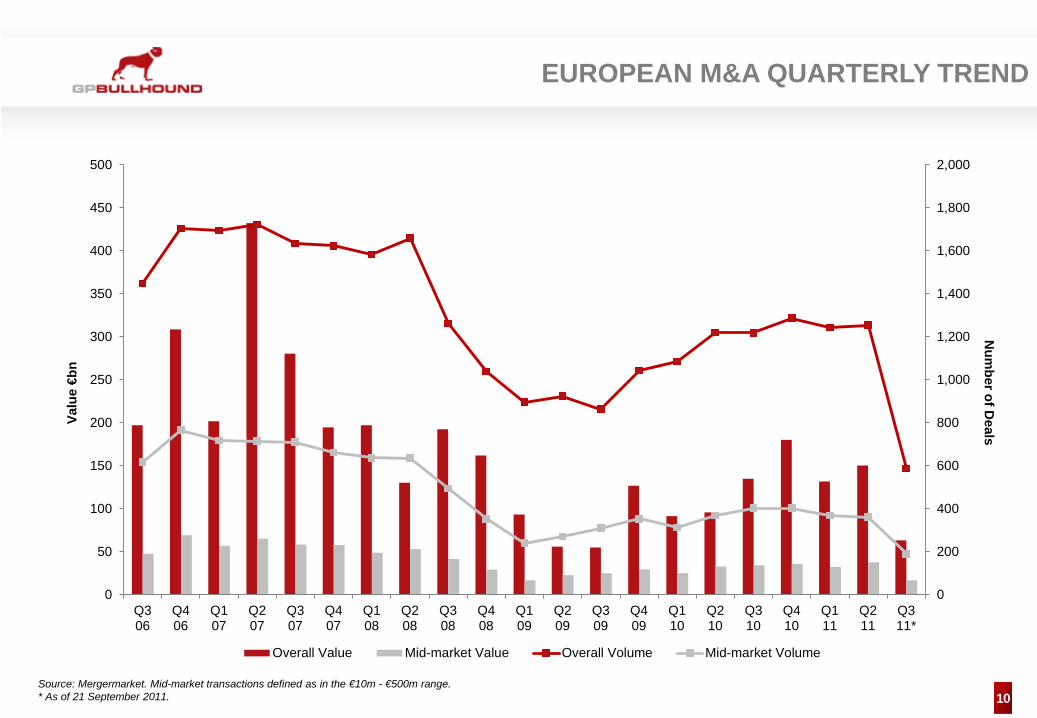
EUROPEAN M&A QUARTERLY TREND
Source: Mergermarket. Mid-market transactions defined as in the €10m - €500m range. * As of 21 September 2011.
0
200
400
600
800
1,000
1,200
1,400
1,600
1,800
2,000
0
50
100
150
200
250
300
350
400
450
500
Q306
Q406
Q107
Q207
Q307
Q407
Q108
Q208
Q308
Q408
Q109
Q209
Q309
Q409
Q110
Q210
Q310
Q410
Q111
Q211
Q311*
Overall Value Mid-market Value Overall Volume Mid-market Volume
Num
ber of Deals
Valu
e €b
n
11
$67m
$127m
$46m $51m
$206m
$67m
$103m
$135m
$45m$35m
$67m
$200m
$121m
$154m
$52m$37m
$78m$56m
$34m $41m
2007 2008 2009 2010 2011 YTD
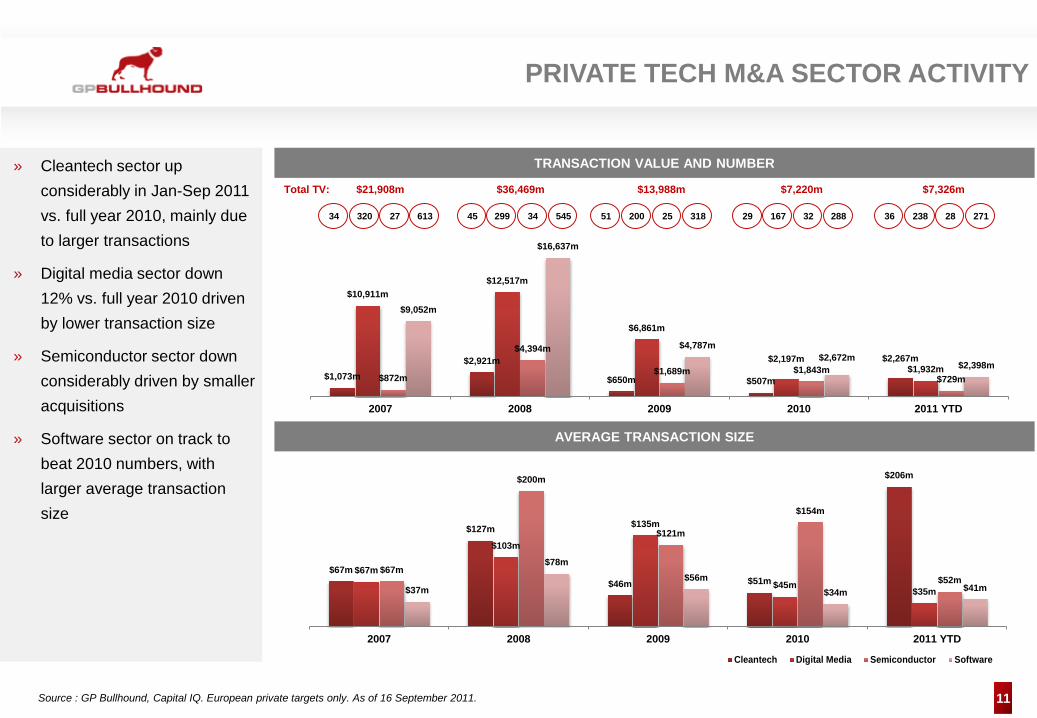
PRIVATE TECH M&A SECTOR ACTIVITY
» Cleantech sector up considerably in Jan-Sep 2011 vs. full year 2010, mainly due to larger transactions
» Digital media sector down 12% vs. full year 2010 driven by lower transaction size
» Semiconductor sector down considerably driven by smaller acquisitions
» Software sector on track to beat 2010 numbers, with larger average transaction size
Cleantech Digital Media Semiconductor Software
TRANSACTION VALUE AND NUMBER
AVERAGE TRANSACTION SIZE
Source : GP Bullhound, Capital IQ. European private targets only. As of 16 September 2011.
$21,908m $36,469m $13,988m $7,220m $7,326m Total TV:
$1,073m$2,921m
$650m $507m
$2,267m
$10,911m$12,517m
$6,861m
$2,197m$1,932m
$872m
$4,394m
$1,689m $1,843m$729m
$9,052m
$16,637m
$4,787m$2,672m
$2,398m
2007 2008 2009 2010 2011 YTD
34 320 27 613 45 299 34 545 51 200 25 318 29 167 32 288 36 238 28 271
12
Apple, $29 Dell, $731
Cisco, $534
EMC, $750 HP, $2,016
Google, $649
Intel, $1,461
IBM, $1,021 Microsoft, $918
Oracle, $2,156
Qualcomm, $144
0
10
20
30
40
50
60
70
80
0 2 4 6 8 10 12
Num
ber o
f Tra
nsac
tions
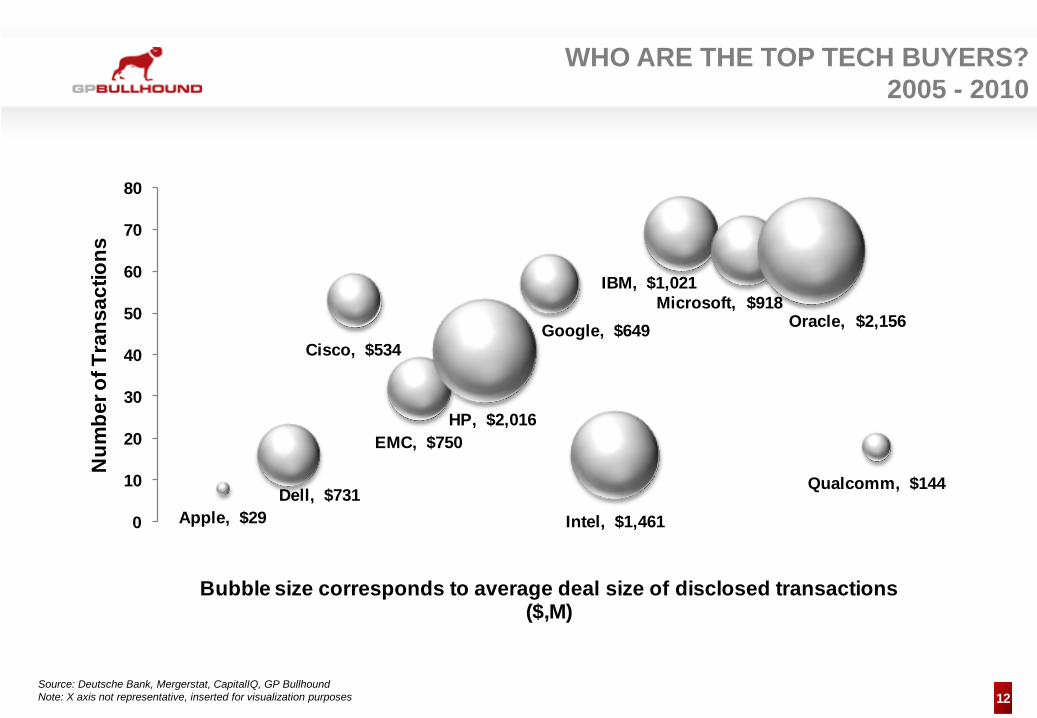
Bubble size corresponds to average deal size of disclosed transactions ($,M)
WHO ARE THE TOP TECH BUYERS? 2005 - 2010
Source: Deutsche Bank, Mergerstat, CapitalIQ, GP Bullhound Note: X axis not representative, inserted for visualization purposes
13
0
10,000
20,000
30,000
40,000
50,000
60,000Sep-11Sep-10Sep-09
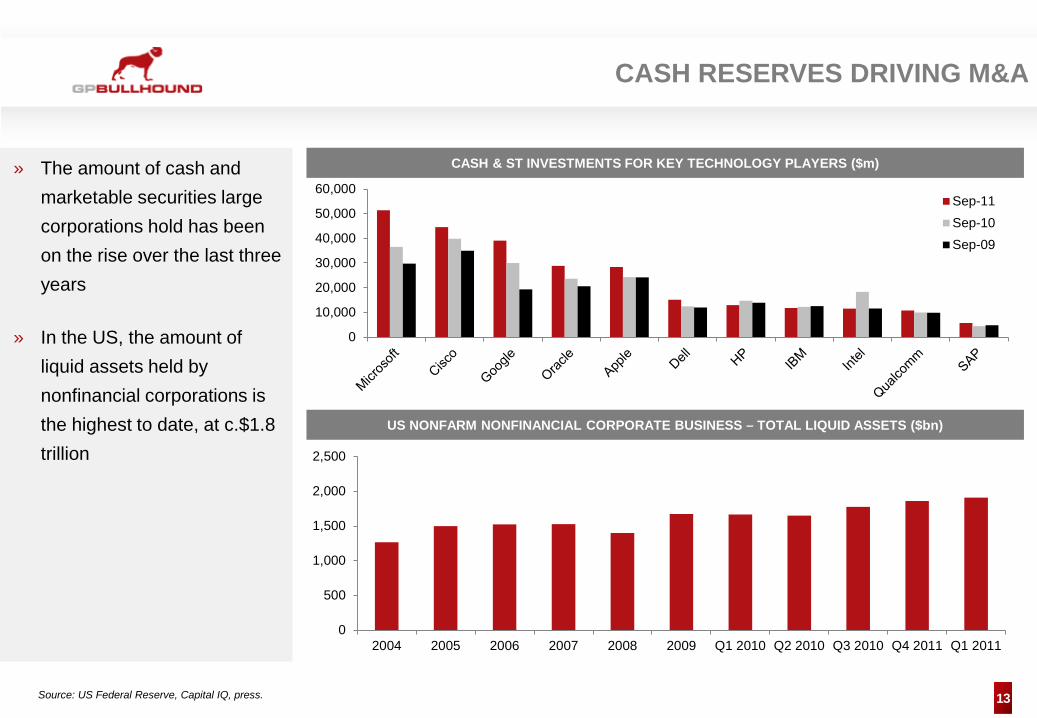
CASH RESERVES DRIVING M&A
CASH & ST INVESTMENTS FOR KEY TECHNOLOGY PLAYERS ($m)
Source: US Federal Reserve, Capital IQ, press.
US NONFARM NONFINANCIAL CORPORATE BUSINESS – TOTAL LIQUID ASSETS ($bn)
0
500
1,000
1,500
2,000
2,500
2004 2005 2006 2007 2008 2009 Q1 2010 Q2 2010 Q3 2010 Q4 2011 Q1 2011
» The amount of cash and marketable securities large corporations hold has been on the rise over the last three years
» In the US, the amount of liquid assets held by nonfinancial corporations is the highest to date, at c.$1.8 trillion
14
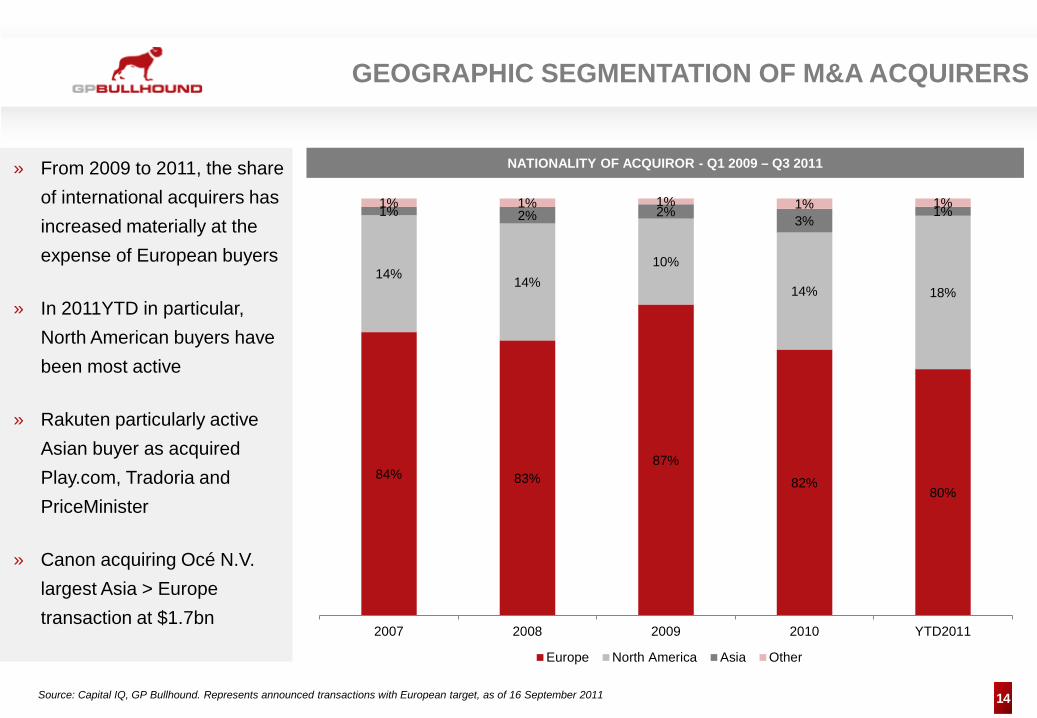
GEOGRAPHIC SEGMENTATION OF M&A ACQUIRERS
NATIONALITY OF ACQUIROR - Q1 2009 – Q3 2011
84% 83% 87%
82% 80%
14% 14% 10%
14% 18%
1% 2% 2% 3%
1% 1% 1% 1% 1% 1%
2007 2008 2009 2010 YTD2011
Europe North America Asia Other
Source: Capital IQ, GP Bullhound. Represents announced transactions with European target, as of 16 September 2011
» From 2009 to 2011, the share of international acquirers has increased materially at the expense of European buyers
» In 2011YTD in particular, North American buyers have been most active
» Rakuten particularly active Asian buyer as acquired Play.com, Tradoria and PriceMinister
» Canon acquiring Océ N.V. largest Asia > Europe transaction at $1.7bn
15
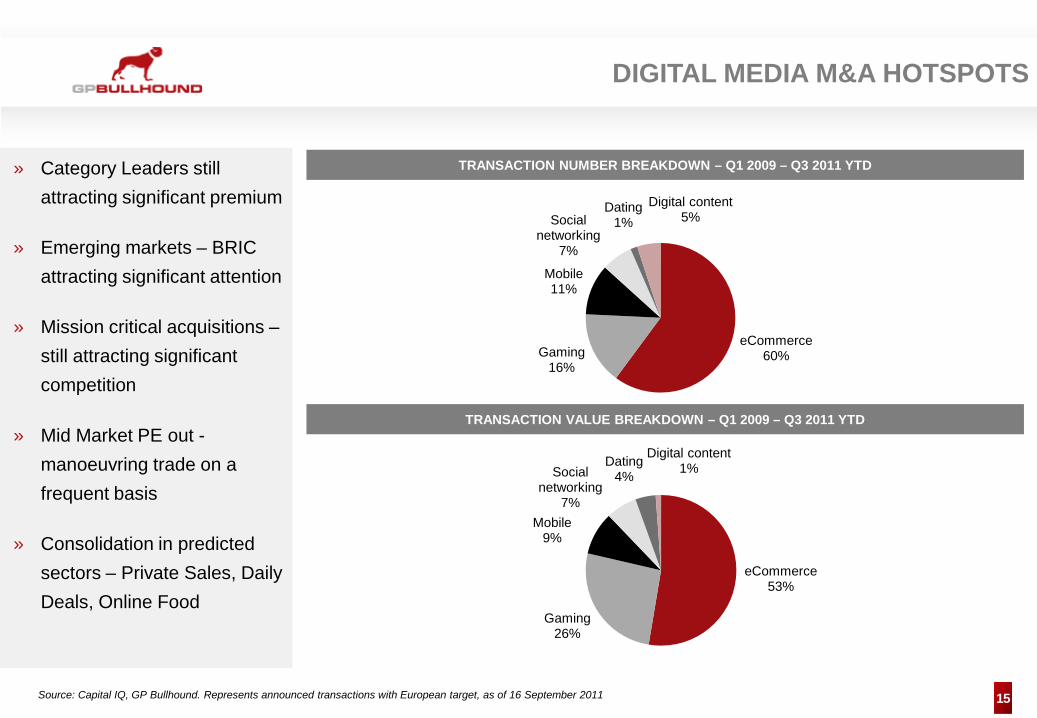
DIGITAL MEDIA M&A HOTSPOTS
TRANSACTION VALUE BREAKDOWN – Q1 2009 – Q3 2011 YTD
TRANSACTION NUMBER BREAKDOWN – Q1 2009 – Q3 2011 YTD
eCommerce 60% Gaming
16%
Mobile 11%
Social networking
7%
Dating 1%
Digital content 5%
eCommerce 53%
Gaming 26%
Mobile 9%
Social networking
7%
Dating 4%
Digital content 1%
Source: Capital IQ, GP Bullhound. Represents announced transactions with European target, as of 16 September 2011
» Category Leaders still attracting significant premium
» Emerging markets – BRIC attracting significant attention
» Mission critical acquisitions –still attracting significant competition
» Mid Market PE out -manoeuvring trade on a frequent basis
» Consolidation in predicted sectors – Private Sales, Daily Deals, Online Food
16
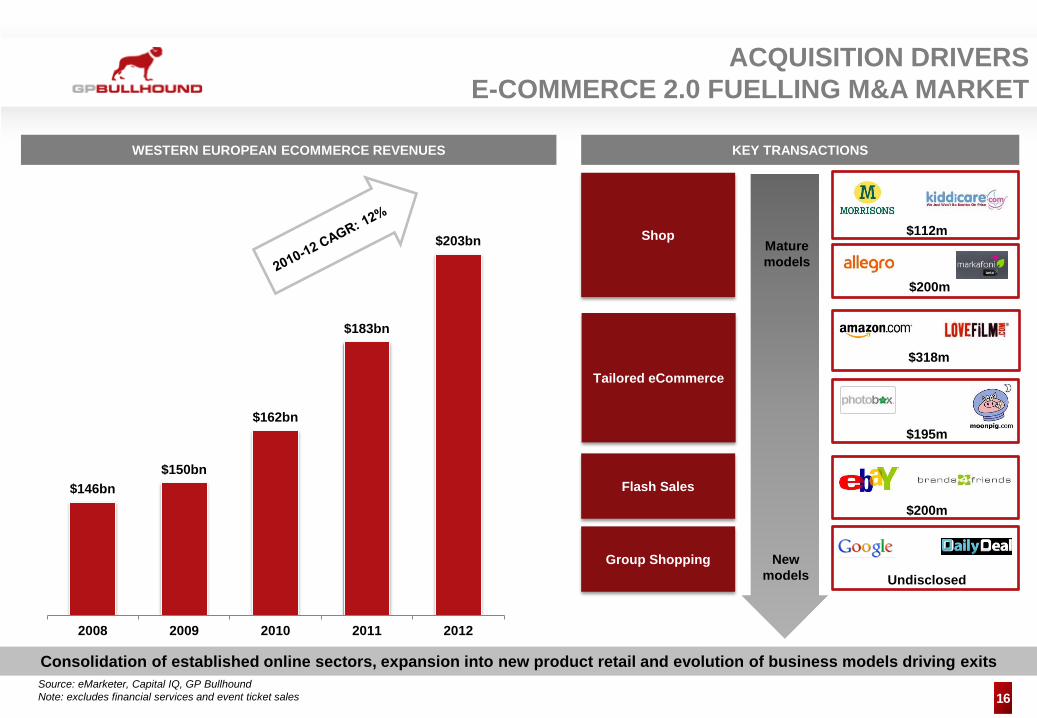
ACQUISITION DRIVERS E-COMMERCE 2.0 FUELLING M&A MARKET
$146bn $150bn
$162bn
$183bn
$203bn
2008 2009 2010 2011 2012
Consolidation of established online sectors, expansion into new product retail and evolution of business models driving exits
Flash Sales
New models
Mature models
Shop $112m
$200m
$318m
WESTERN EUROPEAN ECOMMERCE REVENUES
Source: eMarketer, Capital IQ, GP Bullhound Note: excludes financial services and event ticket sales
KEY TRANSACTIONS
Tailored eCommerce
$195m
$200m
Group Shopping Undisclosed
17
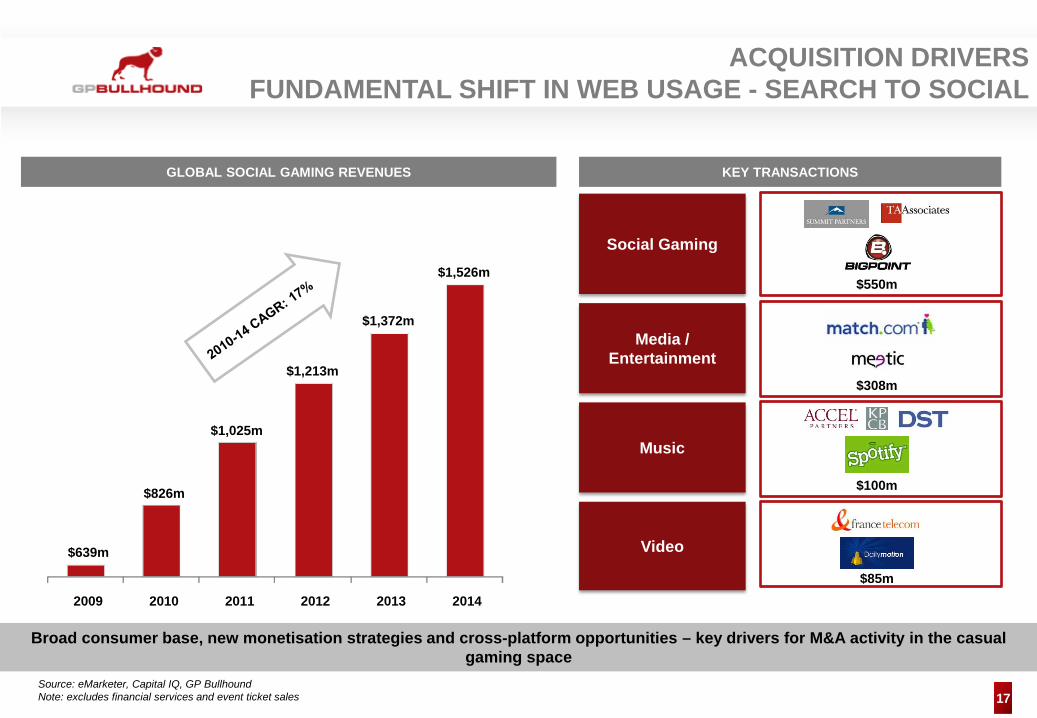
$639m
$826m
$1,025m
$1,213m
$1,372m
$1,526m
2009 2010 2011 2012 2013 2014
ACQUISITION DRIVERS FUNDAMENTAL SHIFT IN WEB USAGE - SEARCH TO SOCIAL
Media / Entertainment
Video
Social Gaming
$550m
Music
Source: eMarketer, Capital IQ, GP Bullhound Note: excludes financial services and event ticket sales
Broad consumer base, new monetisation strategies and cross-platform opportunities – key drivers for M&A activity in the casual gaming space
GLOBAL SOCIAL GAMING REVENUES KEY TRANSACTIONS
$308m
$100m
$85m
18
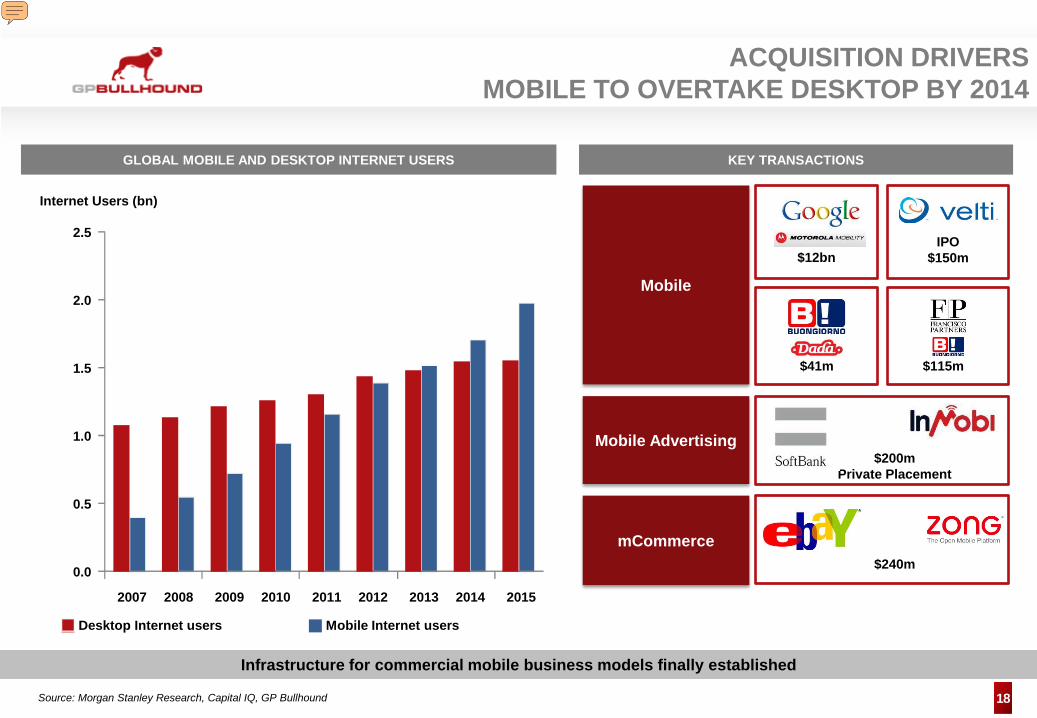
ACQUISITION DRIVERS MOBILE TO OVERTAKE DESKTOP BY 2014
mCommerce
Mobile
$240m
$41m $115m
$12bn
0.0
0.5
1.0
1.5
2.0
2.5
2007 2009 2011 2013 2015
Internet Users (bn)
Desktop Internet users Mobile Internet users
2008 2010 2012 2014
Source: Morgan Stanley Research, Capital IQ, GP Bullhound
Infrastructure for commercial mobile business models finally established
GLOBAL MOBILE AND DESKTOP INTERNET USERS KEY TRANSACTIONS
IPO $150m
Mobile Advertising $200m
Private Placement
Presenter
Presentation Notes
Future consolidation expected in mobile payments Landgrab / scale necessary to make model work mobile advertising (regional leaders will form – eg imimobile in Asia) Location based services – introduction of NFC
19 Source: Societe Generale, Capital IQ, GP Bullhound
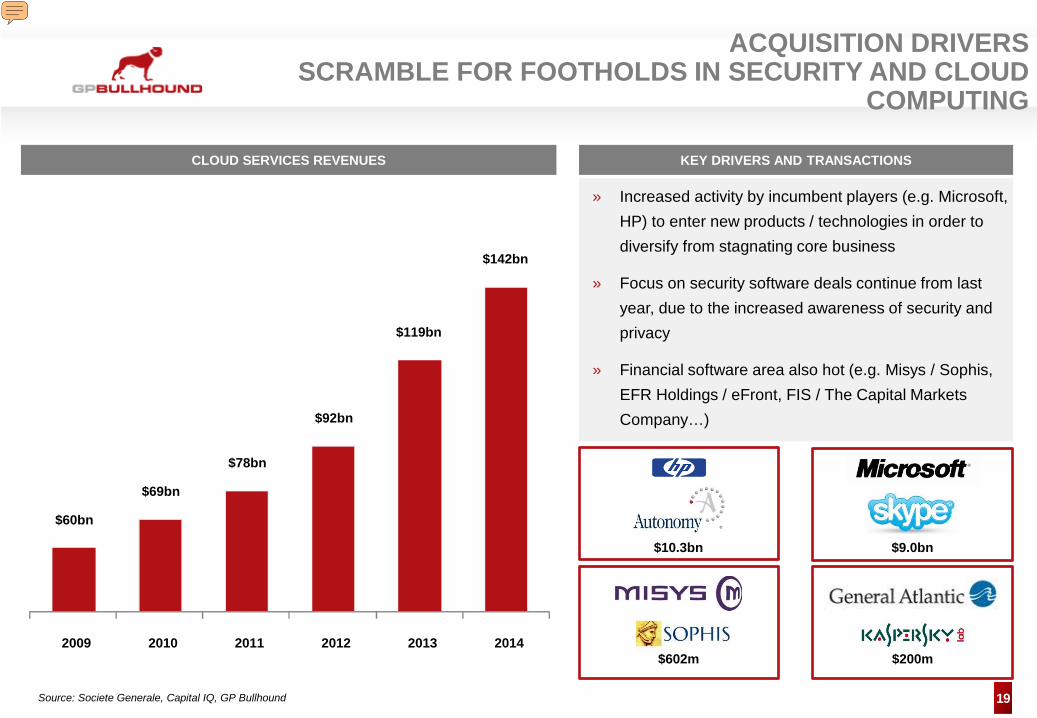
ACQUISITION DRIVERS SCRAMBLE FOR FOOTHOLDS IN SECURITY AND CLOUD
COMPUTING
$10.3bn
$602m $200m
» Increased activity by incumbent players (e.g. Microsoft, HP) to enter new products / technologies in order to diversify from stagnating core business
» Focus on security software deals continue from last year, due to the increased awareness of security and privacy
» Financial software area also hot (e.g. Misys / Sophis, EFR Holdings / eFront, FIS / The Capital Markets Company…)
CLOUD SERVICES REVENUES KEY DRIVERS AND TRANSACTIONS
$60bn
$69bn
$78bn
$92bn
$119bn
$142bn
2009 2010 2011 2012 2013 2014
$9.0bn
Presenter
Presentation Notes
SaaS attracting intense attention from PE players given efficient cash cycle and visibility on revenues
20 Source: Capital IQ, Company Information as of 30 September 2011
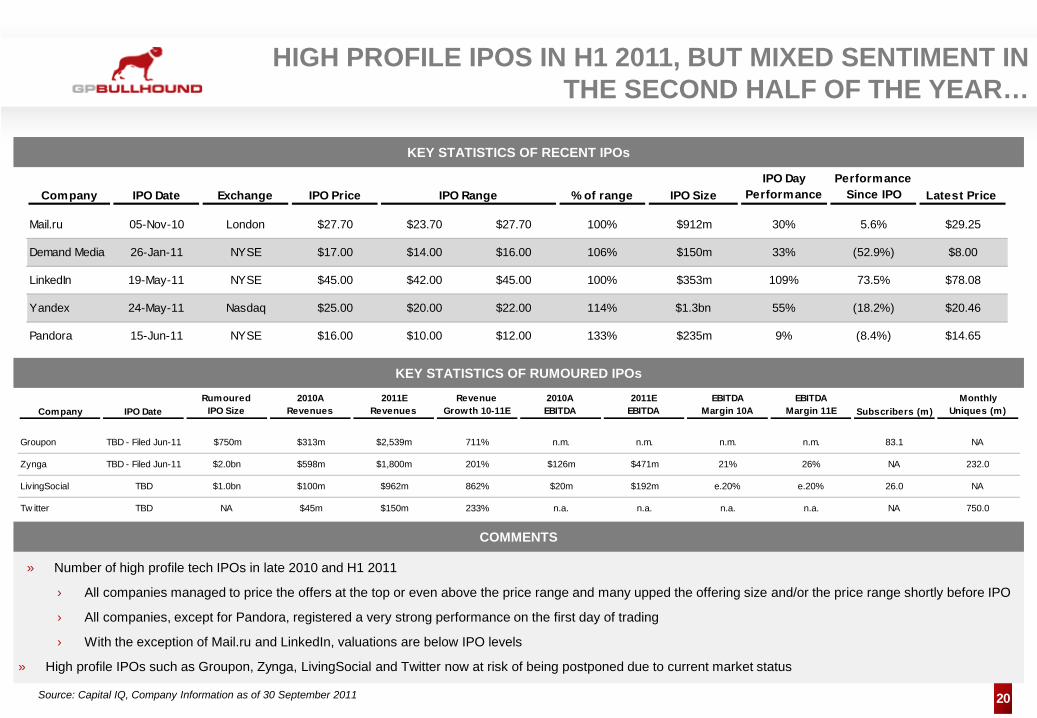
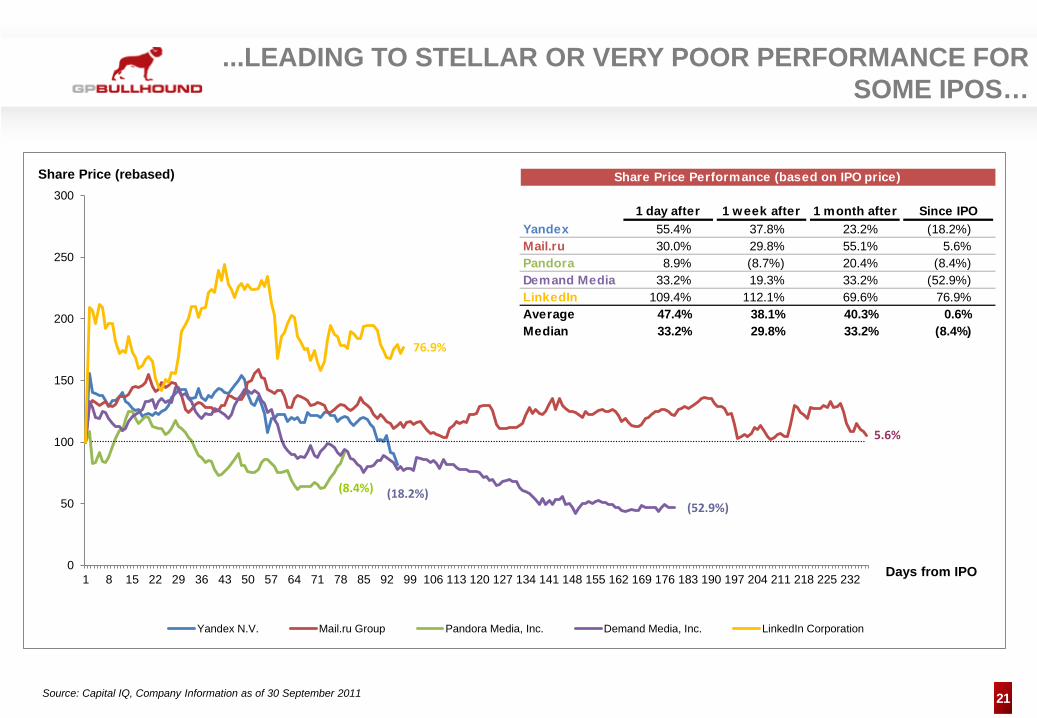
» Number of high profile tech IPOs in late 2010 and H1 2011
› All companies managed to price the offers at the top or even above the price range and many upped the offering size and/or the price range shortly before IPO
› All companies, except for Pandora, registered a very strong performance on the first day of trading
› With the exception of Mail.ru and LinkedIn, valuations are below IPO levels
» High profile IPOs such as Groupon, Zynga, LivingSocial and Twitter now at risk of being postponed due to current market status
KEY STATISTICS OF RECENT IPOs
HIGH PROFILE IPOS IN H1 2011, BUT MIXED SENTIMENT IN THE SECOND HALF OF THE YEAR…
COMMENTS
KEY STATISTICS OF RUMOURED IPOs
Company IPO Date Exchange IPO Price IPO Range % of range IPO SizeIPO Day
PerformancePerformance
Since IPO Latest Price
Mail.ru 05-Nov-10 London $27.70 $23.70 $27.70 100% $912m 30% 5.6% $29.25
Demand Media 26-Jan-11 NYSE $17.00 $14.00 $16.00 106% $150m 33% (52.9%) $8.00
LinkedIn 19-May-11 NYSE $45.00 $42.00 $45.00 100% $353m 109% 73.5% $78.08
Yandex 24-May-11 Nasdaq $25.00 $20.00 $22.00 114% $1.3bn 55% (18.2%) $20.46
Pandora 15-Jun-11 NYSE $16.00 $10.00 $12.00 133% $235m 9% (8.4%) $14.65
Company IPO DateRumoured
IPO Size2010A
Revenues 2011E
RevenuesRevenue
Growth 10-11E2010AEBITDA
2011EEBITDA
EBITDAMargin 10A
EBITDAMargin 11E Subscribers (m)
Monthly Uniques (m)
Groupon TBD - Filed Jun-11 $750m $313m $2,539m 711% n.m. n.m. n.m. n.m. 83.1 NA
Zynga TBD - Filed Jun-11 $2.0bn $598m $1,800m 201% $126m $471m 21% 26% NA 232.0
LivingSocial TBD $1.0bn $100m $962m 862% $20m $192m e.20% e.20% 26.0 NA
Tw itter TBD NA $45m $150m 233% n.a. n.a. n.a. n.a. NA 750.0
21
(18.2%)
5.6%
(8.4%)(52.9%)
76.9%
0
50
100
150
200
250
300
1 8 15 22 29 36 43 50 57 64 71 78 85 92 99 106 113 120 127 134 141 148 155 162 169 176 183 190 197 204 211 218 225 232
Yandex N.V. Mail.ru Group Pandora Media, Inc. Demand Media, Inc. LinkedIn Corporation
Days from IPO
Share Price (rebased)
...LEADING TO STELLAR OR VERY POOR PERFORMANCE FOR SOME IPOS…
Source: Capital IQ, Company Information as of 30 September 2011
Share Price Performance (based on IPO price)
0 1 day after 1 week after 1 month after Since IPOYandex 55.4% 37.8% 23.2% (18.2%)Mail.ru 30.0% 29.8% 55.1% 5.6%Pandora 8.9% (8.7%) 20.4% (8.4%)Demand Media 33.2% 19.3% 33.2% (52.9%)LinkedIn 109.4% 112.1% 69.6% 76.9%Average 47.4% 38.1% 40.3% 0.6%Median 33.2% 29.8% 33.2% (8.4%)
22
SO IN SUMMARY, IT COULD GO EITHER WAY

23
TABLE OF CONTENTS
1 GENERAL ECONOMIC ENVIRONMENT
2 M&A AND IPO MARKET
3 DIGITAL MEDIA TRENDS
24
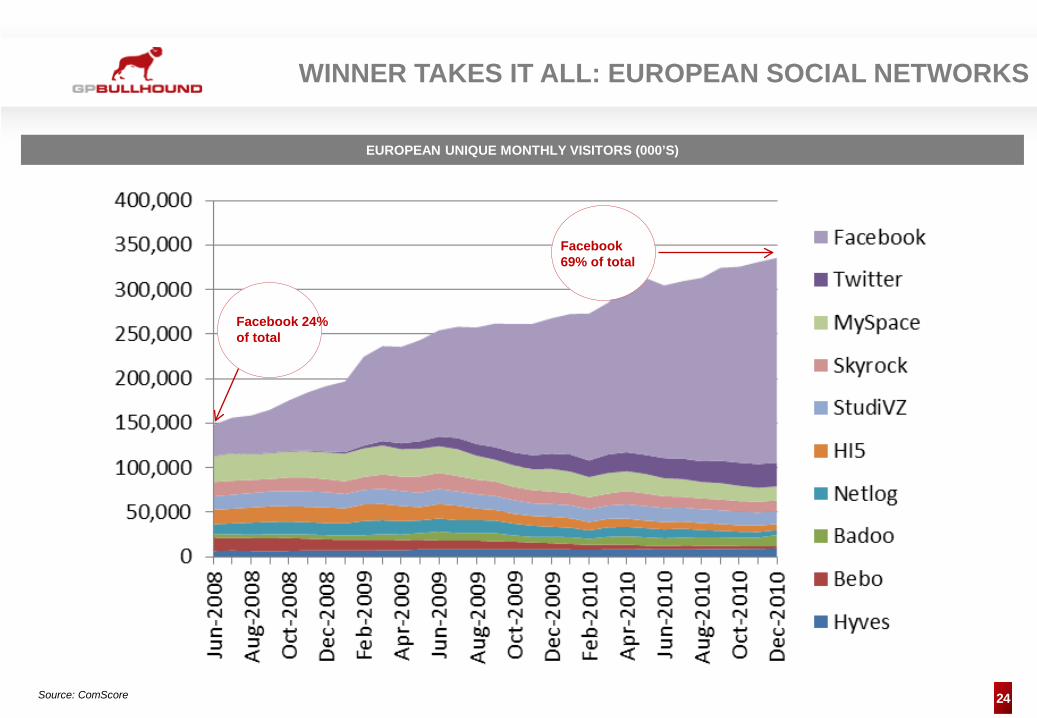
WINNER TAKES IT ALL: EUROPEAN SOCIAL NETWORKS
Source: ComScore
Facebook 24% of total
Facebook 69% of total
EUROPEAN UNIQUE MONTHLY VISITORS (000’S)
25
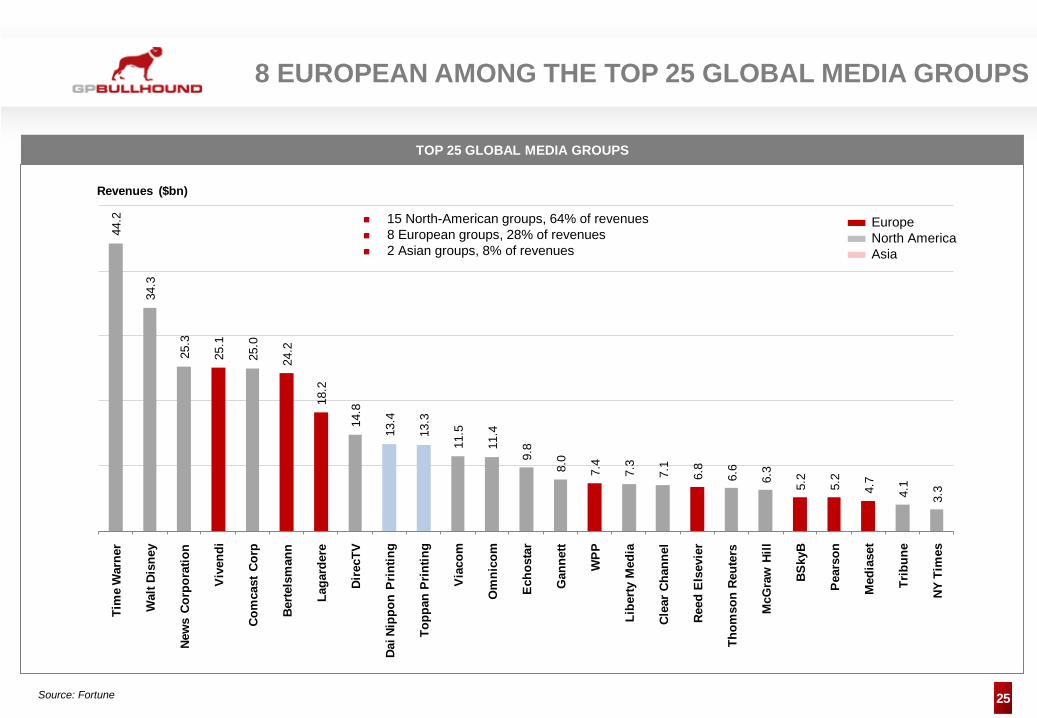
TOP 25 GLOBAL MEDIA GROUPS
8 EUROPEAN AMONG THE TOP 25 GLOBAL MEDIA GROUPS
Source: Fortune
44.2
34.3
25.3
25.1
25.0
24.2
18.2
14.8
13.4
13.3
11.5
11.4
9.8
8.0
7.4
7.3
7.1
6.8
6.6
6.3
5.2
5.2
4.7
4.1
3.3
Tim
e W
arne
r
Wal
t Dis
ney
New
s Co
rpor
atio
n
Vive
ndi
Com
cast
Cor
p
Berte
lsm
ann
Laga
rder
e
Dire
cTV
Dai N
ippo
n Pr
intin
g
Topp
an P
rintin
g
Viac
om
Om
nico
m
Echo
star
Gan
nett
WPP
Libe
rty M
edia
Clea
r Cha
nnel
Reed
Els
evie
r
Thom
son
Reut
ers
McG
raw
Hill
BSky
B
Pear
son
Med
iase
t
Trib
une
NY T
imes
Revenues ($bn)
Europe North America Asia
15 North-American groups, 64% of revenues 8 European groups, 28% of revenues 2 Asian groups, 8% of revenues
26
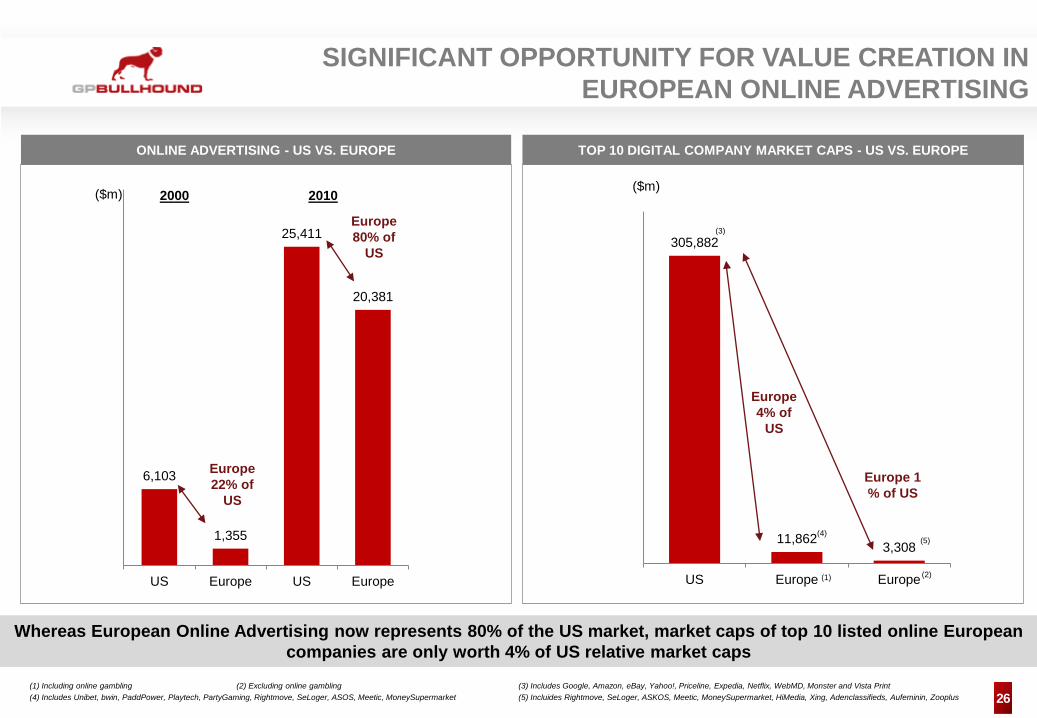
SIGNIFICANT OPPORTUNITY FOR VALUE CREATION IN EUROPEAN ONLINE ADVERTISING
TOP 10 DIGITAL COMPANY MARKET CAPS - US VS. EUROPE ONLINE ADVERTISING - US VS. EUROPE
(1) Including online gambling (2) Excluding online gambling (3) Includes Google, Amazon, eBay, Yahoo!, Priceline, Expedia, Netflix, WebMD, Monster and Vista Print (4) Includes Unibet, bwin, PaddPower, Playtech, PartyGaming, Rightmove, SeLoger, ASOS, Meetic, MoneySupermarket (5) Incluides Rightmove, SeLoger, ASKOS, Meetic, MoneySupermarket, HiMedia, Xing, Adenclassifieds, Aufeminin, Zooplus
6,103
1,355
25,411
20,381
US Europe US Europe
2000 2010 ($m)
Europe 22% of
US
Europe 80% of
US 305,882
11,862 3,308
US Europe Europe
Europe 4% of
US
Europe 1 % of US
($m)
(3)
(4) (5)
(1) (2)
Whereas European Online Advertising now represents 80% of the US market, market caps of top 10 listed online European companies are only worth 4% of US relative market caps
27
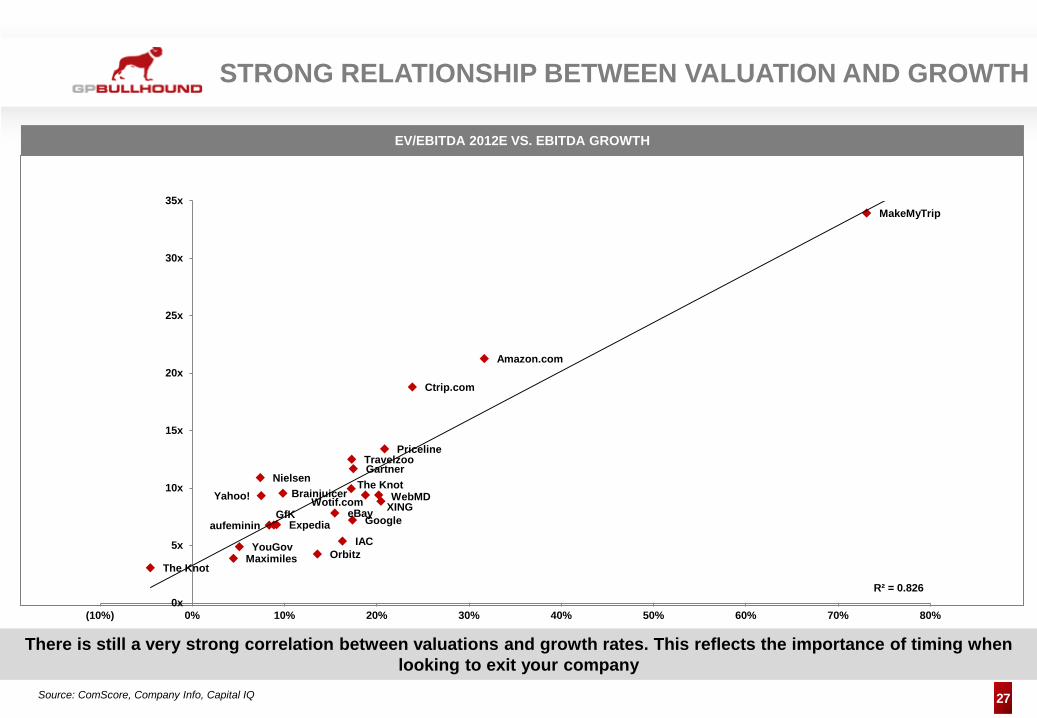
STRONG RELATIONSHIP BETWEEN VALUATION AND GROWTH
Source: ComScore, Company Info, Capital IQ
EV/EBITDA 2012E VS. EBITDA GROWTH
There is still a very strong correlation between valuations and growth rates. This reflects the importance of timing when looking to exit your company
aufemininXINGWebMD
The KnotMaximiles
The Knot
Expedia
Orbitz
PricelineTravelzoo
Ctrip.com
MakeMyTrip
Wotif.com
NielsenGartner
GfK
YouGov
Brainjuicer
Yahoo!
IAC
Amazon.com
eBay
R² = 0.8260x
5x
10x
15x
20x
25x
30x
35x
(10%) 0% 10% 20% 30% 40% 50% 60% 70% 80%
28
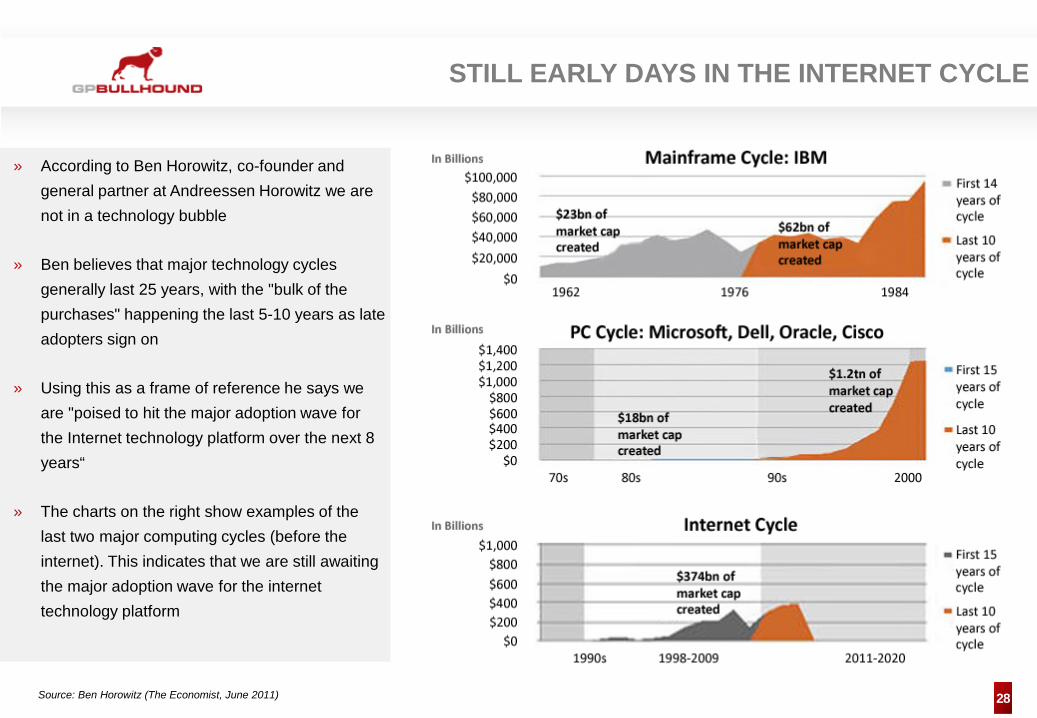
STILL EARLY DAYS IN THE INTERNET CYCLE
Source: Ben Horowitz (The Economist, June 2011)
» According to Ben Horowitz, co-founder and general partner at Andreessen Horowitz we are not in a technology bubble
» Ben believes that major technology cycles generally last 25 years, with the "bulk of the purchases" happening the last 5-10 years as late adopters sign on
» Using this as a frame of reference he says we are "poised to hit the major adoption wave for the Internet technology platform over the next 8 years“
» The charts on the right show examples of the last two major computing cycles (before the internet). This indicates that we are still awaiting the major adoption wave for the internet technology platform
29
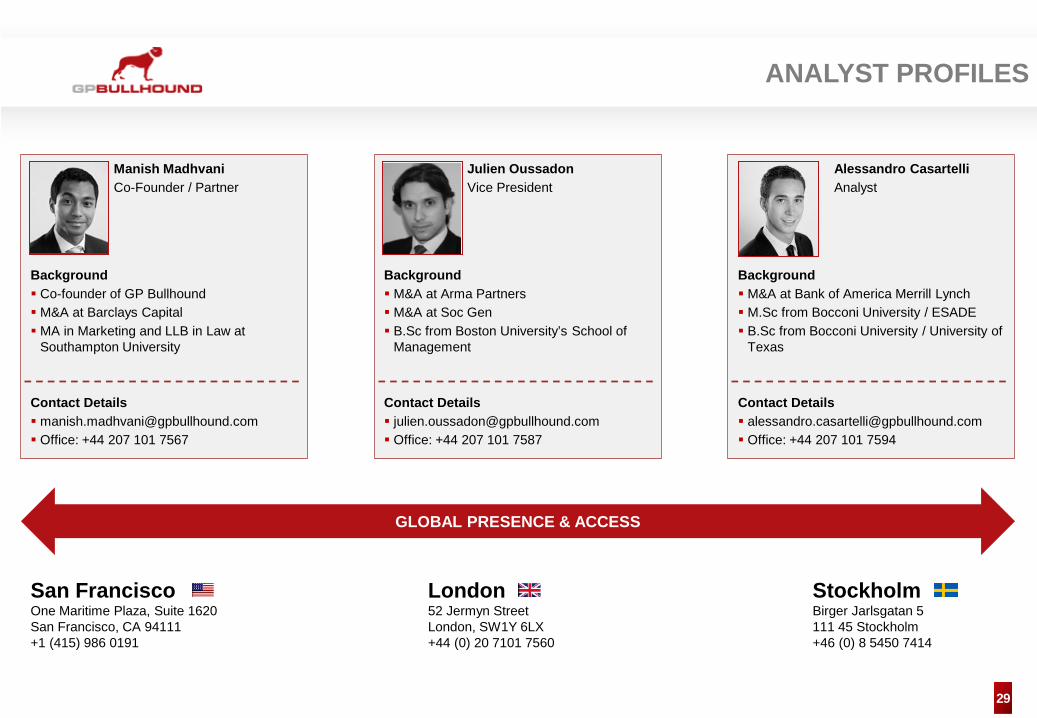
Stockholm Birger Jarlsgatan 5 111 45 Stockholm +46 (0) 8 5450 7414
San Francisco One Maritime Plaza, Suite 1620 San Francisco, CA 94111 +1 (415) 986 0191
ANALYST PROFILES
GLOBAL PRESENCE & ACCESS
Julien Oussadon Vice President
Contact Details [email protected] Office: +44 207 101 7587
Background M&A at Arma Partners M&A at Soc Gen B.Sc from Boston University’s School of
Management
Alessandro Casartelli Analyst
Contact Details [email protected] Office: +44 207 101 7594
Background M&A at Bank of America Merrill Lynch M.Sc from Bocconi University / ESADE B.Sc from Bocconi University / University of
Texas
Manish Madhvani Co-Founder / Partner
Contact Details [email protected] Office: +44 207 101 7567
Background Co-founder of GP Bullhound M&A at Barclays Capital MA in Marketing and LLB in Law at
Southampton University
London 52 Jermyn Street London, SW1Y 6LX +44 (0) 20 7101 7560

30
SAN FRANCISCO OFFICE ONE MARITIME PLAZA, SUITE 1620, SAN +1(415) 986 7480
FAX +1(415) 986 0180 MEMBER OF FINRAFRANCISCO, CA 94111
TEL
HQ: LONDON OFFICE 52 JERMYN STREET, LONDON SW1Y 6LX TEL +44(0)207 101 7560 FAX +44(0)207 101 7561 AUTHORISED AND REGULATED BY THE FSA
SAN FRANCISCO OFFICE ONE MARITIME PLAZA, SUITE 1620 SAN FRANCISCO, CA 94111 TEL +1(415) 986 0191 FAX +1(415) 986 0180 MEMBER OF FINRA
HQ: LONDON OFFICE 52 JERMYN STREET, LONDON SW1Y 6LX TEL +44(0)207 101 7560 FAX +44(0)207 101 7561 AUTHORISED AND REGULATED BY THE FSA
STOCKHOLM OFFICE BIRGER JARLSGATAN 5 111 45 STOCKHOLM, SWEDEN TEL +46(0)8 545 074 14 FAX: +46(0)8 545 071 01
Disclaimer: Information contained in the document does not constitute an offer to buy or sell or the solicitation of any offer to buy or sell any securities. This document is made available for general information purposes only and is intended for professional investors who have a high degree of financial sophistication and knowledge. This document and any of the products and information contained herein are not intended for the use of retail investors in the UK or any other territory. Although all reasonable care has been taken to ensure that the information contained in this document is accurate and current, no representation or warranty, express or implied, is made by GP Bullhound LLP as to its accuracy, completeness and currency. This report contains forward-looking statements, which involve risks and uncertainties. Actual results may differ significantly from the results described in the forward-looking statements. In particular, but without limiting the preceding sentences, you should be aware that statements of fact or opinion made, may not be up-to-date or may not represent the current opinion (whether public or confidential) of GP Bullhound LLP. In addition, opinions and estimates are subject to change without notice. This report does not constitute a specific investment recommendation or advice upon which you should rely based upon, or irrespective of, your personal circumstances. Use of this document is not a substitute for obtaining proper investment advice from an authorized investment professional. Potential retail investors are urged to consult their own authorized investment professional before entering into any investment agreement. Past performance of securities is not necessarily a guide to future performance and the value of securities may fall as well as rise. In particular, investments in the technology sector can involve a high degree of risk and investors may not get back the full amount invested. GP Bullhound LLP is authorised and regulated by the Financial Services Authority in the United Kingdom and is registered in England No. OC352636 Registered office: GP Bullhound LLP, 52 Jermyn Street, London, SW1Y 6LX http://www.gpbullhound.com, [email protected], +44 20 7101 7560


![[Master Class Programmatic Trading May 2014] Keynote by Simon Nicholls Partner at GP Bullhound](https://static.fdocuments.in/doc/165x107/558e21031a28ab93398b4673/master-class-programmatic-trading-may-2014-keynote-by-simon-nicholls-partner-at-gp-bullhound.jpg)