Gozo in Figures - NSO
117
Transcript of Gozo in Figures - NSO


Gozo in Figures
2014
National Statistics Office, Malta 2014
Published by the National Statistics Office
Lascaris Valletta Malta
Tel: (+356) 25 99 70 00 website: http://www.nso.gov.mt
CIP Data Gozo in Figures 2014. – Valletta: National Statistics Office, 2014. xiv, 101p. For further information and for acquisition of publications, please contact: Unit D2: External Cooperation and Communication Directorate D: Resources and Support Services National Statistics Office Lascaris Valletta Tel: (+356) 25 99 72 19 email: [email protected] Cover painting: Gozo seen from Comino by Rachel Galea Manuscript completed on 17 May 2014

Foreword Covering a land area of 67 square kilometres, Gozo is one of the smallest NUTS III regions in Europe in terms of population size. It has developed a distinct character and identity throughout the years, and this is also portrayed through official statistics, which go well beyond the statutory requirements of the European Commission regarding regions of a similar classification. This is amply demonstrated by the data presented in this compact publication. Gozo in Figures 2014 is in fact an enhancement on a similar publication launched two years ago. It is being published in a year when the National Statistics Office inaugurates a branch in Gozo to compile and widen the scope of regional statistics, under the auspices of the Malta Statistics Authority. This publication reflects the diversity of the Island, comparing facets of the Gozitan socio-economic fabric to the mainland. Statistical domains include the economy, demography, employment, business enterprises, private households, social protection, energy and water, waste, land and sea transport, culture, and rural characteristics. A section is dedicated to tourism, which is an important source of income for Gozo too. The NSO trusts that this publication will play a part in aiding policy makers and users to analyse strengths, weaknesses, opportunities and threats, so that Gozo can continue to register social and economic progress in comparison with the rest of the country. My appreciation goes to Mr Manuel Tabone for compiling this useful and interesting publication, to the technical units which provided the data, and to the desktop support staff. Michael Pace Ross Director General May 2014
iii

iv

About the Artist Rachel Galea was born in 1973 and has established herself as an evocative painter of Gozitan landscapes. She strongly captures the visual aspect of her sources of inspiration, transforming them into dashes of colour and expressionistic movement. Rachel applies loose, broad brushstrokes and overlapping layers of paint to render the flat surface of the canvas into bold, three-dimensional interpretations of her subjects. For Rachel, the combined use of vibrant palette and versatile brushstrokes becomes the link between matter and spirit.
Artist’s website: www.rachelgalea.com
v


CONTENTS Page Foreword iii
1. Demography
Table 1.1. Total population by region and age: 2012 3
Table 1.2. Live births by residence of parents 4
Table 1.3. Deaths by district/region 4
Chart 1.1. Live births, deaths and natural change: Malta 5
Chart 1.2. Live births, deaths and natural change: Gozo and Comino 5
Table 1.4. Number of marriages taking place in Malta and Gozo 6
Chart 1.3. Registered marriages 6 2. Household Characteristics
Table 2.1. Distribution of households by district/region 9
Chart 2.1. Distribution of households: 2012 9
Table 2.2. Distribution of households by size and district/region 10
Chart 2.2. Distribution of households by size: 2008 and 2012 11
Table 2.3. Distribution of persons living in households by district/region 11
Table 2.4. Distribution of household disposable income by district/region 12

Page 2. Household Characteristics cont/d
Chart 2.3. At-risk-of-poverty rates by district/region and sex: 2012 13
Chart 2.4. At-risk-of-poverty rates by region 13 3. The Economy
Table 3.1. Gross Value Added (GVA) at basic prices 18
Table 3.2. Contribution of regional GVA to total GVA 20
Chart 3.1. Composition of GVA at basic prices by economic activity: Malta 22
Chart 3.2. Composition of GVA at basic prices by economic activity: Gozo and Comino 22
Table 3.3. Gross Domestic Product (GDP) at market prices 23
Chart 3.3. GDP at market prices 23 4. Employment
Table 4.1. Employed persons by sex and region of residence 27
Table 4.2. Self-employed persons by district/region of residence 28
Table 4.3. Employees by sex and region of residence 29
Chart 4.1. Employees Index by sex and region of residence 29
Table 4.4. Unemployed persons by district/region of residence 30
Table 4.5. Full-time gainfully occupied population by region and sector 31
Table 4.6. Full-time gainfully occupied population by region and professional status 31

Page 4. Employment cont/d
Chart 4.2. Full-time gainfully occupied population by sector and professional status: Malta 32
Chart 4.3. Full-time gainfully occupied population by sector and professional status: Gozo and Comino 32
Table 4.7. Sectoral gainfully occupied population by region and sex 33
Table 4.8. Full-time gainfully occupied population by region, professional status and sex 34
Table 4.9. Part-time gainfully occupied population by region, job type and sex 34
Table 4.10. Part-time gainfully occupied population by region and job type 35 5. Business Demographics
Table 5.1. Structure of units by region and type of legal organisation 39
Table 5.2. Structure of units by region and employment size 39
Table 5.3. Births of business units by region 40
Table 5.4. Deaths of business units by region 40 6. Tourism
Table 6.1. Net use of bed-places by resident and non-resident tourists classified by type of accommodation: MALTA 43
Table 6.2. Net use of bed-places by resident and non-resident tourists classified by type of accommodation: Malta 43
Table 6.3. Net use of bed-places by resident and non-resident tourists classified by type of accommodation: Gozo and Comino 44

Page
6. Tourism cont/d
Table 6.4. Average length of stay: MALTA 44
Table 6.5. Average length of stay: Malta 45
Table 6.6. Average length of stay: Gozo and Comino 45
Table 6.7. Arrivals of resident tourists 46
Table 6.8. Arrivals of non-resident tourists 47
Table 6.9. Total tourist arrivals 48
Table 6.10. Nights spent by resident tourists 49
Table 6.11. Nights spent by non-resident tourists 50
Table 6.12. Total tourist nights 51
Chart 6.1. Net use of bed-places in collective accommodation establishments by region 52
Chart 6.2. Average length of stay in Malta: 2013 53
Chart 6.3. Average length of stay in Gozo and Comino: 2013 53
Table 6.13. Cruise liner calls: Gozo and Comino 54
7. Land and Sea Transport
Table 7.1. Road traffic accidents by district/region 57
Table 7.2. Road traffic casualties by district/region 57
Table 7.3. Injuries sustained by drivers in road traffic accidents by district/region 58

Page 7. Land and Sea Transport cont/d
Table 7.4. Injuries sustained by passengers in road traffic accidents by district/region 58
Table 7.5. Injuries sustained by pedestrians in road traffic accidents by district/region 59
Table 7.6. Total injuries sustained in road traffic accidents by district/region and type of injury 59
Table 7.7. Sea transport between Malta and Gozo operated by Gozo Channel 60
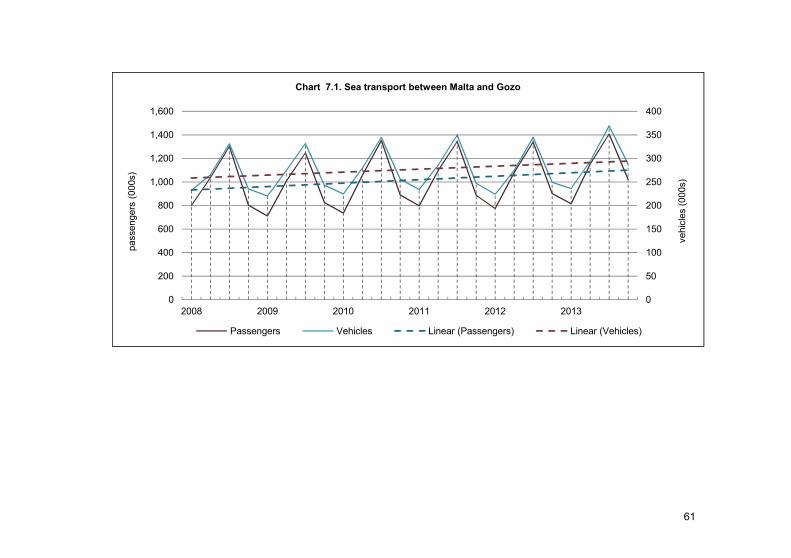
Chart 7.1. Sea transport between Malta and Gozo 61
Table 7.8. Yacht marinas/mooring areas in Malta and Gozo: 2013 62
Table 7.9. Stock of licensed vehicles as at end of year by vehicle group and district/region: 2013 63 8. Water and Waste
Table 8.1. Water production and consumption in Malta 67
Table 8.2. Water production and consumption in Gozo 68
Table 8.3. Water production and consumption in Malta and Gozo 69
Chart 8.1. Water production in Malta and Gozo 70
Chart 8.2. Water consumption in Malta and Gozo 70
Table 8.4. Waste disposed of at the public waste deposit sites 71
Chart 8.3. Waste collected from bring-in sites 72
Table 8.5. Separate waste collected at Civic Amenity sites 72
Page
9. Rural and Urban
Table 9.1. Urban statistics 75
Table 9.2. Land cultivation 75
Table 9.3. Distribution of arable land by type and region: 2013 76
Chart 9.1. Distribution of arable land: 2013 76
Table 9.4. Distribution of permanent crops by type and region: 2013 77
Table 9.5. Annual volume and wholesale value of fruit and vegetables sold through official markets 78
Table 9.6. Livestock in numbers 79
Table 9.7. Livestock farms 80
Chart 9.2. Percentage distribution of livestock 81
Chart 9.3. Percentage distribution of livestock farms 81
Table 9.8. Quantity of fish landings 82
Table 9.9. Value of fish landings 83
Chart 9.4. Percentage distribution of fish landings 84
Table 9.10. Fishing vessels by region and type 85
Table 9.11. Fishing vessels by region and licence 86

Page
10. Social Protection
Table 10.1. Injury benefit claimants by district/region of enterprise 89
Table 10.2. Social protection beneficiaries 90 11. Culture
Table 11.1. Cultural events organised by Local Councils by type and district/region: 2012 95
Table 11.2. Local Councils by number of cultural events and region: 2012 96
Table 11.3. Expenditure related to cultural events organised by Local Councils: 2012 96
Table 11.4. Library book loans: 2012 97
Table 11.5. New members in public libraries: 2012 98
Methodological Notes 99


1. Demography


Table 1.1. Total population by region and age: 2012*
Males Females Total Males Females Total Males Females Total
0-9 20,614 19,426 40,040 19,186 18,091 37,277 1,428 1,335 2,763
10-19 24,048 22,719 46,767 22,142 20,883 43,025 1,906 1,836 3,742
20-29 31,383 29,171 60,554 29,114 27,059 56,173 2,269 2,112 4,381
30-39 31,135 29,242 60,377 29,225 27,530 56,755 1,910 1,712 3,622
40-49 26,220 25,479 51,699 24,265 23,635 47,900 1,955 1,844 3,799
50-59 30,019 29,882 59,901 27,654 27,484 55,138 2,365 2,398 4,763
60-69 27,984 29,267 57,251 25,806 26,995 52,801 2,178 2,272 4,450
70-79 12,929 16,203 29,132 11,881 14,802 26,683 1,048 1,401 2,449
80-89 4,975 8,694 13,669 4,483 7,877 12,360 492 817 1,309
90+ 573 1,401 1,974 503 1,291 1,794 70 110 180
Total 209,880 211,484 421,364 194,259 195,647 389,906 15,621 15,837 31,458
* Based on Census of Population and Households 2011
Malta Gozo and CominoMALTAAge group
3

Table 1.2. Live births by residence of parents
2008 2009 2010 2011 2012
MALTA 4,126 4,143 4,008 4,283 4,231 Malta 3,827 3,900 3,705 3,995 3,935
Southern Harbour 769 786 761 773 744Northern Harbour 1,155 1,163 1,101 1,180 1,204South Eastern 691 714 664 767 733Western 544 566 542 577 553Northern 668 671 637 698 701
Gozo and Comino 297 236 291 285 296Residence unspecified 2 7 12 3 -
Source: Public Registry.
Table 1.3. Deaths by district/region
2008 2009 2010 2011 2012
MALTA 3,243 3,221 3,010 3,267 3,418 Malta 2,997 2,916 2,749 2,993 3,130
Southern Harbour 795 718 704 727 772Northern Harbour 1,003 1,001 933 1,008 1,065South Eastern 413 406 374 420 441Western 409 433 380 461 447Northern 377 358 358 377 405
Gozo and Comino 246 305 261 274 288
Source: Department of Health Information and Research.
4

400 300 200 100 0 100 200 300 400
2008
2009
2010
2011
2012
Chart 1.2. Live births, deaths and natural change: Gozo and Comino
natural change
births
deaths
4,000 3,000 2,000 1,000 0 1,000 2,000 3,000 4,000
2008
2009
2010
2011
2012
Chart 1.1. Live births, deaths and natural change: Malta
natural change
births
deaths
5

Marriages
MALTA Malta Gozo and Comino
2008 2,482 2,289 193
2009 2,353 2,158 195
2010 2,596 2,356 240
2011 2,562 2,377 185
2012 2,823 2,612 211
Source: Public Registry.
Year
Table 1.4. Number of marriages taking place in Malta and Gozo
797
792
802
927
1,11
5 43 40 45 38 55
0%
20%
40%
60%
80%
100%
2008 2009 2010 2011 2012 2008 2009 2010 2011 2012
Malta Gozo and Comino
Chart 1.3. Registered marriages
religious civil
6
2. Household Characteristics


Table 2.1. Distribution of households by district/region
No. % total No. % total No. % total No. % total No. % total
MALTA 143,360 100.0 145,920 100.0 148,560 100.0 150,480 100.0 152,990 100.0
Malta 132,360 92.3 134,750 92.3 137,210 92.4 139,000 92.4 141,340 92.4
Southern Harbour 28,400 19.8 28,630 19.6 28,870 19.4 28,950 19.2 29,140 19.0
Northern Harbour 43,680 30.5 44,360 30.4 45,060 30.3 45,550 30.3 46,260 30.2
South Eastern 20,610 14.4 21,070 14.4 21,530 14.5 21,890 14.5 22,310 14.6
Western 18,560 12.9 18,850 12.9 19,150 12.9 19,350 12.9 19,620 12.8
Northern 21,110 14.7 21,840 15.0 22,600 15.2 23,260 15.5 24,010 15.7
Gozo and Comino 11,000 7.7 11,170 7.7 11,350 7.6 11,480 7.6 11,640 7.6
Source: Statistics on Income and Living Conditions 2012.
20122009 20102008 2011
0
10
20
30
40
50
Southern Harbour Northern Harbour South Eastern Western Northern Gozo and Comino
hous
ehol
ds (0
00s)
Chart 2.1. Distribution of households: 2012
9

Table 2.2. Distribution of households by size and district/region
1 2 3 4 5+ Total
MALTA 28,980 38,070 30,980 30,380 14,950 143,360
Malta 26,510 35,230 28,890 28,140 13,600 132,360
Southern Harbour 6,040 7,700 6,230 5,510 2,920 28,400
Northern Harbour 9,830 12,130 9,080 8,530 4,120 43,680
South Eastern 3,530 5,180 4,740 4,910 2,250 20,610
Western 2,740 4,630 4,250 4,660 2,280 18,560
Northern 4,370 5,590 4,590 4,530 2,030 21,110
Gozo and Comino 2,470 2,830 2,090 2,240 1,360 11,000
MALTA 34,640 42,650 32,740 29,530 13,420 152,990
Malta 31,750 39,490 30,570 27,300 12,230 141,340
Southern Harbour 6,770 8,300 6,310 5,180 2,580 29,140
Northern Harbour 11,620 13,430 9,490 8,090 3,620 46,260
South Eastern 4,340 5,840 5,200 4,830 2,100 22,310
Western 3,280 5,190 4,580 4,520 2,050 19,620
Northern 5,750 6,730 4,990 4,670 1,880 24,010
Gozo and Comino 2,890 3,170 2,170 2,240 1,180 11,640
Source: Statistics on Income and Living Conditions 2012.
2008
2012
Persons
10

insert c2
Table 2.3. Distribution of persons living in households by district/region
MALTA 199,910 200,800 400,710 203,860 205,050 408,910 Malta 184,500 185,460 369,960 188,720 189,340 378,060
Southern Harbour 40,470 37,540 78,010 38,480 38,580 77,060Northern Harbour 57,980 60,170 118,150 59,120 59,960 119,080South Eastern 29,730 30,110 59,840 31,020 31,370 62,390Western 28,050 27,600 55,650 29,330 27,090 56,420Northern 28,270 30,040 58,310 30,770 32,340 63,110
Gozo and Comino 15,410 15,340 30,750 15,140 15,710 30,850
Source: Statistics on Income and Living Conditions 2012.
2008 2012
0%
5%
10%
15%
20%
25%
30%
0%
5%
10%
15%
20%
25%
30%
1 2 3 4 5+ 1 2 3 4 5+
Malta Gozo and Comino
Chart 2.2. Distribution of households by size: 2008 and 2012
2012 2008
11
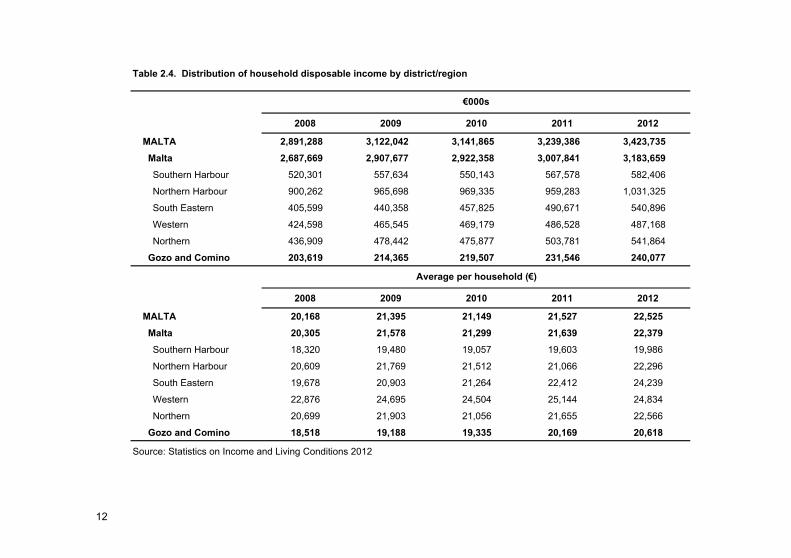
Table 2.4. Distribution of household disposable income by district/region
2008 2009 2010 2011 2012
MALTA 2,891,288 3,122,042 3,141,865 3,239,386 3,423,735 Malta 2,687,669 2,907,677 2,922,358 3,007,841 3,183,659
Southern Harbour 520,301 557,634 550,143 567,578 582,406
Northern Harbour 900,262 965,698 969,335 959,283 1,031,325
South Eastern 405,599 440,358 457,825 490,671 540,896
Western 424,598 465,545 469,179 486,528 487,168
Northern 436,909 478,442 475,877 503,781 541,864
Gozo and Comino 203,619 214,365 219,507 231,546 240,077
2008 2009 2010 2011 2012
MALTA 20,168 21,395 21,149 21,527 22,525 Malta 20,305 21,578 21,299 21,639 22,379
Southern Harbour 18,320 19,480 19,057 19,603 19,986
Northern Harbour 20,609 21,769 21,512 21,066 22,296
South Eastern 19,678 20,903 21,264 22,412 24,239
Western 22,876 24,695 24,504 25,144 24,834
Northern 20,699 21,903 21,056 21,655 22,566
Gozo and Comino 18,518 19,188 19,335 20,169 20,618
Source: Statistics on Income and Living Conditions 2012.
€000s
Average per household (€)
12

0 2 4 6 8 10 12 14 16 18
Southern Harbour
Northern Harbour
South Eastern
Western
Northern
Gozo and Comino
per cent
Chart 2.3. At-risk-of-poverty rates by district/region and sex: 2012
females
males
0.0
5.0
10.0
15.0
20.0
25.0
2008 2009 2010 2011 2012
per c
ent
Chart 2.4. At-risk-of-poverty rates by region
MALTA Malta Gozo and Comino
13


3. The Economy


NACE Rev. 2 Statistical classification of economic activities in the European Community
01
02
02(C)
03
04
05
06
07
08
09
10
T_GVA@bp
Extra-regio
Wholesale and retail trade; repair of motor vehicles and motorcycles; transportation and storage; accommodation and food service activities (G+H+I)
Agriculture, forestry and fishing (A)
of which Manufacturing (C)
Construction (F)
Information and communication (J)
Financial and insurance activities (K)
Mining and quarrying; manufacturing; electricity, gas, steam and air conditioning supply; water supply; sewerage, waste management and remediation activities (B+C+D+E)
The extra-regio territory is made up of parts of the economic territory of a country which cannot be attached directly to a single region. It refers to territorial enclaves (i.e. geographic territories situated in the rest of the world and used under international treaties oragreements between States, by general government agencies of the country, for instance embassies, consulates, military bases,scientific bases, etc.)
Real estate activities (L)
Professional, scientific and technical activities; administrative and support service activities (M+N)
Public administration and defence; compulsory social security; education; human health and social work activities (O+P+Q)
Arts, entertainment and recreation; repair of household goods and other services (R+S+T+U)
Total Gross value added at basic prices
17

Table 3.1. Gross Value Added (GVA) at basic prices …By industry and by region (NUTS III)
€000s2008 2009 2010 2011 2012
MT MALTA 5,220,937 5,178,019 5,577,363 5,768,991 5,971,730MT001 Malta 4,938,252 4,888,549 5,272,744 5,452,130 5,650,867MT002 Gozo and Comino 271,510 278,212 292,528 304,665 308,265MTZZZ Extra-Regio 11,176 11,258 12,091 12,196 12,598
01 MT MALTA 76,844 89,319 93,815 92,878 107,418MT001 Malta 63,043 75,370 79,904 78,928 93,840MT002 Gozo and Comino 13,801 13,949 13,911 13,950 13,578MTZZZ Extra-Regio
02 MT MALTA 899,639 807,001 863,397 826,340 795,043MT001 Malta 866,854 773,849 829,867 794,685 765,258MT002 Gozo and Comino 32,784 33,153 33,530 31,655 29,785MTZZZ Extra-Regio
02(C) MT MALTA 801,005 661,662 718,171 742,557 760,148MT001 Malta 774,665 636,308 692,216 716,665 734,385MT002 Gozo and Comino 26,341 25,354 25,955 25,892 25,763MTZZZ Extra-Regio
03 MT MALTA 246,608 249,571 246,911 242,931 237,853MT001 Malta 225,375 226,538 223,053 219,251 214,522MT002 Gozo and Comino 21,233 23,033 23,858 23,680 23,331MTZZZ Extra-Regio
04 MT MALTA 1,178,730 1,112,202 1,171,038 1,208,117 1,260,236MT001 Malta 1,114,791 1,052,904 1,107,887 1,140,528 1,190,336MT002 Gozo and Comino 63,940 59,298 63,152 67,589 69,900MTZZZ Extra-Regio
Gross value added at basic prices
18

... Table 3.1. Gross Value Added (GVA) at basic pricesBy industry and by region (NUTS III)
€000s2008 2009 2010 2011 2012
05 MT MALTA 276,042 274,242 309,856 358,827 387,960MT001 Malta 264,311 263,452 297,868 344,482 373,509MT002 Gozo and Comino 11,731 10,790 11,988 14,345 14,450MTZZZ Extra-Regio
06 MT MALTA 237,375 325,893 404,183 458,456 493,947MT001 Malta 229,013 313,123 388,906 441,499 476,287MT002 Gozo and Comino 8,362 12,770 15,278 16,957 17,660MTZZZ Extra-Regio
07 MT MALTA 313,800 333,099 336,476 346,250 345,526MT001 Malta 281,290 295,793 299,297 307,511 308,414MT002 Gozo and Comino 32,511 37,306 37,180 38,740 37,112MTZZZ Extra-Regio
08 MT MALTA 490,649 480,233 523,680 571,699 597,764MT001 Malta 472,288 464,031 505,958 553,951 578,793MT002 Gozo and Comino 18,361 16,202 17,721 17,747 18,970MTZZZ Extra-Regio
09 MT MALTA 939,826 994,802 1,053,630 1,099,849 1,164,472MT001 Malta 867,500 918,709 972,933 1,015,862 1,076,243MT002 Gozo and Comino 61,151 64,835 68,606 71,792 75,630MTZZZ Extra-Regio 11,176 11,258 12,091 12,196 12,598
10 MT MALTA 561,424 511,656 574,374 563,645 581,513MT001 Malta 553,788 504,780 567,070 555,433 573,665MT002 Gozo and Comino 7,636 6,876 7,304 8,211 7,848MTZZZ Extra-Regio
19

Table 3.2. Contribution of regional GVA to total GVA …By industry and by region (NUTS III)
per cent2008 2009 2010 2011 2012
MT MALTA 100.00 100.00 100.00 100.00 100.00MT001 Malta 94.59 94.41 94.54 94.51 94.63MT002 Gozo and Comino 5.20 5.37 5.24 5.28 5.16MTZZZ Extra-Regio 0.21 0.22 0.22 0.21 0.21
01 MT MALTA 1.47 1.73 1.68 1.61 1.80MT001 Malta 1.21 1.46 1.43 1.37 1.57MT002 Gozo and Comino 0.26 0.27 0.25 0.24 0.23MTZZZ Extra-Regio
02 MT MALTA 17.23 15.59 15.48 14.32 13.31MT001 Malta 16.60 14.94 14.88 13.78 12.81MT002 Gozo and Comino 0.63 0.64 0.60 0.55 0.50MTZZZ Extra-Regio
02(C) MT MALTA 15.34 12.78 12.88 12.87 12.73MT001 Malta 14.84 12.29 12.41 12.42 12.30MT002 Gozo and Comino 0.50 0.49 0.47 0.45 0.43MTZZZ Extra-Regio
03 MT MALTA 4.72 4.82 4.43 4.21 3.98MT001 Malta 4.32 4.38 4.00 3.80 3.59MT002 Gozo and Comino 0.41 0.44 0.43 0.41 0.39MTZZZ Extra-Regio
04 MT MALTA 22.58 21.48 21.00 20.94 21.10MT001 Malta 21.35 20.33 19.86 19.77 19.93MT002 Gozo and Comino 1.22 1.15 1.13 1.17 1.17MTZZZ Extra-Regio
Gross value added at basic prices
20

... Table 3.2. Contribution of regional GVA to total GVABy industry and by region (NUTS III)
per cent2008 2009 2010 2011 2012
05 MT MALTA 5.29 5.30 5.56 6.22 6.50MT001 Malta 5.06 5.09 5.34 5.97 6.25MT002 Gozo and Comino 0.22 0.21 0.21 0.25 0.24MTZZZ Extra-Regio
06 MT MALTA 4.55 6.29 7.25 7.95 8.27MT001 Malta 4.39 6.05 6.97 7.65 7.98MT002 Gozo and Comino 0.16 0.25 0.27 0.29 0.30MTZZZ Extra-Regio
07 MT MALTA 6.01 6.43 6.03 6.00 5.79MT001 Malta 5.39 5.71 5.37 5.33 5.16MT002 Gozo and Comino 0.62 0.72 0.67 0.67 0.62MTZZZ Extra-Regio
08 MT MALTA 9.40 9.27 9.39 9.91 10.01MT001 Malta 9.05 8.96 9.07 9.60 9.69MT002 Gozo and Comino 0.35 0.31 0.32 0.31 0.32MTZZZ Extra-Regio
09 MT MALTA 18.00 19.21 18.89 19.06 19.50MT001 Malta 16.62 17.74 17.44 17.61 18.02MT002 Gozo and Comino 1.17 1.25 1.23 1.24 1.27MTZZZ Extra-Regio 0.21 0.22 0.22 0.21 0.21
10 MT MALTA 10.75 9.88 10.30 9.77 9.74MT001 Malta 10.61 9.75 10.17 9.63 9.61MT002 Gozo and Comino 0.15 0.13 0.13 0.14 0.13MTZZZ Extra-Regio
21

0
1,000
2,000
3,000
4,000
5,000
6,000
2008 2009 2010 2011 2012
€000s
Chart 3.1. Composition of GVA at basic prices by economic activity: Malta
10 09 0807 06 0504 03 02(C)02(1-C) 01 T_GVA@bp
0
50
100
150
200
250
300
350
2008 2009 2010 2011 2012
€000s
Chart 3.2. Composition of GVA at basic prices by economic activity: Gozo and Comino
10 09 0807 06 0504 03 02(C)02(1-C) 01 T_GVA@bp
22
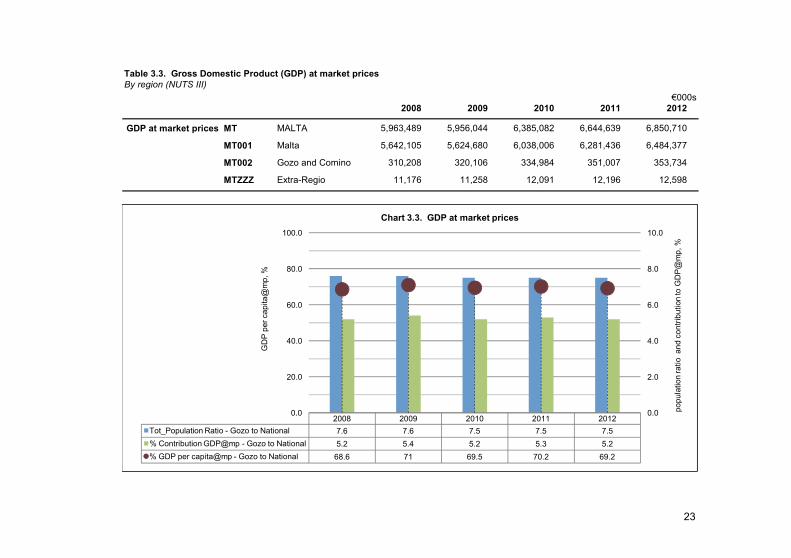
Table 3.3. Gross Domestic Product (GDP) at market prices By region (NUTS III)
€000s2008 2009 2010 2011 2012
GDP at market prices MT MALTA 5,963,489 5,956,044 6,385,082 6,644,639 6,850,710
MT001 Malta 5,642,105 5,624,680 6,038,006 6,281,436 6,484,377
MT002 Gozo and Comino 310,208 320,106 334,984 351,007 353,734
MTZZZ Extra-Regio 11,176 11,258 12,091 12,196 12,598
2008 2009 2010 2011 2012Tot_Population Ratio - Gozo to National 7.6 7.6 7.5 7.5 7.5% Contribution GDP@mp - Gozo to National 5.2 5.4 5.2 5.3 5.2% GDP per capita@mp - Gozo to National 68.6 71 69.5 70.2 69.2
0.0
2.0
4.0
6.0
8.0
10.0
0.0
20.0
40.0
60.0
80.0
100.0
popu
latio
n ra
tio a
nd c
ontri
butio
n to
GD
P@m
p, %
GD
P pe
r cap
ita@
mp,
%
Chart 3.3. GDP at market prices
23


4. Employment


Table 4.1. Employed persons by sex and region of residence
Males Females Total Males Females Total Males Females Total
2008 107,749 53,490 161,239 100,183 50,042 150,225 7,566 3,448 11,014
2009 106,840 53,931 160,771 99,244 50,048 149,292 7,596 3,883 11,479
2010 108,194 56,018 164,212 100,738 52,252 152,990 7,456 3,766 11,222
2011 110,294 58,417 168,711 102,343 54,506 156,849 7,951 3,911 11,862
2012 109,827 62,874 172,701 102,147 58,258 160,405 7,680 4,616 12,296
2013 110,764 66,301 177,065 103,034 61,663 164,697 7,730 4,638 12,368
MALTA Malta Gozo and Comino
27

Table 4.2. Self-employed persons by district/region of residence
2008 2009 2010 2011 2012 2013
MALTA 21,463 21,942 23,195 22,723 22,940 24,236
Malta 19,653 19,721 21,187 20,635 21,179 22,666
Southern Harbour 2,660 2,364 2,657 2,954 2,986 3,408
Northern Harbour 6,210 7,363 7,850 7,189 6,671 7,477
South Eastern 2,435 2,153 2,485 2,533 2,736 2,799
Western 3,706 3,114 3,179 3,673 4,475 3,944
Northern 4,642 4,727 5,016 4,286 4,311 5,038
Gozo and Comino 1,810 2,221 2,008 2,088 1,761 1,570
Source: Labour Force Survey (LFS) annual datasets.
28

Table 4.3. Employees by sex and region of residence Includes unpaid family workers
Males Females Total Males Females Total Males Females Total
2008 89,592 50,184 139,776 83,541 47,031 130,572 6,051 3,153 9,204
2009 88,566 50,263 138,829 82,732 46,839 129,571 5,834 3,424 9,258
2010 88,375 52,642 141,017 82,696 49,107 131,803 5,679 3,535 9,214
2011 91,230 54,758 145,988 85,011 51,203 136,214 6,219 3,555 9,774
2012 91,021 58,740 149,761 84,754 54,472 139,226 6,267 4,268 10,535
2013 90,579 62,250 152,829 84,175 57,856 142,031 6,404 4,394 10,798
MALTA Malta Gozo and Comino
0.00
0.20
0.40
0.60
0.80
1.00
1.20
1.40
1.60
Males Females Total Males Females Total
Malta Gozo and Comino
inde
x
Chart 4.1. Employees Index by sex and region of residence2008=1.00
2008
2009
2010
2011
2012
2013
29

Table 4.4. Unemployed persons by district/region of residence
2008 2009 2010 2011 2012 2013
MALTA 10,378 11,955 12,194 11,694 11,840 12,248
Malta 9,408 11,038 11,408 10,812 11,099 11,497
Southern Harbour 2,806 3,038 3,620 3,301 3,034 3,440
Northern Harbour 3,122 4,221 3,773 3,275 3,334 3,664
South Eastern 1,074 1,333 1,582 1,567 1,904 1,831
Western 1,041 1,176 1,366 1,266 1,561 1,703
Northern 1,365 1,270 1,067 1,403 1,266 859
Gozo and Comino 970 917 786 882u 741u 751u
u under-represented - between 20 and 49 sample observationsSource: Labour Force Survey (LFS) annual datasets.
30

Table 4.5. Full-time gainfully occupied population by region and sector
Private Public Private Public Private Public
2008 104,362 41,653 99,015 38,094 5,347 3,559
2009 104,727 40,797 99,287 37,301 5,440 3,496
2010 106,310 40,607 100,744 37,166 5,566 3,441
2011 108,776 41,023 103,121 37,583 5,655 3,440
2012 111,444 40,893 105,673 37,473 5,771 3,420
2013 115,271 42,345 109,495 38,639 5,776 3,706
Table 4.6. Full-time gainfully occupied population by region and professional status
Self-employed Employees Self-employed Employees Self-employed Employees
2008 17,417 128,598 15,863 121,246 1,554 7,352
2009 17,620 127,904 16,057 120,531 1,563 7,373
2010 17,747 129,170 16,195 121,715 1,552 7,455
2011 17,705 132,094 16,173 124,531 1,532 7,563
2012 17,881 134,456 16,332 126,814 1,549 7,642
2013 18,318 139,298 16,743 131,391 1,575 7,907
Source: Employment and Training Corporation (ETC).
MALTA Malta Gozo and Comino
Malta Gozo and CominoMALTA
Note: In Tables 4.5 to 4.10, figures refer as follows: 2008-2012 - annual average; 2013 - data are as at November.
31

0
20,000
40,000
60,000
80,000
100,000
120,000
140,000
160,000
2008 2009 2010 2011 2012 2013
pers
ons
Chart 4.2. Full-time gainfully occupied population by sector and professional status: Malta
Malta Public FT_Public_Empl
Malta Private FT_Private_Empl
Malta Private FT_Private_S/E
Malta Total FT_GOP
0
2,000
4,000
6,000
8,000
10,000
2008 2009 2010 2011 2012 2013
pers
ons
Chart 4.3. Full-time gainfully occupied population by sector and professional status: Gozo and Comino
Gozo and Comino FT_Public_Empl
Gozo and Comino FT_Private_Empl
Gozo and Comino FT_Private_S/E
Gozo and Comino Total FT_GOP
32

Table 4.7. Sectoral gainfully occupied population by region and sex
Males Females Males Females Males Females Males Females Males Females Males Females
2008 72,851 31,511 27,111 14,542 69,070 29,945 24,629 13,465 3,781 1,566 2,482 1,077
2009 72,833 31,894 25,853 14,944 69,002 30,285 23,444 13,857 3,831 1,609 2,409 1,087
2010 73,356 32,954 25,261 15,346 69,483 31,261 22,905 14,261 3,873 1,693 2,356 1,085
2011 74,533 34,243 24,751 16,272 70,601 32,520 22,451 15,132 3,932 1,723 2,300 1,140
2012 75,752 35,692 24,049 16,844 71,744 33,929 21,789 15,684 4,008 1,763 2,260 1,160
2013 77,091 38,180 24,174 18,171 73,148 36,347 21,847 16,792 3,943 1,833 2,327 1,379
Source: Employment and Training Corporation (ETC).Note: In Tables 4.5 to 4.10, figures refer as follows: 2008-2012 - annual average; 2013 - data are as at November.
Gozo and Comino
Private Public
MALTA
Private Public
Malta
Private Public
33

Table 4.8. Full-time gainfully occupied population by region, professional status and sex
Males Females Males Females Males Females Males Females Males Females Males Females
2008 14,822 2,595 85,140 43,458 13,522 2,341 80,177 41,069 1,300 254 4,963 2,389
2009 14,920 2,700 83,766 44,138 13,620 2,437 78,826 41,705 1,300 263 4,940 2,433
2010 14,935 2,812 83,682 45,488 13,644 2,551 78,744 42,971 1,291 261 4,938 2,517
2011 14,754 2,951 84,530 47,564 13,489 2,684 79,563 44,968 1,265 267 4,967 2,596
2012 14,798 3,083 85,003 49,453 13,517 2,815 80,016 46,798 1,281 268 4,987 2,655
2013 15,047 3,271 86,218 53,080 13,750 2,993 81,245 50,146 1,297 278 4,973 2,934
Table 4.9. Part-time gainfully occupied population by region, job type and sex
Males Females Males Females Males Females Males Females Males Females Males Females
2008 10,439 15,442 14,183 5,427 9,640 14,366 12,840 5,125 799 1,076 1,343 302
2009 10,895 15,989 14,558 5,876 10,069 14,891 13,174 5,532 826 1,098 1,384 344
2010 11,677 16,713 15,084 6,309 10,814 15,609 13,665 5,931 863 1,104 1,419 378
2011 12,199 17,120 15,526 6,778 11,317 16,027 14,066 6,375 882 1,093 1,460 403
2012 13,076 18,236 15,889 7,324 12,158 17,081 14,405 6,876 918 1,155 1,484 448
2013 13,846 19,601 16,286 7,966 12,882 18,428 14,770 7,461 964 1,173 1,516 505
Source: Employment and Training Corporation (ETC).Note: In Tables 4.5 to 4.10, figures refer as follows: 2008-2012 - annual average; 2013 - data are as at November.
Self-employed
Primary jobSecondary job
Employees
Secondary job
Employees
Malta
Self-employedSelf-employed
Gozo and CominoMalta
Gozo and Comino
Primary jobPrimary job Secondary job
Employees
MALTA
MALTA
34

Table 4.10. Part-time gainfully occupied population by region and job type
Primary job Secondary job Primary job Secondary job Primary job Secondary job
2008 25,881 19,610 24,006 17,965 1,875 1,645
2009 26,884 20,434 24,960 18,706 1,924 1,728
2010 28,390 21,393 26,423 19,596 1,967 1,797
2011 29,319 22,304 27,344 20,441 1,975 1,863
2012 31,312 23,213 29,239 21,281 2,073 1,932
2013 33,447 24,252 31,310 22,231 2,137 2,021
Source: Employment and Training Corporation (ETC).
Malta Gozo and CominoMALTA
Note: In Tables 4.5 to 4.10, figures refer as follows: 2008-2012 - annual average; 2013 - data are as at November.
35


5. Business Demographics


Table 5.1. Structure of units by region and type of legal organisation
Sole owners/ partners Ltd/plc Other Total Sole owners/
partners Ltd/plc Other Total
Malta 35,843 22,586 3,591 62,020 31,329 34,391 1,999 67,719
Gozo and Comino 3,319 672 296 4,287 2,618 847 193 3,658
Overseas 54 54 99 207 67 29 156 252
Total 39,216 23,312 3,986 66,514 34,014 35,267 2,348 71,629
Note: Units are classified by region according to their registered address.
20132008
Table 5.2. Structure of units by region and employment size
0-9 10-49 50-249 250+ 0-9 10-49 50-249 250+
Malta 60,182 1,426 337 75 65,648 1,586 395 90
Gozo and Comino 4,193 85 7 2 3,557 82 17 2
Overseas 206 1 0 0 246 5 1 0
Total 64,581 1,512 344 77 69,451 1,673 413 92
Note: Units are classified by region according to their registered address.
20132008
39

Table 5.3. Births of business units by region
2008 2009 2010 2011 2012 2013
Malta 5,511 5,352 5,897 5,950 6,213 5,317
Gozo and Comino 258 223 232 169 207 222
Overseas 42 33 39 36 25 20
Total 5,811 5,608 6,168 6,155 6,445 5,559
Table 5.4. Deaths of business units by region
2008 2009 2010 2011 2012 2013
Malta 2,535 3,280 3,115 10,007 4,126 3,511
Gozo and Comino 144 211 173 841 243 207
Overseas 14 22 11 28 22 34
Total 2,693 3,513 3,299 10,876 4,391 3,752
Notes:1. Units are classified by region according to their registered address.
2. On 1 January 2011, the Value Added Tax (Exemption from Registration) Regulations, 2010, came into force, as notified in Legal Notice524 of 2010. The Regulations state that the VAT Commissioner shall not register any taxable person established in Malta whose turnoverdoes not exceed €7,000 in a calendar year. Therefore business demographics from 2011 onwards may not be strictly comparable to thebusiness demographics of previous years and should be treated with caution.
40

6. Tourism


2008 2009 2010 2011 2012 2013 2008 2009 2010 2011 2012 2013 2008 2009 2010 2011 2012 2013
Total 55.4 48.2 53.2 54.4 54.5 57.5 2.5 2.6 2.6 2.4 2.4 2.3 57.9 50.8 55.8 56.8 56.9 59.8
Hotel 56.5 49.1 55.0 57.0 57.1 59.7 2.8 3.0 3.0 2.7 2.8 2.7 59.4 52.1 58.1 59.7 59.9 62.4 5-Star 51.3 50.6 55.7 57.2 57.7 59.8 5.2 4.8 4.9 4.6 4.8 4.4 56.4 55.4 60.7 61.8 62.5 64.2 4-Star 64.7 57.6 63.8 66.6 63.9 64.4 3.0 3.4 3.6 2.9 2.8 2.5 67.7 61.0 67.4 69.6 66.7 66.9 3-Star 48.1 34.8 41.5 42.4 45.6 53.1 0.8 0.9 0.7 0.8 1.2 1.4 49.0 35.7 42.1 43.3 46.8 54.5 2-Star 40.6 34.6 35.9 28.9 29.7 32.3 0.6 1.2 1.7 3.6 3.1 6.6 41.1 35.8 37.6 32.6 32.8 38.8
Other collective accommodation 49.8 44.0 43.4 40.9 41.1 46.1 0.5 0.5 0.5 0.5 0.4 0.5 50.2 44.4 43.9 41.4 41.4 46.6 Guesthouse 32.5 30.1 29.1 32.3 34.1 34.8 0.8 1.0 0.8 0.6 0.6 0.8 33.4 31.1 29.8 32.9 34.7 35.6 Holiday Complex1 52.3 46.0 47.2 44.6 44.2 48.5 0.5 0.4 0.5 0.5 0.4 0.5 52.7 46.5 47.6 45.2 44.6 49.0 Hostel 47.6 42.7 37.3 33.0 34.1 42.9 0.4 0.4 0.4 0.3 0.3 0.4 48.0 43.1 37.7 33.3 34.5 43.3
1 Includes aparthotels and tourist villages
2008 2009 2010 2011 2012 2013 2008 2009 2010 2011 2012 2013 2008 2009 2010 2011 2012 2013
Total 56.2 49.2 54.3 55.4 55.4 58.3 2.0 2.2 2.1 1.9 2.0 1.8 58.2 51.4 56.4 57.3 57.4 60.2
Hotel 57.3 50.0 56.2 58.1 58.2 60.8 2.4 2.6 2.4 2.2 2.3 2.1 59.7 52.6 58.6 60.3 60.5 62.9 5-Star 52.4 52.0 57.5 59.0 59.4 61.4 4.8 4.6 4.3 3.9 4.2 3.6 57.2 56.5 61.8 62.9 63.5 65.0 4-Star 66.0 59.2 65.6 68.5 65.2 65.3 2.5 2.9 2.9 2.3 2.3 2.0 68.4 62.1 68.5 70.8 67.5 67.4 3-Star 48.4 35.0 41.7 42.5 45.8 53.6 0.5 0.6 0.3 0.5 0.9 1.1 48.9 35.6 42.0 43.0 46.7 54.7 2-Star 40.6 34.6 36.9 31.5 33.7 37.2 0.6 1.2 1.4 2.5 2.2 2.0 41.1 35.8 38.3 33.9 35.9 39.2
Other collective accommodation1 50.5 44.9 44.6 41.5 41.4 46.3 0.3 0.3 0.3 0.4 0.3 0.5 50.9 45.2 44.9 41.9 41.7 46.8 1 Comprises guesthouses, holiday complexes and hostels
Resident
Table 6.1. Net use of bed-places by resident and non-resident tourists classified by type of accommodation: MALTA
Table 6.2. Net use of bed-places by resident and non-resident tourists classified by type of accommodation: Malta
TotalNon-resident
Non-resident Resident Total
43

2008 2009 2010 2011 2012 2013 2008 2009 2010 2011 2012 2013 2008 2009 2010 2011 2012 2013
Total 36.9 27.8 28.2 31.0 33.9 38.3 12.5 11.3 14.1 13.7 12.9 13.9 49.4 39.1 42.3 44.7 46.8 52.1
Hotel 38.8 29.6 30.7 32.5 34.7 39.8 13.1 11.9 15.4 14.5 13.6 14.7 51.9 41.5 46.1 47.0 48.3 54.4 5-Star 33.7 27.4 27.2 30.3 31.5 35.8 10.9 9.8 14.5 14.8 15.4 16.6 44.6 37.2 41.7 45.1 46.9 52.3 4-Star 42.8 31.7 33.2 34.7 39.1 46.6 12.7 11.7 15.1 13.3 12.4 11.4 55.4 43.4 48.3 48.0 51.5 58.0 3-Star 32.4 24.8 29.2 36.0 34.3 34.6 20.9 17.8 20.8 22.0 19.6 20.4 53.3 42.6 50.1 58.0 53.9 55.0 2-Star n/a n/a 7.7 10.6 11.5 14.1 n/a n/a 8.3 12.1 7.1 23.3 n/a n/a 16.0 22.7 18.6 37.5
Other collective accommodation1 19.9 13.2 11.9 12.1 22.4 18.7 7.1 6.7 5.1 3.4 3.7 3.5 27.0 19.9 17.1 15.5 26.0 22.2
2008 2009 2010 2011 2012 2013 2008 2009 2010 2011 2012 2013 2008 2009 2010 2011 2012 2013
Total 7.0 6.8 6.4 6.3 6.3 6.2 2.4 2.2 2.2 2.2 2.2 2.2 6.5 6.2 5.9 5.8 5.8 5.8
Hotel 6.7 6.5 6.1 6.0 6.0 5.9 2.4 2.2 2.2 2.2 2.2 2.2 6.1 5.8 5.6 5.6 5.5 5.5 5-Star 5.3 5.1 5.0 4.7 4.6 4.6 2.6 2.3 2.3 2.3 2.3 2.3 4.8 4.6 4.5 4.3 4.3 4.3 4-Star 7.4 7.3 6.8 6.8 6.8 6.8 2.3 2.2 2.2 2.2 2.1 2.0 6.7 6.5 6.1 6.3 6.2 6.3 3-Star 7.0 6.8 6.3 6.1 6.1 5.8 2.1 2.2 2.0 2.1 2.3 2.8 6.7 6.4 6.1 5.8 5.9 5.6 2-Star 4.0 4.1 3.9 3.6 3.8 3.6 1.7 2.6 1.4 1.5 1.4 2.0 3.9 4.0 3.6 3.1 3.3 3.1
Other collective accommodation1 10.0 10.2 9.9 10.0 9.5 10.1 2.4 2.3 2.5 2.9 2.3 2.7 9.7 9.8 9.6 9.7 9.2 9.8
1 Comprises guesthouses, holiday complexes and hostels
Non-resident Resident Total
TotalResident
Table 6.3. Net use of bed-places by resident and non-resident tourists classified by type of accommodation: Gozo and Comino
Table 6.4. Average length of stay: MALTA
Non-resident
44

2008 2009 2010 2011 2012 2013 2008 2009 2010 2011 2012 2013 2008 2009 2010 2011 2012 2013
Total 7.1 6.9 6.5 6.3 6.3 6.2 2.4 2.3 2.3 2.3 2.2 2.3 6.7 6.3 6.1 6.0 5.9 5.9
Hotel 6.7 6.5 6.1 6.0 6.0 5.9 2.4 2.3 2.2 2.2 2.2 2.3 6.3 6.0 5.7 5.7 5.6 5.6 5-Star 5.3 5.1 5.0 4.7 4.6 4.5 2.6 2.3 2.3 2.3 2.3 2.2 4.9 4.7 4.6 4.4 4.3 4.3 4-Star 7.5 7.4 6.8 6.9 6.9 6.8 2.3 2.2 2.2 2.3 2.2 2.1 6.9 6.6 6.3 6.4 6.4 6.4 3-Star 7.1 6.9 6.3 6.1 6.2 5.8 2.6 2.4 2.1 2.4 2.6 3.5 7.0 6.7 6.2 6.0 6.0 5.7 2-Star 4.0 4.1 3.9 3.6 3.8 3.6 1.7 2.6 1.3 1.3 1.2 1.3 3.9 4.0 3.6 3.2 3.3 3.3
Other collective accommodation1 10.2 10.3 10.0 10.0 9.6 10.2 2.2 2.3 2.8 3.1 2.3 2.8 10.0 10.1 9.8 9.8 9.4 9.9
2008 2009 2010 2011 2012 2013 2008 2009 2010 2011 2012 2013 2008 2009 2010 2011 2012 2013
Total 5.3 5.0 5.0 5.0 5.3 5.3 2.1 2.1 2.1 2.1 2.0 2.0 3.8 3.5 3.5 3.5 3.7 3.7
Hotel 5.4 5.0 5.1 5.0 5.3 5.3 2.1 2.0 2.1 2.1 2.0 2.0 3.8 3.5 3.5 3.5 3.7 3.7 5-Star 5.4 4.4 4.9 5.0 5.0 4.9 2.5 2.3 2.3 2.3 2.3 2.3 4.2 3.6 3.5 3.6 3.6 3.6 4-Star 5.9 5.8 5.7 5.6 6.0 6.2 2.1 2.0 2.1 2.1 2.0 1.9 4.2 3.8 3.7 3.8 4.0 4.3 3-Star 3.3 3.6 3.2 3.2 3.4 3.4 1.8 1.9 1.9 1.8 1.7 1.7 2.5 2.6 2.5 2.5 2.5 2.5 2-Star n/a n/a 3.0 3.5 5.0 3.3 n/a n/a 1.9 1.9 1.9 2.3 n/a n/a 2.3 2.4 3.1 2.6
Other collective accommodation1 4.0 4.1 3.8 4.5 4.7 3.9 2.6 2.5 2.2 2.0 2.1 1.9 3.5 3.3 3.1 3.6 4.0 3.3
1 Comprises guesthouses, holiday complexes and hostelsSource: NSO Collective Accommodation Survey (Accomstat).
Table 6.6. Average length of stay: Gozo and Comino
Non-resident Resident Total
Table 6.5. Average length of stay: Malta
Non-resident Resident Total
45

2008 2009 2010 2011 2012 2013
Total 142,291 159,037 158,218 143,885 153,608 147,308
Hotel 137,654 154,365 154,001 140,247 149,916 142,829 5-Star 52,447 57,308 53,884 50,965 53,587 49,530 4-Star 71,717 82,400 86,366 71,408 75,640 70,430 3-Star 12,690 13,645 11,250 13,258 16,491 15,928 2-Star 800 1,012 2,501 4,616 4,198 6,941
Other collective accommodation1 4,638 4,672 4,217 3,638 3,692 4,479
Total 108,618 126,812 120,079 106,721 117,058 107,589
Hotel 105,547 123,889 117,680 103,766 114,055 103,849 5-Star 45,716 50,806 44,676 41,371 43,295 38,503 4-Star 53,636 64,744 65,491 52,165 56,981 52,960 3-Star 5,395 7,327 5,330 7,091 10,842 9,897 2-Star 800 1,012 2,183 3,139 2,937 2,489
Other collective accommodation1 3,070 2,923 2,399 2,955 3,003 3,740
Total 33,674 32,225 38,139 37,164 36,550 39,719
Hotel 32,106 30,476 36,321 36,481 35,861 38,980 5-Star 6,731 6,502 9,208 9,594 10,292 11,027 4-Star 18,081 17,656 20,875 19,243 18,659 17,470 3-Star 7,294 6,318 5,920 6,167 5,649 6,031 2-Star n/a n/a 318 1,477 1,261 4,452
Other collective accommodation1 1,568 1,749 1,818 683 689 7391 Comprises guesthouses, holiday complexes and hostelsSource: NSO Collective Accommodation Survey (Accomstat).
Malta
Gozo and Comino
MALTA
Table 6.7. Arrivals of resident tourists
46

2008 2009 2010 2011 2012 2013
Total 1,079,089 957,823 1,118,977 1,167,653 1,194,100 1,305,828
Hotel 966,919 861,144 1,023,556 1,078,915 1,098,557 1,199,892 5-Star 251,673 267,901 285,235 309,093 320,295 333,455 4-Star 470,891 411,741 502,691 526,171 535,275 544,712 3-Star 221,315 162,631 217,364 228,789 228,062 302,738 2-Star 23,040 18,871 18,266 14,862 14,925 18,988
Other collective accommodation1 112,170 96,679 95,421 88,737 95,543 105,936
Total 1,039,281 924,887 1,086,017 1,132,875 1,157,065 1,263,831
Hotel 929,966 830,291 992,992 1,045,238 1,063,452 1,159,889 5-Star 241,943 258,263 277,106 299,910 310,535 322,396 4-Star 449,746 395,123 485,325 507,861 515,743 522,756 3-Star 215,237 158,034 212,478 223,289 223,035 297,682 2-Star 23,040 18,871 18,083 14,178 14,140 17,055
Other collective accommodation1 109,315 94,596 93,025 87,636 93,613 103,943
Total 39,808 32,936 32,960 34,778 37,035 41,997
Hotel 36,953 30,853 30,564 33,677 35,105 40,003 5-Star 9,730 9,638 8,129 9,183 9,760 11,059 4-Star 21,145 16,618 17,366 18,310 19,532 21,956 3-Star 6,078 4,597 4,886 5,500 5,027 5,055 2-Star n/a n/a 183 684 785 1,933
Other collective accommodation1 2,855 2,083 2,396 1,101 1,930 1,9931 Comprises guesthouses, holiday complexes and hostelsSource: NSO Collective Accommodation Survey (Accomstat).
Table 6.8. Arrivals of non-resident tourists
MALTA
Malta
Gozo and Comino
47

2008 2009 2010 2011 2012 2013
Total 1,221,380 1,116,860 1,277,195 1,311,538 1,347,708 1,453,136
Hotel 1,104,573 1,015,509 1,177,557 1,219,162 1,248,473 1,342,721 5-Star 304,120 325,209 339,119 360,058 373,882 382,985 4-Star 542,608 494,141 589,058 597,579 610,915 615,142 3-Star 234,005 176,276 228,613 242,046 244,553 318,666 2-Star 23,840 19,883 20,767 19,478 19,123 25,928
Other collective accommodation1 116,807 101,351 99,638 92,376 99,235 110,415
Total 1,147,898 1,051,699 1,206,096 1,239,596 1,274,123 1,371,420
Hotel 1,035,513 954,180 1,110,672 1,149,004 1,177,507 1,263,738 5-Star 287,659 309,069 321,782 341,281 353,830 360,899 4-Star 503,382 459,867 550,817 560,026 572,724 575,716 3-Star 220,632 165,361 217,807 230,380 233,877 307,579 2-Star 23,840 19,883 20,266 17,317 17,077 19,543
Other collective accommodation1 112,385 97,519 95,424 90,592 96,616 107,683
Total 73,482 65,161 71,099 71,942 73,585 81,715
Hotel 69,060 61,329 66,885 70,158 70,966 78,983 5-Star 16,461 16,140 17,337 18,777 20,052 22,086 4-Star 39,226 34,274 38,241 37,553 38,191 39,426 3-Star 13,373 10,915 10,806 11,666 10,676 11,086 2-Star n/a n/a 501 2,161 2,047 6,385
Other collective accommodation1 4,422 3,832 4,214 1,784 2,619 2,7321 Comprises guesthouses, holiday complexes and hostelsSource: NSO Collective Accommodation Survey (Accomstat).
Table 6.9. Total tourist arrivals
MALTA
Malta
Gozo and Comino
48

2008 2009 2010 2011 2012 2013
Total 336,428 352,848 353,015 319,506 335,392 326,346
Hotel 325,466 341,947 342,405 308,980 326,954 314,262 5-Star 134,837 131,521 125,062 115,995 123,079 111,471 4-Star 162,309 178,333 191,815 158,511 159,858 144,372 3-Star 26,987 29,499 22,152 27,752 38,056 44,693 2-Star 1,332 2,594 3,376 6,722 5,962 13,726
Other collective accommodation1 10,963 10,901 10,611 10,526 8,438 12,084
Total 265,278 286,352 271,198 242,522 260,841 245,933
Hotel 258,384 279,758 264,537 233,382 253,876 235,286 5-Star 117,877 116,382 103,643 93,627 99,247 86,493 4-Star 125,042 142,980 147,150 118,954 122,813 110,881 3-Star 14,132 17,802 10,957 16,823 28,279 34,582 2-Star 1,332 2,594 2,787 3,978 3,538 3,330
Other collective accommodation1 6,894 6,594 6,662 9,140 6,965 10,647
Total 71,150 66,496 81,817 76,984 74,551 80,413
Hotel 67,082 62,189 77,868 75,598 73,078 78,976 5-Star 16,960 15,139 21,419 22,368 23,832 24,978 4-Star 37,267 35,353 44,665 39,557 37,045 33,491 3-Star 12,855 11,697 11,195 10,929 9,777 10,111 2-Star n/a n/a 589 2,744 2,424 10,396
Other collective accommodation1 4,068 4,307 3,949 1,386 1,473 1,4371 Comprises guesthouses, holiday complexes and hostelsSource: NSO Collective Accommodation Survey (Accomstat).
Table 6.10. Nights spent by resident tourists
MALTA
Malta
Gozo and Comino
49
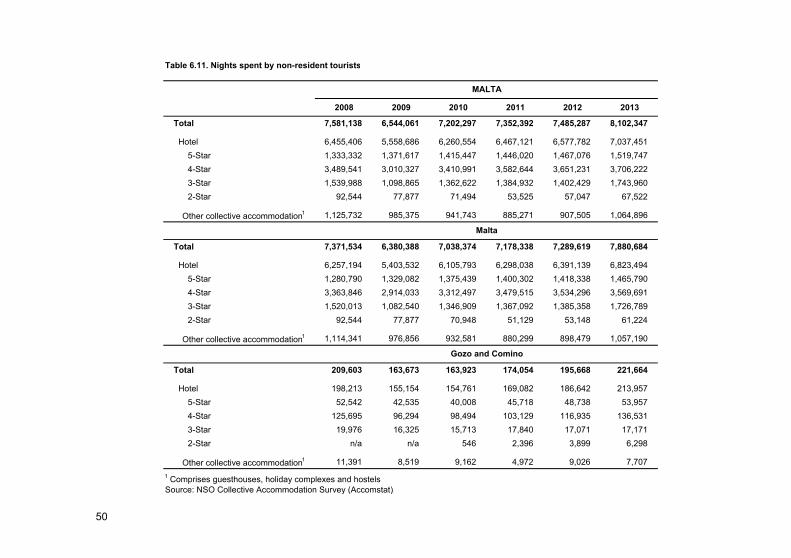
2008 2009 2010 2011 2012 2013
Total 7,581,138 6,544,061 7,202,297 7,352,392 7,485,287 8,102,347
Hotel 6,455,406 5,558,686 6,260,554 6,467,121 6,577,782 7,037,451 5-Star 1,333,332 1,371,617 1,415,447 1,446,020 1,467,076 1,519,747 4-Star 3,489,541 3,010,327 3,410,991 3,582,644 3,651,231 3,706,222 3-Star 1,539,988 1,098,865 1,362,622 1,384,932 1,402,429 1,743,960 2-Star 92,544 77,877 71,494 53,525 57,047 67,522
Other collective accommodation1 1,125,732 985,375 941,743 885,271 907,505 1,064,896
Total 7,371,534 6,380,388 7,038,374 7,178,338 7,289,619 7,880,684
Hotel 6,257,194 5,403,532 6,105,793 6,298,038 6,391,139 6,823,494 5-Star 1,280,790 1,329,082 1,375,439 1,400,302 1,418,338 1,465,790 4-Star 3,363,846 2,914,033 3,312,497 3,479,515 3,534,296 3,569,691 3-Star 1,520,013 1,082,540 1,346,909 1,367,092 1,385,358 1,726,789 2-Star 92,544 77,877 70,948 51,129 53,148 61,224
Other collective accommodation1 1,114,341 976,856 932,581 880,299 898,479 1,057,190
Total 209,603 163,673 163,923 174,054 195,668 221,664
Hotel 198,213 155,154 154,761 169,082 186,642 213,957 5-Star 52,542 42,535 40,008 45,718 48,738 53,957 4-Star 125,695 96,294 98,494 103,129 116,935 136,531 3-Star 19,976 16,325 15,713 17,840 17,071 17,171 2-Star n/a n/a 546 2,396 3,899 6,298
Other collective accommodation1 11,391 8,519 9,162 4,972 9,026 7,7071 Comprises guesthouses, holiday complexes and hostelsSource: NSO Collective Accommodation Survey (Accomstat).
Table 6.11. Nights spent by non-resident tourists
MALTA
Malta
Gozo and Comino
50

2008 2009 2010 2011 2012 2013
Total 7,917,566 6,896,909 7,555,312 7,671,898 7,820,679 8,428,694
Hotel 6,780,872 5,900,633 6,602,958 6,776,101 6,904,736 7,351,713 5-Star 1,468,169 1,503,137 1,540,510 1,562,015 1,590,155 1,631,218 4-Star 3,651,851 3,188,660 3,602,806 3,741,155 3,811,088 3,850,593 3-Star 1,566,976 1,128,365 1,384,773 1,412,684 1,440,485 1,788,653 2-Star 93,877 80,471 74,870 60,247 63,009 81,249
Other collective accommodation1 1,136,694 996,276 952,354 895,797 915,943 1,076,980
Total 7,636,813 6,666,740 7,309,572 7,420,859 7,550,460 8,126,617
Hotel 6,515,577 5,683,290 6,370,329 6,531,420 6,645,016 7,058,780 5-Star 1,398,667 1,445,463 1,479,083 1,493,929 1,517,585 1,552,283 4-Star 3,488,889 3,057,013 3,459,647 3,598,469 3,657,108 3,680,571 3-Star 1,534,145 1,100,343 1,357,865 1,383,915 1,413,637 1,761,371 2-Star 93,877 80,471 73,735 55,107 56,686 64,555
Other collective accommodation1 1,121,235 983,450 939,243 889,439 905,444 1,067,837
Total 280,753 230,169 245,740 251,038 270,220 302,077
Hotel 265,295 217,343 232,629 244,681 259,721 292,933 5-Star 69,502 57,674 61,427 68,086 72,570 78,935 4-Star 162,962 131,647 143,159 142,686 153,980 170,022 3-Star 32,831 28,022 26,908 28,769 26,848 27,282 2-Star n/a n/a 1,135 5,139 6,323 16,694
Other collective accommodation1 15,459 12,826 13,111 6,358 10,499 9,1441 Comprises guesthouses, holiday complexes and hostelsSource: NSO Collective Accommodation Survey (Accomstat).
Table 6.12. Total tourist nights
MALTA
Malta
Gozo and Comino
51

2012 2013 2012 2013Malta Gozo and Comino
Resident 55.4 58.3 33.9 38.3Non-resident 2.0 1.8 12.9 13.9Total 57.4 60.2 46.8 52.1
-
10.0
20.0
30.0
40.0
50.0
60.0
per c
ent
Chart 6.1. Net use of bed-places in collective accommodation establishments by region
52

Total Hotels 5-Star 4-Star 3-Star 2-Star OtherResident 2.2 2.2 2.3 2.0 2.8 2.0 2.7Non-resident 6.2 5.9 4.5 6.8 5.8 3.6 10.2Total 5.9 5.6 4.3 6.4 5.7 3.3 9.9
-
2.0
4.0
6.0
8.0
10.0
per c
ent
Chart 6.2. Average length of stay in Malta: 2013
Total Hotels 5-Star 4-Star 3-Star 2-Star OtherResident 2.0 2.0 2.3 1.9 1.7 2.3 1.9Non-resident 5.3 5.3 4.9 6.2 3.4 3.3 3.9Total 3.7 3.7 3.6 4.3 2.5 2.6 3.3
-1.0 2.0 3.0 4.0 5.0 6.0 7.0
per c
ent
Chart 6.3. Average length of stay in Gozo and Comino: 2013
53

2010 2011 2012 2013
Total traffic: 2,733 1,021 3,544 2,482 Transit 2,733 1,021 3,537 2,482 Landed 0 0 7 0
Nationality: EU 1,050 859 1,184 1,173 of which:
France 287 299 213 56 Germany 14 347 88 567 Italy 15 8 23 29 Malta 0 1 0 0 Spain 77 5 19 17 United Kingdom 223 109 520 373
Non-EU 1,683 162 2,360 1,309 of which:
Australia 90 6 331 329 Canada 292 14 178 78 Japan 2 0 2 4 United States 1,010 77 1,615 674
Sex: Males 1,250 458 1,591 1,173 Females 1,483 563 1,953 1,309
Age group: 0-19 324 36 92 64 20-39 335 99 183 102 40-59 966 90 831 572 60-79 1,015 551 2,123 1,549 80+ 93 245 315 195
Cruise liner calls 5 7 14 13
Table 6.13. Cruise liner calls: Gozo and Comino
54

7. Land and Sea Transport


2008 2009 2010 2011 2012 2013
MALTA 15,007 14,877 13,727 14,264 14,546 14,070Malta 14,242 14,131 13,068 13,571 13,822 13,413
Southern Harbour 3,204 3,289 3,078 3,209 3,154 3,036
Northern Harbour 5,957 5,742 5,182 5,451 5,481 5,313
South Eastern 1,382 1,309 1,275 1,286 1,344 1,264
Western 1,543 1,578 1,530 1,610 1,633 1,647
Northern 2,156 2,213 2,003 2,015 2,210 2,153
Gozo and Comino 765 746 659 693 724 657
2008 2009 2010 2011 2012 2013
MALTA 1,172 1,069 1,079 1,577 1,599 1,582Malta 1,107 992 1,005 1,492 1,510 1,493
Southern Harbour 259 235 249 336 377 353
Northern Harbour 378 305 254 447 471 473
South Eastern 116 117 126 216 155 174
Western 115 121 129 206 200 217
Northern 239 214 247 287 307 276
Gozo and Comino 65 77 74 85 89 89
Table 7.1. Road traffic accidents by district/region
Table 7.2. Road traffic casualties by district/region
57

Slight Grievous Fatal Total Slight Grievous Fatal Total
MALTA 547 142 10 699 794 157 12 963
Malta 515 138 10 663 758 138 11 907
Southern Harbour 128 29 2 159 188 22 3 213
Northern Harbour 177 39 3 219 235 44 1 280
South Eastern 56 14 2 72 93 22 1 116
Western 50 20 0 70 117 21 2 140
Northern 104 36 3 143 125 29 4 158
Gozo and Comino 32 4 0 36 36 19 1 56
Table 7.4. Injuries sustained by passengers in road traffic accidents by district/region
Slight Grievous Fatal Total Slight Grievous Fatal Total
MALTA 29 12 0 41 334 34 1 369
Malta 29 11 0 40 312 33 1 346
Southern Harbour 7 1 0 8 75 8 0 83
Northern Harbour 14 3 0 17 87 6 1 94
South Eastern 1 3 0 4 37 5 0 42
Western 2 1 0 3 50 4 0 54
Northern 5 3 0 8 63 10 0 73
Gozo and Comino 0 1 0 1 22 1 0 23
Table 7.3. Injuries sustained by drivers in road traffic accidents by district/region
2008 2013
2008 2013
58
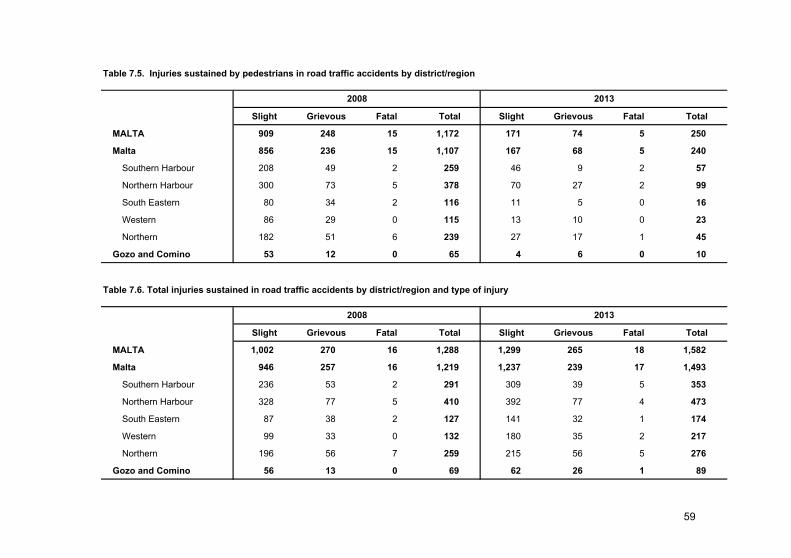
Table 7.5. Injuries sustained by pedestrians in road traffic accidents by district/region
Slight Grievous Fatal Total Slight Grievous Fatal Total
MALTA 909 248 15 1,172 171 74 5 250
Malta 856 236 15 1,107 167 68 5 240
Southern Harbour 208 49 2 259 46 9 2 57
Northern Harbour 300 73 5 378 70 27 2 99
South Eastern 80 34 2 116 11 5 0 16
Western 86 29 0 115 13 10 0 23
Northern 182 51 6 239 27 17 1 45
Gozo and Comino 53 12 0 65 4 6 0 10
Table 7.6. Total injuries sustained in road traffic accidents by district/region and type of injury
Slight Grievous Fatal Total Slight Grievous Fatal Total
MALTA 1,002 270 16 1,288 1,299 265 18 1,582
Malta 946 257 16 1,219 1,237 239 17 1,493
Southern Harbour 236 53 2 291 309 39 5 353
Northern Harbour 328 77 5 410 392 77 4 473
South Eastern 87 38 2 127 141 32 1 174
Western 99 33 0 132 180 35 2 217
Northern 196 56 7 259 215 56 5 276
Gozo and Comino 56 13 0 69 62 26 1 89
2008 2013
2008 2013
59
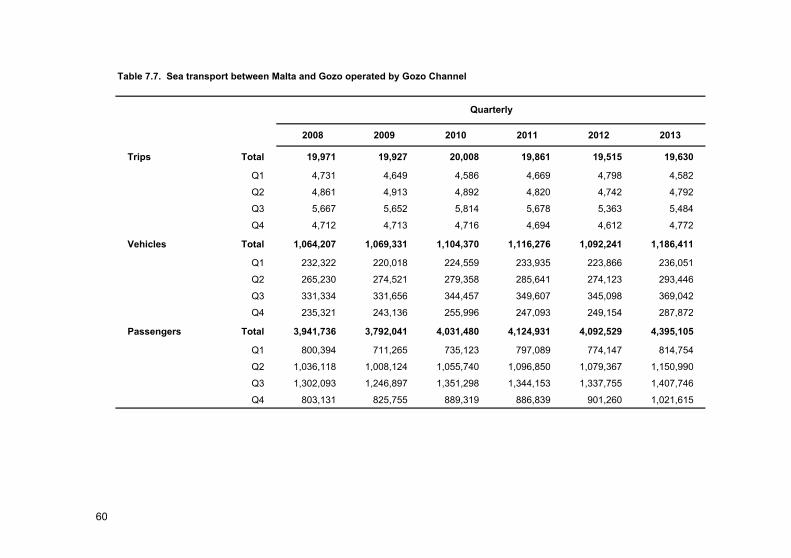
2008 2009 2010 2011 2012 2013
Trips Total 19,971 19,927 20,008 19,861 19,515 19,630
Q1 4,731 4,649 4,586 4,669 4,798 4,582
Q2 4,861 4,913 4,892 4,820 4,742 4,792
Q3 5,667 5,652 5,814 5,678 5,363 5,484
Q4 4,712 4,713 4,716 4,694 4,612 4,772
Vehicles Total 1,064,207 1,069,331 1,104,370 1,116,276 1,092,241 1,186,411
Q1 232,322 220,018 224,559 233,935 223,866 236,051
Q2 265,230 274,521 279,358 285,641 274,123 293,446
Q3 331,334 331,656 344,457 349,607 345,098 369,042
Q4 235,321 243,136 255,996 247,093 249,154 287,872
Passengers Total 3,941,736 3,792,041 4,031,480 4,124,931 4,092,529 4,395,105
Q1 800,394 711,265 735,123 797,089 774,147 814,754
Q2 1,036,118 1,008,124 1,055,740 1,096,850 1,079,367 1,150,990
Q3 1,302,093 1,246,897 1,351,298 1,344,153 1,337,755 1,407,746
Q4 803,131 825,755 889,319 886,839 901,260 1,021,615
Table 7.7. Sea transport between Malta and Gozo operated by Gozo Channel
Quarterly
60
0
50
100
150
200
250
300
350
400
0
200
400
600
800
1,000
1,200
1,400
1,600
2008 2009 2010 2011 2012 2013
vehi
cles
(000
s)
pass
enge
rs (0
00s)
Chart 7.1. Sea transport between Malta and Gozo
Passengers Vehicles Linear (Passengers) Linear (Vehicles)
61

Table 7.8. Yacht marinas/mooring areas in Malta and Gozo: 2013
Permanent Marinas Amount
Grand Harbour Marina 250
Creek Developments plc 744
Gżira Gardens Marina 55
Portomaso Marina 110
Manoel Island Marina 204
Laguna Marina 40
Mġarr Harbour Marina (Gozo) 227
Kalkara Yacht Marina 110
Sandy Marina 75
Seasonal Marinas Amount
Royal Malta Yacht Club 68
Total Number of Berths 1,883
Berthing Capacity
62

Table 7.9. Stock of licensed vehicles as at end of year by vehicle group and district/region: 2013
Total 55,947 91,131 46,271 47,500 53,115 28,992 4
Agricultural 138 51 330 391 410 438 0
Coach and private bus 41 59 99 16 73 56 0
Minibus 219 273 159 142 231 99 0
Route bus 2 234 1 0 0 1 0
Motorcycle 2,561 4,473 2,158 2,047 2,157 3,504 1
Passenger car 46,550 75,932 36,304 37,018 40,901 19,388 3
Goods-carrying vehicle 5,812 9,263 6,525 7,244 8,386 5,056 0
Special purpose vehicle 484 586 580 465 686 317 0
Road tractor 140 260 115 177 271 133 0
Northern Gozo and Comino UnknownVehicle group Southern
HarbourNorthern Harbour
South Eastern Western
63

8. Water and Waste

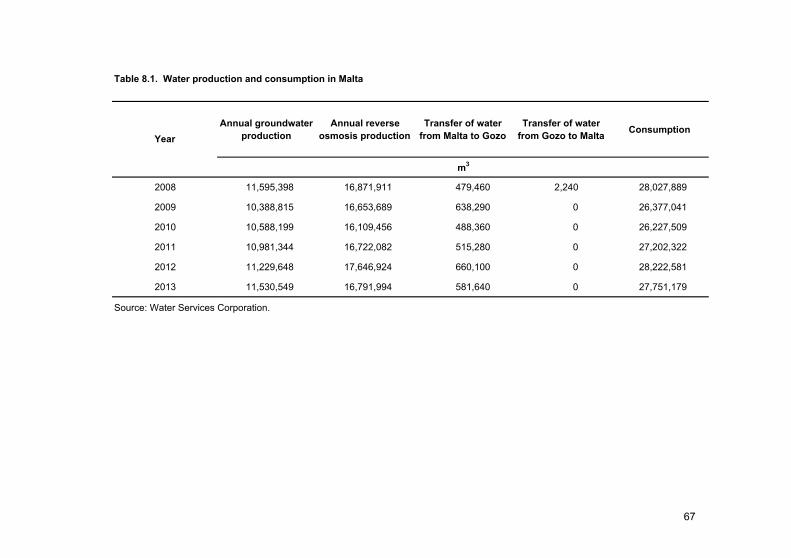
Annual groundwater production
Annual reverse osmosis production
Transfer of water from Malta to Gozo
Transfer of water from Gozo to Malta Consumption
2008 11,595,398 16,871,911 479,460 2,240 28,027,889
2009 10,388,815 16,653,689 638,290 0 26,377,041
2010 10,588,199 16,109,456 488,360 0 26,227,509
2011 10,981,344 16,722,082 515,280 0 27,202,322
2012 11,229,648 17,646,924 660,100 0 28,222,581
2013 11,530,549 16,791,994 581,640 0 27,751,179
Source: Water Services Corporation.
Table 8.1. Water production and consumption in Malta
m3
Year
67

Annual groundwater production
Annual reverse osmosis
production
Transfer of water from Gozo to Malta
Transfer of water from Malta to Gozo
Gozo water polishing plant
rejectConsumption
2008 2,480,542 0 2,240 479,460 138,237 2,820,941
2009 2,288,012 0 0 638,290 141,153 2,791,712
2010 2,195,921 0 0 488,360 131,318 2,547,275
2011 2,079,210 0 0 515,280 132,757 2,466,840
2012 2,069,329 0 0 660,100 115,947 2,609,058
2013 2,257,884 0 0 581,640 96,775 2,740,736
Source: Water Services Corporation.
Year
m3
Table 8.2. Water production and consumption in Gozo
68

Table 8.3. Water production and consumption in Malta and Gozo
Annual groundwater production
Annual reverse osmosis production
Gozo water polishing plant reject Consumption
2008 14,075,940 16,871,911 138,237 30,848,830
2009 12,676,827 16,653,689 141,153 29,168,753
2010 12,784,120 16,109,456 131,318 28,774,784
2011 13,060,554 16,722,082 132,757 29,669,162
2012 13,298,978 17,646,924 115,947 30,831,639
2013 13,788,433 16,791,994 96,775 30,491,914
Source: Water Services Corporation.
m3
Year
69

0
4,000
8,000
12,000
16,000
20,000
2008 2009 2010 2011 2012 2013
m3
(000
s)
Chart 8.1. Water production in Malta and Gozo
Malta groundwater production Gozo groundwater production Reverse osmosis production
0
5,000
10,000
15,000
20,000
25,000
30,000
35,000
2008 2009 2010 2011 2012 2013
m3
(000
s)
Chart 8.2. Water consumption in Malta and Gozo
Malta Gozo
70

tonnes
Waste collected from Gozo
Municipal Construction and demolition Industrial and other Municipal
2008 249,718 9,147 12,685 15,990 287,540
2009 238,307 2,886 12,219 16,718 270,130
2010 202,108 2,139 18,202 14,401 236,850
2011 152,032 922 65,191 13,670 231,814
2012 147,526 1,536 90,303 13,359 252,724
2013 134,981 860 90,096 13,197 239,134
Note: Data for Gozo are partial since there is no public waste deposit amenity.
Table 8.4. Waste disposed of at the public waste deposit sites
Waste collected from Malta
TotalYear
71

tonnesMrieħel Site Żwejra Site Ħal Far Site Luqa Site Tal-Kus (Gozo) Site Total Sites
2008 9,380 3,532 1,831 179 0 14,922
2009 9,185 3,727 2,400 3,738 445 19,496
2010 8,400 3,295 2,385 4,792 1,646 20,519
2011 9,078 3,087 2,211 5,903 1,498 21,778
2012 8,226 3,175 2,187 4,731 1,612 19,931
Table 8.5 Separate waste collected at Civic Amenity sites
0
400
800
1,200
1,600
2,000
Paper Plastic Cans Glass Paper Plastic Cans Glass
Malta Gozo and Comino
tonn
es
Chart 8.3. Waste collected from bring-in sites
2008 2012
72

9. Rural and Urban


Table 9.1. Urban statistics
2008 2009 2010 2011 2012 2008 2009 2010 2011 2012
Number of car thefts per 1,000 cars 1.4 1.3 1.3 1.3 1.1 0.6 1.7 0.3 0.2 0.1
Number of reported domestic burglaries per 1,000 households 5.6 6.1 4.9 5.1 5.6 4.3 1.7 2.7 2.2 1.9
Gozo and CominoMalta
Table 9.2. Land cultivation
per cent
2010 2013 2010 2013
Land under cultivation 36.0 33.0 37.4 39.7
Malta Gozo and Comino
75

In hectares (Ha)
MALTA Malta Gozo and Comino
Ha Ha Ha
Total arable land 8,572 100.0 6,223 100.0 2,349 100.0
Potatoes 689 8.0 659 10.6 30 1.3
Flowers and seeds 34 0.4 22 0.4 11 0.5
Forage plants 5,290 61.7 3,340 53.7 1,950 83.0
Fallow land 563 6.6 474 7.6 89 3.8
Vegetables 1,996 23.3 1,728 27.8 268 11.4
Table 9.3. Distribution of arable land by type and region: 2013
Type of arable land Per cent Per cent Per cent
0
1,000
2,000
3,000
Potatoes Flowers and seeds Forage plants Fallow land Vegetables
ha Chart 9.1. Distribution of arable land: 2013
Malta Gozo and Comino
76

In hectares (Ha)
MALTA Malta Gozo and Comino
Ha Ha Ha
Total permanent crops 1,264 100.0 1,094 100.0 170 100.0
Fruit and berry plantations 386 30.5 348 31.8 38 22.2
Citrus plantations 90 7.1 37 3.4 54 31.5
Olive plantations 104 8.2 86 7.9 17 10.1
Vineyards 683 54.0 621 56.8 62 36.2
Nurseries 2 0.2 2 0.2 0 0.0
Table 9.4. Distribution of permanent crops by type and region: 2013
Type of arable land Per cent Per cent Per cent
77

tonnes €000s tonnes €000s
Malta2008 39,393 15,885 2,278 2,6392009 36,030 15,756 2,463 2,5912010 37,802 15,194 2,041 2,5742011 38,858 15,016 2,526 2,3692012 35,021 15,328 2,204 2,2212013 37,072 15,080 1,756 2,476
Gozo2008 4,766 2,182 782 4692009 3,782 2,063 623 4642010 3,438 1,984 593 4582011 3,607 1,755 696 3902012 3,521 1,789 490 3522013 3,828 1,919 420 329
Table 9.5. Annual volume and wholesale value of fruit and vegetables sold through official markets
Vegetables Fruit
78

Table 9.6. Livestock in numbers
Cattle Pigs Sheep Goats
Malta
2008 11,905 61,183 8,667 5,072
2009 10,787 61,851 8,909 4,706
2010 10,044 66,365 8,524 3,928
2011 10,113 43,306 8,563 3,865
2012 10,524 41,748 8,189 3,657
2013 10,041 45,243 7,675 3,418
Gozo
2008 5,872 4,328 4,176 1,289
2009 5,477 4,067 3,980 1,277
2010 4,910 4,228 3,855 1,182
2011 4,961 2,981 3,324 1,073
2012 5,069 3,461 3,508 1,190
2013 5,179 4,208 3,255 1,180
79

Table 9.7. Livestock farms
Cattle Pig Sheep Goat
Malta
2008 327 128 1,034 652
2009 312 125 1,022 646
2010 290 120 957 602
2011 272 104 984 632
2012 259 99 965 596
2013 242 93 960 586
Gozo
2008 56 14 486 231
2009 55 14 466 239
2010 51 11 438 228
2011 50 12 390 214
2012 49 12 427 243
2013 48 12 424 233
80

0%
20%
40%
60%
80%
100%
2008 2013 2008 2013 2008 2013 2008 2013
Cattle Pigs Sheep Goats
Chart 9.2. Percentage distribution of livestock
Gozo and Comino
Malta
0%
20%
40%
60%
80%
100%
2008 2013 2008 2013 2008 2013 2008 2013
Cattle Pig Sheep Goat
Chart 9.3. Percentage distribution of livestock farms
Gozo and Comino
Malta
81

Table 9.8. Quantity of fish landings
kilogrammes
2008 2009 2010 2011 2012 2013
Malta
Shrimp 23,240 32,318 41,750 40,016 29,503 17,366
Stone Bass 12,092 6,965 13,000 6,014 8,465 7,135
Dorado 90,354 124,947 206,728 102,679 83,058 153,647
Dog-Fish 18,563 15,636 21,746 19,012 27,616 18,623
Swordfish 251,563 228,366 316,688 298,101 211,309 300,229
Blue Fin Tuna 136,895 155,150 124,276 77,111 117,852 77,380
Bogue 7,684 5,797 7,769 17,309 10,027 8,993
Other Species 128,349 148,356 196,977 192,510 215,681 175,291
Gozo and Comino
Shrimp 7,738 4,719 1,822 1,734 3,230 2,257
Stone Bass 1,733 1,602 2,176 2,864 2,791 2,090
Dorado 154,461 207,481 222,882 91,284 53,535 120,965
Dog-Fish 4,598 1,983 3,660 7,414 10,428 6,076
Swordfish 9,461 8,518 13,140 8,461 17,197 37,923
Blue Fin Tuna 5,351 30,330 6,657 4,096 2,992 2,941
Bogue 7,391 5,914 4,864 5,617 11,083 7,473
Other Species 41,993 237,109 109,344 303,675 235,125 47,905
82

Table 9.9. Value of fish landings
€
2008 2009 2010 2011 2012 2013
Malta
Shrimp 336,080 457,975 682,203 713,225 442,339 291,697
Stone Bass 110,739 61,762 98,168 60,028 75,473 68,315
Dorado 287,689 353,583 540,286 460,932 505,744 621,861
Dog-Fish 48,229 40,788 56,426 49,633 62,847 46,440
Swordfish 1,854,728 1,701,648 2,279,719 2,083,102 1,575,029 2,034,203
Blue Fin Tuna 1,165,785 1,041,821 715,125 591,688 1,270,040 649,721
Bogue 19,291 16,659 22,119 45,407 27,641 26,889
Other Species 805,336 910,000 1,074,178 1,237,558 1,301,093 1,228,818
Gozo and Comino
Shrimp 104,610 60,514 26,580 28,761 43,711 28,315
Stone Bass 14,604 14,127 20,236 29,490 25,609 18,989
Dorado 455,277 519,797 508,847 389,854 336,171 478,918
Dog-Fish 12,277 5,242 8,049 18,687 20,991 16,304
Swordfish 74,308 60,134 96,343 49,436 148,368 278,981
Blue Fin Tuna 47,886 215,194 41,111 25,629 29,196 20,633
Bogue 18,111 12,466 11,726 13,750 22,826 15,713
Other Species 200,606 254,130 290,092 351,949 351,906 183,396
83

0%
20%
40%
60%
80%
100%
2008 2013 2008 2013 2008 2013 2008 2013 2008 2013 2008 2013 2008 2013 2008 2013
Shrimp Stone Bass Dorado Dog-Fish Swordfish Blue Fin Tuna Bogue Other Species
Chart 9.4. Percentage distribution of fish landings
Malta Gozo and Comino
84

Total Luzzu Kajjik Firilla Bimbu Other
Malta
2008 2,396 15 1,009 1,372 255 770 23 36 288
2009 2,496 20 1,070 1,406 252 771 21 36 326
2010 2,534 21 1,113 1,400 247 775 21 35 322
2011 2,538 22 1,129 1,387 243 774 21 36 313
2012 2,532 22 1,136 1,374 241 768 22 35 308
2013 2,512 18 1,151 1,343 231 757 21 35 299
Gozo and Comino
2008 404 2 141 261 58 166 0 4 33
2009 419 2 148 269 58 169 0 4 38
2010 434 2 154 278 58 175 0 5 40
2011 437 1 160 276 55 175 0 5 41
2012 437 1 162 274 53 175 1 5 40
2013 440 0 163 277 55 176 1 5 40
Table 9.10. Fishing vessels by region and type
Total
Type of vessel
Trawlers MPV Other fishing vessel
85

MFA MFB MFC
Malta
2008 2,396 315 559 1,522
2009 2,496 315 552 1,629
2010 2,534 307 550 1,677
2011 2,538 295 539 1,704
2012 2,532 321 506 1,705
2013 2,512 315 492 1,705
Gozo and Comino
2008 404 93 159 152
2009 419 90 154 175
2010 434 89 151 194
2011 437 83 137 217
2012 437 82 132 223
2013 440 83 133 224
MFA: Professional Fishing Vessels - Full-timeMFB: Professional Fishing Vessels - Part-timeMFC: Non-Commercial Fishing Vessels i.e. Recreational
Table 9.11. Fishing vessels by region and licence
TotalType of licence
86

10. Social Protection


Table 10.1. Injury benefit claimants by district/region of enterprise
No % No % No % No % No % No %
MALTA 3,499 100.0 524 100.0 4,023 100.0 2,572 100.0 547 100.0 3,119 100.0
Malta 3,423 97.8 517 98.7 3,940 97.9 2,535 98.6 540 98.7 3,075 98.6
Southern Harbour 1,396 39.9 207 39.5 1,603 39.8 881 34.3 200 36.6 1,081 34.7
Northern Harbour 870 24.9 187 35.7 1,057 26.3 732 28.5 181 33.1 913 29.3
South Eastern 456 13.0 42 8.0 498 12.4 348 13.5 68 12.4 416 13.3
Western 276 7.9 31 5.9 307 7.6 236 9.2 49 9.0 285 9.1
Northern 425 12.1 50 9.6 475 11.8 338 13.1 42 7.7 380 12.2
Gozo and Comino 76 2.2 7 1.3 83 2.1 37 1.4 7 1.3 44 1.4
Males Females Total
2008 2013
Males Females Total
89
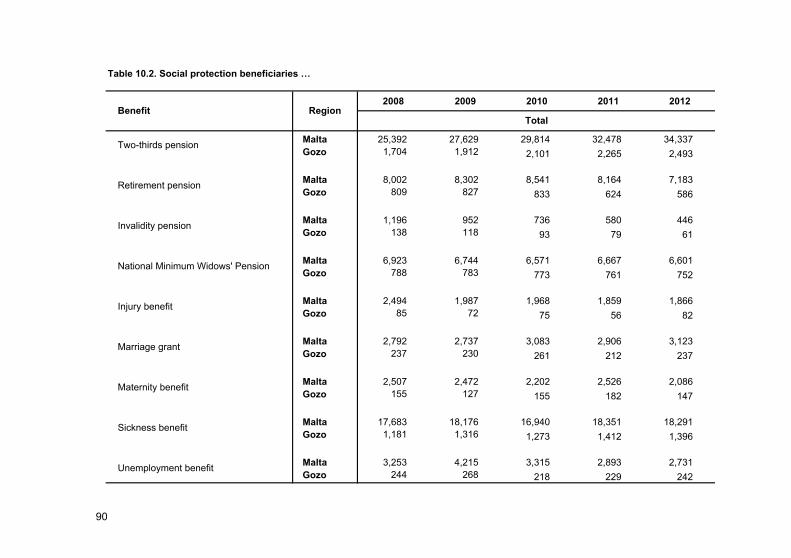
2008 2009 2010 2011 2012
Malta 25,392 27,629 29,814 32,478 34,337 Gozo 1,704 1,912 2,101 2,265 2,493
Malta 8,002 8,302 8,541 8,164 7,183 Gozo 809 827 833 624 586
Malta 1,196 952 736 580 446 Gozo 138 118 93 79 61
Malta 6,923 6,744 6,571 6,667 6,601 Gozo 788 783 773 761 752
Malta 2,494 1,987 1,968 1,859 1,866 Gozo 85 72 75 56 82
Malta 2,792 2,737 3,083 2,906 3,123 Gozo 237 230 261 212 237
Malta 2,507 2,472 2,202 2,526 2,086 Gozo 155 127 155 182 147
Malta 17,683 18,176 16,940 18,351 18,291 Gozo 1,181 1,316 1,273 1,412 1,396
Malta 3,253 4,215 3,315 2,893 2,731 Gozo 244 268 218 229 242
Table 10.2. Social protection beneficiaries …
Marriage grant
Maternity benefit
Benefit Region
Two-thirds pension
Retirement pension
Invalidity pension
National Minimum Widows' Pension
Total
Injury benefit
Sickness benefit
Unemployment benefit
90

2008 2009 2010 2011 2012
Malta 28,099 26,155 25,277 24,456 22,282 Gozo 2,277 2,112 1,963 1,801 1,683
Malta 12,934 12,426 12,593 12,893 12,496 Gozo 1,366 1,295 1,251 1,201 1,165
Malta 7,683 7,553 7,739 8,031 7,868 Gozo 359 328 329 354 363
Malta 2,581 2,833 3,040 3,131 3,197 Gozo 84 85 91 91 105
Malta 4,938 5,143 5,373 5,574 5,371 Gozo 542 536 542 483 513
Malta 26,265 25,206 24,670 24,953 24,448 Gozo 2,798 2,671 2,491 2,397 2,357
… Table 10.2. Social protection beneficiaries
Benefit RegionTotal
Unemployment assistance
Supplementary allowance
Childrens' allowance (means-tested)
Sickness assistance
Social assistance
Social assistance for single unmarried parents
91


11. Culture


Total 489 393 121 74 62 44 92 96 7.2General public events Agrarian feast 15 12 - 3 1 2 6 3 0.2 Arts festival 54 43 23 6 4 1 9 11 0.8 Commemoration day 61 46 17 8 6 6 9 15 0.9 Crafts 22 18 5 4 4 3 2 4 0.3 Cultural visit 43 28 5 1 9 1 12 15 0.6 Dance 10 8 1 1 1 1 4 2 0.1 Drama 16 13 3 3 2 5 - 3 0.2 Film 2 2 2 - - - - - 0.0 Gastronomy 16 14 2 4 4 3 1 2 0.2 Heritage exhibition 6 4 1 - 1 1 1 2 0.1 Heritage trail 27 26 2 2 7 1 14 1 0.4 Historical re-enactment 19 16 9 1 2 1 3 3 0.3 Literature 19 18 5 7 - 3 3 1 0.3 Music 49 35 7 8 8 6 6 14 0.7 Non-direct cultural activity 46 39 11 18 - 4 6 7 0.7 Public lecture 8 7 2 - 3 - 2 1 0.1 Religious 38 35 16 5 3 4 7 3 0.6 Visual arts exhibition 16 13 3 1 2 1 6 3 0.2School event 22 16 7 2 5 1 1 6 0.3
Source: Superintendence of Cultural Heritage.
Table 11.1. Cultural events organised by Local Councils by type and district/region: 2012
Average per localityMalta Northern Gozo and
CominoMALTAType of event Southern Harbour
Northern Harbour
South Eastern Western
95

Total 68 100.0 54 100.0 14 100.00 1 1.5 1 1.9 - -
1 8 11.8 7 13.0 1 7.1
2 11 16.2 9 16.7 2 14.3
3 4 5.9 2 3.7 2 14.3
4 5 7.4 5 9.3 - -
5+ 39 57.4 30 55.6 9 64.3
Source: Superintendence of Cultural Heritage.
Table 11.2. Local Councils by number of cultural events and region: 2012
% totalNumber of events Malta % totalMALTA Gozo and Comino % total
Total Average per event Average per locality
MALTA 1,089,770 2,229 16,026 100.0
Malta 791,488 9,815 73,597 72.6
Southern Harbour 351,622 2,906 25,116 32.3
Northern Harbour 96,815 1,308 7,447 8.9
South Eastern 121,649 1,962 11,059 11.2
Western 103,888 2,361 10,389 9.5
Northern 117,514 1,277 19,586 10.8
Gozo and Comino 298,282 3,107 21,306 27.4
Source: Superintendence of Cultural Heritage.
Table 11.3. Expenditure related to cultural events organised by Local Councils: 2012
% total€
District/Region
96

District/Region Number % total
MALTA 848,167 100.0
Malta 741,945 87.5
Southern Harbour 377,898 44.6
Northern Harbour 144,447 17.0
South Eastern 108,079 12.7
Western 43,572 5.1
Northern 67,949 8.0
Gozo and Comino 106,222 12.5
Source: Central Public Library.
Table 11.4. Library book loans: 2012
97

MALTA Malta Gozo and Comino
Total 5,456 4,711 745
Total 2,269 1,943 326Adult 1,666 1,392 274
Adult with additional Junior lending rights 527 487 40
Adult without Maltese citizenship* 68 59 9
Adult foreign visitors* 8 5 3
Total 3,175 2,756 419Junior - 11 years old and under 2,925 2,533 392
Junior - 17 years old and under 224 208 16
Junior - 17 years old and under with additional adult lending rights** 7 7 -
Junior - 11 years old and under without Maltese citizenship* 10 3 7
Junior - 17 years old and under without Maltese citizenship* 2 2 -
Junior foreign visitors* 7 3 4
Total 12 12 -Special needs services / staff members 12 12 -
* Require a Maltese citizen guarantee** Require a written permit from guardiansSource: Central Public Library.
Table 11.5. New members in public libraries: 2012
Type of memberNumber
98

Methodological Notes

1.
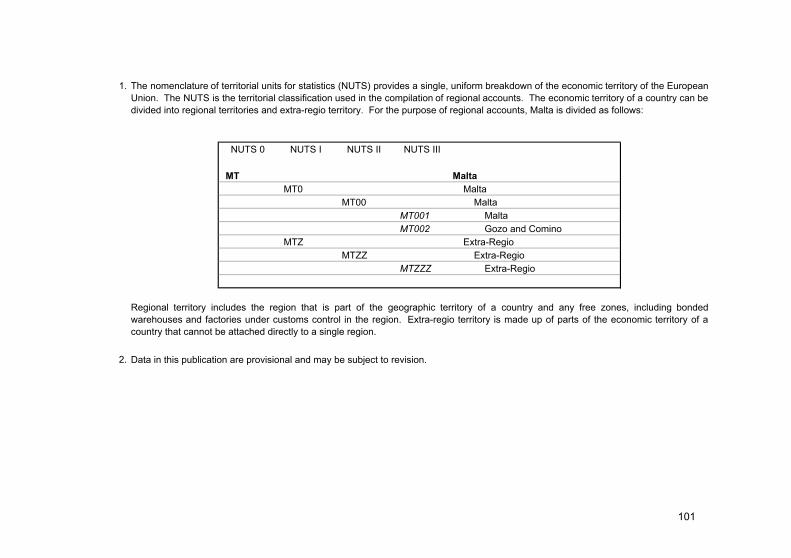
NUTS 0 NUTS I NUTS II NUTS III
MT Malta MT0 Malta
MT00 Malta MT001 Malta MT002 Gozo and Comino
MTZ Extra-Regio MTZZ Extra-Regio
MTZZZ Extra-Regio
2. Data in this publication are provisional and may be subject to revision.
The nomenclature of territorial units for statistics (NUTS) provides a single, uniform breakdown of the economic territory of the EuropeanUnion. The NUTS is the territorial classification used in the compilation of regional accounts. The economic territory of a country can bedivided into regional territories and extra-regio territory. For the purpose of regional accounts, Malta is divided as follows:
Regional territory includes the region that is part of the geographic territory of a country and any free zones, including bondedwarehouses and factories under customs control in the region. Extra-regio territory is made up of parts of the economic territory of acountry that cannot be attached directly to a single region.
101