Governors as Opportunists: Evidence from Disaster ...
25
Governors as Opportunists: Evidence from Disaster Declaration Requests John T. Gasper * Andrew Reeves † Abstract What motivates governors as they interact with the president in requesting aid for a natural disaster? In addition to providing monetary aid to affected areas, previous research shows that governors and presidents also receive votes for taking action after a disaster. In a monthly analysis of disaster declaration requests from 1972 to 2006, we find that governors from swing states request disaster aid above and beyond the amounts suggested by actual need. But this is only true for governors who are not term-limited and can run again. We find no evidence of partisan effects; governors from battleground states request without hesitation from other-party presidents even at election time. While previous research has focused on presidents, we find that election-seeking governors also contribute to the politicization of disaster aid. * Visiting Assistant Professor, 5032 Forbes Ave # 1070, Carnegie Mellon University, Pittsburgh, PA, 15289. http://www.andrew.cmu.edu/∼gasper, [email protected], (862) 438-5841. † Assistant Professor, Department of Political Science, Washington University in St. Louis, Campus Box 1063, One Brooking Drive, St. Louis MO 63130; http://www.andrewreeves.org; [email protected]; (314) 935-8427.
Transcript of Governors as Opportunists: Evidence from Disaster ...

Governors as Opportunists: Evidence from Disaster Declaration
Requests
John T. Gasper∗ Andrew Reeves†
Abstract
What motivates governors as they interact with the president in requesting aid for a naturaldisaster? In addition to providing monetary aid to affected areas, previous research shows thatgovernors and presidents also receive votes for taking action after a disaster. In a monthlyanalysis of disaster declaration requests from 1972 to 2006, we find that governors from swingstates request disaster aid above and beyond the amounts suggested by actual need. But thisis only true for governors who are not term-limited and can run again. We find no evidence ofpartisan effects; governors from battleground states request without hesitation from other-partypresidents even at election time. While previous research has focused on presidents, we findthat election-seeking governors also contribute to the politicization of disaster aid.
∗Visiting Assistant Professor, 5032 Forbes Ave # 1070, Carnegie Mellon University, Pittsburgh, PA, 15289.http://www.andrew.cmu.edu/∼gasper, [email protected], (862) 438-5841.†Assistant Professor, Department of Political Science, Washington University in St. Louis, Campus Box 1063,
One Brooking Drive, St. Louis MO 63130; http://www.andrewreeves.org; [email protected]; (314) 935-8427.

Since the New Deal, the roles of the state and national governments have become increasingly
intertwined. The president and the fifty state governors often engage in formal and informal ne-
gotiations over public policy. Billions of dollars flow between Washington, DC and the fifty state
capitals. How do the political incentives that independently motivate the two officials interact
when they deal with each other? Here, we examine the extent to which governors behave oppor-
tunistically, i.e., the degree to which they take advantage of their state’s electoral importance to
a president when deciding whether to seek federal aid. We find that opportunistic behavior is, in
part, determined by the governor’s own ability to run for reelection.
As other scholars have noted, natural disasters offer an opportunity for officials to showcase their
leadership abilities (Boin et al., 2005; Birkland, 2007). As Schneider (2011) points out, few citizens
ask whether governments should play a role. Rather, these times of hardship are seen as public
problems requiring governmental intervention. Rubin and Barbee (1985) highlights the role of
intergovernmental relations and points out key interactions between local, state, and federal officials
tempers post-disaster policy. In this paper, we focus on one element of the interaction between
state and federal government, namely, the decision of a governor to request federal assistance in
the aftermath of a natural disaster.
Both scholarly research and political intuition suggest that federal aid for natural disasters may
be used for electoral gain. As one Democratic party operative stated, disaster relief is “an amalgam
of ambulance-chasing and pork barrel” that, once delivered by politicians, is “rewarded with votes”
(qtd in Mathews et al., 1992). Scholarly studies reach similar conclusions. Garrett and Sobel (2003)
and Reeves (2011) find that presidents target disaster declarations to electorally important states.
Both of these studies focus on the presidential act of granting a request without considering the
electoral motivations of governors in much detail.1 While several studies show that presidents are
rewarded for disaster declarations (Gasper and Reeves, 2011; Reeves, 2011), recent research shows
that governors are, in fact, rewarded at higher levels than the commander-in-chief. In a study of
county-level electoral returns, Gasper and Reeves (2011) finds that while presidents see about half a
point increase in vote share for a disaster declaration, governors see a nearly 4 point increase. This
suggests that, while presidents are highly motivated to strategically allocate disaster declarations,
governors might have an even stronger incentive to request it.
1Both Reeves (2011) and Garrett and Sobel (2003) control for gubernatorial partisanship, and find no effect.

Despite the electoral benefits of disaster declarations, we find that, for some governors, objective
measures of damage are the only predictor of requests. Yet for other governors, political considera-
tions influence their decisions to request aid. For this subset, governors’ requests are determined by
political factors. Specifically, these governors consider their strategic electoral importance to the
president when deciding to request. We refer to this behavior as opportunism. The primary observ-
able implication of opportunism is that governors from battleground states will be more likely to
request help from the president. We consider several implications of this behavior. First, we argue
that only governors facing particular incentives will be opportunistic. Namely, we hypothesize that
only reelection eligible governors will engage in opportunistic behavior because they are especially
driven to maintain balance between taxation and spending (Besley and Case, 1995; Alt, Bueno de
Mesquita, and Rose, 2011); federal aid, in the form of disaster declarations, supports this aim by
offsetting costs from severe weather events. Battleground state governors not bound by term limits
face incentives to seek more resources for their states and will do so by leveraging their electoral
importance to the president when requesting federal aid.
In the sections that follow, we study gubernatorial disaster declaration requests for every month
in every state from 1972 to 2006. We detail how governors behave as opportunists and how this
behavior is influenced by the electoral incentives of the governor. We also consider the role of party
in the negotiations between a governor and president. Examining the party influence allows us to
examine a governor with conflicting motivations. In particular, a governor from a battleground
state faces the prospect of requesting electorally beneficial aid from an other-party president. Ul-
timately we find that re-election eligible governors are more opportunistic then their term-limited
counterparts. We also find that when a reelection-eligible governor is strategically positioned to
request aid from an other-party president party concerns matter very little.
1 Disaster politics and gubernatorial opportunism
We examine the extent to which governors are opportunistic by anticipating their state’s electoral
importance to the president when they request federal aid. More generally, opportunism is when
an actor leverages her strategic importance to another actor when requesting resources.2 While all
2We see analogous opportunistic behavior in international relations. For example, Kuziemko and Werker (2006)finds that a seat on the U.N. Security Council brings more U.S. and U.N. aid and this amount increases when

governors are sensitive to the amount of destruction caused by a disaster, we examine the extent
to which some governors’ decisions to request federal aid are also a function of political factors.
To the extent that governors are opportunistic, those from presidential battlegrounds will be more
likely to request aid. The more crucial their state is for the presidential election, the more likely
the governors will be to request.
Instances of severe weather provide an ideal opportunity for studying responses of political
actors. Severe weather events are exogenous to the political system; however, the responses of
politicians may be a direct function of political considerations. Other scholars have used disasters
to study the ways in which voters (Achen and Bartels, 2004; Healy and Malhotra, 2009; Gasper
and Reeves, 2011; Schneider and Jacoby, 2003), politicians (Garrett and Sobel, 2003; Reeves, 2011;
Sylves and Buzas, 2007; McCarthy, 2010; Salkowe and Chakraborty, 2009), and political parties
(Barnhart, 1925) respond to these acts of nature. Presidential disaster declarations are the first step
in the federal response to severe weather damage. When severe weather strikes, a governor may
request federal assistance. This request is initiated by the governor and, along with a recommenda-
tion from a regional FEMA office, is then passed to the president. Once the president receives this
request, it is his decision alone whether to grant or deny it. This is a sequential process with the
governor having unilateral control over initiation and the president having unilateral control over
accepting or rejecting the request.3 The stimulus for action is exogenous to the political system,
and the responses are those of the governor and president alone.4 A state that receives a disaster
declaration can expect federal dollars, access to loans, and other resources provided by the federal
government. For example, In fiscal year 2009, FEMA distributed over six billion dollars to states,
the bulk of which went for disaster relief (US Census Bureau, 2010, 10).
One might believe, or perhaps hope, that governors request this disaster relief only as a function
of need without regard to political variables. This conjecture is our null hypothesis. Alternatively,
important events come before the Council. In the international context, a nation may leverage its strategic diplomaticimportance to the U.S. in order to request more aid.
3The prerequisites for a gubernatorial request are not trivial. In addition to a preliminary damage assessmentconducted with the help of regional FEMA offices, the Stafford Act requires that the governor execute the state’semergency plan. The governor must also provide information detailing the efforts and resources which have beenor will be used (Sylves, 2008). And while the president’s decision to grant or turn down the request is his alone,the Federal Emergency Management Agency (FEMA) and it’s regional offices provide guidance to both the affectedstates and the president. There are broad guidelines that govern the recommendation from a regional FEMA office,such as the severity or magnitude of the event and whether the incident goes beyond the capabilities of the affectedlocal governments, but these are guidelines that the president can ignore.
4Legislators are statutorily absent from the disaster declaration process.

political factors, orthogonal to actual need, may also shape the decision to request. We posit that,
in addition to actual need, opportunistic governors request because they anticipate the president
will be more likely to grant aid. This expectation is based on states’ electoral importance to
presidents. Given conventional political wisdom and scholarly research, opportunistic governors
likely act with the belief that presidents use disaster declarations to gain votes. This may cause
theses governors’ decisions to requests to be influenced by presidential electoral incentives. Because
of the nature of the electoral college, competitive states are particularly important and readily
identifiable. The all-or-nothing allocation of electoral votes means that states that are competitive
are disproportionately important to the president (Brams and Davis, 1974; Bartels, 1985). Even
though a candidate may win only a plurality of votes, he still receives the state’s entire block
of electoral votes.5 With this in mind, other studies have found evidence that presidents curry
favor with competitive states that are important for an electoral college victory. For instance
James (2000) argues that the development of the regulatory state was dramatically influenced
by the Democratic Party targeting a block of electoral votes at the end of the nineteenth and
beginning of the twentieth centuries. (Wright, 1974, 30) examines the New Deal era and finds
that the distribution of federal spending can, in part, be explained by “a process of maximizing the
expected electoral votes.” Reeves (2011) and Garrett and Sobel (2003) specifically examine disaster
declarations and find that the presidential electoral competitiveness of the state is associated with
an increased number of awards. Opportunistic governors realize this, anticipate the president’s
response, and take advantage of their states’ strategic importance when considering whether to
request aid.
The opportunistic governor will leverage her state’s electoral importance during a presidential
election year because this is when the president responds most directly to electoral concerns. Since
voters tend to be myopic, considering only recent events in their evaluations of incumbents, incum-
bent politicians may redouble their political efforts during the campaign season. Scholarly findings
both on the behavior of voters (e.g. Kramer, 1971; Fiorina, 1981) as well as the response of politi-
cians (e.g. Tufte, 1978; Bartels, 2008) support this view. Given this understanding of presidential
electoral incentives, we develop our main hypothesis. If governors are opportunistic, then gover-
5Today this is true for all states except Nebraska and Maine. These states allocate their electoral votes based ona district system.

nors from electorally important states, i.e., states that are competitive in presidential elections,
during electorally opportune times, i.e., during presidential election years, are more likely to re-
quest a presidential disaster declaration than other governors. We refer to this as the opportunistic
hypothesis.
We refine this expectation further and posit an ancillary condition for opportunism. Our re-
election hypothesis is that only governors who are not bound by term limits will be opportunistic.
Term limits condition gubernatorial behavior. As other studies have shown, reelection eligible gov-
ernors are particularly sensitive to maintaining this fiscal balance between taxes and spending. For
example, Besley and Case (1995) examines state-level spending and taxation from 1950 to 1986
and finds that term-limited politicians “care less about reputation” and therefore “reduce the effort
expended to keep taxes and expenditures down” (p. 781).6 This previous research also examines
state budgets in the aftermath of natural disasters and finds that “only governors who may run
for reelection. . . change their behavior in the face of a natural disaster” by adjusting state finances
(p. 789). While Besley and Case (1995) examines state budgets, we hypothesize that the effect
of term limits will exert a similar force in gubernatorial negotiations with the president. In addi-
tion to being an implication of existing research on the topic, it provides leverage on a competing
mechanism.
One concern is that any relationship is driven, not by the governor, but by the president.
Governors could request only as a function of need, but presidents may be more likely to approve
the request for an electorally important state. If this is so, we should observe no difference in the
effect of competitiveness between term-limited governors and those who can run again. If presidents
are driving the relationship then they will not care whether the governor can run for reelection.
Our expectation about the effect of gubernatorial term limits enables us to examine the extent to
which governors are independently driving the politicization of the disaster declaration process. If
the president was simply approving more requests from governors from battleground states, then we
should see no difference between term-limited and reelection-eligible governors from battleground
states.
In this section, we have developed a framework of governors as opportunists. Our main op-
portunistic hypothesis is that governors will request a disaster declaration from a president as a
6For similar findings from a more recent time period, see Alt, Bueno de Mesquita, and Rose (2011).

function of their states’ electoral importance. Because of the political forces that governors face, we
refine our expectations further. We argue that only those governors not bound by term limits will
engage in opportunism. We refer to this as the reelection hypothesis. Finally, we consider the parti-
san influences that governors face. For governors not facing any of the institutional characteristics
described above, we expect to see requests only as a function of natural disaster damage.
2 Data and methods
We now turn to the empirical analysis of gubernatorial disaster requests. We analyze governors’
decisions to request federal disaster aid from the president in monthly data in all states from 1972
through 2006. While controlling for the severity of the natural disasters, we test the hypotheses
outlined in the previous section.
Our dependent variable is an indicator of the monthly decision of a governor to request a
federal disaster declaration from the president. A case is a given month for a particular state and
year. We construct this data based on a list of presidential disaster declaration requests7 provided
by the Public Entity Risk Institute8 as well as the FEMA website.9 For each case we include a
binary indicator for whether we observe a disaster declaration request. There are months where a
governor will request more than one disaster declaration, but these cases are rare. Multiple requests
for disaster declarations occur for less than eight-tenths of a percent of the cases during the thirty
five years of data.
We limit our analysis to the approximately 17,000 cases that had nonzero damage over the
current month or the previous two months (we describe our measure of damage below) and provide
a description of the data with this restriction.10 With this restriction, ten percent of cases see a
disaster declaration.11 From 1972 through 2006 there were 1,845 requests. No state had fewer than
ten requests for a disaster declaration (Wyoming), while the Texas had the most with 107. On
7The date of the request reflects when the president either approved or denied the request. A government studyexamining one fiscal year of disaster declarations found that it took governors, on average, about ten days to requesta declaration. It then took the White House, on average, ten days between the time of the request and a presidentialdecision (United States General Accounting Office, 1989).
8http://www.peripresdecusa.org/9http://www.fema.gov/
10We also exclude cases where the governor was neither a Republican nor Democrat.11Nearly nine percent of cases see a disaster declaration request without this restriction

average, states saw 37 requests and averaged 1.2 requests each year.12
We measure the presidential competitiveness of a state as the loser’s vote share of the statewide
vote in the previous presidential general election.13 This produces a zero to .5 scale indicating
non-competitive to most competitive respectively. A score of zero indicates that the loser received
no votes in the previous election (zero share of the vote) while a score of .5 indicates that the loser
received exactly half of the vote. To test our main opportunistic hypothesis, i.e., that a governor’s
likelihood of requesting is a function of her state’s strategic importance to the president, we examine
disaster declaration requests in response to the interaction of presidential competitiveness of the
state and the occurrence of a presidential election year.
Our reelection hypothesis is that only non-term-limited governors will be opportunistic. To test
this hypothesis we conduct a split sample analysis where we allow parameter estimates to vary
based on whether a governor is term-limited or reelection-eligible. In other models, we include an
indicator if the governor is term-limited.14
We also consider objective measures of need. Damage caused by the event is clearly a factor in
a governor’s calculus, and we use damage estimates provided by Spatial Hazards Events and Losses
Database for the United States (SHELDUS) (Hazards and Vulnerability Research Institute, 2009).
This unique dataset draws upon several sources to provide comprehensive county-level measures of
disaster damage caused in all U.S. states.15 These data provide detailed information on the scope
of natural disasters on a monthly level for the past several decades. We adjust these figures for
inflation and create a per capita measure of disaster damage.16 Since there is a lag between the
12We should note that not every gubernatorial request is granted. Some requests for federal aid are denied. Whileat the state-level these turn downs are rare, every state at some point in the time period analyzed does receive atleast one denial. Using a county-level analysis, Gasper (2014) finds that political factors also influence which countiesare denied aid. In particular, the evidence suggests that presidents are more likely to deny other party requests andduring election years presidents are implicitly using a lower threshold for damage sustained in order to warrant adisaster declaration.
13Shaw (1999), Reeves (2011), and Kriner and Reeves (2012) use a similar measure of competitiveness for presi-dential elections. Johnston, Hagen, and Jamieson (2004) also uses a measure based on the outcome in the previousrace.
14We also consider that the governor may be motivated by the competitiveness and proximity of her own election.To account for this, we include a measure of gubernatorial competitiveness measured in the same way as presidentialcompetitiveness and an indicator for gubernatorial election year. We find no evidence of this relationship and canprovide the results upon request.
15The data contains measures of property and crop damage, as well as total fatalities16Damage is expressed in 2005 dollars. Our measure reflects a per capita cost of damage to the areas (counties)
affected by the disaster. Severe weather events may involve several counties, with each county varying in populationsize. We aggregate population over each county that sustained damage in the event. The results presented in thenext section are robust to using state population as well.

time when severe weather strikes, when the governor makes a request for a disaster declaration,
and when the president grants or denies the request, we aggregate weather damage over a three
month span to include the given month and two previous months. We also include a measure of the
per capita income of the state. This allows us to proxy for the amount of wealth in the state and
provides a measure of the state’s tax revenue, and hence its ability to respond to major disasters.
To summarize, we perform three different split sample analyses. In the first, we split the sample
based on whether the governor is term-limited or not, and include an indicator if the president
and governor are of the same party. We also include in this analysis indicator variables for the
respective parties of the governor and president in order to account for differences in governing
ideologies. In our second analysis, we refine our expectations and examine the influence of the
partisan relationship between the officials. We conduct a second split sample analysis and divide
the sample based on whether the president and governor are of the same party and include an
indicator if the governor is term-limited. In our third analysis, we examine only opposite party
officials and split the sample between term-limited and reelection-eligible governors. All analyses are
logistic regressions with indicator variables for region-month combinations to capture seasonality
as well as specific geographic region heterogeneity. Summary statistics of all variables are included
in the Supporting Information.
3 Results
We now turn to the results of the empirical analysis described in the previous section. We find
support of our opportunistic hypothesis, i.e., battleground state governors leverage their state’s
electoral importance to the president. We also find evidence that this opportunistic behavior
vanishes if the governor is term-limited. This supports our reelection hypothesis.
Table 1 presents the results of a logistic regression that tests the opportunistic and reelection
hypotheses. We divide the population into two groups. The first group includes only term-limited
governors, and the second includes reelection-eligible governors. We conduct a split sample analy-
sis to gauge the effect of the independent variables under each institutional setting. Term-limited
governors have fewer incentives to control taxes and spending, which a presidential disaster decla-
ration can offset. Meanwhile, governors not bound by term limits are found to exert extra effort to
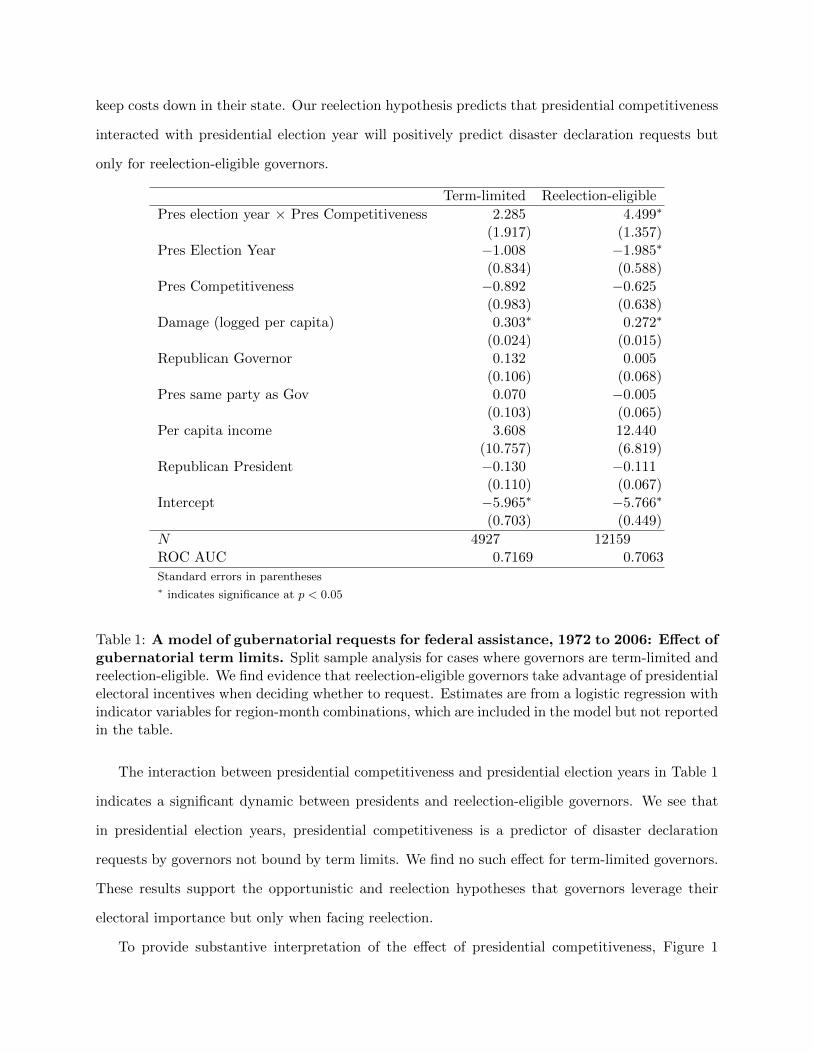
keep costs down in their state. Our reelection hypothesis predicts that presidential competitiveness
interacted with presidential election year will positively predict disaster declaration requests but
only for reelection-eligible governors.
Term-limited Reelection-eligible
Pres election year × Pres Competitiveness 2.285 4.499∗
(1.917) (1.357)Pres Election Year −1.008 −1.985∗
(0.834) (0.588)Pres Competitiveness −0.892 −0.625
(0.983) (0.638)Damage (logged per capita) 0.303∗ 0.272∗
(0.024) (0.015)Republican Governor 0.132 0.005
(0.106) (0.068)Pres same party as Gov 0.070 −0.005
(0.103) (0.065)Per capita income 3.608 12.440
(10.757) (6.819)Republican President −0.130 −0.111
(0.110) (0.067)Intercept −5.965∗ −5.766∗
(0.703) (0.449)
N 4927 12159ROC AUC 0.7169 0.7063
Standard errors in parentheses∗ indicates significance at p < 0.05
Table 1: A model of gubernatorial requests for federal assistance, 1972 to 2006: Effect ofgubernatorial term limits. Split sample analysis for cases where governors are term-limited andreelection-eligible. We find evidence that reelection-eligible governors take advantage of presidentialelectoral incentives when deciding whether to request. Estimates are from a logistic regression withindicator variables for region-month combinations, which are included in the model but not reportedin the table.
The interaction between presidential competitiveness and presidential election years in Table 1
indicates a significant dynamic between presidents and reelection-eligible governors. We see that
in presidential election years, presidential competitiveness is a predictor of disaster declaration
requests by governors not bound by term limits. We find no such effect for term-limited governors.
These results support the opportunistic and reelection hypotheses that governors leverage their
electoral importance but only when facing reelection.
To provide substantive interpretation of the effect of presidential competitiveness, Figure 1

presents simulations of the predicted probability of a disaster declaration request in presidential
election years by reelection-eligible governors. In this figure, we vary the presidential competitive-
ness of the state from the lowest observed value (.2) to the highest observed value (.5) using software
developed and described in Imai, King, and Lau (2009). This figure allows us to gauge the effects
of increasing or decreasing levels of electoral competitiveness of a state on requesting a declaration.
Ten thousand simulations were run for each level of competitiveness. All other variables were held
at their mean or median value, for numeric and dichotomous variables respectively.
The mean probability of a request of a disaster declaration from a governor from a presidentially
uncompetitive state is .016, while the mean probability of a request from a highly competitive state
is .050. The differences represented in Figure 1 are relatively sizable, statistically significant, and
provide evidence of opportunism among reelection-eligible governors.
While our analysis and discussion focus on the political influences on disaster requests, we
note that severe weather damage is one of the most influential variables. It is positive and highly
statistically significant in all of our models. In fact, for term-limited governors damage is the only
statistically significant predictor of disaster declaration requests. We include an indicator if the
president and governor are of the same party, but we find no evidence that this relationship affects
requests.17
Finally, the ROC AUC presents the area under the receiver operating characteristic (ROC)
curve. This is a summary statistic of model performance. The ROC curve maps the model’s
predictive true positive rate versus the false positive rate. The model perfectly classifies disaster
declaration requests when the area under the curve is equal to 1, and when the ROC AUC is near .5
the accuracy of the model’s classification is roughly the same as a coin flip. The closer the measure
is to 1, the better the model is at predicting the data. All of models from our analysis have an
ROC AUC measure of at least .7 and provide informative classification of the disaster declaration
request data.
17This is separate from our partisan hypothesis. Our partisan hypothesis looks specifically at battleground governorsduring election years.

0.00 0.02 0.04 0.06 0.08 0.10
020
4060
80
Probability of a disaster declaration request
Den
sity
Competitiveness = .5
Competitiveness = .2
Figure 1: Simulated probability of disaster declaration request in a given month byreelection-eligible governors during presidential election years. The darkened line indi-cates the simulated probability of a request by a governor from the most competitive state (com-petitiveness = 0.5). The light gray line indicates the simulated probability of a request by governorfrom the least competitive state observed in the data (competitiveness = 0.2). All other variablesare kept at their mean or median value. The sample is restricted to reelection-eligible governors.The simulated probability densities are based on ten thousand simulations per level of competitive-ness. The predicted probability of a request from a governor from an uncompetitive state is 0.016,while the probability of a request from a highly competitive state is 0.050.
4 Partisanship
In addition to maintaining fiscal balance, governors, as party leaders, are trustees of the reputation
of their political party (Cox and McCubbins, 1993, 2005) and want to help elect their party’s
presidential candidate. With this in mind, we hypothesize that party may influence the choices of
governors to request. Given the electoral benefits of a disaster declaration, governors may be eager
to request from same-party presidents in order to invite them into the state to woo voters and

support the party. At times, governors face conflicting incentives. Consider the case of a governor
requesting aid from an other-party president. If the governor is from a battleground state, they
are well placed to request aid because they are electorally important. Yet they also risk inviting a
hostile campaigner-in-chief into their state thus enabling the victory of an other-party president.
This is the risk that a battleground state governor takes by requesting aid from a president of the
other party. It follows that battleground state governors most acutely feel these partisan influences
and that they are heightened during a presidential election year. Governors act to fulfill numerous
goals while in office, and the goal of obtaining resources for their states may conflict with helping
their party win the White House.
We further refine our expectations regarding opportunistic behavior and hypothesize that the
partisan dynamics between the governor and president may condition the behavior of the governor
and her decision to request aid. As we have already described, a governor’s disaster declaration
request may influence the probability that an incumbent president or his party wins the state in the
next election. Given this, battleground state governors may be eager to request from same party
presidents and hesitant to request from other party presidents. This reflects a framework where
parties are teams and may coordinate activities in order to help each other achieve their goals and
keep the party brand strong (Cox and McCubbins, 1993). By working to elect a copartisan presi-
dent, governors may also be acting strategically to procure additional funds after the presidential
election. For instance, Larcinese, Rizzo, and Testa (2006) finds evidence that presidents reward
same party governors with federal dollars.
If governors are influenced by these partisan incentives, they should be especially felt by gover-
nors of battleground states during presidential election years. While ideally positioned, a governor
requesting of an other-party president invites the other party’s standard-bearer into the state to
woo voters in the aftermath of a disaster. This scenario creates conflicting incentives for a gover-
nor. She experiences a partisan cross pressure against the incentives to behave opportunistically.
Battleground state governors are strategically well positioned to ask but at a higher risk of hurting
their party by inviting a hostile campaigner into the state. In presidential election years, partisan
and opportunistic incentives for a reelection eligible governor collide.18
18For a related, although slightly different scenario, consider the reaction of Republican governors to Reagan’s1981 veto in order to achieve additional cuts in domestic spending. Broder (1981) reports that governors “applaudednervously” as their president was seeking to diminish their fiscal resources. There existed a tension between partisan
We hypothesize that in presidential election years battleground state governors will use the
disaster declaration process to help their party’s presidential candidate and request more from
same-party presidents than other governors. Similarly, these battleground state governors will
request less from other-party presidents. We call this influence of copartisanship the partisan
hypothesis.
Second, our partisan hypothesis predicts that opportunistic battleground state governors will
be sensitive to the copartisan relationship with the president. To test this hypothesis, we include
an indicator if the governor is of the same party as the president. We also conduct a split sample
analysis where we allow parameter estimates to vary based on the copartisan relationship between
the governor and president. If this hypothesis is correct, a battleground governor will be less likely
to request than other governors from an other-party president during a presidential election year.
Similarly, we expect same-party battleground governors to request more than other governors in
presidential election years.
With respect to the partisan hypothesis, we find no evidence during presidential election years
that the partisan dynamic between governors and presidents influences requests of battleground
state governors. When the state looks most attractive to a president, battleground state governors
ignore partisan considerations and actively request aid from other-party presidents. Moreover, this
willingness to offer up the state to a hostile campaigner-in-chief is exhibited only when the governor
can stand for reelection.
We now turn to the partisan incentives behind gubernatorial decisions to request federal disaster
aid. Table 2 presents a split sample analysis. The model in the first column includes cases where
the governor and president are of the same party. The second column is an analysis of cases where
the president and governor are of opposite parties. This allows us to test the partisan hypothesis
described previously. The partisan hypothesis predicts that battleground governors will be more
likely to request during a presidential election year when the president is of their party. When the
president is of the opposite party, we expect that the relationship would be reversed.
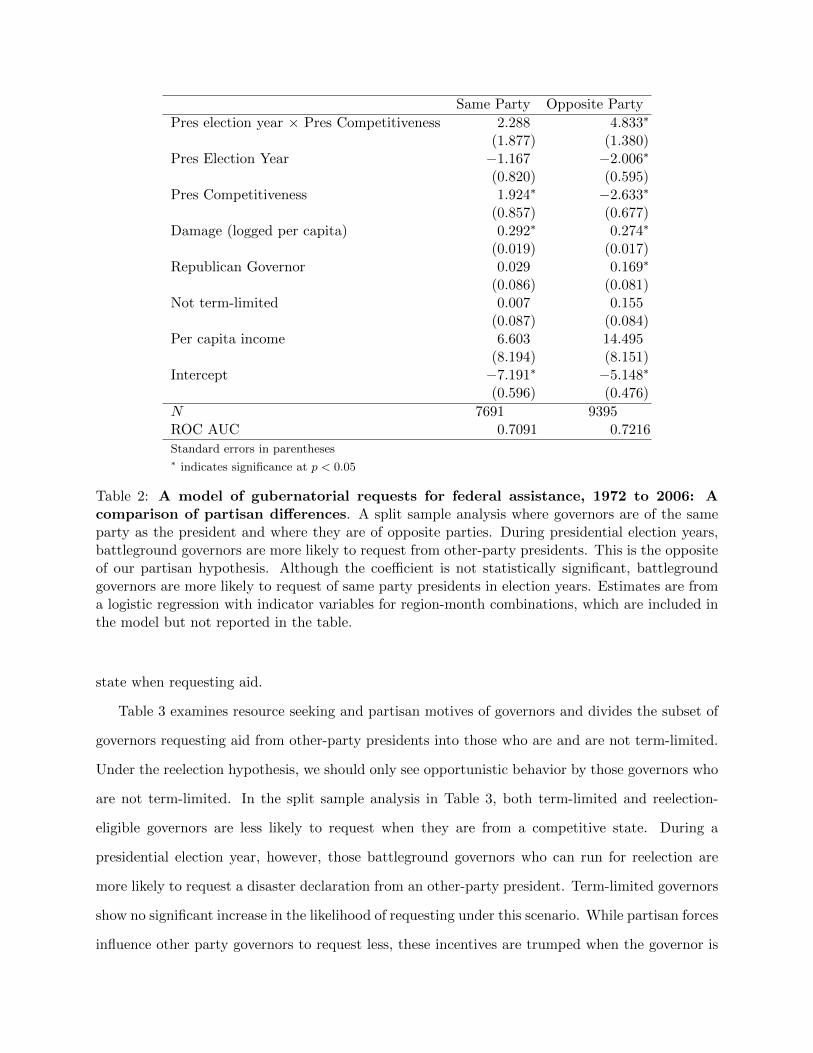
We find no support for the partisan hypothesis in Table 2. The interaction between presidential
competitiveness and presidential election year yields the opposite of the hypothesized result. With
and resource seeking motivations as “the 20 Republican state executives, most of whom will be on the ballot nextyear, betrayed strong worries that. . . reduced federal aid may throw them a curve in their re-election campaigns” (p.A3).

respect to the interaction between competitiveness and presidential election year, we see a positive
although not statistically significant relationship when the governor is of the same party as the
president. When the president is of the opposite party, there is a positive and statistically significant
relationship. This suggests that when a governor is well-positioned to request, i.e. they are from a
competitive state and it is a presidential election year, they disregard their partisan incentives and
act opportunistically to procure resources.19
Like Figure 1, Figure 2 provides substantive interpretation of the simulated probability that
a governor will request a disaster declaration from an other-party president during a presidential
election year. If the partisan hypothesis holds, then battleground state governors will be less likely
to request aid from other-party presidents when compared to other governors. Again, we consider
two scenarios. One where the presidential competitiveness of the state is low (.2) and one where it is
high (.5). All other variables were held at their mean or median value, for numeric and dichotomous
variables respectively. The mean probability of an other-party request from an uncompetitive state
governor is .06, while the probability of an other-party request from a battleground governor is .12.
This is the opposite of what the partisan hypothesis predicts.
The analysis in Table 2 shows that battleground governors abandon partisan allegiances and
request aid from other-party presidents when they are strategically positioned to do so. This
suggests that the resource seeking incentives rather then partisan incentives underlie opportunistic
gubernatorial behavior. The analysis in Table 2, however, does not account for the role of term-
limits or the reelection concerns of the governor. As we described previously, we expect that only
reelection-eligible governors to display opportunistic behavior. It follows that if this opportunistic
behavior is causing governors to abandon their partisan ties, we should only observe this among
reelection-eligible governors. To provide a clear test of gubernatorial opportunism, we reexamine
cases where the governor and president are of opposite parties while taking into account whether
the governor can run for reelection. If resource seeking motivations are driving behavior, then only
those governors not bound by term limits will be influenced by the electoral importance of their
19Table 2 indicates that battleground state governors are less likely to request of other-party presidents and morelikely to request of same-party presidents in years one through three of the presidential term. The positive coefficientof presidential competitiveness for same-party governors in column 1 and the negative coefficient for other-partygovernors in column 2 indicate this relationship for non-presidential election years. Since competitiveness is interactedwith presidential election year in the model, the constituent term for competitiveness can be interpreted as the effectduring a non-election year. These relationships remain in models without the interaction effects, which are availableupon request.
Same Party Opposite Party
Pres election year × Pres Competitiveness 2.288 4.833∗
(1.877) (1.380)Pres Election Year −1.167 −2.006∗
(0.820) (0.595)Pres Competitiveness 1.924∗ −2.633∗
(0.857) (0.677)Damage (logged per capita) 0.292∗ 0.274∗
(0.019) (0.017)Republican Governor 0.029 0.169∗
(0.086) (0.081)Not term-limited 0.007 0.155
(0.087) (0.084)Per capita income 6.603 14.495
(8.194) (8.151)Intercept −7.191∗ −5.148∗
(0.596) (0.476)
N 7691 9395ROC AUC 0.7091 0.7216
Standard errors in parentheses∗ indicates significance at p < 0.05
Table 2: A model of gubernatorial requests for federal assistance, 1972 to 2006: Acomparison of partisan differences. A split sample analysis where governors are of the sameparty as the president and where they are of opposite parties. During presidential election years,battleground governors are more likely to request from other-party presidents. This is the oppositeof our partisan hypothesis. Although the coefficient is not statistically significant, battlegroundgovernors are more likely to request of same party presidents in election years. Estimates are froma logistic regression with indicator variables for region-month combinations, which are included inthe model but not reported in the table.
state when requesting aid.
Table 3 examines resource seeking and partisan motives of governors and divides the subset of
governors requesting aid from other-party presidents into those who are and are not term-limited.
Under the reelection hypothesis, we should only see opportunistic behavior by those governors who
are not term-limited. In the split sample analysis in Table 3, both term-limited and reelection-
eligible governors are less likely to request when they are from a competitive state. During a
presidential election year, however, those battleground governors who can run for reelection are
more likely to request a disaster declaration from an other-party president. Term-limited governors
show no significant increase in the likelihood of requesting under this scenario. While partisan forces
influence other party governors to request less, these incentives are trumped when the governor is

0.00 0.05 0.10 0.15 0.20 0.25
05
1015
20
Probability of a disaster declaration request
Den
sity
Competitiveness = .5
Competitiveness = .2
Figure 2: Effect of election year competitiveness for governors requesting aid fromother-party presidents. Simulations of the probability of a disaster declaration request in agiven month during presidential election years by governors of the opposite party than the president.The darkened line indicates the simulated probability of a request by a governor from the mostcompetitive state observed in the data (competitiveness = 0.5). The light gray line indicates thesame by governor from the least competitive state observed (competitiveness = 0.2). All othervariables are kept at their mean value. Simulated probability density are based on ten thousandsimulations per level of competitiveness. The predicted probability of a request in a given monthfrom a governor from an non-competitive state is 0.06, while the probability of a request froma highly competitive state is 0.12. This is the opposite of our expectation from the partisanhypothesis.
most strategically positioned to ask for aid.
Figure 3 presents simulated probabilities derived from the model presented in Table 3. The
density plots represent the probability of a disaster declaration request in a given month by an
opposite party governor during a presidential election year. The left panel indicates the simu-
lated probability that a term-limited governor will request a disaster declaration. The right panel

presents the same analysis for those governors who may seek reelection. The two lines in each
panel represent the lowest and highest observed values of presidential competitiveness of a state,
.2 and .5 respectively. Ten thousand simulations were run for each level of competitiveness. All
other variables were held at their mean or median value, for numeric and dichotomous variables
respectively.
For reelection-eligible governors presidential competitiveness is a positive predictor of disaster
declaration requests to other party presidents during election years. The probability of a request
from a reelection-eligible governor from an uncompetitive state is .009, while the probability of a
request from a highly competitive state is .026. There is no effect of presidential competitiveness
on the requests of term limited governors in presidential election years. Notably, presidential
competitiveness is a negative predictor of requests made to other party presidents during non-
election years for all governors. Although this is not a prediction from one of our hypotheses, it
suggests that partisan influences may be strong among battleground state governors only during
non-presidential election years.20
The analysis in Table 3 and Figure 3 confirms the dominance of the reelection incentives over
the partisan incentives in motivating gubernatorial behavior. We find strong evidence gubernatorial
opportunism in the disaster declaration request process even when the partisan hypothesis would
predict otherwise. When these incentives conflict we find that governors act as resource seekers
in spite of partisan allegiances. When governors can influence either the resources their state
will receive or the partisanship of the next president, they choose resources. As we hypothesized,
the institutional structure of gubernatorial elections as determined by term-limits activates this
opportunistic behavior.
20This may be a function of loyalism to the party. It may also reflect the close link between the reputation ofthe national party, the president, and the governor (Peltzman, 1987; Carsey and Wright, 1998; Chubb, 1988; Simon,1989). Moreover, presidents take a more active role in battleground states governed by copartisans. This in turnmay cause battleground governors to be linked more closely with the president and therefore the reputation of thenational party. For instance, Oppel Jr. (2002) reports that President Bush “moved aggressively to help Republicangovernors . . . especially in states that he would like to win in his re-election campaign.” Abramowitz (2002) notesthat the close bond between battleground governors and copartisan presidents is “widely accepted among politiciansand journalists” (p. 701) though finds that this conventional wisdom may be ill-conceived.

Term-limited Reelection-eligible
Pres election year × Pres Competitiveness 3.942 5.315∗
(2.355) (1.715)Pres Election Year −1.596 −2.232∗
(1.006) (0.742)Pres Competitiveness −3.374∗ −2.513∗
(1.254) (0.830)Damage (logged per capita) 0.318∗ 0.263∗
(0.035) (0.020)Republican Governor 0.348∗ 0.130
(0.174) (0.094)Per capita income 34.545∗ 8.427
(15.661) (9.645)Intercept −6.009∗ −4.724∗
(0.919) (0.563)
N 2693 6702ROC AUC 0.7461 0.7248
Standard errors in parentheses∗ indicates significance at p < 0.05
Table 3: A model of gubernatorial requests for federal assistance, 1972 to 2006: Ef-fect of gubernatorial term limits when requesting aid from other party presidents. Asplit sample analysis of cases where governors are term-limited and where governors can run forreelection. Battleground governors who can run for reelection are more likely to request during apresidential election year. Term-limited governors show no significant increase in the likelihood ofrequesting under this scenario. This provides evidence of reelection hypothesis. Estimates are froma logistic regression with indicator variables for region-month combinations, which are included inthe model but not reported in the table.
5 Discussion
Our analysis of all states over thirty five years examines the political factors that influence a
governor’s decision to request federal aid. We find systematic evidence that governors act as
opportunists. This is not a universal behavior, as we also find support for our reelection hypothesis;
only governors who face reelection act as opportunists. We also examine the role of partisan
incentives. When the governor’s party holds the White House, partisan loyalties are aligned with
the goals of the opportunist; however, sometimes the governor must chose between what is best
for her political party and what is best for the state’s budget. When the reelection and partisan
incentives collide, we show that the reelection incentives are dominant. At times, governors are
ideally positioned to request but at the cost of bringing an other-party president into their state to
woo voters. We find no evidence of our partisan hypothesis. When faced with this delicate balance,

0.00 0.05 0.10 0.15 0.20
05
1015
2025
30Term Limited Governor Other−Party President
Probability of a disaster declaration request
Den
sity
0.00 0.05 0.10 0.15 0.20
05
1015
2025
30
Non−Term Limited Governors Other Party President
Probability of a disaster declaration request
Den
sity
Competitiveness = .5
Competitiveness = .2
Figure 3: Probability of disaster declaration request by term-limited and reelection-eligible governors to other-party presidents. The left panel presents the simulated prob-abilities of a disaster declaration request in a given month during presidential election years forterm-limited governors, and the right panel present the same for reelection-eligible governors. Thedarkened line indicates the simulated probability of a request by a governor from the most com-petitive state observed in the data (competitiveness = 0.5). The light gray line indicates the sameby governor from the least competitive state observed (competitiveness = 0.2). All other variablesare kept at their mean or median value. Ten thousand simulations per level of presidential compet-itiveness. The probability of a request from a reelection eligible governor from an uncompetitivestate is 0.034, while the probability of a request from a highly competitive state is 0.071. Battle-ground governors who can run for reelection are more likely to request during a presidential electionyear. Term-limited governors show no significant increase in the likelihood of requesting under thisscenario.
we find systematic evidence that governors subordinate party and ask for aid.
Unlike previous studies, we suggest that governors, and not just presidents, drive the politi-
cization of the disaster declaration process. In our study, only those governors with an electoral
incentive request strategically. A term limited governor from a battleground state requests based
on need alone. We argue that it is only when the governor faces reelection that she will oppor-
tunistically leverage her states’ electoral importance to the president.
Billions of federal dollars are spent annually on disaster relief and mitigation. While events like
Hurricane Andrew come along very rarely, most governors find themselves in a position to ask for
federal aid at some point during their administrations. While disasters are not caused by politicians,
governors are often the first political responder to these events. We find that gubernatorial requests
for federal disaster aid are not dictated by need alone. In requesting federal aid, a governor takes
into account the electoral importance of her state and also whether she will again face reelection.
While the disaster declaration process allows us to observe the electoral motivations of governors
and presidents, natural disasters and the governmental response is also an important public policy
domain.
Today, governors and state legislatures continue to deal with fiscal emergencies as they balance
their ledgers. The effects of the economic recession are acutely felt by governors as states reconcile
their budgets, jobs are lost, benefits are cut, and existing resources are stretched. At the same time,
the federal government appears willing to increase the competition among states for federal dol-
lars.21 We should notice how governors attempt to leverage their presidential electoral importance
as they seek much needed federal dollars.
Because of political posturing, citizens who experience similar levels of damage may see differing
levels of federal aid depending on their state’s role in the last presidential election or the presence
of gubernatorial term limits. The electoral pressures of governors and presidents exert influence
over the allocation of resources independent of actual need. They do not negate each other as
postulated by Madison in Federalist 10. The disaster declaration process is one in which governors
and presidents exercise total discretion. Governors, alone, decide to request, and presidents, alone,
decide whether to grant the request. Congress and state legislatures are wise to take a proactive in-
terest in the prerogatives of their executives, less gubernatorial and presidential electoral incentives
dominant public policy.
21For instance, see Howell (2014) on the White House’s Race to the Top initiative.

References
Abramowitz, Alan I. 2002. “Gubernatorial Influence in Presidential Elections: Fact or Myth.” PS:Political Science and Politics 35(4): 701—703.
Achen, Christopher H, and Larry M Bartels. 2004. “Blind Retrospection: Electoral Responses toDrought, Flu, and Shark Attacks.” Typescript.
Alt, James E, Ethan Bueno de Mesquita, and Shanna Rose. 2011. “Disentangling Accountabilityand Competence in Elections: Theory and Evidence from US Term Limits.” Journal of Politics73(Jan): 171—186.
Barnhart, John D. 1925. “Rainfall and the populist party in Nebraska.” American Political ScienceReview 19(Aug): 527—540.
Bartels, Larry M. 1985. “Resource Allocation In a Presidential Campaign.” Journal of Politics47(Aug): 928–936.
Bartels, Larry M. 2008. Unequal Democracy: The Political Economy of the New Gilded Age.Princeton: Princeton University Press.
Besley, Timothy, and Anne Case. 1995. “Does Electoral Accountability Affect Economic PolicyChoices? Evidence from Gubernatorial Term Limits.” The Quarterly Journal of Economics110(Aug): 769–798.
Birkland, Thomas. 2007. Lessons of Disaster: Policy Change After Catastrophic Events. George-town University Press.
Boin, Arjen, Paul ’t Hart, Eric Stern, and Bengt Sundelius. 2005. The Politics of Crisis Manage-ment: Public Leadership Under Pressure. Cambridge University Press.
Brams, Steven J, and Morton D Davis. 1974. “The 3/2’s rule in presidential campaigning.” Amer-ican Political Science Review 68(1): 113—134.
Broder, David S. 1981. “Reagan Gets Edgy Backing from GOP Governors.” Washington Post (Nov24): A3.
Carsey, Thomas, and Gerald Wright. 1998. “State and National Factors in Gubernatorial andSenatorial Elections.” American Journal of Political Science 42(Jul): 994–1002.
Chubb, John. 1988. “Institutions, The Economy, and the Dynamics of State Elections.” AmericanPolitical Science Review 82(Mar): 133–154.
Cox, Gary W., and Mathew D. McCubbins. 1993. Legislative Leviathan: Party Government in theHouse. Berkeley: University of California Press.
Cox, Gary W., and Mathew D. McCubbins. 2005. Setting the Agenda: Responsible Party Govern-ment in the U.S. House of Representatives. New York: Cambridge University Press.
Fiorina, Morris P. 1981. Retrospective Voting in American National Elections. Yale UniversityPress.
Garrett, Thomas A, and Russell S Sobel. 2003. “The Political Economy of FEMA Disaster Pay-ments.” Economic Inquiry 41(Jul): 496—509.

Gasper, John T. 2014. “The Politics of Denying Aid: An Analysis of Disaster Declaration Turn-downs.”.
Gasper, John T, and Andrew Reeves. 2011. “Make it Rain? Retrospection and the AttentiveElectorate in the Context of Natural Disasters.” American Journal of Political Science 55(2):340—355.
Hazards and Vulnerability Research Institute. 2009. “The Spatial Hazard Events and LossesDatabase for the United States.”.
Healy, Andrew J, and Neil Malhotra. 2009. “Myopic Voters and Natural Disaster Policy.” AmericanPolitical Science Review 103(3): 387—406.
Howell, William G. 2014. “Presidential Prescriptions for State Policy: Obama’s Race to the TopInitiative.” Typescript.
Imai, Kosuke, Gary King, and Olivia Lau. 2009. “Zelig: Everyone’s Statistical Software.”http://GKing.Harvard.Edu/zelig, version 3.4-3.
James, Scott C. 2000. Presidents, Parties, and the State: A Party System Perspective on Demo-cratic Regulatory Choice, 1884–1836. Cambridge: Cambridge University Press.
Johnston, Richard, Michael G. Hagen, and Kathleen Hall Jamieson. 2004. The 2000 PresidentialElection and the Foundations of Party Politics. New York: Cambridge University Press.
Kramer, Gerald H. 1971. “Short-term Fluctuations in U.S. Voting Behavior, 1896-1964.” AmericanPolitical Science Review 65(Mar): 131—143.
Kriner, Douglas L., and Andrew Reeves. 2012. “The Influence of Federal Spending on PresidentialElections.” American Political Science Review 106(2): 348–366.
Kuziemko, Ilyana, and Eric Werker. 2006. “How much is a seat on the Security Council worth?Foreign aid and bribery at the United Nations.” Journal of Political Economy 114(5): 905—930.
Larcinese, Valentino, Leonzio Rizzo, and Cecilia Testa. 2006. “Allocating the US Federal Budgetto the States: The Impact of the President.” Journal of Politics 68(May): 447—456.
Mathews, Tom, Peter Katel, Todd Barrett, Douglas Waller, Clara Bingham, Melinda Liu, StevenWaldman, and Ginny Carrol. 1992. “What Went Wrong.” Newsweek 120(September 7): 22.
McCarthy, Francis X. 2010. FEMA Disaster Cost-Shares: Evolution and Analysis. Technical reportCongressional Research Service.
Oppel Jr., Richard A. 2002. “President’s Help for His Governor Brother Includes More ThanCampaign Stops.” New York Times (October 18).
Peltzman, Sam. 1987. “Economic Conditions and Gubernatorial Elections.” American EconomicReview 77(May): 293–297.
Reeves, Andrew. 2011. “Political Disaster: Unilateral Powers, Electoral Incentives, and PresidentialDisaster Declarations.” Journal of Politics 73(4): 1142–1151.
Rubin, Claire B., and Daniel G. Barbee. 1985. “Disaster Recovery and Hazard Mitigation: Bridgingthe Intergovernmental Gap.” Public Administration Review 45(Jan): 57–63.
Salkowe, Richard S., and Jayajit Chakraborty. 2009. “Federal Disaster Relief in the U.S.: The Roleof Political Partisanship and Preference in Presidential Disaster Declarations and Turndowns.”Journal of Homeland Security and Emergency Management 6(1).
Schneider, S. K, and W. G Jacoby. 2003. “Public Attitudes toward the Policy Responsibilities ofthe National and State Governments: Evidence from South Carolina.” State Politics & PolicyQuarterly 3(Sep): 246–269.
Schneider, Saundra K. 2011. Dealing with Disaster: Public Management in Crisis Situations. 2nded. M.E.Sharpe;.
Shaw, Daron. 1999. “The Methods behind the Madness: Presidential Electoral College Strategies,1988-1996.” Journal of Politics 61(Nov): 893–913.
Simon, Dennis. 1989. “Presidents, Governors, and Electoral Accountability.” Journal of Politics51(May): 286–304.
Sylves, Richard. 2008. Disaster Policy and Politics. CQ Press.
Sylves, Richard, and Zoltan I Buzas. 2007. “Presidential Disaster Declaration Decisions, 1953-2003:What Influences Odds of Approval.” State & Local Government Review 39(1): 3—15.
Tufte, Edward R. 1978. Political Control of the Economy. Princeton: Princeton University Press.
United States General Accounting Office. 1989. “Disaster Assistance: Timeliness and Other IssuesInvolving the Major Disaster Process.” (May).
US Census Bureau. 2010. Federal Aid to States for Fiscal Year 2009. Washington, DC: US Gov-ernment Printing Office.
Wright, Gavin. 1974. “The Political Economy of New Deal Spending: An Econometric Analysis.”The Review of Economics and Statistics 56(Feb): 30–38.
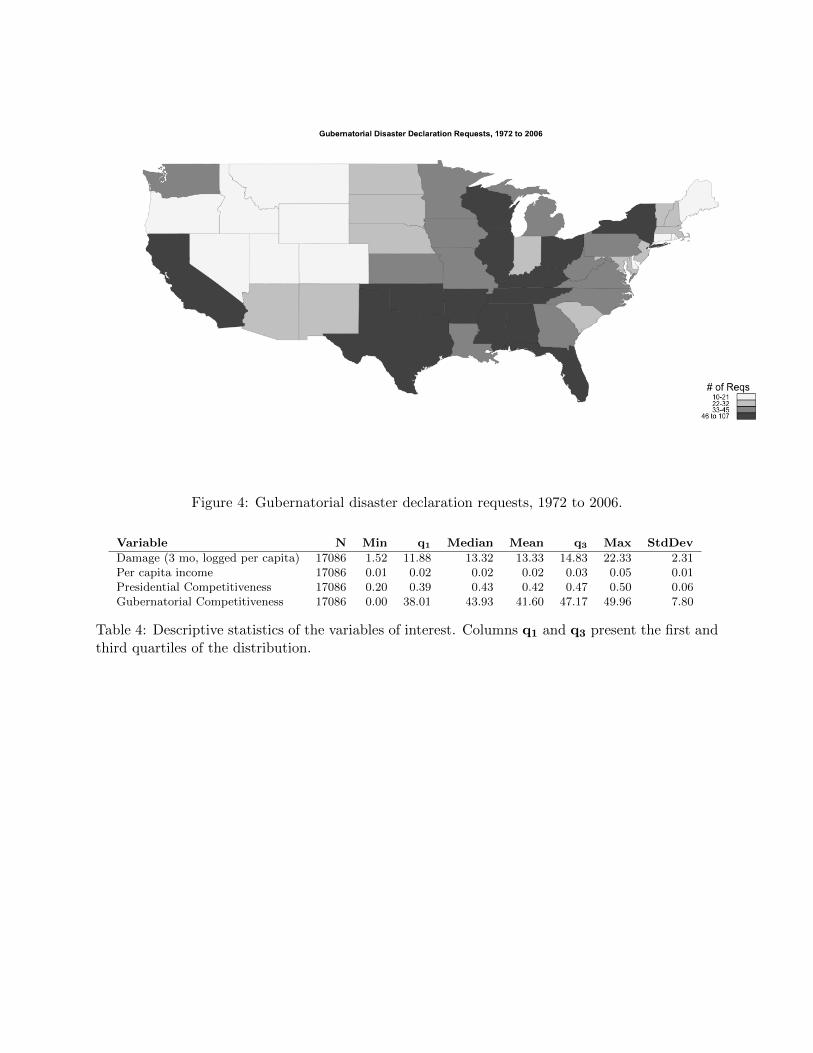
Figure 4: Gubernatorial disaster declaration requests, 1972 to 2006.
Variable N Min q1 Median Mean q3 Max StdDev
Damage (3 mo, logged per capita) 17086 1.52 11.88 13.32 13.33 14.83 22.33 2.31Per capita income 17086 0.01 0.02 0.02 0.02 0.03 0.05 0.01Presidential Competitiveness 17086 0.20 0.39 0.43 0.42 0.47 0.50 0.06Gubernatorial Competitiveness 17086 0.00 38.01 43.93 41.60 47.17 49.96 7.80
Table 4: Descriptive statistics of the variables of interest. Columns q1 and q3 present the first andthird quartiles of the distribution.