Government Spending on Canada's Oil and Gas … Government Spending on Canada's Oil and Gas Industry...
57
Government Spending on Canada's Oil and Gas Industry Undermining Canada's Kyoto Commitment January 31, 2005 Amy Taylor Matthew Bramley Mark Winfield Commissioned by Climate Action Network Canada
Transcript of Government Spending on Canada's Oil and Gas … Government Spending on Canada's Oil and Gas Industry...

Government Spending on Canada's Oil and Gas
Industry Undermining Canada's Kyoto Commitment
January 31, 2005
Amy Taylor Matthew Bramley
Mark Winfield
Commissioned by Climate Action Network Canada

2
Government Spending on Canada's Oil and Gas Industry
Table of Contents
FOREWORD BY CLIMATE ACTION NETWORK CANADA ........................................................3 EXECUTIVE SUMMARY ..............................................................................................................4 1 INTRODUCTION ...................................................................................................................8 2 BACKGROUND: WHY OIL AND GAS?...............................................................................14 3 METHODOLOGY ................................................................................................................18 4 FEDERAL EXPENDITURE ON OIL AND GAS PRODUCTION ..........................................25 5 SUBSIDIZING OIL SANDS GROWTH ................................................................................35 6 SUPPORTING EVIDENCE..................................................................................................46 7 CONCLUSION.....................................................................................................................53 ISBN : 0-921719-73-6

3
Government Spending on Canada's Oil and Gas Industry
FOREWORD BY CLIMATE ACTION NETWORK CANADA The oil and gas industry is the fastest growing and largest source of greenhouse gas emissions in Canada. Industry leaders were among the most outspoken opponents of Canada’s decision to ratify the Kyoto Protocol, predicting major negative economic impacts. Chief among industry claims was the contention that Kyoto would lead to huge expenditures for the purchase of foreign credits depriving Canadians of the capital needed to make “real” reductions in pollution in Canada. This was in spite of estimates by the federal government and others that the economic impact of the Kyoto Protocol on the oil and gas industry would amount to no more than $0.25 per barrel of oil. A few days after Canada ratified the Protocol the then Minister of Natural Resources wrote to the oil industry and provided it with a guarantee that it would not be required to reduce its emissions more than 15% below the business as usual forecast. This “relative” target allows emissions from oil and gas to rise substantially between 2002 and 2012. Further, the industry was assured the government would assume all costs of emissions reduction in excess of $15 a tonne. The federal Climate Change Plan for Canada describes a number of subsidies and incentives for wind energy and other forms of renewable energy. It was the view of the Climate Action Network — Canada (CAN) that these initiatives were insignificant in comparison to the subsidies and other government support presently being provided to the oil and gas industry. CAN asked the Pembina Institute to conduct a study to determine the extent of government support for Canada’s oil and gas industry and to recommend changes to federal and provincial government policy. It turns out that the industry’s real fear may well be that Canadian taxpayer will object to the huge corporate welfare that is being provided to the country’s richest and biggest polluters. While proclaiming its desire to combat global climate change by ratifying the Kyoto Protocol and promising to reduce greenhouse emissions, the Government of Canada provided the oil and gas industry with $1,446 million (2000$) in subsidies in 2002. The increase in subsidies between 1996 and 2000 was 33%. Total expenditure between 1996 and 2002, inclusive, was equal to $8,324 million (2000$). Federal government expenditure on oil sands alone is estimated to be approximately $1,193 million (2000$) from 1996 to 2002, inclusive.
4
Government Spending on Canada's Oil and Gas Industry
EXECUTIVE SUMMARY Governments in Canada, as well as elsewhere, subsidize a number of socially beneficial services. These include, for example, health care, education and energy services. To the extent that subsidies provided to the energy sector are for oil and gas developments, however, they are contributing to increased environmental impacts and hindering developments of environmentally friendly alternative energy options. The purpose of this study is to investigate government expenditure on the oil and gas sector in Canada. To that end, we identify and document the various forms of public support provided to this industry by the federal government. We focus on federal government support provided through grants (direct expenditure), the tax system (tax expenditure) and government departments (program expenditure) for conventional oil and gas as well as for oil sands between 1996 and 2002. We also discuss provincial support for oil sands. This special focus on oil sands is important for two reasons: One, growing oil sands production is the principal cause of increasing environmental impacts from Canada’s oil and gas sector and, two, previous research by the Commissioner of the Environment and Sustainable Development concluded that investments in oil sands receive significant tax concessions relative to other forms of energy.1 In the late 1980s and early 1990s, the federal government supported energy megaprojects. This included, for example, the Hibernia Development Project and heavy oil upgraders.2 Since 1995, federal spending on non-renewable energy resources has been significantly reduced. While it is true, then, that current subsidies are lower than in the past, they are still substantial. Government expenditure on the oil and gas sector including tax, program and direct expenditure totalled $1,085 million (2000$) in 1996 and $1,446 million (2000$) in 2002. The increase in expenditure over this time period was 33%. Total expenditure from 1996 to 2002, inclusive, was equal to $8,324 million (2000$). The vast majority of the expenditure is associated with tax initiatives and in particular the Canadian Development Expense, the Canadian Exploration Expense, the Resource Allowance and the Accelerated Capital Cost Allowance for oil sands. Other research has demonstrated relatively low taxation levels for the oil and gas sector,3 high tax concessions for oil sands4 and relatively high profits of oil and gas companies.5 In addition, previous research comparing the amount of revenue collected from oil and gas developments in Canada with that collected in Alaska and Norway revealed that, relative to these international benchmarks, companies extracting Canada’s oil and gas, most of which belongs to the public, are receiving an implicit subsidy in the form of excessive profits that governments are failing to capture through taxes, royalties and other revenue generating policy options.6
1 Commissioner of the Environment and Sustainable Development. 2000. Report of the Commissioner of the Environment and Sustainable Development. 2 Commissioner of the Environment and Sustainable Development. 2000. Report of the Commissioner of the Environment and Sustainable Development. 3 The Technical Committee on Business Taxation. 1997. Report of the Technical Committee of Business Taxation. Submitted to the Honourable Paul Martin, Minister of Finance. 4 Commissioner of the Environment and Sustainable Development. 2000. Report of the Commissioner of the Environment and Sustainable Development. 5 Statistics Canada, CANSIM Table 180-0001 for 1995 to 1998 and CANSIM Table 180-0003 for 1999 to 2002. 6 Taylor, Amy, Chris Severson-Baker, Mark Winfield, Dan Woynillowicz and Mary Griffiths. 2004. When the Government is the Landlord. Pembina Institute for Appropriate Development.

5
Government Spending on Canada's Oil and Gas Industry
Federal government expenditure on oil sands, including tax expenditure, research and development support and the Syncrude Remission Order,7 is estimated to be approximately $1,193 million (2000$) from 1996 to 2002, inclusive. The government of Alberta does not track tax expenditure associated with any form of oil and gas development. Neither does it track research and development support or direct expenditure. A similar discovery was made by a past investigation into this topic.8 The trends in government expenditure on the oil and gas industry described above are particularly worrisome in light of Canada's commitment to reduce greenhouse gas emissions under the Kyoto Protocol. In 2002, 20% of Canada’s GHG emissions came from the oil and gas industry, up from 16% in 1990. Upstream oil and gas production and natural gas transmission, which now account for 16% of Canada’s GHG emissions, saw their emissions increase by 56% between 1990 and 2002. Petroleum refining and natural gas distribution, which now account for 4% of Canada’s GHG emissions, saw their emissions increase by a more modest 17% over the same period. Total GHG emissions from Canada’s oil and gas industry rose by 47% between 1990 and 2002. Oil and gas production is also associated with other environmental impacts. Exploration and development of oil and gas results in land disturbance as wells are drilled, roads are built and pipelines are constructed. Oil and gas production is associated with significant water consumption and results in emissions of criteria air contaminants including acidifying emissions of nitrogen oxide and sulphur dioxide. Over the last two decades there has been growing interest in the value of subsidies provided by governments around the world to various sectors. Concurrently, there has been mounting pressure to reduce and/or remove perverse subsidies — that is, subsidies associated with environmentally damaging activities. To date, in Canada little progress has been made in this regard. According to the Organization for Economic Cooperation and Development (OECD), “incentives for natural resource development and use [in Canada] raise sustainability concerns.”9 The OECD has criticized Canada in the past because “direct subsidies and fiscal incentives to the energy industry continue to undermine efforts to improve energy efficiency.”10 More recently, the OECD called for a “[s]ystematic review of environmentally harmful subsidies in sectors such as transportation and energy”11 — a task yet to be completed in Canada. This study is intended to be a first step in that direction. Based on the evidence presented in this study, we recommend a number of actions related to public expenditure on oil and gas developments:
• Complete a systematic review of all subsidies on a regular basis. This important task should be undertaken periodically to ensure that the subsidies in place are in the
7 In 1976, the federal government granted a remission order allowing participants in the Syncrude oil sands project to deduct royalty payments while still making use of the resource allowance. This remission order expired in 2003, but was associated with federal expenditure over the 1996–2002 study period. 8 Pigeon, Marc-Andre. 2003. Tax Incentives and Expenditures Offered to the Oil Sands Industry. Parliamentary Research Branch. 9 Organisation for Economic Co-operation and Development. 2000. Economic Survey of Canada. Paris, France: OECD. 10 Organisation for Economic Co-operation and Development. 1995. Environmental Performance Review: Canada. Paris, France: OECD. 11 Organisation for Economic Co-operation and Development. 2004. Environmental Performance Review: Canada. Paris, France: OECD.

6
Government Spending on Canada's Oil and Gas Industry
best interest of society given current conditions. For example, many of the subsidies associated with oil and gas production were established when oil and natural gas prices were different than they are today. Changes in prices and other national/international conditions should trigger regular assessments of existing subsidies.
• Eliminate federal subsidies to the oil and gas sector. In doing so, fiscal objectives
will be aligned with environmental objectives. This is an important component of any policy package intended to reduce GHG emissions. To determine which subsidies are most appropriate for removal, a complete assessment of federal subsides to the oil and gas sector should be undertaken by appropriate government authorities with input from other relevant stakeholders. The assessment should be accompanied by the establishment of a specific timetable for the elimination of environmentally harmful subsidies associated with oil and gas developments, including oil sands.
• Redirect environmentally harmful oil and gas subsidies towards environmentally
beneficial energy options. Government support for energy conserving, energy efficient and low-impact renewable energy technologies needs to be expanded until such time as they have gained substantial market share and are able to compete with conventional technologies on their own.
• Develop and implement a just transition strategy for communities highly
dependent on oil and gas production. As subsidies are phased out, funds should be made available to facilitate a transition away from oil and gas for communities highly dependent on oil and gas production.
• Reconcile government support for oil sands developments with international
obligations to reduce GHG emissions. The preferential treatment for oil sands development currently taking place is at odds with environmental objectives and, specifically, Canada’s obligations to reduce GHG emissions under the Kyoto Protocol and the United Nations Framework Convention on Climate Change. Immediate reform of this support is needed as part of government policy action to reduce GHG emissions in Canada.
• Implement the polluter pay principle. Government intervention is required to facilitate
the internalization of environmental costs into market prices. The most appropriate way to ensure this internalization is through the implementation of the polluter pay principle, whereby those that cause environmental harm are required to incur associated costs. For example, the federal government could reduce the number of GHG emission permits to be granted free-of-charge to the oil and gas sector under its proposed “Large Final Emitter” policy. It could also remove the “emissions intensity” basis of that policy so that industry will have to pay for permits to cover emissions associated with production increases.
• Maximize revenue generation from oil and gas developments. To the extent that
governments in Canada are not maximizing revenue collection from the development of oil and gas resources, they are instead providing an implicit subsidy to the oil and gas sector. Governments in Canada need to ensure that they are providing maximum compensation to the citizens of the country for the development of these non-renewable, largely publicly owned resources.

7
Government Spending on Canada's Oil and Gas Industry
• Provide comprehensive estimates of federal expenditure, including tax
expenditure, at the sectoral level. Expenditure associated with all forms of government support should be tracked and published by the Department of Finance on an annual basis.
• Provide accurate and up-to-date estimates of provincial expenditure on a sectoral
basis in Alberta.12 The government of Alberta does not currently track expenditure on oil and gas developments. Informed public debate requires public knowledge of the level of government support provided through tax breaks, reduced royalties and support for research and development on an annual basis.
Report Outline Following the Introduction, the Background chapter puts government support for oil and gas production into the context of GHG emissions and Canada’s international obligations to address climate change. The background chapter is followed by the Methodology, which describes the key data sources used for this study as well as the approaches employed to establish expenditure estimates. We then present the results (in two chapters) and discuss expenditure estimates for oil and gas production from the federal government as well as expenditure specifically associated with oil sands (both federal and provincial). The Supporting Evidence chapter puts the results of this study into the context of other work done in this important area of public policy. The Conclusion recommends policy changes and describes important areas for future research related to public expenditure on oil and gas production.
12 Similar estimates are needed for other oil- and gas-producing provinces, such as Saskatchewan and British Columbia, although these regions were outside the scope of this study.

8
Government Spending on Canada's Oil and Gas Industry
1 INTRODUCTION Governments in Canada subsidize a number of socially beneficial services, including health care, education and energy services. Subsidies to the energy sector that are for oil and gas production, however, are not all socially beneficial. In part, they contribute to negative environmental impacts and hinder developments of environmentally friendly alternative energy options. Indeed, Canada’s implementation of the Kyoto Protocol is seriously threatened by continued government support for oil and gas production, a sector with large and rapidly growing greenhouse gas (GHG) emissions. This paper examines the extent and type of government support provided to the oil and gas sector in Canada between 1996 and 2002 within the context of GHG emission trends and Kyoto commitments. We begin with a discussion of what constitutes a subsidy, at what point subsidies are ‘perverse,’ and the need for an evaluation of subsidies in Canada, especially in the energy sector.
What are subsidies? Individuals, households and businesses make decisions about goods and services to purchase and technologies to invest in based on the prices they observe in the marketplace.13 When all costs — financial, social and environmental — are reflected in market prices, economists say that the goods and services purchased or the technologies invested in are socially optimal. When, on the other hand, not all the costs are included in the purchase price, a market failure results.14 This misrepresentation can happen in two ways:
a) Prices do not tell the truth — A portion of the costs associated with the goods, services, or technologies are not reflected in market prices and are thus not directly incurred by the producers and/or consumers of the goods/services/technologies. Such costs are referred to as externalities. An example of an externality is health costs associated with urban smog that are not reflected in the price of gasoline or diesel.
b) Government policies adjust prices — Governments provide financial support to
producers and/or consumers of particular goods/services/technologies such that prices/costs are lower than they otherwise would be.
These market failures result in subsidies. When externalities exist, society at large is providing an implicit subsidy to the producers and/or consumers of particular goods, services or technologies by paying for the detrimental effects and environmental costs not included in the cost of the good/service/technology. Instead of producers and consumers incurring the environmental costs, society does in the form of degraded environmental conditions, health impacts from pollution or productivity losses from degraded land and water. Only when these costs are reflected in the price of goods and services (that is, they are internalized through government policies such as environmental taxes15) are such subsidies removed. Similarly,
13 Note that, throughout this discussion, when we refer to technologies we take these to also include the production processes associated with them. 14 A market failure is formally defined as the failure of the unregulated market system to achieve optimal allocative efficiency or social goals because of externalities, market impediments, or market imperfections. 15 Environmental taxes can be used as a proxy for environmental impacts so that, when levied on goods and services associated with significant environmental impacts, a portion of the environmental costs are included in market prices.

9
Government Spending on Canada's Oil and Gas Industry
when government support results in market prices being lower than they would otherwise be, the government, on behalf of citizens, is subsidizing the target good, service or technology. It is only when market failures are corrected and prices reflect full costs that consumers and producers are able to make truly informed decisions about goods or services to purchase and technologies to invest in. When governments, rather than those responsible for environmental impacts, incur costs associated with environmental protection or remediation this is also a form of a subsidy. As is the case with externalities, unless governments implement policies to ensure that such costs are formally recognized by the market, and thereby become part of consumer and producer decisions (i.e., unless those causing the damage are responsible for the associated environmental protection and remediation costs), this type of subsidy will prevail.16 According to one analyst, few Canadians realize the extent to which governments, and hence society at large, subsidize a wide range of environmentally harmful activities:17
The price people pay to fill their gas tank and heat their homes does not include the costs to the health system caused by air pollution; the cost of restoring wildlife habitat damaged by the exploration and development of fossil fuels; the indirect economic costs associated with illness caused by air pollution; or the costs of addressing the impacts of climate change.
While we recognize the importance of externalities and the need to internalize environmental costs and remove subsidies through, for example, the implementation of the polluter pay principle, in this report we focus almost entirely on the second form of subsidy described above — that is, financial support provided directly by governments. Over the last two decades there has been growing interest in the value of subsidies provided by governments around the world to various sectors. Concurrently, there has been mounting pressure to reduce and/or remove those subsidies associated with environmentally damaging activities. Yet, while there is increasing recognition of the need to identify, quantify and remove or reduce environmentally harmful subsidies, there remains significant disagreement on what actually constitutes such a subsidy. This is no less the case in the context of energy subsidies. As briefly described above, government intervention, assistance, transfers and support measures can all generally be considered subsidies. The narrowest definition of an energy subsidy includes only direct payments to energy producers or consumers. However, such payments are just one of several ways in which governments can support energy production and consumption. Broader definitions, such as that put forth by the Organization for Economic Cooperation and Development (OECD), define a subsidy in general terms as any measure that keeps prices for consumers below market levels, or for producers above market levels, or that reduces costs for consumers or producers.18 Similarly, the International Energy Agency (IEA) defines an energy subsidy as any government action that concerns primarily the energy sector and that lowers the cost of energy production, raises the price received by energy producers or
16 Myers, Norman and Jennifer Kent. 2001. Perverse Subsidies: How Tax Dollars Can Undercut the Environment and the Economy. Connecticut: Island Press. 17 Boyd, David R. 2003. Unnatural Law: Rethinking Canadian Environmental Law and Policy. Vancouver: UBC Press. 18 OECD. 1998. Improving the Environment through Reducing Subsidies. Paris, France: OECD.

10
Government Spending on Canada's Oil and Gas Industry
lowers the price paid by energy consumers.19 The table below describes the principal sources of subsidies based on the IEA definition.
Table 1-1 Main types of energy subsidies
HOW THE SUBSIDY WORKS GOVERNMENT INTERVENTION
EXAMPLE Lowers cost
of production Raises price received by producers
Lowers price paid by
consumers Grants to producers Grants to consumers
Direct financial transfer
Low-interest or preferential loans to producers
Rebates, deductions or exemptions on royalties, sales taxes, producer levies and tariffs
Tax credits
Preferential tax treatment
Accelerated capital cost allowances
Trade restrictions Quotas, technical restrictions and trade embargoes
Direct investment in energy infrastructure
Energy related services provided directly by government at less than full cost
Public research and development
Demand guarantees and mandated deployment rates
Price controls
Regulation of the energy sector
Market access restrictions
Source: Modified from Von Moltke, Anja, Colin McKee and Trevor Morgan. 2004. Energy Subsidies: Lessons Learned in Assessing their Impact and Designing Policy Reforms. United Kingdom: United Nations Environment Programme and Greenleaf Publishing. In contrast to the definitions described above, which focus on government support that alters costs or prices, other subsidy definitions are less restrictive: a subsidy is a form of government support extended to an economic sector (or institution, business or individual), generally with the aim of promoting an activity that the government considers beneficial.20 In general, all of the definitions presented here reflect a common theme: economic benefits conferred by governments upon individuals, companies or industries with the intent of encouraging certain behaviour. The economic benefit can be conferred in a number of ways. As the table above
19 International Energy Agency. 1999. Looking at Energy Subsidies: Getting the Prices Right. World Energy Outlook Insights. Paris, France: IEA 20 Myers, Norman and Jennifer Kent. 2001. Perverse Subsidies: How Tax Dollars Can Undercut the Environment and the Economy. Connecticut: Island Press.

11
Government Spending on Canada's Oil and Gas Industry
indicates, it can be provided, for example, through direct grants to producers or consumers, tax credits, accelerated depreciation rates, tax rebates or research and development support. The benefit can also take the form of forgone resource revenues. For the most part, oil and gas resources are publicly owned, and governments, as stewards of the resources, lease the rights to develop them to oil and gas companies. Governments then collect revenues (through use of royalties and taxes, for example) from oil and gas companies. To the extent that governments do not maximize revenue capture from oil and gas extraction, they are providing an implicit subsidy to the oil and gas sector. In some cases subsidies are desirable. The Canadian government, for example, subsidizes health care and education to ensure universal access to these vital social services. Likewise, there are subsidies that serve environmental purposes, such as support for renewable energy technologies (e.g., the Wind Power Production Incentive in Canada21) and financial incentives to increase energy efficiency in businesses, households and vehicles. Such subsidies result in technological improvements, accelerate cost reductions necessary for new and innovative energy technologies to compete with conventional and more environmentally damaging energy options, and improve environmental conditions. At the end of the day, these subsidies protect and improve the environment and save taxpayers money by reducing health costs and the need for environmental protection and remediation.22 Unfortunately, however, not all subsidies result in such societal benefits. From an environmental perspective, there are smart subsidies, which are good for the environment, and perverse subsidies, which cause environmental harm.
Perverse Subsidies Perverse subsidies are subsidies that result in adverse effects on economies and environments alike.23 Such subsidies cause market distortions that contribute to excessive consumption of non-renewable resources, foster pollution, waste, and inefficiency, and discourage conservation.24 In addition, they restrict the development of more environmentally friendly substitutes and perpetuate the status quo in production processes by making it cheaper to continue with existing technologies and methods than to adopt new technologies.25 They also divert limited financial resources away from other, competing social purposes.26 At the end of the day, such subsidies result in more environmental damage than would occur without the government support, and may actually penalize citizens twice:27 First, citizens cover the cost of the government support, whether in the form of financial payments or forgone tax revenues.
21 For information on this initiative, see http://www.canren.gc.ca/programs/index.asp?CaId=107&PgId=622 22 Boyd, David R. 2003. Unnatural Law: Rethinking Canadian Environmental Law and Policy. Vancouver: UBC Press. 23 Myers, Norman and Jennifer Kent. 2001. Perverse Subsidies: How Tax Dollars Can Undercut the Environment and the Economy. Connecticut: Island Press. 24 Boyd, David R. 2003. Unnatural Law: Rethinking Canadian Environmental Law and Policy. Vancouver: UBC Press. 25 Myers, Norman and Jennifer Kent. 2001. Perverse Subsidies: How Tax Dollars Can Undercut the Environment and the Economy. Connecticut: Island Press. 26 Von Moltke, Anja, Colin McKee and Trevor Morgan. 2004. Energy Subsidies: Lessons Learned in Assessing their Impact and Designing Policy Reforms. United Kingdom: United Nations Environment Programme and Greenleaf Publishing. 27 Note that, in some cases, citizens may also benefit from the subsidy, for example, through associated employment opportunities.

12
Government Spending on Canada's Oil and Gas Industry
Second, citizens incur the direct and indirect costs associated with the environmental damage (including, for example, environmental restoration expenses and increased health care costs).28
Subsidies in Canada According to the OECD, “incentives for natural resource development and use [in Canada] raise sustainability concerns.”29 In support of this statement, a recent study by a prominent analyst summarized evidence from a number of sources describing massive federal and provincial government subsidies currently occurring in Canada that are increasing the probability of excessive resource use and environmental degradation.30 The evidence31 includes
• subsidies to the forest industry of between $3 and $8 billion annually • subsidies to the mining industry of approximately $6 billion annually • fishing subsidies of $553 million in 1997 and $697 million in 1996 • agricultural subsidies of $5.6 billion in 2000 • transportation subsidies (air, marine, rail and highway) from the federal government
alone ranging from $600 million to $2 billion annually between 1995 and 2000 • subsidies to the nuclear industry of $163 million in 2004/5.
In the context of subsidies to the fossil fuel industry, the subject of this study, Article 2 of the 1997 Kyoto Protocol explicitly recognizes the important role that removing subsidies could play in achieving GHG emission reductions. And while considerable political and legal progress has been made globally in negotiations to control GHG emissions and thereby mitigate climate change, many countries, including Canada, continue to subsidize fossil fuel production. Thus, while there may be general agreement on the need to reform some energy subsidy programs, implementation of subsidy reform has so far been limited.32 Indeed, the OECD has criticized Canada in the past because “direct subsidies and fiscal incentives to the energy industry continue to undermine efforts to improve energy efficiency.”33 The OECD Environmental Strategy for the First Decade of the 21st Century, published in 2001, was adopted by all OECD Environment Ministers, including Canada’s. This strategy, among other things, calls for governments to create incentives for emission reductions through technological and social innovations, giving priority to market-based instruments such as subsidy removal, green tax reform and tradable emission permits and quotas.34 Yet in Canada very little has been accomplished in this regard. While the Canadian government has reduced massive subsidies once provided to specific energy projects, subsidies to the oil and gas sector more generally are still considerable. The OECD recently called for a “[s]ystematic review of environmentally
28 Boyd, David R. 2003. Unnatural Law: Rethinking Canadian Environmental Law and Policy. Vancouver: UBC Press. 29 OECD. 2000. Economic Survey of Canada. Paris, France: OECD. 30 Boyd, David R. 2003. Unnatural Law: Rethinking Canadian Environmental Law and Policy. Vancouver: UBC Press. 31 Specific sources for the items described below are available in Boyd, David R. 2003. Unnatural Law: Rethinking Canadian Environmental Law and Policy. Vancouver: UBC Press. 32 Von Moltke, Anja, Colin McKee and Trevor Morgan. 2004. Energy Subsidies: Lessons Learned in Assessing their Impact and Designing Policy Reforms. United Kingdom: United Nations Environment Programme and Greenleaf Publishing. 33 OECD. 1995. Environmental Performance Review: Canada. Paris, France: OECD. 34 OECD. 2001. OECD Environmental Strategy for the First Decade of the 21st Century. Adopted by OECD Environment Ministers. Paris, France: OECD.

13
Government Spending on Canada's Oil and Gas Industry
harmful subsidies in sectors such as transportation and energy.”35 In Canada this review has thus far not been completed. This study is a first step in responding to that call; much more research in this area is required to complete a full review of environmentally harmful subsidies, and definitive action is required for Canada to meet commitments signed onto as part of the OECD’s Environmental Strategy for the First Decade of the 21st Century. The purpose of this study is to investigate public support in the form of government expenditure on the oil and gas sector in Canada — a sector that is a major and rapidly growing contributor to Canada’s emissions of GHGs. To that end, we identify and document the various forms of public support provided to industry by the federal government. We focus on support provided through grants, the tax system and government departments for conventional oil and gas as well as for oil sands. We also discuss provincial support for oil sands. This special focus on oil sands development is important as previous research by the Commissioner of the Environment and Sustainable Development concluded that investments in oil sands receive significant tax concessions relative to other forms of energy.36 In addition, we provide evidence of an implicit subsidy in Canada provided to the oil and gas sector in the form of forgone resource revenues due to tax and royalty regimes that do not maximize revenue capture from oil and gas extraction. In this study, we do not consider costs associated with environmental protection or remediation or externalities associated with oil and gas production, although both topics are worthy of future study.
35 OECD. 2004. Environmental Performance Review: Canada. Paris, France: OECD. 36 Commissioner of the Environment and Sustainable Development. 2000. Report of the Commissioner of the Environment and Sustainable Development.

14
Government Spending on Canada's Oil and Gas Industry
2 BACKGROUND: WHY OIL AND GAS? The oil and gas industry is a major and rapidly growing contributor to Canada’s emissions of greenhouse gases (GHGs).37 In 2002, 20% of Canada’s GHG emissions came from the oil and gas industry, up from 16% in 1990. Upstream oil and gas production and natural gas transmission, which now account for 16% of Canada’s GHG emissions, saw their emissions increase by 56% between 1990 and 2002. Petroleum refining and natural gas distribution, which now account for 4% of Canada’s GHG emissions, saw their emissions increase by a more modest 17% over the same period. Total GHG emissions from Canada’s oil and gas industry rose by 47% between 1990 and 2002. These large increases occurred at the same time that the Government of Canada made repeated commitments to reverse the growth of Canada’s total GHG emissions as part of coordinated international efforts to address climate change. First, in 1992, Canada ratified the United Nations Framework Convention on Climate Change,38 thereby committing itself to “aim” to return its GHG emissions to the 1990 level by 2000. Then, in 1997, Canada agreed to a target under the Kyoto Protocol of reducing its GHG emissions further, to 6% below the 1990 level during 2008–12.39 Canada ratified the Kyoto Protocol in December 2002, and the Protocol will enter into legal force on February 16, 2005. There is a strong international scientific consensus that global warming is underway at a rate unprecedented in the past millennium, that GHG emissions from human activities are the largest contributor to this warming, and that profound, globally pervasive impacts on the natural environment — and on the societies and economies that depend on it — will occur if emissions are not reduced far below current levels.40 The national science academies of 17 countries, including those of Australia, Britain, Canada, China, France, Germany, India and Italy, have described the Kyoto Protocol as “a small but essential first step towards stabilizing atmospheric concentrations of greenhouse gases,” and urged governments to ratify it.41 Some leading voices within the oil and gas industry have accepted the reality of human-induced climate change and the importance of major efforts to prevent it. John Browne, Group Chief Executive of BP, says “we’ve come to the judgment that to avoid serious impact upon societies or the environment it is necessary to stabilize atmospheric concentrations of greenhouse gases at around 500–550 parts per million.”42 Shell has also put forward scenarios that allow the
37 Figures in this paragraph are from Matin, Afshin, Pascalle Collas, Dominque Blain, Chia Ha, Chang Liang, Loretta MacDonald, Scott McKibbon, Craig Palmer and Kerry Rhoades. 2004. Canada’s Greenhouse Gas Inventory 1990–2002. Environment Canada, p. 184; http://www.ec.gc.ca/pdb/ghg/inventories_e.cfm. 38 The convention entered into force in 1994. 39 The Kyoto Protocol target applies to emissions net of purchases of emissions units under international emissions trading and net of credits for carbon “sinks” in the forest and agricultural sectors. 40 Intergovernmental Panel on Climate Change. 2001. Summary for Policymakers: A Report of Working Group I of the Intergovernmental Panel on Climate Change; http://www.ipcc.ch/pub/spm22-01.pdf. 41 The Royal Society. 2001. Royal Society backs international call for action on climate change. News release, 18 May; http://www.royalsoc.ac.uk/templates/press/releasedetails.cfm?file=318.txt. 42 Browne, Lord John. 2003. Climate Change. Speech to the Institutional Investors Group, London, 26 November; http://www.bp.com/genericarticle.do?categoryId=98&contentId=2015334.

15
Government Spending on Canada's Oil and Gas Industry
atmospheric GHG concentration to stabilize below 550 ppm.43 This stabilization level will require global GHG emissions to decrease by 60–80% relative to current levels by 2100.44 The rapidly rising GHG emissions from Canada’s oil and gas industry stand in stark contrast to the deep cuts that are required. Not only have the sector’s GHG emissions risen rapidly since 1990, but they are projected to continue rising at similar rates. Canada’s official “business-as-usual” GHG emissions projection shows the emissions from upstream oil and gas production (including natural gas transmission) rising from 72.6 megatonnes (Mt) in 1990 to 144.4 Mt in 201045 — an increase of 99%. The Alberta Chamber of Resources has published a longer-term business-as-usual projection of GHG emissions from Canada’s upstream oil and gas production (presumably excluding natural gas transmission) rising from about 60 Mt in 1990 to 160–230 Mt in 203046 — an increase of 167–283%. These enormous increases are driven by rapid development of oil sands while emissions from conventional oil production actually fall. The Government of Canada published its Kyoto Protocol implementation plan in November 2002. The Climate Change Plan for Canada47 seeks to close a “Kyoto gap” of 240 Mt of carbon dioxide equivalent between national business-as-usual projected emissions in 201048 and the annual emissions level needed to comply with the Kyoto Protocol. In the Speech from the Throne of October 5, 2004, the government reiterated “that it will respect its commitment to the Kyoto Accord …by refining and implementing an equitable national plan….”49 A few days earlier the OECD called on the government to “further elaborate and aggressively implement the Climate Change Plan for Canada….”50 Government policy is thus trying to advance in two diametrically opposed directions. On the one hand, the government seeks to meet a legally binding and internationally urged commitment to cut GHG emissions. On the other hand, it is providing strong support to a rapidly expanding oil and gas industry. This is the opposite of the “clear and effective structure of
43 Watts, Sir Philip. 2003. Prudence Pays: Practical Steps to Bridge Conflicting Views on Climate Change. Speech delivered at Rice University, Houston, 12 March 12; http://www.shell.com/static/media-en/downloads/speeches/ pw_rice120303.pdf. 44 Swedish Environmental Protection Agency. 2002. Kyoto and Beyond: Issues and Options in the Global Response to Climate Change, p. 19; http://www.internat.naturvardsverket.se/documents/issues/climate/report/Kyoto.pdf. 45 National Climate Change Process Analysis and Modelling Group. 1999. Canada’s Emissions Outlook: An Update, p. C-27; http://www.nrcan.gc.ca/es/ceo/update.htm. This document projects 2010 emissions from the sector of 121.2 Mt. However, the government subsequently updated its projection, adding 23.2 Mt to upstream oil and gas production in 2010, as documented in Analysis and Modelling Group. 2002. The Magnitude of the Challenge: Revising the Gap. PowerPoint presentation to Joint Ministers Meeting, February. 46 Alberta Chamber of Resources. 2004. Oil Sands Technology Roadmap, p. 16; http://www.acr-alberta.com/ Projects/ Oil_Sands_Technology_Roadmap/OSTR_report.pdf. 47 Government of Canada. 2002. Climate Change Plan for Canada; http://www.climatechange.gc.ca/plan_for_canada/plan/. 48 The year 2010 is commonly used in analysis of Canada’s Kyoto obligations, as it is the middle year of the five-year Kyoto Protocol “commitment period” of 2008–12. 49 http://www.pm.gc.ca/eng/news.asp?id=274. 50 Organisation for Economic Co-operation and Development. 2004. OECD Environmental Performance Reviews: Canada, p. 170.

16
Government Spending on Canada's Oil and Gas Industry
incentives” that Stéphane Dion called for in his inaugural speech as federal Environment Minister.51 Federal government support for the oil and gas industry comes not only in the form of public expenditure as documented in this report, but in the very policies the government is proposing to deploy under the Climate Change Plan for Canada. Thus, as we saw above, the upstream oil and gas industry’s projected doubling of emissions between 1990 and 2010 contributes 72 Mt to Canada’s “Kyoto gap” of 240 Mt, and is the single biggest reason why the gap is so large. Yet the federal government is proposing to require the sector to reduce its annual emissions by only 15%, or 22 Mt, below the business-as-usual level by 2010.52 This amounts to allowing the upstream oil and gas industry to increase its emissions by 69% between 1990 and 2010.53 The actual increase could be even greater because the government is proposing to set targets for industry in terms of emissions intensity (emissions per unit of production), which means that emissions increases due to production increases beyond the official business-as-usual projected levels will be permitted without limit. Allowing these emissions increases is all the more difficult to defend when the federal government is proposing to give industry unlimited access to the international emissions trading market as a means of reducing its emissions. Emission reduction credits valid for compliance with the Kyoto Protocol are currently being offered for about $10 (Canadian) per tonne of carbon dioxide equivalent.54 For the production of synthetic crude oil from oil sands, the most GHG-intensive part of the oil and gas sector, this represents only about 80 cents per barrel of oil.55 Furthermore, it is important to note that the release of GHG emissions is not the only environmental impact associated with the oil and gas sector. Exploration and production of oil and gas also results in land disturbance as wells are drilled, roads are built and pipelines are constructed. The number of wells drilled in Canada in 1996 was 14,557. In 2002, that number was 17,182 — an increase of 18%. Oil and gas production also results in emissions of criteria air contaminants, including acidifying emissions of sulphur dioxide and nitrogen oxide (emissions of nitrogen oxide increased by 25% between 1996 and 2002, even without taking into account those emissions associated with oil sands developments).56 Oil and gas production is also associated with significant water consumption. In 2002, 380 million cubic metres of
51 Environment Canada. 2004. Environmental Action for Economic Competitiveness: Will Canada Lead the New Industrial Revolution? Speech, 10 September; http://www.ec.gc.ca/minister/speeches/2004/040910_s_e.htm. 52 Natural Resources Canada. 2002. Government responds to industry concerns about climate change. News release, 18 December; http://www.nrcan-rncan.gc.ca/media/archives/newsreleases/2002/2002147_e.htm. 53 An increase from 72.6 Mt in 1990 to 145.6 × 0.85 = 123.8 Mt in 2010 is a 70% increase. 54 Evolution Markets. 2004. GHG Market Update, September 2004; http://www.evomarkets.com/evoid/. 55 This assumes 80 kg of carbon dioxide equivalent per barrel. Alberta Chamber of Resources, 2004. Oil Sands Technology Roadmap, p. 15; http://www.acr-alberta.com/ Projects/ Oil_Sands_Technology_Roadmap/OSTR_report.pdf. 56 Clearstone Engineering Limited. 2004. A National Inventory of Greenhouse Gas, Criteria Air Contaminant and Hydrogen Sulphide Emissions by the Upstream Oil and Gas Industry. Prepared for the Canadian Association of Petroleum Producers.

17
Government Spending on Canada's Oil and Gas Industry
surface water was allocated by the province of Alberta for use by the petroleum industry for oil extraction and processing.57
57 Griffiths, Mary and Dan Woynillowicz. 2003. Oil And Troubled Waters: Reducing the Impact of the Oil And Gas Industry on Alberta’s Water Resources. The Pembina Institute.

18
Government Spending on Canada's Oil and Gas Industry
3 METHODOLOGY Methodologies to identify and document the full cost of support provided by governments to a given sector or activity are still at a developmental stage. However, recent work by the Commissioner of the Environment and Sustainable Development58 has attempted to account for a broader range of expenditures, including those provided through the tax system. This study examines public expenditure associated with the upstream oil and gas sector in Canada, focusing on expenditure at the federal level for the production of oil, natural gas and oil sands.59 We also discuss provincial support for oil sands developments in Alberta. This special focus on oil sands development is important as growing oil sands production is the principal reason for increasing environmental impacts from Canada’s oil and gas sector, and because previous research by the Commissioner of the Environment and Sustainable Development concluded that investments in oil sands receive “significant tax concessions” relative to other forms of energy.60 Although other studies addressing the issue of subsidy identification and quantification have examined a particular sector relative to other sectors, it was beyond the resources of this study to conduct and develop comprehensive pictures of other sectors for the purposes of comparison. Furthermore, relative to other sectors, the favourable treatment of the oil and gas sector in Canada in terms of taxation has already been well established through the work of others including the Technical Committee on Business Taxation61 and, in the case of oil sands, the Commissioner of the Environment and Sustainable Development.62 More broadly, given the focus of international initiatives on the need to remove subsidies for unsustainable patterns of materials production and consumption, the goal of this analysis is to develop a detailed understanding of the types and extent of federal government support for the oil and gas industry, a sector central to this issue. It is not the intention of this study to present a full-cost accounting of oil and gas production in Canada, as many expenditures, such as those associated with environmental and social impacts, were outside the scope of this analysis. However, the federal government should carry out such an exercise as a priority to determining the effects of continued reliance on oil and gas production. For the purposes of this study, we focus on expenditure associated with government programs and initiatives within each of the following three categories between 1996 and 2002 inclusive:63
58 Commissioner of the Environment and Sustainable Development. 2000. Report of the Commissioner of the Environment and Sustainable Development. 59 The focus of this analysis is on the upstream oil and gas sector (oil and gas production). Expenditure associated with natural gas transmission, petroleum refining, and natural gas distribution is outside the scope of this study. 60 Commissioner of the Environment and Sustainable Development. 2000. Report of the Commissioner of the Environment and Sustainable Development. 61 The Technical Committee on Business Taxation. 1997. Report of the Technical Committee of Business Taxation. Submitted to the Honourable Paul Martin, Minister of Finance. 62 Commissioner of the Environment and Sustainable Development. 2000. Report of the Commissioner of the Environment and Sustainable Development. 63 The 1996–2002 timeframe was chosen mainly to be consistent with previous analysis completed by the Department of Finance on tax expenditure associated with oil sands developments. Furthermore, this

19
Government Spending on Canada's Oil and Gas Industry
1. Direct government expenditure on the oil and gas industry: This includes
expenditure for research and development, infrastructure support and direct involvement in specific oil and gas projects.
2. Program expenditure associated with the oil and gas industry: This includes the
budgets of various government departments whose work directly relates to the oil and gas sector.
3. Tax expenditure on the oil and gas industry: Described in more detail below, this
includes tax measures designed to reduce the taxes payable by the oil and gas industry relative to what would be payable under a neutral tax system (i.e., one that does not favour one sector or industry over another). The cost of relevant tax measures is evaluated in terms of forgone tax revenue.
Data Sources To the greatest extent possible, this project relied on the government’s own statements of their expenditure drawing on annual budget documents, main estimates, public accounts and public announcements, such as press releases and backgrounders related to particular programs. Follow-up inquiries and informal interviews were conducted with federal and provincial government officials as necessary. In some cases, government estimates for particular tax measures over the study period were not available. Where the program in question was considered to be of potential significance, and historical data related to forgone revenue or tax credits provided under the program was available, estimates of the value of the program for the year in question were developed on the basis of the historical data. In other cases, where the government was unable to provide expenditure estimates, we derived these using Statistics Canada financial and taxation statistics. These estimates and their foundations are clearly described below and are intended to establish an indication of the scale of the support provided through a given program or initiative, rather than a precise measurement. Where expenditure could not be gathered from government documents, estimated from historical trends, or inferred from Statistics Canada data, this is noted in the text, and the measure is assigned a value of zero in total expenditure estimates.
Excluded Costs This study focuses on government expenditure related to the oil and gas industry. The wider social and environmental costs associated with the industry, such as the health impacts of air and water pollution, the loss of ecosystem services, the intrinsic value of degraded nature, and the social effects of the industry’s cyclical employment patterns, are not included. However, the potential significance of these costs should be recognized, and be the subject of future studies. The economic value of other significant forms of support that may be in place, such as access to water resources at little or no cost, were also excluded from the analysis. In terms of program expenditure, we include only those government departments whose responsibilities are solely and directly linked to oil and gas operations or developments. We do not consider, for example,
timeframe avoids the inclusion of major government investments in projects such as Hibernia, which significantly inflate expenditure results for a particular year (1995).

20
Government Spending on Canada's Oil and Gas Industry
expenditure associated with ministries and departments whose responsibilities are indirectly linked to oil and gas, such as environment ministries. The annual budgets of government departments whose work directly relates to the oil and gas sector are included in ‘program expenditures’ in this study. However, in some cases, oil and gas government departments carry out regulatory activities related to the protection of public goods (e.g., health, safety and environmental protection) as well as the provision of research, promotional and support services to the industry. Such activities are desirable and necessary to ensure adequate protection of public health and safety and the environment. In other cases, the responsibilities of government departments relate not just to oil and gas, but to other sectors as well (renewable energy, energy efficiency and electricity for example). Because of these two factors, in the results chapter of this report we show total expenditure figures both with and without program expenditure estimates.
Estimating Tax Expenditure Tax expenditure is measured as the foregone tax revenue resulting from a particular tax initiative. Significant methodological challenges exist with respect to estimating tax expenditure in this way. This is due to the difficulties associated with identifying base tax rates against which to measure the reduction in tax payable, and the potentially complex interactions between different tax measures and basic tax rates. The most common and widely accepted method for estimating tax expenditure is to define a standard of comparison and measure the difference in tax expenditure between the standard and the current tax framework. While there exists a degree of disagreement about how the standard should be defined,64 the most common point of reference is a neutral tax system. When properly designed, a neutral tax system does not favour one industry type over another. Specifically, this means the same general tax rate is applied to all activities, operating costs are fully deductible in the year incurred, there are no incentives, preferential tax rates or exemptions from tax, and deductions for all capital assets are depreciated in a consistent manner. Like the current system, the neutral regime permits the use of deductions to the extent that the taxpayer has sufficient income.65 Oil and gas companies operating in Canada currently benefit from a number of tax concessions (such as an accelerated capital cost allowance, exploration and development expense benefits and investment tax credits) that would not be part of a neutral tax system. In the context of oil and gas production, we define the neutral system as characterized by the following:
• Investment tax credits are not provided • Royalties are treated as a cost of production and are fully deductible • All activities are subject to the same tax rate • Capital assets are written off over their useful life • Accelerated depreciations are eliminated
Specific sources for expenditure estimates or methods employed to estimate expenditure for key tax initiatives follows.
64 Department of Finance. 1995. Government of Canada Tax Expenditures. http://www.fin.gc.ca/purl/taxexp-e.html 65 Natural Resources Canada. 1996. The Level Playing Field: The Tax Treatment of Competing Energy Investments.
21
Government Spending on Canada's Oil and Gas Industry
Accelerated Capital Cost Allowance The capital cost allowance (CCA) provides a means of depreciating capital investments for income tax purposes. Capital expenses are grouped into capital cost allowance classes, which have annual write-off (depreciation) rates specified in the Income Tax Act. Some classes of capital qualify for an accelerated capital cost allowance (ACCA). In such cases, the rate at which assets can be written off for tax purposes is more rapid than would be permitted under a neutral tax system. Under a neutral tax system assets would be written off over their useful lives. ACCAs result in tax deferrals for companies such that they pay less tax in the present and more tax in the future. The difference between the tax that is paid with the accelerated write-off in place and the tax that would be paid were the assets depreciated over their useful life is the value of the tax expenditure to government. According to the Department of Finance, the availability of fast write-offs such as the ACCA was reduced significantly in 1988.66 As a result, capital cost allowance rates contained in the Income Tax Act now generally reflect the useful life of assets. One significant exception to this is oil sands developments, which qualify for significant accelerated write-offs. The Department of Finance states that the tax expenditure for ACCA write-offs in any particular year would be calculated as the forgone tax revenue resulting from the difference between the deduction taken for tax purposes and the deduction that would be taken under a benchmark tax system (which in this case is a neutral tax system).67 However, it does not provide estimates on a regular basis of this expenditure. In 2001 the department released an evaluation of tax expenditure-associated ACCA for the oil sands sector. The expenditure figures employed in this study for ACCA are taken directly from that study.68
Canadian Development Expense, Canadian Exploration Expense and Canadian Oil and Gas Property Expense
As with the ACCA, the benefit associated with the Canadian Development Expense (CDE), the Canadian Exploration Expense (CEE) and the Canadian Oil and Gas Property Expense (COGPE) is the deferral of taxes paid, in this case for expenditure associated with oil and gas development, exploration and property, respectively. CEE is deductible at a rate of 100% while CDE is deductible at a rate of 30% and COGPE is deductible at a rate of 10%.69 In the Commissioner of the Environment and Sustainable Development’s 2000 report investigating public support for different energy investments, the commissioner did not estimate tax expenditure associated with CDE, CEE and COGPE, recognizing that such expenditure should be calculated on a firm-by-firm basis. However, the commissioner did state that a reasonable proxy for tax expenditure associated with initiatives that permit a faster write-off of investments is the tax on the difference between the value of expenditure written off in a company’s books and the amount written off for the same expenditure for tax purposes. The amount written off in the books is reflective of the useful life of the investment. When the tax 66Department of Finance. 2004. Tax Expenditures and Evaluations. http://www.fin.gc.ca/toce/2004/taxexp04_e.html 67 Ketchum, Ken, Robert Lavigne and Reg Plummer. 2001. Oil Sands Tax Expenditure. Department of Finance. 68 Ketchum, Ken, Robert Lavigne and Reg Plummer. 2001. Oil Sands Tax Expenditure. Department of Finance. 69 Development expenses include expenditures associated with drilling, converting or completing a well, building temporary access roads or preparing a well site. Exploration expenditure includes expenditures associated with determining the existence, location, extent and quality of a reservoir.

22
Government Spending on Canada's Oil and Gas Industry
write-off is greater than the book write-off, there is a reduction in taxes and positive tax expenditure. For this study, we employ the method put forward by the commissioner. That is, we measure the amount of expenditure associated with CDE, CEE and COGPE as the difference between these two rates (that written off for book purposes and that written off for tax purposes) multiplied by the federal income tax rate (see discussion on the federal income tax rate below). Using Statistics Canada’s financial and taxation statistics available in Statistics Canada’s Catalogue No. 61-219, we measured the difference between the depreciation of expenses for book purposes and the value of the tax claim for these expenses in each year from 1996 to 2002.70 Annual tax rates were obtained from the Department of Finance.71 Note that Statistics Canada did not track financial and taxation statistics for enterprises in 1999. To estimate expenditure in 1999 we took the average of the 1998 and 2000 expenditure estimates. Because we were unable to estimate the tax expenditure on a firm-by-firm basis as was suggested by the commissioner, we recognize that the resulting estimate is representative rather than precise.
Resource Allowance and Non-deductibility of Royalties Normal income tax rules allow a deduction for most amounts that are paid to earn income. However, until recently, the federal government did not allow the deduction of provincial oil and gas royalties against income for tax purposes.72 Instead the government had a resource allowance (RA) in place. The RA is a 25% deduction against “resource profits” (before deductions of interest, and exploration and development expenses) intended to reflect royalties paid to provinces. 73 To the extent that the RA exceeds the value of royalties paid, the federal government incurs expenditure equal to the value of the tax on the difference between the RA and the value of the royalties. Between 1996 and 2002, the RA received by the oil and gas sector exceeded the value of royalties paid on these resources. Thus, for this study, we estimate the forgone tax revenue associated with the RA to be the federal income tax rate multiplied by the difference between the RA and royalties. RA and royalty data for the oil and gas sector were obtained from the Department of Finance for 1996 to 2001,74 inclusive. Data for 2002 is from Statistics Canada.75
Earned Depletion Earned Depletion (ED) is an additional 33 1/3 % deduction from taxable income of certain exploration and development expenditures and other resource investments incurred prior to 1990. The deductions for earned depletion are generally limited to 25 per cent of the taxpayer's annual resource profits. Earned depletion not deducted in a particular year can be carried forward indefinitely for use in later years.76 A similar approach to that described above was employed to estimate tax expenditure associated with ED. In this case, we applied the annual federal income tax rate to Statistics Canada data for the amount of ED claimed in each year
70 Statistics Canada. 1995 to 2002. Financial and Taxation Statistics for Enterprises. Statistics Canada Catalogue 61-219. 71 http://www.fin.gc.ca/toce/2003/taxratered_e.html 72 The resource allowance and the non-deductibility of royalties are being phased out. 73 Department of Finance. 2003. Improving the Income Taxation of the Resource Sector in Canada. 74 Department of Finance. 2003. Improving the Income Taxation of the Resource Sector in Canada. 75 Statistics Canada. 1995 to 2002. Financial and Taxation Statistics for Enterprises. Statistics Canada Catalogue 61-219. 76 http://www.fin.gc.ca/gloss/gloss-e_e.html

23
Government Spending on Canada's Oil and Gas Industry
over the study period.77 Tax expenditures over the study period reflect use of existing earned depletion pools. Statistics Canada did not track taxation statistics for enterprises in 1999. To estimate expenditure in 1999 we took the average of the 1998 and 2000 expenditure estimates.
Investment Tax Credits Key investment tax credits available to the oil and gas sector in Canada include the Atlantic Investment Tax Credit (AITC) and the Scientific Research and Experimental Development (SR&ED) tax credit. The AITC promotes economic development in the Atlantic provinces and the Gaspé region. Eligible investments include qualifying buildings, machinery and equipment used or leased by the taxpayer. A business is allowed to deduct 10% of eligible costs from its federal income tax liability. The incentive is available to agriculture, fishing, forestry, manufacturing and resource extraction, though firms engaged in resource activities such as mining and offshore oil and gas extraction have been the largest recipients of this tax credit. 78 The SR&ED tax credit is designed to support investments by industry to undertake scientific research and experimental development in Canada. Companies can reduce the taxes they have to pay by claiming a credit equal to 20% of the cost of eligible research and development expenditures. Smaller Canadian-controlled private corporations can claim 35%, and a portion of this amount is refundable if the claimant does not have any taxes to pay.79 The expenditure estimates used in this study for the SR&ED and the AITC tax credits are from Statistics Canada and are equal to the value of the claim associated with these tax incentives (categorized as ‘Investment Tax Credits’ in Statistics Canada data). 80
Syncrude Remission Order In 1976, the federal government issued a remission order allowing participants in the Syncrude oil sands project to deduct royalty payments while still making use of the resource allowance. This remission order expired in 2003, but was associated with federal expenditure over the 1996–2002 study period. Expenditure associated with this order was obtained from the Public Accounts of Canada for 1996 to 2002, inclusive.81
Federal Corporate Income Tax Rate The table below shows the annual federal corporate income tax rates used to calculate tax expenditure associated with CDE, CEE, COGPE, RA and ED. These rates were applicable to most sectors in Canada over the study period and define the neutral tax system for the purposes of this study.
Table 3-1 Federal income tax rates (%) for neutral tax system
1996 1997 1998 1999 2000 2001 2002 29.1 29.1 29.1 29.1 29.1 28.1 26.1
Source: Department of Finance.
77 Statistics Canada. 1995 to 2002. Financial and Taxation Statistics for Enterprises. Statistics Canada Catalogue 61-219. 78 Department of Finance. 2003. Improving the Income Taxation of the Resource Sector in Canada. 79 Commissioner of the Environment and Sustainable Development. 2000. Report of the Commissioner of the Environment and Sustainable Development. 80 Statistics Canada. 1995 to 2002. Financial and Taxation Statistics for Enterprises. Statistics Canada Catalogue 61-219. 81 See http://www.pwgsc.gc.ca/recgen/text/pub-acc-e.html for all public account documents.

24
Government Spending on Canada's Oil and Gas Industry
Negative Tax Expenditure
It is important to note that in 2001 the federal income tax rate was reduced for all sectors except manufacturing and processing and the resource sector (including oil and gas).82 Thus, in 2001 and 2002, the oil and gas sector was subject to a federal income tax rate that was relatively higher than the neutral tax system used in this study (the tax rate applicable to the oil and gas sector remained at 29.1% in 2001 and 2002; as is described in greater detail later in this report, this situation has since changed). This means that, relative to the neutral tax system, in 2001 and 2002, the oil and gas sector was associated with “negative tax expenditures.” The negative tax expenditure in each of those years is equal to the difference between the amount of tax due at an income tax rate of 29.1% (the rate paid by the oil and gas sector in those years) and that which would have been due under the neutral tax system (28.1% in 2001 and 26.1% in 2002). Negative tax expenditure estimates for 2001 and 2002 are presented in this report and deducted from total tax expenditure estimates. The table below shows the difference between the two tax rates over the study period.
Table 3-2 Federal income tax rates (%) for neutral tax system compared to oil and gas sector
SECTOR 1996 1997 1998 1999 2000 2001 2002 Neutral Tax System 29.1 29.1 29.1 29.1 29.1 28.1 26.1 Resource Sector Tax Rate 29.1 29.1 29.1 29.1 29.1 29.1 29.1
82 The manufacturing and processing sector was already liable for a 21% income tax rate due to a 7% manufacturing and processing tax credit.

25
Government Spending on Canada's Oil and Gas Industry
4 FEDERAL EXPENDITURE ON OIL AND GAS PRODUCTION The oil and gas industry has played a significant role in shaping Canada’s energy sector. Canada is the third-largest producer of natural gas and the ninth-largest producer of oil in the world. British Columbia has experienced record drilling in the last several years and Alberta’s oil sands were recently designated as the second-largest oil deposit globally. Oil and gas production is expected to increase in both Saskatchewan and British Columbia, and there is mounting pressure to develop such resources in Canada’s northern territories. Clearly, oil and gas play an important role in Canada’s energy sector. In this chapter, we present the best publicly available information on federal expenditure associated with oil and gas (including oil sands) developments in Canada. As was described in the methodology chapter of this study, expenditure is classified as direct, programmatic or tax.
Direct Expenditure The table below presents key initiatives that result in federal expenditure on oil and gas production. For each item, we provide a description along with expenditure estimates for 1996 and 2002.
Table 4-1 Direct expenditure associated with oil and gas production, 2000$
INITIATIVE EXPENDITURE DESCRIPTION Canada/Nova Scotia Development Fund
1996 $0.3 million 2002 $0.5 million
This fund supports infrastructure costs directly or indirectly related to the exploration, development, production or transportation of oil and gas in the offshore area of Nova Scotia.83
Canada/ Newfoundland Development Fund
1996 $4.0 million 2002 $1.3 million
This fund supports infrastructure costs directly or indirectly related to the exploration, development, production or transportation of oil and gas in the offshore area of Newfoundland.84
Hibernia Interest Assistance Loan Agreement
1996 $0.0 2002 $11.5 million85
This agreement is an original provision of the November 1990 Hibernia Development Plan Agreements between owner companies and the Government of Canada. If crude oil prices are below $25 per barrel (1987 US$) interest assistance loans are available to cover up to a maximum of 50% of current interest payments in any given month on actual loans, or loans deemed to be guaranteed under the Primary Guarantee Facility.
83 Public Accounts of Canada, personal communication, October 8, 2004. 84 Public Accounts of Canada, personal communication, October 8, 2004. 85 Note that the federal government dedicated $120.4 million to the development of Hibernia in 1995.

26
Government Spending on Canada's Oil and Gas Industry
Table 4-1 Direct expenditure associated with oil and gas production, 2000$, continued
INITIATIVE EXPENDITURE DESCRIPTION Petroleum Technology Research Centre (PTRC)
1996 not in place 2002 $1.2 million
The PTRC is a non-profit petroleum research and development corporation located in Regina, Saskatchewan. The PTRC is a collaborative initiative of Natural Resources Canada (NRCan), Saskatchewan Industry and Resources (SIR), The University of Regina, and Saskatchewan Research Council (SRC).
Oil Sands Research and Development
1996 $7.8 million 2002 $11 million
This includes support for the Canadian Oil Sands Network for Research and Development (CONRAD)86 and the National Centre for Upgrading Technology (NCUT).87
In the table below we show the trend in expenditure over the study period. Key expenditure items are interest assistance to the Hibernia oil project and research and development associated with oil sands projects. Together these items account for over 75% of total cumulative expenditure between 1996 and 2002. It is also worth noting that direct expenditure to oil and gas production increased by 116% between 1996 and 2002.
Table 4-2 Direct expenditure associated with oil and gas production, million 2000$
ITEM 1996 1997 1998 1999 2000 2001 2002 TOTAL Can/NS Development Fund
0.3 1.9 1.0 1.2 1.8 4.4 0.5 11.0
Can/Nfld Development Fund
4.0 5.6 3.2 2.8 5.0 3.1 1.3 25.0
Petroleum Technology Research Centre
0.0 0.0 0.0 1.0 1.2 1.2 1.2 4.6
Hibernia 0.0 0.0 0.0 0.0 48.2 5.6 11.5 65.4 Oil Sands R and D 7.8 7.9 8.0 8.1 8.3 8.5 11.5 60.2 TOTAL 12.1 15.5 12.1 13.1 64.5 22.9 26.2 166.2
Program Expenditure In addition to direct expenditure, oil and gas production is associated with program expenditure. At the federal level, this includes a portion of the annual budget for the National Energy Board, the Newfoundland and Nova Scotia Offshore Petroleum Boards, the annual budget of the Northern Oil and Gas Directorate and a portion of the annual budget of Natural Resources Canada (NRCan). The government was unable to provide an estimate of the annual budget of the Northern Oil and Gas Directorate. It was not possible to establish estimates of oil- and gas-related expenditure associated with the relevant sectors of NRCan because of the broad mandates associated with these entities (i.e., their mandates extend far beyond just dealing with oil and gas).
86 CONRAD is a consortium of organizations striving to accelerate the advancement of oil sands technology. CONRAD’s membership comprises nine oil companies, two universities, three research groups, and the Alberta provincial government. 87 NCUT conducts heavy oil and bitumen upgrading research and was formed in 1995 as a partnership between the Canadian federal and Alberta provincial governments.

27
Government Spending on Canada's Oil and Gas Industry
Table 4-3 Program expenditure associated with oil and gas production, 2000$
INITIATIVE EXPENDITURE DESCRIPTION National Energy Board
1996 $22 million 2002 $33 million88
The National Energy Board is an independent federal agency that regulates several aspects of Canada’s energy industry. Its purpose is to promote safety, environmental protection and economic efficiency in the Canadian public interest within the mandate set by Parliament in the regulation of pipelines, energy development and trade.
Northern Oil and Gas Directorate
Not disclosed The Northern Oil and Gas Directorate is responsible for the management of oil and gas resources north of 60˚ latitude in the Northwest Territories, Nunavut and offshore. Responsibilities include the allocation of Crown lands to the private sector and the setting and collection of royalties. The directorate also regulates the industrial activities with respect to resource conservation, environmental protection and safety of workers.
Energy Technology and Programs Sector
Not disclosed The Energy Technology and Programs Sector includes the CANMET Energy Technology Sector that conducts R&D and related technology transfer activities in efficiency technologies in the industrial and buildings sector; vehicle and engine efficiencies; and alternative transportation fuels and renewable energy technology. It also includes the Office of Energy Efficiency, which provides policy analysis and advice on, and develops programs in support of, the efficient use of energy and the use of alternative energy and transportation fuels.
Energy Policy Sector of Natural Resources Canada
Not disclosed The Energy Policy Sector advises the government on federal energy policies, strategies, emergency plans and activities; promotes efficient energy use; and ensures development of energy sources to meet Canada’s domestic needs and export opportunities.89
Canada/ Newfoundland Offshore Petroleum Board
1996 $1.6 million 2002 $1.8 million
Canada/Nova Scotia Offshore Petroleum Board
1996 $0.8 million 2002 $1.6 million
Offshore boards were established as independent joint agencies of the Government of Canada and the provinces of Newfoundland and Nova Scotia. The boards are responsible for the regulation of petroleum activities within the respective provincial offshore areas. The federal and provincial governments share the operating costs of the respective boards 50/50.90
The table below presents program expenditure over the study period. Information on the annual budget of the Northern Oil and Gas Directorate was not publicly available. Additionally, for the NRCan sectors it was not possible to discern expenditure associated with oil and gas from that associated with other energy issues (renewable energy, energy efficiency, etc.). As a result of
88 These figures reflect 89% of the total annual budget of the National Energy Board. The 89% reflects the portion of the board’s work that relates to oil and gas. The remaining portion relates to electricity. 89 http://www2.nrcan.gc.ca/dpspub/index.cfm?fuseaction=orgchart.viewOrg&orgid=43&userLang=E 90 Public Accounts of Canada, personal communication, October 8, 2004.

28
Government Spending on Canada's Oil and Gas Industry
these two factors, the total estimate for program expenditure is limited to a portion of the annual budget of the National Energy Board and the Newfoundland and Nova Scotia Offshore Petroleum Boards.
Table 4-4 Program expenditure associated with oil and gas production, million 2000$
ITEM 1996 1997 1998 1999 2000 2001 2002 TOTALNational Energy Board 22 24 45 27 27 30 33 209 Northern Oil and Gas Directorate
n/a n/a n/a n/a n/a n/a n/a n/a
NRCan Energy Policy Sector
n/a n/a n/a n/a n/a n/a n/a n/a
NRCan Energy Technology and Programs Sector
N/a n/a n/a n/a n/a n/a n/a n/a
Canada/Newfoundland Offshore Petroleum Board
1.6 1.3 1.2 1.5 1.4 1.9 1.8 10.6
Canada/Nova Scotia Offshore Petroleum Board
0.8 0.7 0.7 0.8 1.5 1.6 1.6 7.7
TOTAL 25 26 47 30 30 34 37 227
Tax Expenditure The table below presents details on the numerous tax initiatives relevant to oil and gas production in Canada. It was not possible to obtain annual estimates of the tax expenditure associated with the ACCA. According to the Commissioner of the Environment and Sustainable Development, no one is currently collecting the data needed to estimate total tax expenditure related to accelerated write-offs.91 However, as will be described in more detail in the next chapter, the Department of Finance completed a study on tax expenditure associated with oil sands developments. As part of that study, it estimated oil sands tax expenditure on ACCA for the 1996–2002 period inclusive. That estimate is presented in the table below.
Table 4-5 Tax expenditure associated with oil and gas production, 2000$
INITIATIVE EXPENDITURE DESCRIPTION Canadian Exploration Expense (CEE)
1996 $721 million 2002 $1,035 million (CDE, CEE and COGPE combined)
CEE is a deductible at a rate of 100%. For the oil and gas sector, CEE includes certain intangible costs incurred to determine the “existence, location, extent or quality” of a crude oil or natural gas reservoir not previously known to exist.92
Canadian Development Expense (CDE)
1996 $721 million 2002 $1,035 million (CDE, CEE and COGPE combined)
CDE is deductible at a rate of 30% on a declining balance basis. For the oil and gas sector, CDE includes the costs of drilling, converting or completing a well, building a temporary access road or preparing a site to the extent such costs are not CEE. 93
91 Commissioner of the Environment and Sustainable Development. 2000. Report of the Commissioner of the Environment and Sustainable Development. 92 Department of Finance. 2003. Improving the Income Taxation of the Resource Sector in Canada. 93 Department of Finance. 2003. Improving the Income Taxation of the Resource Sector in Canada.

29
Government Spending on Canada's Oil and Gas Industry
Table 4-5 Tax expenditure associated with oil and gas production, 2000$, continued
INITIATIVE EXPENDITURE DESCRIPTION Accelerated Capital Cost Allowance (ACCA)
Expenditure associated with oil sands estimated at a total of $484 million from 1996 to 2002, inclusive94
Some classes of capital qualify for an ACCA. This permits depreciation of the capital assets at an accelerated rate. For example, an investment in the oil sands industry can qualify for an ACCA in three ways: 1. If the investment is for a new mine 2. If the investment is for a major expansion 3. If total investment in a year exceeds 5% of gross
revenue. Earned Depletion (ED)
1966 $33 million 2002 $17 million
An additional 33 1/3 per cent deduction from taxable income of certain exploration and development expenditures and other resource investments incurred prior to 1990. The deductions for earned depletion are generally limited to 25 per cent of the taxpayer's annual resource profits. Earned depletion not deducted in a particular year can be carried forward indefinitely for use in later years.95 ED is currently being phased out.
Resource Allowance (RA) and Non-deductibility of Royalties
1996 $146 million 2002 $84 million
RA is a 25% deduction against “resource profits” (before deductions of interest, and exploration and development expenses) that functions as a proxy for royalties paid to provinces, which are not deductible for income tax purposes.96 The resource allowance and the non-deductibility of royalties are being phased out.
Atlantic Investment Tax Credit (AITC)
1996 $136 million 2002 $112 million (AITC and SR&ED combined)
The AITC is an investment tax credit (ITC) that promotes economic development in the Atlantic provinces and the Gaspé region. Eligible investments include qualifying buildings, machinery and equipment used or leased by the taxpayer. A business is allowed to deduct 10% of eligible costs from its federal income tax liability. The incentive is available to all sectors, though firms engaged in resource activities such as mining and offshore oil and gas have been the largest recipients of this tax credit. 97
Scientific Research and Experimental Development Tax Credit (SR&ED)
1996 $136 million 2002 $112 million (AITC and SR&ED combined)
This ITC is designed to support investments by Canadian industry in scientific research and experimental development. Companies can reduce the taxes they have to pay by claiming a credit equal to 20% of the cost of eligible research and development. Smaller Canadian-controlled companies can claim 35%.98
94 The source of this number is: Ketchum, Ken, Robert Lavigne and Reg Plummer. 2001. Oil Sands Tax Expenditure. Department of Finance. The number has been converted to 2000$ from 1996$ for the purpose of this study. 95 http://www.fin.gc.ca/gloss/gloss-e_e.html 96 Department of Finance. 2003. Improving the Income Taxation of the Resource Sector in Canada. 97 Department of Finance. 2003. Improving the Income Taxation of the Resource Sector in Canada. 98 Commissioner of the Environment and Sustainable Development. 2000. Report of the Commissioner of the Environment and Sustainable Development.

30
Government Spending on Canada's Oil and Gas Industry
Table 4-5 Tax expenditure associated with oil and gas production, 2000$, continued
INITIATIVE EXPENDITURE DESCRIPTION Syncrude Remission Order (SRO)
1996 $12 million 2002 $226 million
In 1976, the federal government issued a remission order allowing participants in the Syncrude oil sands project to deduct royalty payments and make full use of the resource allowance. This remission order expired at the end of 2003.
Canadian Oil and Gas Property Expense (COGPE)
COGPE expenditure is included in CDE and CEE above.
COGPE is deductible at a rate of 10% and includes the costs of acquiring an oil and gas well in Canada, an interest or right to explore, drill, or extract petroleum or natural gas, or a qualifying interest or right in oil and gas production.99
Negative Tax Expenditure
1996 0 2002 -$92million
In 2001, the general income tax rate was reduced for most sectors in Canada. It was not reduced for the oil and gas sector. Thus, in 2001 and 2002 the oil and gas sector was liable for a higher corporate income tax rate than that which defined the neutral tax system over the study period. The negative tax expenditure estimates are equal to the difference between the tax that would have been paid had the lower tax rate applied to the oil and gas sector and the tax rate that was actually applied to the oil and gas sector. The difference in the tax rate for the oil and gas sector relative to most other sectors is now being phased out.
The table below presents tax expenditure estimates over the study period. The key tax expenditure items associated with oil and gas production are the CDE, the CEE (expenditure associated with COGPE is also included with CDE and CEE) and the ACCA. As shown in the table below, total annual tax expenditure increased significantly over the study period from $1,048 million (2000$) in 1996 to $1,384 million (2000$) in 2002 — an increase of 32%.100
Table 4-6 Tax expenditure associated with oil and gas production, million 2000$
ITEM 1996 1997 1998 1999 2000 2001 2002 TOTAL CDE, CEE & COGPE 721 568 375 703 1,052 1,144 1,035 5,598 ACCA (oil sands) n/a n/a n/a n/a n/a n/a n/a 484 ED 33 31 14 9 3 19 17 126 RA101 146 59 66 176 226 61 84 819 ITCs102 136 114 39 28 17 66 112 513 SRO 12 38 44 6 12 169 226 507 Negative Tax Exp. 0 0 0 0 0 -25 -92 -117 TOTAL 1,048 810 539 922 1,309 1,453 1,384 7,931
It is important to note that the figures presented above do not account for interactions between the various tax initiatives. Each tax expenditure estimate reflects an assumption that the tax 99 Department of Finance. 2003. Improving the Income Taxation of the Resource Sector in Canada. 100 Recall that the annual figures do not include expenditure associated with ACCA while the cumulative estimate does. 101 Recall that we have only included expenditure associated with the difference between the resource allowance and the value of royalties. 102 The Investment Tax Credits (ITCs) category includes expenditure associated with the Atlantic Investment Tax Credit and the Scientific Research and Experimental Development tax credit.

31
Government Spending on Canada's Oil and Gas Industry
initiative is removed while all else stays the same. To the extent that such interactions exist, the total expenditure estimate presented above would change. As has been described above, the data presented in Table 4-6 comes from different sources and the methods used to calculate the estimates vary from one initiative to the next. Thus, there is a degree of uncertainty associated with the summation of the various items. For example, the estimate for the ACCA is the net present value of expenditure over the 1996–2002 period. While adding this figure to the other figures, which are not net present values, introduces a degree of error, the difference between current values and present values for the ACCA is relatively small over the study period.103
Recent Changes to Federal Income Tax Policy In the 2003 federal budget, the government announced two key changes to the taxation of oil and gas income. The following changes will be phased in over a period of five years:104
• A reduction of the federal statutory corporate income tax rate on income earned from resource activities from 28 to 21 %, beginning with a 1 percentage point reduction to 27% in 2003, and declining to 21 % in 2007.
• A deduction for oil and gas royalties paid and the elimination of the resource allowance. The reduction in the federal income tax rate for the oil and gas sector followed earlier legislation that reduced the income tax rate for sectors other than the resource sector and the manufacturing and processing sector.105 Because of sector specific tax provisions (such as the Resource Allowance, CDE and CEE) the oil and gas sector was subject to a lower effective tax rate than most other sectors. Thus, the rationale for not originally reducing the corporate tax rate for the resource sector was that they already benefited from a lower effective tax rate and to reduce the tax rate applicable to them would maintain that preferential treatment. The move to equalize effective tax rates (tax rates after sector specific tax provisions are accounted for) across all sectors was abandoned with the 2003 federal budget announcement described above. Now, the oil and gas sector will benefit from a reduced income tax rate and still be able to take advantage of sector specific beneficial tax provisions. Budget 2003 also proposed to legislate the elimination of the federal capital tax106 over a period of 5 years. The elimination of this tax combined with the changes described above is intended to improve the international competitiveness of the Canadian resource sector, in particular relative to the United States. And indeed they will, at the expense of federal tax revenue. As a result of these changes, the oil and gas sector will pay less federal corporate income tax as a whole (as will other sectors benefiting from the reduced tax rate such as mining). The estimated cost of these changes, for all affected sectors (oil and gas and mining) (taking into account the elimination of the resource allowance and the non-deductibility of royalties which will result in a net revenue gain to government) was $10 million for the 2002-03 fiscal year, $55 million for the 2003-04 fiscal year and is expected to be $100 million for the 2004-05 fiscal year. When fully 103 See for example, Figure 1 on page 11 of Ketchum, Ken, Robert Lavigne and Reg Plummer. 2001. Oil Sands Tax Expenditure. Department of Finance. 104 Department of Finance. 2003. Improving the Income Taxation of the Resource Sector in Canada. 105 The manufacturing and processing sector was already liable for a 21% income tax rate due to a 7% manufacturing and processing tax credit. 106 Capital tax is separate and distinct from income tax and is paid on capital investments. The elimination of the capital tax is not an initiative targeted specifically at oil and gas.
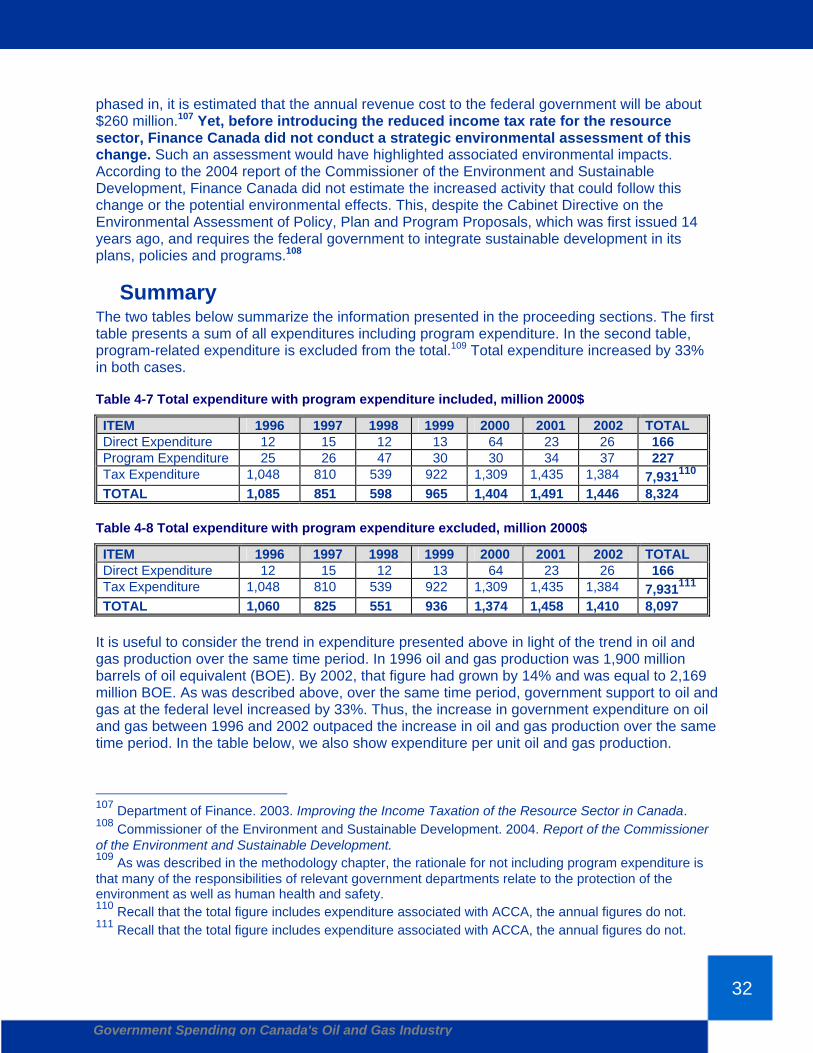
32
Government Spending on Canada's Oil and Gas Industry
phased in, it is estimated that the annual revenue cost to the federal government will be about $260 million.107 Yet, before introducing the reduced income tax rate for the resource sector, Finance Canada did not conduct a strategic environmental assessment of this change. Such an assessment would have highlighted associated environmental impacts. According to the 2004 report of the Commissioner of the Environment and Sustainable Development, Finance Canada did not estimate the increased activity that could follow this change or the potential environmental effects. This, despite the Cabinet Directive on the Environmental Assessment of Policy, Plan and Program Proposals, which was first issued 14 years ago, and requires the federal government to integrate sustainable development in its plans, policies and programs.108
Summary The two tables below summarize the information presented in the proceeding sections. The first table presents a sum of all expenditures including program expenditure. In the second table, program-related expenditure is excluded from the total.109 Total expenditure increased by 33% in both cases.
Table 4-7 Total expenditure with program expenditure included, million 2000$
ITEM 1996 1997 1998 1999 2000 2001 2002 TOTAL Direct Expenditure 12 15 12 13 64 23 26 166 Program Expenditure 25 26 47 30 30 34 37 227 Tax Expenditure 1,048 810 539 922 1,309 1,435 1,384 7,931110 TOTAL 1,085 851 598 965 1,404 1,491 1,446 8,324
Table 4-8 Total expenditure with program expenditure excluded, million 2000$
ITEM 1996 1997 1998 1999 2000 2001 2002 TOTAL Direct Expenditure 12 15 12 13 64 23 26 166 Tax Expenditure 1,048 810 539 922 1,309 1,435 1,384 7,931111 TOTAL 1,060 825 551 936 1,374 1,458 1,410 8,097
It is useful to consider the trend in expenditure presented above in light of the trend in oil and gas production over the same time period. In 1996 oil and gas production was 1,900 million barrels of oil equivalent (BOE). By 2002, that figure had grown by 14% and was equal to 2,169 million BOE. As was described above, over the same time period, government support to oil and gas at the federal level increased by 33%. Thus, the increase in government expenditure on oil and gas between 1996 and 2002 outpaced the increase in oil and gas production over the same time period. In the table below, we also show expenditure per unit oil and gas production.
107 Department of Finance. 2003. Improving the Income Taxation of the Resource Sector in Canada. 108 Commissioner of the Environment and Sustainable Development. 2004. Report of the Commissioner of the Environment and Sustainable Development. 109 As was described in the methodology chapter, the rationale for not including program expenditure is that many of the responsibilities of relevant government departments relate to the protection of the environment as well as human health and safety. 110 Recall that the total figure includes expenditure associated with ACCA, the annual figures do not. 111 Recall that the total figure includes expenditure associated with ACCA, the annual figures do not.

33
Government Spending on Canada's Oil and Gas Industry
Expenditure per unit production increased from $0.56 in 1996 to $0.65 in 2002. That is an increase of 16%.
Table 4-9 Expenditure (without program expenditure) and Oil and Gas Production
ITEM 1996 1997 1998 1999 2000 2001 2002 Expenditure (million 2000$)
1,060 825 551 936 1,374 1,458 1,410
Production (million BOE)
1,900 1,954 2,012 2,017 2,092 2,108 2,169
Exp/Prod 0.56 0.42 0.27 0.46 0.66 0.69 0.65 Source: Production figures from the Canadian Association of Petroleum Producers Statistical Handbook for Canada’s Upstream Petroleum Industry. Below we graphically present some of the information from the above table. The figure demonstrates the relatively higher level of subsidization that has been provided to the oil and gas sector in the last several years. The lower level of support provided in 1998 is the result of lower tax expenditure in that year. As was described earlier in this report, despite commitments by the federal government to reduce GHG emissions, emissions from the oil and gas sector have continued to increase. This has taken place at the same time as increased production and increased government expenditure on oil and gas (as shown in the table above). Thus, not only has direct subsidization to the oil and gas sector increased, but the liability associated with increased emissions and other environmental impacts (land disturbance, acidifying emissions, water consumption) has also increased.

34
Government Spending on Canada's Oil and Gas Industry
Figure 4-1 Government Expenditure per unit Oil and Gas Production
-
0.1
0.2
0.3
0.4
0.5
0.6
0.7
0.8
1996 1997 1998 1999 2000 2001 2002
Expe
nditu
re (2
000$
) per
uni
t Oil
and
Gas
Pro
duct
ion
(milli
on B
OE)
35
Government Spending on Canada's Oil and Gas Industry
5 SUBSIDIZING OIL SANDS GROWTH Alberta has the largest oil sands resource in the world, estimated at more than 1.6 trillion barrels of oil. Development of Alberta’s oil sands deposits is poised for extensive growth over the next decade. Interest in oil sands development has been renewed because oil sands have the potential to meet increasing demands in Canadian, American and international energy markets such as China as production of conventional light oil declines. The Alberta Energy and Utilities Board’s Supply/Demand Outlook 2002–2011 predicts that the province’s production of bitumen (oil from oil sands) will triple by 2011, accounting for 75% of Alberta’s total oil production. This chapter discusses and, where possible, provides estimates of federal and provincial government support specifically for oil sands developments in Canada.
Federal Support for Oil Sands Developments In this section of the report, we extract from the previous chapter federal expenditure associated specifically with the oil sands component of oil and gas production. In doing so, we describe federal support for oil sands developments, concentrating on support provided through the tax system as well as direct support for research and development. In 2000 the Commissioner of the Environment and Sustainable Development undertook a study on the level of federal government support for energy investments in Canada. One of the key objectives of the study was to determine whether this support favoured the non-renewable energy sector, relative to the renewable energy sector for example. The commissioner was particularly interested in support provided through the federal tax system, as this type of support is less transparent and thus more difficult to track and quantify. While the commissioner found that, in most cases, federal government support for energy investments, including support through the tax system, did not particularly favour the non-renewable sector over the renewable sector, he found oil sands to be an exception. His analysis revealed that oil sands, like all mining investments, receive a significant tax concession. With respect to income tax, oil sands projects are subject to the mining provisions contained in the Income Tax Act rather than the oil and gas provisions. According to the Commissioner of the Environment and Sustainable Development, the mining provisions are similar to those for oil and gas but allow more generous write-offs for property and pre-production development costs. In 1996, the federal government announced key changes to the federal income tax policy related to oil sands developments. The federal government extended the tax rules relevant to oil sands mining projects to those of oil sands in situ projects112 so that both types of oil sands projects would be treated the same for taxation purposes. The changes also specified that all investments (whether relevant to new projects or expansions of existing projects) would be treated the same as far as income taxes are concerned.113
112 Oil can be produced from oil sands using either a mining approach or an in situ approach. The mining approach is used when the oil sands lie fewer than 75 metres from the surface and the oil sands can be removed by open pit mining techniques. The in situ approach is used when the oil sands lie more than 75 metres from the surface. In such cases, wells are used to make contact with the oil sands and heat is used to facilitate the movement of the oil sands to well bores and then to the surface. 113 Mitchell, Robert, Brad Anderson, Marty Kaga and Stephen Eliot. 1998. Alberta’s Oil Sands: Update on the Generic Royalty Regime. Alberta Department of Energy, Unitar 183.
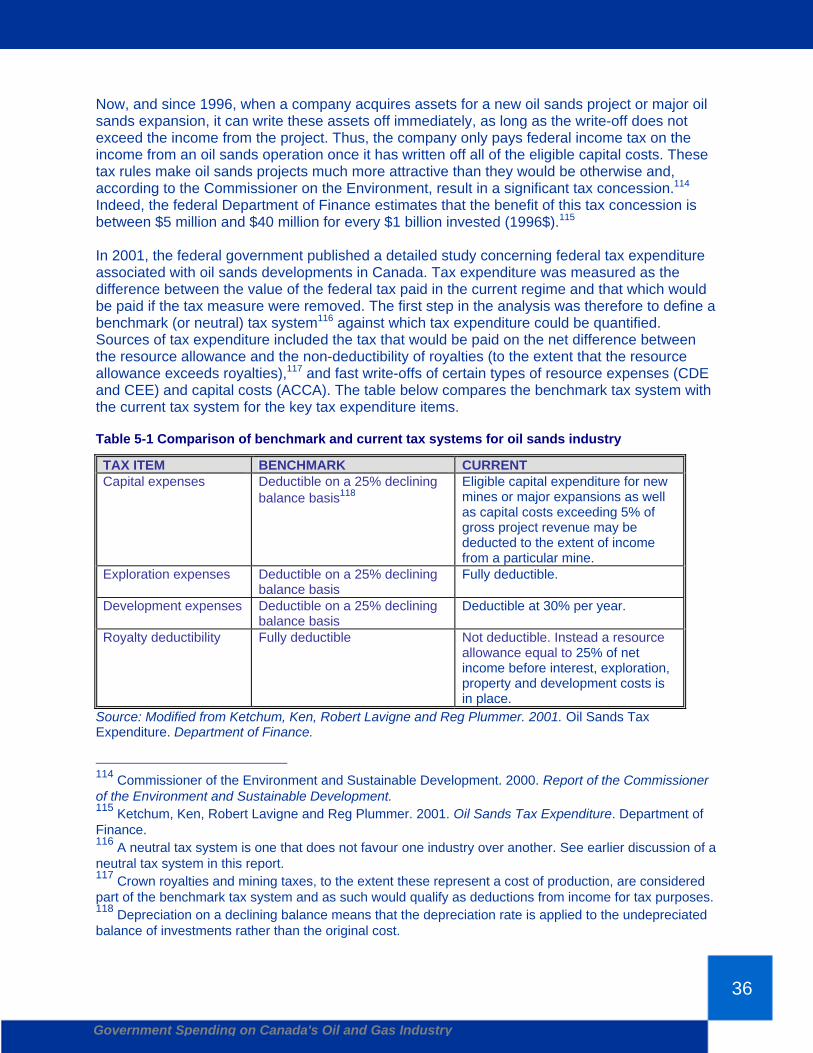
36
Government Spending on Canada's Oil and Gas Industry
Now, and since 1996, when a company acquires assets for a new oil sands project or major oil sands expansion, it can write these assets off immediately, as long as the write-off does not exceed the income from the project. Thus, the company only pays federal income tax on the income from an oil sands operation once it has written off all of the eligible capital costs. These tax rules make oil sands projects much more attractive than they would be otherwise and, according to the Commissioner on the Environment, result in a significant tax concession.114 Indeed, the federal Department of Finance estimates that the benefit of this tax concession is between $5 million and $40 million for every $1 billion invested (1996$).115 In 2001, the federal government published a detailed study concerning federal tax expenditure associated with oil sands developments in Canada. Tax expenditure was measured as the difference between the value of the federal tax paid in the current regime and that which would be paid if the tax measure were removed. The first step in the analysis was therefore to define a benchmark (or neutral) tax system116 against which tax expenditure could be quantified. Sources of tax expenditure included the tax that would be paid on the net difference between the resource allowance and the non-deductibility of royalties (to the extent that the resource allowance exceeds royalties),117 and fast write-offs of certain types of resource expenses (CDE and CEE) and capital costs (ACCA). The table below compares the benchmark tax system with the current tax system for the key tax expenditure items.
Table 5-1 Comparison of benchmark and current tax systems for oil sands industry
TAX ITEM BENCHMARK CURRENT Capital expenses Deductible on a 25% declining
balance basis118 Eligible capital expenditure for new mines or major expansions as well as capital costs exceeding 5% of gross project revenue may be deducted to the extent of income from a particular mine.
Exploration expenses Deductible on a 25% declining balance basis
Fully deductible.
Development expenses Deductible on a 25% declining balance basis
Deductible at 30% per year.
Royalty deductibility Fully deductible Not deductible. Instead a resource allowance equal to 25% of net income before interest, exploration, property and development costs is in place.
Source: Modified from Ketchum, Ken, Robert Lavigne and Reg Plummer. 2001. Oil Sands Tax Expenditure. Department of Finance.
114 Commissioner of the Environment and Sustainable Development. 2000. Report of the Commissioner of the Environment and Sustainable Development. 115 Ketchum, Ken, Robert Lavigne and Reg Plummer. 2001. Oil Sands Tax Expenditure. Department of Finance. 116 A neutral tax system is one that does not favour one industry over another. See earlier discussion of a neutral tax system in this report. 117 Crown royalties and mining taxes, to the extent these represent a cost of production, are considered part of the benchmark tax system and as such would qualify as deductions from income for tax purposes. 118 Depreciation on a declining balance means that the depreciation rate is applied to the undepreciated balance of investments rather than the original cost.

37
Government Spending on Canada's Oil and Gas Industry
The study estimated tax expenditure associated with oil sands investments (new projects and expansions) announced as of January 1, 1999 for the period between January 1996 and January 2010. The results of the analysis are summarized in the table below. The net present value of the total income tax expenditure attributable to new oil sands projects from 1996 to 2030 is estimated to be $820 million (1996$), or $583 million (1996$) over the 1996–2002 period. The main component of total tax expenditure is the ACCA.
Table 5-2 Net present value of oil sands tax expenditures, million 1996$
TAX RULE 1996–2002 1996–2010 1996–2030 ACCA 451 478 338 RA and royalty non-deductibility
-68 145 336
CDE/CEE 110 120 133 Total Expenditure119 583 816 820
Source: Ketchum, Ken, Robert Lavigne and Reg Plummer. 2001. Oil Sands Tax Expenditure. Department of Finance. As was stated above, the Department of Finance’s evaluation was based on investments in the oil sands industry that were announced as of 1999 and planned for the 1996–2010 period. Additional planned investment would change the tax expenditure estimate and there is uncertainty about what level of investment will take place in the future. The table below presents various estimates for capital investments in the oil sands over a range of time periods. The table is indicative of the uncertainty that surrounds future oil sands investments.
Table 5-3 Various estimates of oil sands capital investments
SOURCE DATE OF PUBLICATION
PROJECTED PRODUCTION (barrels/day)
PROJECTED INVESTMENT
Oil Sands Development in Canada. Alberta Chamber of Resources.
1998 2020: 1.2 million 1995–2020: $21–25 billion
Canada’s Oil Sands — Outlook to 2015. National Energy Board.
2000 2015: 1.6 million 1996–2010: $34 billion
Fact Sheet — Canada’s Oil Sands. Athabasca Regional Issues Working Group.
2003 2012: 2 million 1995–2012: $60 billion
Canada’s Energy Future — Scenarios for Supply and Demand to 2025. National Energy Board.
2003 2025: 2.7–2.9 million n/a
Oil Sands Technology Roadmap: Unlocking the Potential. Alberta Chamber of Resources.
January 2004 2012: 1.5 million 2030: 4 million 2000-2030: $90 billion
119 Note that the sum of the tax initiatives does not equal total expenditure due to interactions between the specific tax initiatives when they are considered at the same time.

38
Government Spending on Canada's Oil and Gas Industry
Table 5-3 Various estimates of oil sands capital investments, continued
SOURCE DATE OF PUBLICATION
PROJECTED PRODUCTION (barrels/day)
PROJECTED INVESTMENT
Issue in Focus: Natural Gas Consumption in Canadian Oil Sands Production. United States Energy Information Administration.
January 2004 2010: 1.7 million 2025: 3.3 million n/a
Canada’s Oil Sands — Opportunities and Challenges to 2015. National Energy Board.
May 2004 2015: 2.2 million 1995–2015: $60 billion
Canadian Crude Oil Supply and Production Forecast 2004–2015. Canadian Association of Petroleum Producers.
June 2004 2015: 2.6 million 2004–2015: $30 billion
Alberta’s Reserves 2003 and Supply/Demand Outlook 2004–2013. Statistical Series 2004-98. Alberta Energy and Utilities Board.
June 2004 2013: 2.3 million n/a
While the magnitude of future oil sands investments is still unknown, we do have solid information on the level of capital expenditure that has taken place to date. For example, between 1996 and 2002, capital expenditure on oil sands projects was over $23.9 billion (see table below).120 Using the range of tax expenditure associated with ACCA developed by the federal Department of Finance and presented above (between $5 million and $40 million for every $1 billion invested), and the figures for expenditure below, we can estimate a range of total tax expenditure associated with the ACCA for the 1996–2002 period to be between $120 million and $960 million. The $120 million in deferred tax revenue assumes the tax concession is equal to $5 million for every $1 billion in expenditure, while the $960 million results from a concession of $40 million for every $1 billion in expenditure.
120 Canadian Association of Petroleum Producers. 2003. CAPP Statistical Handbook. http://www.capp.ca/default.asp?V_DOC_ID=763&PubID=32693

39
Government Spending on Canada's Oil and Gas Industry
Table 5-4 Oil sands capital investments, 1996 to 2002, million current$
INVEST. 1996 1997 1998 1999 2000 2001 2002 CUMM. Capital 1,286 1,915 1,543 2,372 4,223 5,907 6,718 23,963
Source: Canadian Association of Petroleum Producers. 2003. CAPP Statistical Handbook. Oil sands are subject to the resource allowance system described earlier in the report.121 Thus, to the extent that the resource allowance exceeds the royalties paid for oil sands projects, the federal government would incur tax expenditure associated with the resource allowance. This concession is captured in the tax expenditure estimate for the resource allowance presented in the preceding chapter. The oil sands portion of the resource allowance expenditure is unknown. In addition to expenditure associated with the difference between the resource allowance and oil sands royalties, the federal government incurs expenditure for what is called the Syncrude Remission Order (SRO). Established in 1976, the SRO has granted, in some circumstances, the deduction of provincial royalties in concert with the resource allowance for specified projects. The order was in effect until 2.1 billion barrels of synthetic crude were produced or 31 December 2003, whichever came first. Expenditure associated with the SRO is presented in the table below.
Table 5-5 Syncrude Remission Order expenditure, million 2000$
ITEM 1996 1997 1998 1999 2000 2001 2002 TOTAL SRO 12 38 44 6 12 169 226 507
Source: Public Accounts of Canada, 1995 to 2002, http://www.pwgsc.gc.ca/recgen/text/pub-acc-e.html. Finally, NRCan supports oil sands research through two key programs: the Canadian Oil Sands Network for Research and Development (CONRAD) and the National Centre for Upgrading Technology (NCUT). In 1996, the government announced that it would dedicate $25 million to oil sands research over three years.122 More recently, NRCan pledged to spend $11 million per year on oil sands research.123 Data on federal expenditure for oil sands developments has been assembled from various sources making an estimate of total expenditure difficult to establish with a high degree of certainty. Tax expenditure estimates are only available from an analysis completed in 2001. Estimates of support for research and development have been pieced together from information found in a number of sources including news releases. Support for the SRO is contained in the Public Accounts of Canada. Nonetheless, by combining tax expenditure estimates with support for research and development and the SRO, we are able to establish a preliminary estimate of total federal support for oil sands developments in Canada. 121 Note that as was described elsewhere, the resource allowance and the non-deductibility of royalties is being phased out. 122 Natural Resources Canada. 1996. Fact Sheet: The Federal Framework for the Development of Canada’s Oil Sands. 123 Pigeon, Marc-Andre. 2003. Tax Incentives and Expenditures Offered to the Oil Sands Industry. Parliamentary Research Branch.

40
Government Spending on Canada's Oil and Gas Industry
Finance Canada estimated tax expenditure associated with oil sands to be $625 million (2000$) between 1996 and 2002 inclusive.124 Over the same time period, the federal government pledged support of oil sands research and development of $60 million (2000$); support through the SRO equalled $507 million (2000$). Adding these figures together yields total expenditure of $1,193 million (2000$) over the 1996–2002 period. We consider this estimate to be conservative. Recent comments by the federal Minister of Environment in a speech to the House of Commons indicate the level of public support provided to oil sands developments over several decades:
In the past, Canada has shown that it can transform impossible energy dreams into reality. When the oil sands of the Athabaska [sic] were discovered in the 1960s, no technology existed to exploit them and the economics were simply crazy. It took decades of dedication and, especially, sustained federal support ($40 billion in various fiscal incentives and tax breaks) to eventually transform this impossible project into a thriving industry that will both provide enormous amounts of both energy and wealth to the country for decades to come.
While the estimates of federal expenditure on oil sands presented above are by no means comprehensive or available from a single, transparent source, they are more readily available than similar estimates for initiatives at the provincial level.125
Provincial Support for Oil Sands Developments In Alberta, the Department of Energy is responsible for preparing the province’s oil sands policies and regulations, including those for leases and royalties. Government authorities use royalties and other revenue generating policy options (leases, bids and taxes for example) to collect resource revenue from oil and gas companies. The rationale for collecting this revenue is that the oil and gas resources are essentially owned by the citizens of the region, and the government, on the citizens’ behalf, leases the rights to develop the resources to oil and gas companies. In exchange, the oil and gas companies earn revenue, a portion of which is transferred by the government back to the citizens — the owners of the resources. The royalty regime for oil sands is explicitly designed to collect lower royalties in the early stages of development, relative to other oil and gas projects in Alberta. This means that less revenue is transferred from companies to the government, and inevitably the citizens of Alberta, for the development of oil sands. In 1995, the province of Alberta implemented the generic royalty regime for oil sands developments in the province. The generic royalty regime is designed to support major investment in oil sands over time. Indeed, the government of Alberta had a number of objectives in mind when it developed and implemented the generic royalty regime:126
• Accelerate the development of the oil sands • Facilitate development of the oil sands by private sector companies
124 The $625 million estimate was derived by converting $583 million (1996$) to 2000$ using the Consumer Price Index. 125 Pigeon, Marc-Andre. 2003. Tax Incentives and Expenditures Offered to the Oil Sands Industry. Parliamentary Research Branch. 126 Masson, Richard and Bryan Remillard. 1996. Alberta’s New Oil Sands Royalty System. Alberta Department of Energy.

41
Government Spending on Canada's Oil and Gas Industry
• Ensure that oil sands development is competitive with other petroleum development opportunities on a world scale.
The generic royalty regime applies to both new oil sands investment and expansions of existing oil sands projects. The basic elements of the regime are as follows:127
• A minimum 1% royalty payable on all production • Royalty on production equivalent to 25% of net project revenues after the developer has
recovered all project costs and a return allowance • A 100% deduction of all project costs, including capital, operating, and research and
development, in the year incurred. To summarize, the 1995 changes imposed a uniform 25% royalty payable on net project revenue after the developer has recovered all projected costs, including 100% of capital and development costs in the year incurred, and after the corporation has earned an acceptable rate of return on their investment. In the event that these conditions can not be met, for example when initial investments are high or when project expansions take place, the industry pays a minimum 1% royalty on all production.128 Thus, only when a developer’s cumulative project revenues exceed cumulative costs, including a return on investment, does Alberta obtain a significant royalty.129 The oil sands royalty regime is justified on the basis of high costs, long lead times, and relatively higher risks associated with oil sands investments. In addition to paying relatively lower royalties than conventional oil and natural gas in early years of production, oil sands developments benefit from credit and incentive programs in place in Alberta. These have the effect of further reducing the amount of revenue collected from oil sands projects and result in expenditure to the province of Alberta. Some relevant initiatives include the ability to deduct research and development expenses before royalties are calculated and a tax exemption for off-road fuel use. Note that the provincial government does not track expenditure associated with these or other programs. Related to this, the 2004 report of the Auditor General of Alberta concluded that the Department of Energy’s documentation of several common risk areas related to deductions was deficient. Common risk areas include the risk that a project operator may have a history of making aggressive deductions, the risk of duplicate costs being claimed on a project or in two projects owned by the same organization, and the risk that recovered costs are not being fully reported. The realization of any of these situations could have significant impact on the amount of revenue obtained by the government for oil sands projects and result in an implicit subsidy to oil sands operators, yet they are not formally considered by the Department of Energy. In addition to expenditure associated with incentive programs, the provincial government supports research and development related to oil sands. While estimates of the level of public support are not available, the government is a partner in CONRAD and NCUT, described earlier in the chapter.
127 Mitchell, Robert, Brad Anderson, Marty Kaga and Stephen Eliot. 1998. Alberta’s Oil Sands: Update on the Generic Royalty Regime. Alberta Department of Energy, Unitar 183. 128 Pigeon, Marc-Andre. 2003. Tax Incentives and Expenditures Offered to the Oil Sands Industry. Parliamentary Research Branch. 129 Masson, Richard and Bryan Remillard. 1996. Alberta’s New Oil Sands Royalty System. Alberta Department of Energy.

42
Government Spending on Canada's Oil and Gas Industry
One of the goals of the oil sands royalty regime is to facilitate staged development of oil sands operations. In this way, because investors can deduct costs associated with project expansions, projects can grow over time while minimizing incremental capital investments and minimizing royalties.130 In this regard, the definition of a project can have a significant impact on the level of royalties collected. For example, a broad definition of a particular project that allows for continual expansions to be added will repeatedly push back project payout and maintain low royalties, preventing the jump to the 25% royalty rate. The challenge is to ensure that projects are defined in a way that prevents royalty avoidance, while still allowing reasonable project additions.131 However, the Auditor General of Alberta’s 2004 report concluded that, while the business rules approved by the Department of Energy as policy indicate that amalgamation and expansion projects should be denied if there will be significant delays in reaching the 25% royalty rate, the Auditor General did not find formal assessments by the Department of Energy describing whether time delays were considered in the approval process for expansions or amalgamations. Given recent trends in royalties from oil sands and oil sands production, it appears as though the capital expenditure data presented earlier in this chapter are indicative of ever-expanded oil sands developments that continue to defer royalty payments and limit the amount of revenue collected by the province. Data from the Alberta Department of Energy clearly demonstrates the high level of investment associated with oil sands developments in the province. The re-investment ratio for oil sands reached a record high of 1.74 in 2001 due to a combination of higher-than-usual operating costs and oil sands capital expenditure of nearly $6 billion. This means that for every dollar of net pre-tax cash flow earned in Alberta’s oil and gas sector in 2002, $1.74 was re-invested in the province’s petroleum industry and compares with a re-investment ratio of 0.56 for conventional oil and gas. The oil sands re-investment ratio fell to 1.01 in 2002 despite $6.7 billion in oil sands investments that year, due to record-breaking oil sands revenue of $9.3 billion.132 Indeed, the proportion of Alberta’s total petroleum industry spending made up by oil sands investment has, on average, gradually increased since 1993. In 1993, oil sands accounted for 6% of Alberta’s industry investment compared with 26% of investment in 2002. According to the federal Commissioner of the Environment and Sustainable Development, the incentive for companies is to keep spending and take advantage of the accelerated write-offs to reduce current taxes and put off the day when they have to pay increased taxes.133 An investigation into the trends in oil sands production relative to oil sands royalties indicates that the high level of oil sands investment taking place is indeed leading to deferred royalty payments. The table below shows the trend in royalties from oil sands versus total royalties collected in Alberta, as well as the trend in oil sands production versus total oil and gas production in the province. The figures in Table 5-6 demonstrate that, while oil sands production is increasing (up 67% between 1995 and 2002), royalties from oil sands are decreasing (down 130 Mitchell, Robert, Brad Anderson, Marty Kaga and Stephen Eliot. 1998. Alberta’s Oil Sands: Update on the Generic Royalty Regime. Alberta Department of Energy, Unitar 183. 131 Masson, Richard and Bryan Remillard. 1996. Alberta’s New Oil Sands Royalty System. Alberta Department of Energy. 132 Alberta Department of Energy. 2004. Investment in the Oil and Gas Industry. http://www.energy.gov.ab.ca/per/docs/investment.pdf 133 Commissioner of the Environment and Sustainable Development. 2000. Report of the Commissioner of the Environment and Sustainable Development.

43
Government Spending on Canada's Oil and Gas Industry
49% over the same period). As is shown in the bottom of the table, for each barrel of oil equivalent (BOE) developed from oil sands over the 1996–2002 period, the province obtained declining revenues (from $2.1/BOE of oil sands in 1996 to $0.6/BOE of oil sands in 2002).
Table 5-6 Oil sands royalties and production, Alberta, 1996 to 2002
1996 1997 1998 1999 2000 2001 2002 Total Royalties (million 2000$)
2,585 3,428 2,923 2,066 3,939 9,200 4,917
Oil Sands Royalties (million 2000$)
341 549 204 61 426 696 175
Oil Sands Royalties as a % of Total Royalties
13 16 7 3 11 8 4
Total Production (million BOE)
1,393 1,394 1,398 1,412 1,402 1,359 1,329
Oil Sands Production (million BOE)
162 193 215 207 222 240 271
Oil Sands Production as a % of Total Production
12 14 15 15 16 18 20
Oil Sands Royalties/ BOE
2.1 2.9 0.9 0.3 1.9 2.9 0.6
Source: Data from Canadian Association of Petroleum Producers and Alberta Department of Energy Figure 5-1 graphs a portion of the information in Table 5-6. The figure shows oil sands production as a percentage of total oil and gas production in Alberta, as well as oil sands royalties as a percentage of total oil and gas royalties in the province. The figure demonstrates quite clearly that, as oil sands production has increased, revenues from oil sands in the form of royalties have decreased. This trend is largely the result of the generic oil sands royalty regime described above and announced in 1995. Researchers expect that this trend will continue in the future. As oil sands production increases and revenues continue to decline, total revenues available to Alberta will also be reduced.134
134 Wilson, L. S., ed. 2002. Alberta’s Volatile Government Revenues. Edmonton, Alberta: Institute for Public Economics.

44
Government Spending on Canada's Oil and Gas Industry
0%
5%
10%
15%
20%
25%
1996 1997 1998 1999 2000 2001 2002Year
Con
tribu
tion
of o
il sa
nds
to to
tal o
il an
d ga
s pr
oduc
tion
and
roya
lties
Royalties
Production
Figure 5-1 Contribution of oil sands to oil and gas production and royalties
Given the low royalties from oil sands production, according to one assessment, it “appears that, at least implicitly, the government of Alberta has opted for higher activity levels in the oil and gas industry and a lower take on each unit of production.”135 Furthermore, even once an oil sands project has reached payout, the 25% royalty in combination with federal and provincial income taxes is expected to result in the developer receiving marginal project income of 38%, with the balance of 62% going to the federal and provincial governments.136 In comparison, a recent study revealed that Alaska and Norway, regions that like Alberta depend on oil and gas for a significant share of total government revenues, over the 1996–2002 period on average obtained 99% and 88% of available oil and gas revenues.137 The significantly higher revenue capture rates realized in Alaska and Norway indicate that the 62% revenue capture rate from oil sands in Alberta is not the maximum achievable. The citizens of Alberta are the ultimate owners of the oil sands resources and they rely on the government to do the best job possible at obtaining a fair and maximum level of compensation for them in return for the development of these non-renewable resources. The figures cited above demonstrate that, relative to Alaska and Norway, the province of Alberta could be doing more for the citizens of the province.
135 Plourde, A. and Bradford Reid. 2002. Natural Resource Revenues and the Alberta Budget. In Alberta’s Volatile Government Revenues. Edited by L.S. Wilson. Edmonton, Alberta: Institute for Public Economics. 136 Masson, Richard and Bryan Remillard. 1996. Alberta’s New Oil Sands Royalty System. Alberta Department of Energy. 137 Taylor, Amy, Chris Severson-Baker, Mark Winfield, Dan Woynillowicz and Mary Griffiths. 2004. When the Government is the Landlord. Pembina Institute for Appropriate Development.

45
Government Spending on Canada's Oil and Gas Industry
Summary Both the federal government and the province of Alberta provide support to oil sands developments. At the federal level, support takes the form of tax concessions, support for research and development and expenditure associated with the Syncrude Remission Order. A conservative estimate of the total value of support associated with these items is $1,193 million (2000$) over the 1996–2002 period. Information on public support for oil sands at the federal level is not available on a regular basis from a consistent source. Because a comprehensive analysis of public support has not been done at the federal level, it was necessary to obtain estimates for the various expenditure items from a number of different sources. This kind of approach increases uncertainty in the analysis. Despite the shortcomings of federal estimates of public support for oil sands developments, information at the federal level is far superior to that available at the provincial level. The provincial government does not track estimates of tax expenditure associated with the credit and incentive programs currently available to oil sands developments. In addition, it has designed and implemented a royalty regime that encourages perpetual investment in oil sands developments without making publicly available information on the value/cost of forgone revenue resulting from a lower royalty rate in early years of production, relative to conventional oil and gas. By continually investing in new projects and expansions of existing projects, oil sands developers are able to defer royalties to the future. The trend in production and royalty revenues over the 1996–2002 period (summarized in Figure 5-1) is a good indication of expanding operations that perpetuate lower royalties. Even after a project reaches the 25% royalty rate (i.e., after all project costs have been recovered), it is estimated that a mere 62% of available revenues will be transferred to the federal and provincial governments.138 This is much less than has been obtained in other regions such as Alaska and Norway — 99% and 88% of available oil and gas revenues, respectively, between 1995 and 2002. The lack of information on public expenditure associated with oil sands at the provincial level appears to be consistent with the government’s broader approach to accountability and transparency. The recently released Auditor General’s report highlighted four royalty programs that reduce or rebate natural gas royalties to energy companies to a total of $442 million. The Auditor General concluded that these programs appear to have either no stated objectives, or else no reviews have been completed to determine if the objectives have been met.139
138 Masson, Richard and Bryan Remillard. 1996. Alberta’s New Oil Sands Royalty System. Alberta Department of Energy. 139 Auditor General of Alberta. 2004. Annual Report of the Auditor General. Government of Alberta. http://www.oag.ab.ca/

46
Government Spending on Canada's Oil and Gas Industry
6 SUPPORTING EVIDENCE In this report, we have identified and quantified government expenditure on oil and gas production in Canada. While we recognize that the estimates put forward here are associated with a degree of uncertainty, due to the fact that the federal and Alberta governments do not track such expenditure, we consider them to be conservative and a useful starting place for future analyses on public support for oil and gas. In this chapter we present evidence from previously completed research pertaining to the taxation or profitability of the oil and gas sector in Canada. In doing so, we provide context to our own results and further demonstrate the preferential treatment provided to this sector by the Canadian government. Our analysis revealed total support over the 1996–2002 period of $8,324 million (2000$) including program expenditure, and $8,097 million (2000$) without program expenditure. For all expenditure types considered in this analysis (tax, direct and program), we found expenditure to increase over the study period. When government expenditure associated with oil and gas production increases, so too does the benefit derived by industry. The result is an increase in the viability and profitability of projects and incentives for investors to continue and even accelerate investments in oil and gas. A 1997 study completed by the Technical Committee on Business Taxation140 revealed that oil and gas are among the least taxed industries operating in Canada (see table below).
Table 6-1 Effective tax rates on input costs for a large business (percentages), 1997
INDUSTRY CAPITAL COSTS LABOUR COSTS TOTAL Forestry 45.5 -5.2 0.9 Mining 13.3 2.7 5.7 Oil and Gas 8.0 1.4 4.5 Manufacturing 27.0 3.2 8.8 Construction 59.9 -0.6 5.5 Transportation 39.5 3.2 8.3 Communications 35.2 4.4 15.4 Public Utilities 44.4 4.5 26.9 Wholesale Trade 51.7 2.6 10.4 Retail Trade 53.0 3.0 7.5 Other Services 39.5 2.7 9.7
Source: The Technical Committee on Business Taxation. 1997. Report of the Technical Committee of Business Taxation. Submitted to the Honourable Paul Martin, Minister of Finance. The Technical Committee attributed the lower tax rates for oil and gas primarily to the availability of accelerated deductions for exploration and development expenditures. A major conclusion of the Technical Committee was that, overall, the tax system encourages production from the resource (including oil and gas), manufacturing and construction sectors relative to most service sectors of the economy. In addition to examining the impact of taxes across industries, it is useful to investigate trends within the oil and gas sector.
140 The Technical Committee on Business Taxation. 1997. Report of the Technical Committee of Business Taxation. Submitted to the Honourable Paul Martin, Minister of Finance.

47
Government Spending on Canada's Oil and Gas Industry
A 1996 study by NRCan141 examined rates of return for various projects within the oil and gas sector. Rates of return for various types of oil and gas developments under the current tax system were compared to those that would be realized under a neutral tax system (one that does not favour any particular industry over another). The greater the rate of return, the more economical the project. The table below summarizes the results of the NRCan study for a number of types of oil and gas development. The column titled “increase” describes the change in the rate of return as a result of current tax initiatives. The data in the table demonstrates the high degree of support resulting from today’s tax system relative to a neutral one. Support is particularly high for new oil, offshore oil and oil sands projects.
Table 6-2 Project real rate of return (%)
PROJECT CURRENT NEUTRAL INCREASE Gas project 1142 23.9 19.9 20 Oil project 1143 19.8 16.3 21 Oil project 2 (heavy oil)144 16.2 11.3 43 Oil project 3 (new oil)145 11.8 8.0 48 Gas project 2 (new gas)146 5.8 5.1 14 Offshore oil project147 11.6 7.5 55 Oil sands mining project148 11.0 8.5 29 Oil sands in situ project149 10.4 7.0 49
Source: Modified from Natural Resources Canada. 1996. The Level Playing Field: The Tax Treatment of Competing Energy Investments. In addition to presenting rates of return on investment, the NRCan study provides estimates of the uplift associated with various energy projects. By uplift we mean the percentage of capital investment supported by incentive measures contained in the current tax system relative to a neutral one. The table below shows uplift figures for three types of energy investments: offshore, and both mining and in situ oil sands. These types of investments were revealed to be associated with particularly high uplift figures. The first column of the table represents the total uplift (i.e., that associated with both the federal and provincial tax systems) while the second column presents the uplift resulting from federal tax initiatives alone.
141 Natural Resources Canada. 1996. The Level Playing Field: The Tax Treatment of Competing Energy Investments. 142 Located in northwest Alberta. 143 Located in eastcentral Alberta. 144 Located in eastcentral Alberta. 145 Located in Alberta. 146 Located in westcentral Alberta. 147 Located in Newfoundland. 148 Located in Alberta. 149 Located in Alberta.

48
Government Spending on Canada's Oil and Gas Industry
Table 6-3 Project uplifts for a selection of energy investments
LARGE OIL PROJECTS TOTAL FEDERAL ONLY Offshore oil 17.9% 14.3% Oil sands mining 21.3% 14.2% Oil sands in situ mining 13.4% 8.6%
Source: Modified from Natural Resources Canada. 1996. The Level Playing Field: The Tax Treatment of Competing Energy Investments. The NRCan study goes on to describe particular initiatives within the federal tax system that result in the high uplifts described above. In keeping with that which was revealed by the Commissioner of the Environment and Sustainable Development, NRCan found that for the oil sands projects, almost all of the benefits in the current system are derived from the Accelerated Capital Cost Allowance. In the case of offshore developments, a high portion of the uplift is due to the Atlantic Investment Tax Credit. The uplifts presented in the table above are a measure of the level of benefit provided to particular projects by current tax measures. The higher the uplift, the greater the rate of return on investment to private industry. Everything else being equal, higher uplifts mean greater tax concessions, which means lower tax revenues to government. To the extent that oil and gas developments are profitable, lower tax revenues for government, means increased profits for industry. A recent study completed by the Pembina Institute compared the level of revenue obtained from oil and gas developments for a number of Canadian regions with those obtained in Alaska and Norway. One of the key purposes of the study was to estimate the level of compensation that Canadian citizens are receiving in return for the development of oil and gas resources relative to these two international benchmarks. Because citizens are the ultimate owners of oil and gas resources, they rely on governments to obtain revenues from oil and gas companies as compensation for the development of these non-renewable resources. To the extent that governments are not providing maximum compensation to the citizens of a region for the development of oil and gas resources, they are instead providing an implicit subsidy to industry. This subsidy results in excess profits for oil and gas companies. To measure the level of compensation derived from oil and gas developments, or put another way, the level of implicit subsidy provided to industry, one must analyze the amount of economic rent captured by governments for the development of these non-renewable resources.
Foregone Rent: An Implicit Subsidy Economic rent is defined as the difference between the market value of a resource and the cost of producing that resource, allowing for a reasonable return on investment. Thus, the amount of economic rent that is available in a region will depend on the difference between the market value of the resources in that region and the cost of producing those resources. Figure 6-1 demonstrates a simple and generic breakdown of the total value of oil and gas resources. The red circle indicates the total value of economic rent. Once investment costs have been accounted for, and a normal rate of return on investment has been received, the actual amount of rent that is captured by governments depends on the rate of taxes, royalties and other forms of revenue generation. Any rent that is not captured through these measures, is an implicit subsidy to oil and gas companies that accrues in the form of excess profits (the box at the top of the graph). This subsidy may lead to more oil and gas activity occurring than would be optimal were governments collecting sufficient rent. In other words, such a subsidy may perpetuate

49
Government Spending on Canada's Oil and Gas Industry
investment in unsustainable resource developments, perhaps at the expense of investments in renewable energy options.
Return on investment
Operating costs
Income taxes
Royalties
Bonus bids and lease sales
Excess profits captured by companies
Total value of oil and gas r esources
Exploration and Development Costs
Figure 6-1 Graphical depiction of the concept of economic rent
Earlier in 2004, the Pembina Institute completed a detailed analysis of the amount of economic rent captured from conventional oil and gas developments150 in a number of Canadian regions compared to Alaska and Norway.151 For that study, we compared the amount of revenue actually obtained by governments for the development of conventional oil and gas resources with that, which was available in each of the regions, between 1995 and 2002.152 The box below summarizes the method employed in our economic rent analysis study.
150 The study focused on conventional oil and natural gas. An analysis of the economic rent associated with oil sands was outside the scope of this study. 151 The resultant report, titled “When the Government is the Landlord” is available on the Pembina Institute website (www.Pembina.org). 152 The economic rent calculations were for conventional oil and gas and did not include oil sands.

50
Government Spending on Canada's Oil and Gas Industry
Figure 6-2 Summary of analysis conducted as part of economic rent study
The figure below shows the key results for the economic rent study. The figure shows the average portion of revenue captured (given what was available) by the government in each region over the study period (1995 to 2002). The values are an indication of the level of compensation citizens in each of the regions received for the development of conventional oil and gas resources; the inverse of which is a measure of the implicit subsidy provided to oil and gas operations. Note that while oil sands were outside the scope of the economic rent analysis, other sources predict that even after oil sand projects reach the 25% royalty rate (which none of them yet appear to have done), only 62% of associated revenues will be transferred to the federal and provincial governments.153 A rate much lower than the level of transfer realized in Alaska and Norway. And even lower than that which is obtained for conventional oil and gas in the province of Alberta (69%).
153 Masson, Richard and Bryan Remillard. 1996. Alberta’s New Oil Sands Royalty System. Alberta Department of Energy.
Revenue Obtained = Sum of royalties, leases, licences, bids and income taxes Revenue Available = Value of Oil and Gas – Cost of Production
Rate of Revenue Capture = Revenue Obtained / Revenue Available

51
Government Spending on Canada's Oil and Gas Industry
Figure 6-3 Average portion of economic rent captured in each region, 1995 to 2002
The economic rent study revealed that between 1995 and 2002, relative to the international benchmarks of Alaska and Norway, and with the exception of British Columbia, 154 oil and gas producing regions in western and northern Canada did not capture the same level of revenue from oil and gas developments. 155 To avoid an implicit subsidy to the oil and gas sector that might perpetuate investment in these non-renewable resources at the expense of investments in sustainable energy options, Canadian governments need to ensure that they are obtaining the maximum compensation for the development of oil and gas resources. As was stated earlier, any oil and gas revenues that are not captured by governments accrue to industry in the form of profits. Evidence suggests that the current revenue capture rates for the oil and gas sector allow companies to reap high profit margins. The table below compares profit margins for the oil and gas sector with those for “all industries” combined.
154 In the case of British Columbia, the figure above demonstrates that between 1995 and 2002, the government captured a very high portion of available oil and gas revenue. It is necessary to note however, that since 2002 the BC government has implemented a number of credit and incentive programs that may have lead or may lead to a decline revenue over time. 155 Note that capturing 100% of available revenues is not the ultimate objective. A portion of available revenues need to stay with companies in the form of profits to provide incentive for them to operate efficiently and to maintain viability.
99%
88%
69%
93%
63%
69% 69%
0%
10%
20%
30%
40%
50%
60%
70%
80%
90%
100%
Alaska Norway Alberta BC SK NWT YT
Ave
rage
Por
tion
of E
cono
mic
Ren
t C
aptu
red

52
Government Spending on Canada's Oil and Gas Industry
Table 6-4 Percent profit margin, oil and gas versus all industries combined
1996 1997 1998 1999 2000 2001 2002 All 8.9 9.6 9.0 7.8 8.3 7.1 7.1 O & G 11.1 10.1 6.6 10.8 25.3 23.5 16.9
Source: Statistics Can, CANSIM Table 180-0001 for 1995 to 1998 and CANSIM Table 180-0003 for 1999 to 2002, 1999 to 2002 data includes coal. It is clear from the figures above that oil and gas companies are obtaining substantially higher profits than are other industries in Canada.

53
Government Spending on Canada's Oil and Gas Industry
7 CONCLUSION While the government of Canada no longer provides massive direct financial support to specific energy megaprojects, subsidization of the oil and gas sector is still considerable. In this report, we have identified and quantified a portion of public support for the oil and gas sector in Canada. We focused on support provided by the federal government for conventional oil and gas as well as oil sands, in the form of direct, program and tax expenditures. Whenever possible, we drew on the governments’ own estimates of expenditure on the oil and gas sector. Where such information was not available, we based our estimates on historical trends or used Statistics Canada data to develop them. In some cases, estimates could not be obtained or developed and a value of zero was assigned. We found that without including program expenditure (largely dedicated to regulating the industry), public support for the oil and gas sector totalled $1,060 million (2000$) in 1996 and $1,410 (2000$) million in 2002. The increase in expenditure over this time period was 33%. Total expenditure between 1996 and 2002, inclusive, without including program expenditure, was equal to $8,097 million (2000$).156 The vast majority of the expenditure is associated with tax initiatives and in particular the Canadian Development Expense, the Canadian Exploration Expense, the Resource Allowance and the Accelerated Capital Cost Allowance for oil sands. Other research has demonstrated relatively low taxation levels for the oil and gas sector, high tax concessions for oil sands and relatively high profits of oil and gas companies. Moreover, a comparison of the amount of revenue collected from oil and gas developments in Canada versus Alaska and Norway, revealed that relative to these international benchmarks, oil and gas operations in Canada are receiving an implicit subsidy in the form of excessive profits which accrue to companies rather than being captured by governments through taxes, royalties and other revenue generating policy options. The increase in federal expenditure on Canada's oil and gas industry described in this report is especially worrisome in light of the need to reduce subsidies to the oil and gas sector and reduce GHG emissions as part of Canada’s Kyoto Protocol obligations. In addition to the federal focus, in this study we endeavoured to quantify estimates of government support for oil sands not only from the federal government, but also from the Government of Alberta. A rough estimate of federal government expenditure on oil sands, including that associated with taxes, research and development and the Syncrude Remission Order is $1,193 million (2000$) from 1996 to 2002, inclusive. Because the estimates were pieced together from various sources and different methods were employed to originally derive them, there is uncertainty associated with this total figure. Nonetheless, it provides an indication of the extent of federal government support for oil sands developments of late. Upon investigation of provincial support for oil sands, we discovered that estimates of such support are virtually non-existent. The government of Alberta does not track tax concessions associated with any form of oil and gas development. Neither does it track research and development support or direct expenditure. A similar discovery was made by a past investigation into this topic.157 The Government’s attempt to reconcile the irreconcilable — continued growth of the oil and gas sector (and its emissions) aided by public expenditure, and reductions in Canada’s total GHG emissions — carries a high price tag. Firstly, as is described in this report, taxpayers are 156 This estimate includes support for oil sands as well as conventional oil and gas developments. 157 Pigeon, Marc-Andre. 2003. Tax Incentives and Expenditures Offered to the Oil Sands Industry. Parliamentary Research Branch.

54
Government Spending on Canada's Oil and Gas Industry
financially supporting the industry. But in addition, if Canada is to meet its international obligations, emission increases permitted for the oil and gas sector will have to be compensated — in effect, subsidized — by emission reductions undertaken and paid for by some combination of other industry sectors, general taxpayers, and the public. If Canada fails to meet its international obligations, the price will be paid by the environment, and by the people — predominantly poor citizens of developing countries158 — who are expected to face the greatest impacts of climate change. The subsidy estimates presented above and in the results chapter of this report are significant. Their magnitude alone is a strong indication of the amount of leverage the federal government has to adjust subsidy regimes and save money, incent efficiency gains, promote environmental protection and align government expenditure trends with environmental objectives, especially those associated with reducing GHG emissions. Yet, with the exception of a decline in federal expenditure on energy mega-projects in Canada, we have seen little action by the government to reform subsidies. Moreover, the reduction in expenditure on mega-projects that has been realized in the last several decades has been accompanied by an increase in expenditure though tax initiatives-a category of expenditure that is much less transparent and quantifiable. As was described in the introduction of this report, subsidies to the oil and gas sector distort markets, contribute to excessive consumption of oil and gas resources, foster pollution, waste, and inefficiency, and discourage conservation.159 In addition, they restrict the development of substitutes that are more environmentally friendly and perpetuate the status quo in production processes by making it cheaper to continue with existing technologies and methods than to adopt relatively more expensive new technologies.160 They also have to be paid for by tax revenues-revenues that could instead be directed at energy conserving, energy efficient and low-impact renewable energy technologies and on transition funds for communities highly dependent on oil and gas production. This study demonstrates the imperative for Canada’s governments to begin seriously reforming environmentally harmful subsidies. Subsidy reform should focus on changes that will lead to the greatest environmental improvements, result in significant financial savings and reduce externalities. The table below describes the expected outcomes from the removal of a selection of subsidies relevant to the oil and gas sector. These subsidies are targeted at energy, access to natural resources, research and development and low tax rates for capital (such as the accelerated capital cost allowance for oil sands investments described in this report). As can be seen, reform of the subsidies included in the table below has the potential to lead to significant environmental improvements while also facilitating increased efficiency and the transition to new environmentally friendly technologies. The table also describes the need to package subsidy reform policies with other environmental policies including targets.
158 Intergovernmental Panel on Climate Change. 2001. Summary for Policymakers, A Report of Working Group II of the Intergovernmental Panel on Climate Change, p. 8; http://www.ipcc.ch/pub/wg2SPMfinal.pdf. 159 Boyd, David R. 2003. Unnatural Law-Rethinking Canadian Environmental Law and Policy. Vancouver: UBC Press. 160 Myers, Norman and Jennifer Kent. 2001. Perverse Subsidies-How Tax Dollars can Undercut the Environment and the Economy. Connecticut: Island Press.

55
Government Spending on Canada's Oil and Gas Industry
Table 7-1 Overview of the expected effects of subsidy removal
ACTION SHORT TERM IMPACTS LONG TERM IMPACTS Reduce subsidies to energy sector
Increased costs and immediate discontinuation of some production activities. Exit of least efficient production units, if revenues drop below costs.
Substitution to new technologies. If accompanied by effective environmental policies this creates a window of opportunities for environmental improvement.
Limit access to natural resources
Increased price of natural resources for downstream users, and increased resource efficiency.
Higher barrier to entry and/or disappearance of the least efficient production units.
Reduce research and development subsidies
Deployment of environmentally more benign technologies, if accompanied with effective environmental targets.
Reduce or eliminate preferential low rates of capital taxes
Possibly somewhat higher marginal costs. Exit of the least efficient production units, if revenues drop below costs.
Higher barrier to entry. Higher prices lead to reduced demand.
Source: Modified from Pieters, Jan. 2003. “When Removing Subsidies Benefits the Environment: Developing a Checklist Based on the Conditionality of Subsidies” in Environmentally Harmful Subsidies: Policy Issues and Challenges. Paris, France: OECD. Based on the evidence presented in this study, we recommend a number of actions related to public expenditure on oil and gas:
• Complete a systematic review of all subsidies on a regular basis. This important task should be undertaken periodically to ensure that the subsidies in place are in the best interest of society given current conditions. For example, many of the subsidies associated with oil and gas production were established when oil and natural gas prices were different than they are today. Changes in prices and other national/international conditions should trigger regular assessments of existing subsidies.
• Eliminate federal subsidies to the oil and gas sector. In doing so, fiscal objectives
will be aligned with environmental objectives. This is an important component of any policy package intended to reduce GHG emissions. To determine which subsidies are most appropriate for removal, a complete assessment of federal subsides to the oil and gas sector should be undertaken by appropriate government authorities with input from relevant stakeholders. The assessment should be accompanied by the establishment of a specific timetable for the elimination of environmentally harmful subsidies associated with oil and gas production, including that from oil sands.
• Redirect environmentally harmful oil and gas subsidies towards environmentally
beneficial energy options. While the government has moved forward in providing limited support to low-impact renewable energy technologies (for example through the Wind Power Production Incentive and the Canadian Renewable Energy Conservation Expense), expanded and sustained support for these viable technologies is needed to allow them to compete with established conventional energy technologies. It is not enough just to level the taxation playing field. The scales need to be tipped in favour of environmentally beneficial technologies (including energy efficient technologies and low-impact renewable energy options) in order to redress the historical subsidy imbalance

56
Government Spending on Canada's Oil and Gas Industry
until such time as they have gained substantial market share and are able to compete on their own with conventional technologies.
• Develop and implement a just transition strategy for communities highly
dependent on oil and gas production. As subsidies are phased out, funds should be made available to facilitate a transition away from oil and gas for communities highly dependent on oil and gas production. The elements of a successful just transition program could include: training and educational opportunities that allow workers to upgrade their skills for new jobs that are being created; early notice of layoffs, whenever possible, so that workers can access counselling and training/educational programs quickly; income support for displaced workers – depending on time in the energy workforce – to enable workers to take advantage of training and educational opportunities; peer counselling to assess workers’ needs, and analysis of labour market needs; and relocation funds for those who must move in order to find new work.
• Reconcile government support for oil sands developments with international
obligations to reduce GHG emissions. Oil sands developments in Alberta have received significant government support, especially through the tax system. This preferential treatment is at odds with environmental objectives and, specifically, Canada’s obligations to reduce GHG emissions under the Kyoto Protocol and the United Nations Framework Convention on Climate Change. Immediate reform of this support is needed as part of government policy action to reduce GHG emissions in Canada.
• Implement the polluter pay principle. While only discussed briefly in this report, it is
important to remember that in this analysis we have only quantified a portion of total subsidies associated with oil and gas (including oil sands) developments. As was described in the introduction and methods chapters, we have not quantified subsidies associated with externalities, public expenditure on environmental protection or government support for environmental remediation. Government intervention is required to facilitate the internalization of these costs into market prices such that they become part of production and consumption costs and individuals and businesses have incentives to minimize environmental impacts. The most appropriate way to ensure this internalization is through the implementation of the polluter pay principle, whereby those that cause environmental harm are required to incur associated costs. For example, the federal government could reduce the amount of GHG emission permits that it is proposing to grant free-of-charge to the oil and gas sector under its proposed “Large Final Emitter” policy. It could also remove the emissions intensity basis of that policy so that industry will have to pay for permits to cover emissions associated with production increases. Such actions would be consistent with the commitment made by the federal government as part of the OECD Environmental Strategy for the First Decade of the 21st Century which calls for governments to give priority to market-based policy instruments such as subsidy removal, green tax reform and tradable emission permits and quotas. 161
• Maximize revenue generation from oil and gas developments. Recent research by
the Pembina Institute revealed that relative to Alaska and Norway, Canadian
161 OECD. 2001. OECD Environmental Strategy for the First Decade of the 21st Century. Adopted by OECD Environment Ministers. Paris, France: OECD.

57
Government Spending on Canada's Oil and Gas Industry
governments are obtaining a lower percentage of the total amount of revenue available from oil and gas developments. To the extent that governments in Canada are not maximizing revenues collected from the development of oil and gas resources, they are instead providing an implicit subsidy to the oil and gas sector. Governments in Canada need to ensure that they are providing maximum compensation to the citizens of the country for the development of these non-renewable, largely publicly owned resources.
• Provide comprehensive estimates of federal expenditure, including tax
expenditure, at the sectoral level. In estimating public support for the oil and gas sector, it was not possible to obtain estimates for all relevant expenditure items from one source. Estimates, particularly those for tax initiatives, were obtained from multiple sources, developed from historical data, derived, or omitted. This piecemeal approach increases the uncertainty of the results and does not result in a complete picture of total government support. According to the Commissioner of the Environment and Sustainable Development, no one is currently collecting the data needed to estimate total tax expenditure associated with accelerated write-offs. Given the substantial support that this tax initiative provides to some sectors, including oil sands, but also the mining industry, it is imperative that the government know what it is costing them and the citizens of Canada on an annual basis. Expenditure associated with this and other tax initiatives should be tracked and published by the Department of Finance on an annual basis. This conclusion is supported by the Commissioner of the Environment and Sustainable Development who encouraged the Department of Finance “to explore ways to estimate the total cost of tax incentives, to determine whether they are meeting objectives cost effectively and to determine whether they are still needed.”162
• Provide accurate and up-to-date estimates of provincial expenditure on a sectoral
basis in Alberta.163 As was stated above, we found it impossible to obtain estimates of expenditure associated with oil sands development at the provincial level. The government of Alberta does not currently track such expenditure and estimates could not be obtained from other sources or inferred from historical data. What we do know is that between 1996 and 2002, royalty revenue from oil sands declined by 49% while production from the oil sands increased by 67%. This disconnect is the result of a royalty regime that incents continual development as a way to defer royalty payments. Informed public debate requires knowledge of the level of government support through tax breaks, reduced royalties and support for research and development provided by this royalty/tax regime.
In conclusion, it is important to recognize that while the reform or removal of environmentally harmful subsidies will not by itself solve environmental problems, such steps are necessary to achieve environmental improvements and objectives. The OECD recently called for a “[s]ystematic review of environmentally harmful subsidies in sectors such as transportation and energy [in Canada].” This study is intended to be a first step in responding to that call. The implementation of the recommendations presented above will complete the needed response.
162 Commissioner of the Environment and Sustainable Development. 2000. Report of the Commissioner of the Environment and Sustainable Development. 163 Similar estimates are needed for other oil and gas producing provinces, such as Saskatchewan and British Columbia, although these regions were outside the scope of this study.