Government Properties Income...
25
Government Properties Income Trust Investor Presentation November 2017 Stevens Center, Richland, WA Two Buildings, Square Feet: 140,152 Agency Occupant: U.S. Department of Energy Energy Star Certified
Transcript of Government Properties Income...

Government Properties Income Trust Investor Presentation
November 2017
Stevens Center, Richland, WA
Two Buildings, Square Feet: 140,152
Agency Occupant: U.S. Department of Energy
Energy Star Certified
Government Properties Income Trust 2
Disclaimer. THIS PRESENTATION CONTAINS STATEMENTS THAT CONSTITUTE FORWARD LOOKING STATEMENTS WITHIN THE MEANING OF THE PRIVATE SECURITIES LITIGATION REFORM ACT OF 1995 AND OTHER SECURITIES
LAWS. ALSO, WHENEVER WE USE WORDS SUCH AS “BELIEVE”, “EXPECT”, “ANTICIPATE”, “INTEND”, “PLAN”, “ESTIMATE”, “WILL”, “MAY” AND NEGATIVES OR DERIVATIVES OF THESE OR SIMILAR EXPRESSIONS, WE ARE
MAKING FORWARD LOOKING STATEMENTS. THESE FORWARD LOOKING STATEMENTS ARE BASED UPON OUR PRESENT INTENT, BELIEFS OR EXPECTATIONS, BUT FORWARD LOOKING STATEMENTS ARE NOT
GUARANTEED TO OCCUR AND MAY NOT OCCUR. FORWARD LOOKING STATEMENTS IN THIS REPORT RELATE TO VARIOUS ASPECTS OF OUR BUSINESS, INCLUDING OUR ACQUISITIONS AND SALES OF PROPERTIES,
OUR ABILITY TO COMPETE FOR ACQUISITIONS AND TENANCIES EFFECTIVELY, THE LIKELIHOOD THAT OUR TENANTS WILL PAY RENT OR BE NEGATIVELY AFFECTED BY CYCLICAL ECONOMIC CONDITIONS OR
GOVERNMENT BUDGET CONSTRAINTS, THE LIKELIHOOD THAT OUR TENANTS WILL RENEW OR EXTEND THEIR LEASES AND NOT EXERCISE EARLY TERMINATION OPTIONS PURSUANT TO THEIR LEASES OR THAT WE
WILL OBTAIN REPLACEMENT TENANTS, THE LIKELIHOOD THAT OUR RENTS WILL INCREASE WHEN WE RENEW OR EXTEND OUR LEASES OR ENTER NEW LEASES, OUR ABILITY TO PAY DISTRIBUTIONS TO OUR
SHAREHOLDERS AND THE AMOUNT OF SUCH DISTRIBUTIONS, OUR EXPECTATION THAT WE BENEFIT FINANCIALLY FROM OUR OWNERSHIP INTEREST IN SELECT INCOME REIT (SIR), OUR POLICIES AND PLANS
REGARDING INVESTMENTS, FINANCINGS AND DISPOSITIONS, THE FUTURE AVAILABILITY OF BORROWINGS UNDER OUR REVOLVING CREDIT FACILITY, OUR EXPECTATION THAT THERE WILL BE OPPORTUNITIES FOR
US TO ACQUIRE, AND THAT WE WILL ACQUIRE, ADDITIONAL PROPERTIES, INCLUDING PROPERTIES THAT ARE MAJORITY LEASED TO GOVERNMENT TENANTS OR GOVERNMENT CONTRACTOR TENANTS, OUR
EXPECTATIONS REGARDING DEMAND FOR LEASED SPACE BY THE U.S. GOVERNMENT AND STATE AND LOCAL GOVERNMENTS, OUR ABILITY TO RAISE EQUITY OR DEBT CAPITAL, OUR ABILITY TO PAY INTEREST ON
AND PRINCIPAL OF OUR DEBT, OUR ABILITY TO APPROPRIATELY BALANCE OUR USE OF DEBT AND EQUITY CAPITAL, OUR CREDIT RATINGS, OUR EXPECTED BENEFITS FROM OUR ACQUISITION OF FIRST POTOMAC
REALTY TRUST (FPO) AND THE CREDIT QUALITIES OF OUR TENANTS.
OUR ACTUAL RESULTS MAY DIFFER MATERIALLY FROM THOSE CONTAINED IN OR IMPLIED BY OUR FORWARD LOOKING STATEMENTS AS A RESULT OF VARIOUS FACTORS, SUCH AS THE IMPACT OF CHANGES IN THE
ECONOMY AND THE CAPITAL MARKETS ON US AND OUR TENANTS, COMPETITION WITHIN THE REAL ESTATE INDUSTRY, PARTICULARLY WITH RESPECT TO THOSE MARKETS WHERE OUR PROPERTIES ARE LOCATED
AND WITH RESPECT TO GOVERNMENT TENANCIES, THE IMPACT OF CHANGES IN THE REAL ESTATE NEEDS AND FINANCIAL CONDITIONS OF THE U.S. GOVERNMENT AND STATE AND LOCAL GOVERNMENTS,
COMPLIANCE WITH, AND CHANGES TO APPLICABLE LAWS, REGULATIONS AND RULES, ACTUAL AND POTENTIAL CONFLICTS OF INTEREST WITH OUR RELATED PARTIES, OUR ABILITY TO SATISFY COMPLEX RULES IN
ORDER FOR US TO QUALIFY FOR TAXATION AS A REIT FOR U.S. FEDERAL INCOME TAX PURPOSES AND ACTS OF TERRORISM, OUTBREAKS OF SO CALLED PANDEMICS OR OTHER MANMADE OR NATURAL DISASTERS
BEYOND OUR CONTROL. FOR EXAMPLE: (A) WE MAY BE UNABLE TO PAY OUR DEBT OBLIGATIONS WHEN THEY BECOME DUE OR TO MAINTAIN OUR CURRENT RATE OF DISTRIBUTIONS ON OUR COMMON SHARES AND
FUTURE DISTRIBUTIONS MAY BE REDUCED OR ELIMINATED; (B) WE MAY BE UNABLE TO IDENTIFY PROPERTIES THAT WE WANT TO ACQUIRE OR TO NEGOTIATE ACCEPTABLE PURCHASE PRICES, ACQUISITION
FINANCING OR LEASE TERMS FOR NEW PROPERTIES; (C) SOME OF OUR TENANTS MAY NOT RENEW EXPIRING LEASES, AND WE MAY BE UNABLE TO OBTAIN NEW TENANTS TO MAINTAIN OR INCREASE THE
HISTORICAL OCCUPANCY RATES OF, OR RENTS FROM, OUR PROPERTIES; (D) SOME GOVERNMENT TENANTS MAY EXERCISE THEIR RIGHTS TO VACATE THEIR SPACE BEFORE THE STATED EXPIRATION OF THEIR
LEASES, AND WE MAY BE UNABLE TO OBTAIN NEW TENANTS TO MAINTAIN THE HISTORICAL OCCUPANCY RATES OF, OR RENTS FROM, OUR PROPERTIES; (E) RENTS THAT WE CAN CHARGE AT OUR PROPERTIES MAY
DECLINE BECAUSE OF CHANGING MARKET CONDITIONS OR OTHERWISE; (F) CONTINGENCIES IN OUR ACQUISITION AND SALE AGREEMENTS MAY NOT BE SATISFIED AND OUR PENDING ACQUISITIONS AND SALES
MAY NOT OCCUR, MAY BE DELAYED OR THE TERMS MAY CHANGE; (G) CONTINUED AVAILABILITY OF BORROWINGS UNDER OUR REVOLVING CREDIT FACILITY IS SUBJECT TO OUR SATISFYING CERTAIN FINANCIAL
COVENANTS AND OTHER CREDIT FACILITY CONDITIONS THAT WE MAY BE UNABLE TO SATISFY; (H) ACTUAL COSTS UNDER OUR REVOLVING CREDIT FACILITY OR OTHER FLOATING RATE CREDIT FACILITIES WILL BE
HIGHER THAN LIBOR PLUS A PREMIUM BECAUSE OF FEES AND EXPENSES ASSOCIATED WITH SUCH FACILITIES; (I) MOODY'S AND S&P RECENTLY UPDATED OUR CREDIT RATING OUTLOOK TO NEGATIVE WHICH MAY
IMPLY THAT OUR CREDIT RATINGS MAY BE DOWNGRADED, IN WHICH CASE WE MAY NOT BE ABLE TO ACCESS DEBT CAPITAL OR THE DEBT CAPITAL WE CAN ACCESS MAY BE EXPENSIVE; (J) OUR OPTION TO EXTEND
THE MATURITY DATE OF OUR REVOLVING CREDIT FACILITY IS SUBJECT TO OUR PAYMENT OF A FEE AND MEETING OTHER CONDITIONS THAT MAY NOT BE MET; (K) WE MAY FAIL TO EXECUTE SUCCESSFULLY ON OUR
EXPANDED BUSINESS STRATEGY OR INCREASED SCALE RESULTING FROM THE FPO TRANSACTION AND THEREFORE MAY NOT REALIZE THE BENEFITS WE EXPECT FROM THE FPO TRANSACTION; (L) SIR MAY
REDUCE THE AMOUNT OF ITS DISTRIBUTIONS TO ITS SHAREHOLDERS, INCLUDING US; (M) WE MAY BE UNABLE TO SELL OUR SIR COMMON SHARES FOR AN AMOUNT EQUAL TO OUR CARRYING VALUE OF THOSE
SHARES AND ANY SUCH SALE MAY BE AT A DISCOUNT TO MARKET PRICE BECAUSE OF THE LARGE SIZE OF OUR SIR HOLDINGS OR OTHERWISE; AND (N) DEVELOPMENT PROJECTS AND UNSPENT LEASING RELATED
OBLIGATIONS MAY COST MORE OR LESS AND MAY TAKE LONGER TO COMPLETE THAN WE CURRENTLY EXPECT, AND WE MAY INCUR INCREASING AMOUNTS FOR THESE AND SIMILAR PURPOSES IN THE FUTURE.
OUR ANNUAL REPORT ON FORM 10-K FOR THE YEAR ENDED DECEMBER 31, 2016, OUR QUARTERLY REPORT ON FORM 10-Q FOR THE QUARTER ENDED JUNE 30, 2017 AND OUR OTHER FILINGS WITH THE SECURITIES
AND EXCHANGE COMMISSION (SEC) IDENTIFY OTHER IMPORTANT FACTORS THAT COULD CAUSE DIFFERENCES FROM OUR FORWARD LOOKING STATEMENTS. OUR FILINGS WITH THE SEC ARE AVAILABLE ON THE
SEC’S WEBSITE AT WWW.SEC.GOV. YOU SHOULD NOT PLACE UNDUE RELIANCE UPON OUR FORWARD LOOKING STATEMENTS. EXCEPT AS REQUIRED BY LAW, WE DO NOT INTEND TO UPDATE OR CHANGE ANY
FORWARD LOOKING STATEMENTS AS A RESULT OF NEW INFORMATION, FUTURE EVENTS OR OTHERWISE.
NON-GAAP FINANCIAL MEASURES
THIS PRESENTATION CONTAINS NON-GAAP FINANCIAL MEASURES INCLUDING NORMALIZED FUNDS FROM OPERATIONS (FFO), ADJUSTED EBITDA, NET OPERATING INCOME (NOI) AND CASH BASIS NOI.
RECONCILIATIONS FOR THESE METRICS TO THE CLOSEST U.S. GENERALLY ACCEPTED ACCOUNTING PRINCIPLES (GAAP) METRICS ARE INCLUDED IN AN APPENDIX HERETO.
Note: Unless otherwise noted, data is presented as of September 30, 2017 and excludes properties classified as discontinued operations.
Government Properties Income Trust 3
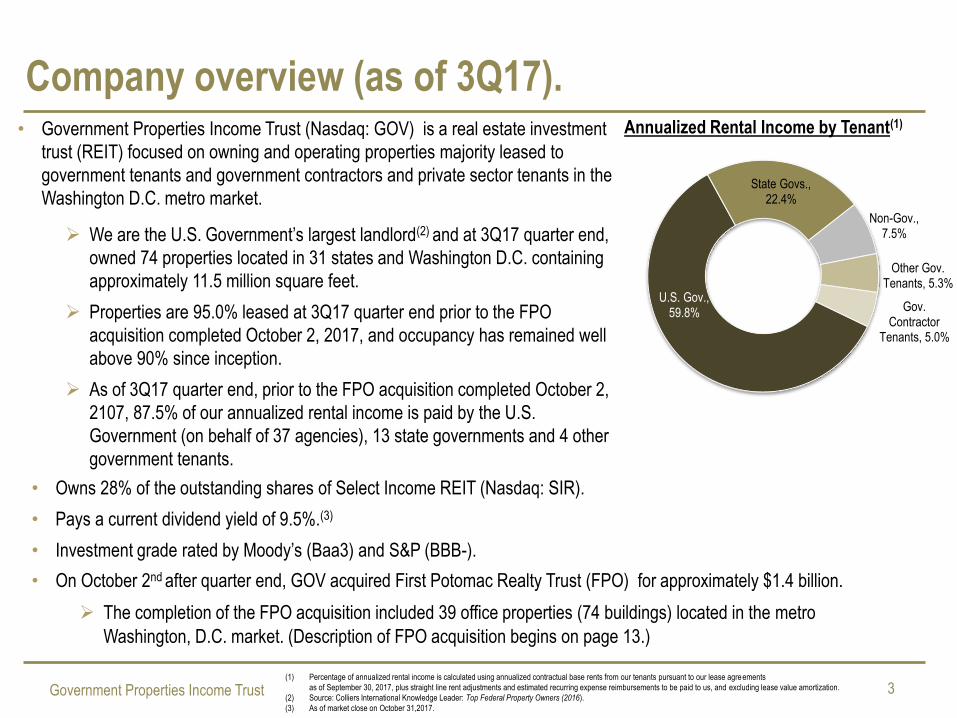
U.S. Gov., 59.8%
State Govs., 22.4%
Non-Gov., 7.5%
Other Gov. Tenants, 5.3%
Gov. Contractor
Tenants, 5.0%
• Government Properties Income Trust (Nasdaq: GOV) is a real estate investment
trust (REIT) focused on owning and operating properties majority leased to
government tenants and government contractors and private sector tenants in the
Washington D.C. metro market.
We are the U.S. Government’s largest landlord(2) and at 3Q17 quarter end,
owned 74 properties located in 31 states and Washington D.C. containing
approximately 11.5 million square feet.
Properties are 95.0% leased at 3Q17 quarter end prior to the FPO
acquisition completed October 2, 2017, and occupancy has remained well
above 90% since inception.
As of 3Q17 quarter end, prior to the FPO acquisition completed October 2,
2107, 87.5% of our annualized rental income is paid by the U.S.
Government (on behalf of 37 agencies), 13 state governments and 4 other
government tenants.
Company overview (as of 3Q17).
Annualized Rental Income by Tenant(1)
(1) Percentage of annualized rental income is calculated using annualized contractual base rents from our tenants pursuant to our lease agreements
as of September 30, 2017, plus straight line rent adjustments and estimated recurring expense reimbursements to be paid to us, and excluding lease value amortization.
(2) Source: Colliers International Knowledge Leader: Top Federal Property Owners (2016).
(3) As of market close on October 31,2017.
• Owns 28% of the outstanding shares of Select Income REIT (Nasdaq: SIR).
• Pays a current dividend yield of 9.5%.(3)
• Investment grade rated by Moody’s (Baa3) and S&P (BBB-).
• On October 2nd after quarter end, GOV acquired First Potomac Realty Trust (FPO) for approximately $1.4 billion.
The completion of the FPO acquisition included 39 office properties (74 buildings) located in the metro
Washington, D.C. market. (Description of FPO acquisition begins on page 13.)

Government Properties Income Trust 4
A conservative strategy designed to provide secure and stable income. Enhancing security through leasing:
• As of 3Q17, Approximately 88% of GOV’s rental income is
paid by investment grade tenants.
• Historically, government tenants remain in place significantly
longer than private sector tenants, with U.S. Government
tenants historically occupying the same space for more than
20 years.
• Since the beginning of 2016, GOV’s consolidated and same-
property occupancy has averaged 95%.
Enhancing security through fiscal management:
• We have been investment grade rated since 2010.
• As part of the long term financing plan for the FPO
acquisition, we expect to sell properties that will allow GOV
to manage leverage consistently with the rating agencies’
expectations to maintain our investment grade ratings.
Representative GOV Tenants

Government Properties Income Trust 5
VA
CA
DC
GA MD NY
MA
Other
GOV’s tenant base (as of 3Q17). U.S. Government Tenant Diversity State Government Tenant Diversity
Geographic Diversity(2)
(1) Rentable sq. ft. is pursuant to leases existing as of September 30, 2017 and includes (i) space being fitted out for occupancy, if any, and (ii) space which is leased but is not occupied or is being offered for sublease, if any. Rentable sq. ft.
measurements are subject to changes when space is re-measured or re-configured for new tenants.
(2) Percentage of annualized rental income is calculated using annualized contractual base rents from our tenants pursuant to our lease agreements as of September 30, 2017, plus straight line rent adjustments and estimated recurring
expense reimbursements to be paid to us, and excluding lease value amortization.
(3) Agency occupant cannot be disclosed.
(4) Rentable sq. ft. excludes an expansion being contstructed at an existing property prior to the commencement of the lease.
% of Total % of
Rentable Rentable Annualized
Sq. Ft. (1) Sq. Ft. (1) Rental Income (2)
U.S. Government:
1 Citizenship and Immigration Services 448,607 3.9 % 8.0 %
2 Internal Revenue Service 1,041,806 9.0 % 7.8 %
3 U.S. Government (3) 406,388 3.5 % 4.5 %
4 Federal Bureau of Investigation 304,425 2.6 % 3.3 %
5 Department of Justice 239,417 2.1 % 2.9 %
6 Centers for Disease Control (4) 352,876 3.1 % 2.8 %
7 Department of Veterans Affairs 281,525 2.4 % 2.6 %
8 Customs and Border Protection 243,162 2.1 % 2.4 %
9 Bureau of Land Management 304,831 2.6 % 2.3 %
10 Defense Intelligence Agency 266,000 2.3 % 1.9 %
11 Social Security Administration 189,645 1.6 % 1.7 %
12 Bureau of Reclamation 212,996 1.8 % 1.7 %
13 National Park Service 166,745 1.4 % 1.6 %
14 U.S. Courts 114,219 1.0 % 1.5 %
15 Immigration and Customs Enforcement 90,688 0.8 % 1.3 %
16 Drug Enforcement Agency 93,177 0.8 % 1.2 %
17 National Archives and Record Administration 352,064 3.1 % 1.1 %
18 Department of Health and Human Services 108,849 0.9 % 1.1 %
19 Department of Energy 140,152 1.2 % 1.0 %
20 Defense Nuclear Facilities Board 60,133 0.5 % 1.0 %
21 Department of State 89,058 0.8 % 0.9 %
22 U.S. Postal Service 321,800 2.8 % 0.9 %
23 Occupational Health and Safety Administration 57,770 0.5 % 0.7 %
24 Bureau of the Fiscal Service 98,073 0.9 % 0.7 %
25 Centers for Medicare and Medicaid Services 78,361 0.7 % 0.7 %
26 Military Entrance Processing Station 56,931 0.5 % 0.6 %
27 Environmental Protection Agency 43,232 0.4 % 0.6 %
28 Department of the Army 228,108 2.0 % 0.6 %
29 Department of Housing and Urban Development 82,497 0.7 % 0.6 %
30 Bureau of Prisons 51,138 0.4 % 0.4 %
31 General Services Administration 20,535 0.2 % 0.4 %
32 Food and Drug Administration 33,398 0.3 % 0.3 %
33 Department of Defense 31,030 0.3 % 0.3 %
34 Equal Employment Opportunity Commission 22,516 0.2 % 0.2 %
35 Small Business Administration 8,575 0.1 % 0.1 %
36 Department of Labor 6,459 0.1 % 0.0 %
37 U.S. Coast Guard 4,064 0.0 % 0.0 %
Subtotal U.S. Government 6,651,250 57.8 % 59.8 %
Tenant : Agency
% of Total % of
Rentable Rentable Annualized
Sq. Ft. (1) Sq. Ft. (1) Rental Income (2)
State Governments:
1 State of California - nine agency occupants 755,086 6.6 % 7.7 %
2 Commonwealth of Massachusetts - three agency occupants 307,119 2.7 % 3.5 %
3 State of Georgia - Department of Transportation 298,223 2.6 % 2.4 %
4 Commonwealth of Virginia - seven agency occupants 255,241 2.2 % 2.1 %
5 State of New Jersey - Department of Treasury 173,189 1.5 % 1.7 %
6 State of Oregon - four agency occupants 199,018 1.7 % 1.8 %
7 State of Washington - Social and Health Services 111,908 1.0 % 1.0 %
8 State of Arizona - Northern Arizona University 66,743 0.6 % 0.5 %
9 State of South Carolina - four agency occupants 124,238 1.1 % 0.5 %
10 State of Maryland - two agency occupants 84,674 0.7 % 0.5 %
11 State of Minnesota - Minnesota State Lottery 61,426 0.5 % 0.4 %
12 State of New York - Department of Agriculture 64,000 0.6 % 0.4 %
13 State of Kansas - Kansas University 4,220 0.0 % 0.0 %
Subtotal State Governments 2,505,085 21.8 % 22.4 %
4 Other Government Tenants 371,202 3.2 % 5.3 %
4 Government Contractor Tenants 416,369 3.6 % 5.0 %
Tenant - Agency

Government Properties Income Trust 6
Government leasing dynamics. U.S. Government:
• General Services Administration (GSA) oversees virtually all U.S. Government real estate, entering gross
leases on behalf of agencies with flat rents and annual expense reimbursements over an established base as
determined by Consumer Price Index changes plus 100% of real estate tax increases over a base amount.
• GSA has focused on reducing the amount of space per federal employee, consolidating agencies in
underutilized federally owned properties when available, and meeting security requirements and green
initiatives.
• Primary lease terms tend to be for 10-20 years with renewal options for 5 years.
• While 3-5 year renewal terms have been prevalent the last few years, GSA is focused on executing minimum
lease terms of 10 years for all GSA lease renewals.
• Many leases provide the agency the right to terminate with notice, but no termination penalty.
State governments:
• Most leases are full service gross with periodic rent increases and no reimbursement of operating expenses.
• Some state leases are subject to annual budget appropriations, which in GOV’s experience rarely result in
early terminations.

Government Properties Income Trust 7
GOV has a history of high tenant retention. LEASE EXPIRATION SCHEDULE
As of September 30, 2017
(dollars in thousands)
(1) The year of lease expiration is pursuant to current contract terms. Some of our government tenants have the right to vacate their space before the stated expirations of their leases. In addition, certain of our
government tenants have the right to terminate their leases if their respective legislature or other funding authority does not appropriate rent in their respective annual budgets.
(2) Leased square footage is pursuant to leases existing as of September 30, 2017, and includes (i) space being fitted out for tenant occupancy pursuant to our lease agreements, if any, and (ii) space which is
leased, but is not occupied or is being offered for sublease by tenants, if any. Sq. ft. measurements are subject to changes when space is re-measured or re-configured for new tenants.
(3) Annualized rental income is calculated using the annualized contractual base rents from our tenants pursuant to our lease agreements as of September 30, 2017, plus straight line rent adjustments and
estimated recurring expense reimbursements to be paid to us, and excludes lease value amortization.
(4) Leased square footage excludes an expansion being constructed at an existing property we own prior to the commencement of the lease.
Number of Tenants Expiration of leased Cumulative % Annualized Rental % of Cumulative %
Year (1) Expiring square feet (2) % of Total of Total Income Expiring (3) Annualized Total of Total
2017 20 434,049 4.0 % 4.0 % $ 10,004 3.6 % 3.6 %
2018 37 704,708 6.4 % 10.4 % 22,913 8.3 % 11.9 %
2019 45 1,940,016 17.7 % 28.1 % 59,116 21.5 % 33.4 %
2020 39 1,447,413 13.2 % 41.3 % 40,155 14.6 % 48.0 %
2021 37 1,061,519 9.7 % 51.0 % 20,732 7.5 % 55.5 %
2022 31 940,554 8.6 % 59.6 % 22,505 8.2 % 63.7 %
2023 18 595,662 5.4 % 65.0 % 13,685 5.0 % 68.7 %
2024 16 993,635 9.1 % 74.1 % 22,696 8.2 % 76.9 %
2025 15 801,648 7.3 % 81.4 % 16,572 6.0 % 82.9 %
2026 and thereafter 32 2,027,097 (4) 18.6 % 100.0 % 47,042 17.1 % 100.0 %
Total 290 10,946,301 100.0 % $ 275,420 100.0 %
Weighted average remaining
lease term (in years) 5.1 4.7

Government Properties Income Trust 8
Tenant retention expected to remain high.
• GOV typically begins to discuss renewals with government tenants at least two
years prior to lease expiration.
• As of September 30, 2017, leases contributing 26.85% of GOV’s annualized
rental income were set to expire over the ensuing 24 months. At this time, GOV
believes:
It will be able to renew or extend leases for 85% or more of this expiring rent;
Tenants contributing 3.22% of GOV’s annualized rent are expected to vacate;
and
Tenants contributing 0.77% of GOV’s annualized rent are at risk of vacating or
downsizing, with the vast majority expected to downsize such that only 0.23%
of GOV’s annualized rent is truly at risk.

Government Properties Income Trust 9
$0
$250
$500
2009 2010 2011 2012 2013 2014 2015 2016 2017
U.S. Government State Government United Nations Government Contractors
($ in millions)
Acquisition History Through October 31, 2017
Selectively targeting accretive acquisitions.
(1) Represents the ratio of (x) annual straight line rental income, excluding the impact of above and below market lease amortization, based on existing
leases at the acquisition date, less estimated annual property operating expenses as of the date of the acquisition, excluding depreciation and
amortization expense, to (y) the acquisition purchase price, excluding acquisition costs.
(2) Average remaining lease term weighted based on rental income as of the date of acquisition.
From inception through September 30, 2017, GOV has purchased 72 properties for approximately $1.7 billion at a weighted average cap rate of
8.5% and a weighted average remaining lease term of 7.2 years(2) .
*Note: In October 2017, GOV acquired the First Potomac Realty Trust property portfolio for $1.4 billion consisting of 39 office and industrial
properties (74 buildings). This acquisition is not included in the table above.
*

Government Properties Income Trust 10
GOV’s capital recycling track record. • Historically, GOV has identified properties for disposition based
upon the following criteria:
A property is vacant and the re-leasing prospects are
challenged either because of high potential capital costs
or a weak leasing environment; or
We are uncertain of the government’s long term commitment
to a property, and we believe the downtime to find a
replacement tenant is unacceptably long and/or the leasing
cost to re-tenant the space is uneconomical.
• Through September 30, 2017, GOV had sold seven properties for an aggregate sale price of
$83.7 million, excluding closing costs based upon this historical strategy.
• To finance the FPO acquisition and manage leverage, GOV will expand and change the criteria
for its property disposition program. GOV expects to raise between $500 - $700 million from
property sales before year-end 2018 from properties that are either non-core or where we can
harvest gains from strong property sales markets.

Government Properties Income Trust 11
GOV’s sustainability initiatives are enhancing portfolio metrics and earning accolades.
• The U.S. Government can favor buildings that are ENERGY STAR rated
or LEED designated. As a result, since becoming a public company in
2009, GOV has designated significant building improvement capital to
green building initiatives, reducing its carbon footprint and enhancing
relationships with tenants.
• 50 GOV buildings currently have ENERGY STAR certifications(1).
Buildings consume at least 25% less energy than the national median.
• 17 GOV buildings currently have LEED certifications(1).
Buildings consume less energy and water, have lower maintenance costs,
higher occupant satisfaction and lower greenhouse environmental impact.
• 9 GOV buildings participate in utility demand response programs whereby
revenue is earned by reducing electric demand during load reduction events
called by utility companies.
Reduces power consumption and greenhouse gas emissions.
• GOV has been recognized by the U.S. Department of Energy's Better Buildings
Alliance and the Institute for Market Transformation as an inaugural “Green
Lease Leader.”
(1) Current certifications are as of September 30, 2017.

Government Properties Income Trust 12
SIR investment adds further stability to cash flows.
• GOV has established a 27.8% equity interest in Select Income REIT (Nasdaq: SIR).
• Like GOV, SIR’s business is focused on earning secure cash flows and offering a safe and growing
distribution to its shareholders.
• SIR is an owner of single tenant office and industrial properties and the largest owner of industrial
lands in Hawaii. As of September 30, 2017, 36.6% of its rent was paid by investment grade rated
tenants, only 9.5% of its rents expire before the end of 2021, and the company has a conservative
Normalized FFO dividend payout ratio of 75.0%.
• GOV expects to receive approximately $51 million annually from SIR in the form of dividends
based upon SIR’s current distribution rate.
• SIR’s payout ratio remains low relative to its REIT peers, providing GOV with further potential to
grow its cash flows.
• GOV believes its SIR investment has a valuation upside based upon SIR’s low trading multiple and
the implied cap rate of its property investments.

Government Properties Income Trust
Supplemental Operating and Financial Data, March 31, 2016
First Potomac Realty Trust Acquisition
440 First Street, NW, Washington, D.C.
Square Feet: 141,576 520-540 Gaither Road, Rockville, MD
Square Feet: 483,723
2675 & 2677 Prosperity Avenue, Fairfax, VA
Square Feet: 329,456
11 Dupont Street NW, Washington, D.C.
Square Feet: 153,228

Government Properties Income Trust 14
• On October 2, 2017, GOV completed the acquisition of FPO, including 39 office properties (74
buildings) with approximately 6.5 million rentable square feet that were 93.3% occupied as of
September 30, 2017.(1)
Aggregate transaction value of approximately $1.4 billion.
Cash consideration paid out to FPO shareholders was $11.15 per fully diluted common share.
Repayment of approximately $483 million of FPO debt, the assumption of approximately $167
million of FPO mortgage debt(2) and the payment of transaction fees and expenses, net of FPO
cash on hand.
First Potomac Realty Trust acquisition overview.
Transaction
Details
• GOV expects to realize approximately $11 million of annual general and administrative expense
savings compared to FPO on a stand alone basis. G&A
Synergies
• GOV financed the acquisition with borrowings under the revolving credit facility, $494 million in net
proceeds from the sale of common equity and $300 million in 4% senior unsecured notes due in
2022.
• To repay amounts outstanding under the revolving credit facility and to reduce leverage, GOV plans
to undertake a property disposition program generating between $500 - $700 million in gross
proceeds.
Financing
(1) The acquisition of FPO included two properties owned by joint ventures in which we acquired FPO’s 50% and 51% interest.
(2) There is an additional $12 million of mortgage debt that encumbered the joint venture properties which are 50% and 51% owned by FPO.

Government Properties Income Trust
Supplemental Operating and Financial Data, March 31, 2016
Financials
1401 Rockville Pike, Rockville, MD
Square Feet: 190,044
Primary Tenant: Montgomery County

Government Properties Income Trust 16
Total debt (book value)/total gross assets
including market value of SIR common shares (1)(2)(3)
52.4%
Adjusted EBITDA/interest expense(4) 3.2x
Total debt(book value)/Annualized Adjusted
EBITDA(1)(4)
10.0x
Weighted average interest rate 3.56%
GOV’s financial profile.
Unsecured revolving credit facility $ 565,000
Unsecured term loans 547,682
Senior unsecured debt 943,543
Mortgage debt 26,561
Total debt 2,082,786
Market value of common shares (at end of Period) 1,860,970
Total Market Capitalization $ 3,943,756
(1) Debt amounts are net of unamortized premiums, discounts and certain issuance costs.
(2) Total gross assets is total assets plus accumulated depreciation.
(3) As of September 30, 2017, we owned 24,918,421 common shares of SIR. The closing price of SIR’s common shares on The Nasdaq Stock Market LLC on September 30, 2017 was $23.42 per share.
(4) See Appendix for the calculation of Adjusted EBITDA and a reconciliation of net income determined in accordance with GAAP to this amount.
Key Balance Sheet Metrics as of and
for the Quarter Ended September 30, 2017
Market Capitalization as of September 30, 2017
($ in 000s)
47%
14%
14%
24%
1%

Government Properties Income Trust 17
$350 million of fixed rate senior
unsecured debt which matures in
August 2019.
$300 million of fixed rate senior
unsecured debt which matures in
July 2022.
$310 million fixed rate senior
unsecured debt which matures in
May 2046.
Unsecured Senior Notes
$399 $1,671
$924,439
$301,619
$13,230
$550,000
$310,000
$-
$100,000
$200,000
$300,000
$400,000
$500,000
$600,000
2017 2018 2019 2020 2021 2022 2046
GOV has manageable, laddered debt maturities.
Unsecured Revolving
Credit Facility
$750 million facility with $185
million available as of 9/30/17.
Matures in January 2019 with a
one year extension option.
Unsecured Term Loans
$300 million loan which matures in
March 2020.
$250 million loan which matures in
March 2022.
Prepayable at any time.(1)
Our $300,000 term loan and our $250,000 term loan is prepayable without penalty at any time.
Debt Maturity Schedule as of September 30, 2017
($ in 000s)
Weighted average time to maturity is 6.5 years.
(1)

Government Properties Income Trust 18
Appendix.
8900 Grand Oak Circle, Tampa, FL
Square Feet: 67,916
Agency Occupant: U.S. Department of Veterans Affairs

Government Properties Income Trust 19
Condensed consolidated balance sheets. ($ in 000s, except share data)
September 30, December 31, 2017 2016
ASSETS Real estate properties:
Land $ 269,332 $ 267,855
Buildings and improvements 1,660,379 1,620,905
Total real estate properties, gross 1,929,711 1,888,760
Accumulated depreciation (331,069 ) (296,804 )
Total real estate properties, net 1,598,642 1,591,956
Equity investment in Select Income REIT 475,265 487,708
Assets of discontinued operations — 12,541
Acquired real estate leases, net 99,953 124,848
Deposit escrow for FPO acquisition 651,696 —
Cash and cash equivalents 551,707 29,941
Restricted cash 509 530
Rents receivable, net 47,461 48,458
Deferred leasing costs, net 22,250 21,079
Other assets, net 89,484 68,005
Total assets $ 3,536,967 $ 2,385,066
LIABILITIES AND SHAREHOLDERS’ EQUITY Unsecured revolving credit facility $ 565,000 $ 160,000
Unsecured term loans, net 547,682 547,171
Senior unsecured notes, net 943,543 646,844
Mortgage notes payable, net 26,561 27,837
Liabilities of discontinued operations — 45
Accounts payable and other liabilities 63,525 54,019
Due to related persons 4,297 3,520
Assumed real estate lease obligations, net 8,832 10,626
Total liabilities 2,159,440 1,450,062
Commitments and contingencies
Shareholders’ equity:
Common shares of beneficial interest, $.01 par value: 150,000,000 and 100,000,000 shares
authorized, respectively, 99,145,921 and 71,177,906 shares issued and outstanding, respectively 991 712
Additional paid in capital 1,968,249 1,473,533
Cumulative net income 126,410 96,329
Cumulative other comprehensive income 46,980 26,957
Cumulative common distributions (765,103 ) (662,527 )
Total shareholders’ equity 1,377,527 935,004
Total liabilities and shareholders’ equity $ 3,536,967 $ 2,385,066

Government Properties Income Trust 20
Condensed consolidated statements of income. ($ in 000s, except share data)
(1) General and administrative expenses for the three months ended September 30, 2017 include the reversal of $893 of previously accrued estimated business management incentive fees.
(2) We report rental income on a straight line basis over the terms of the respective leases; accordingly, rental income includes non-cash straight line rent adjustments. Rental income also includes expense reimbursements, tax escalations, parking
revenues, service income and other fixed and variable charges paid to us by our tenants, as well as the net effect of non-cash amortization of intangible lease assets and liabilities.
(3) We recorded a liability for the amount by which the estimated fair value for accounting purposes exceeded the price we paid for our investment in RMR Inc. common stock in June 2015. The liability is being amortized on a straight line basis
through December 31, 2035 as an allocated reduction to business management fees and property management fees, which are included in general and administrative and other operating expenses, respectively.
Three Months Ended September 30, Nine Months Ended September 30,
2017 2016 2017 2016
Rental income $ 70,179 $ 64,478 $ 209,362 $ 192,150
Expenses: Real estate taxes 8,862 7,591 24,980 22,810 Utility expenses 5,408 5,483 14,186 13,330 Other operating expenses 14,867 13,854 44,046 40,031 Depreciation and amortization 20,781 18,404 61,949 54,713
Loss on impairment of real estate 230 — 230 — Acquisition related costs — 147 — 363 General and administrative (1) 3,266 3,816 12,314 11,350
Total expenses 53,414 49,295 157,705 142,597
Operating income 16,765 15,183 51,657 49,553 Dividend income 304 304 911 667 Interest income 1,715 47 1,843 63 Interest expense (including net amortization of debt premiums and discounts
and debt issuance costs of $990, $805, $2,605 and $2,024, respectively) (16,055 ) (12,608 ) (43,599 ) (32,286 )
(Loss) gain on early extinguishment of debt (1,715 ) — (1,715 ) 104 Gain on issuance of shares by Select Income REIT 51 72 72 88
Income from continuing operations before income taxes and equity in earnings of investees 1,065 2,998 9,169 18,189
Income tax expense (22 ) (13 ) (65 ) (63 ) Equity in earnings of investees 9,484 8,668 20,804 28,002
Income from continuing operations 10,527 11,653 29,908 46,128 Income (loss) from discontinued operations 462 (154 ) 173 (429 )
Income before gain on sale of property 10,989 11,499 30,081 45,699
Gain on sale of property — 79 — 79 Net income $ 10,989 $ 11,578 $ 30,081 $ 45,778
Weighted average common shares outstanding (basic) 96,883 71,054 79,778 71,041
Weighted average common shares outstanding (diluted) 96,958 71,084 79,852 71,064
Per common share amounts (basic and diluted): Income from continuing operations $ 0.11 $ 0.16 $ 0.37 $ 0.65 Income (loss) from discontinued operations $ — $ — $ — $ (0.01 ) Net income $ 0.11 $ 0.16 $ 0.38 $ 0.64
Additional Data: General and administrative expenses (1)/ rental income 4.65 % 5.92 % 5.88 % 5.91 %
General and administrative expenses (1)/ total assets (at end of period) 0.09 % 0.17 % 0.35 % 0.50 %
Non-cash straight line rent adjustments (2) $ 711 $ 1,205 $ 3,115 $ 1,789
Lease value amortization included in rental income (2) $ (619 ) $ (370 ) $ (1,863 ) $ (1,103 )
Non-cash amortization included in other operating expenses (3) $ 121 $ 121 $ 363 $ 363
Non-cash amortization included in general and administrative expenses (3) $ 151 $ 151 $ 452 $ 452

Government Properties Income Trust 21
For the Three Months Ended For the Nine Months Ended
9/30/2017 6/30/2017 3/31/2017 12/31/2016 9/30/2016 9/30/2017 9/30/2016
Calculation of NOI and Cash Basis NOI (2):
Rental income (3) $ 70,179 $ 69,887 $ 69,296 $ 66,030 $ 64,478 $ 209,362 $ 192,150
Property operating expenses (29,137 ) (27,300 ) (26,775 ) (26,091 ) (26,928 ) (83,212 ) (76,171 )
Property net operating income (NOI) 41,042 42,587 42,521 39,939 37,550 126,150 115,979
Non-cash straight line rent adjustments included in rental income (3) (711 ) (1,104 ) (1,300 ) (902 ) (1,205 ) (3,115 ) (1,789 )
Lease value amortization included in rental income (3) 619 617 627 355 370 1,863 1,103
Non-cash amortization included in property operating expenses (4) (121 ) (121 ) (121 ) (121 ) (121 ) (363 ) (363 )
Cash Basis NOI $ 40,829 $ 41,979 $ 41,727 $ 39,271 $ 36,594 $ 124,535 $ 114,930
Reconciliation of Net Income to NOI and Cash Basis NOI:
Net income $ 10,989 $ 11,677 $ 7,415 $ 12,065 $ 11,578 $ 30,081 $ 45,778
Gain on sale of property — — — — (79 ) — (79 )
Income before gain on sale of property 10,989 11,677 7,415 12,065 11,499 30,081 45,699
(Income) loss from discontinued operations (462 ) 145 144 160 154 (173 ) 429
Income from continuing operations 10,527 11,822 7,559 12,225 11,653 29,908 46,128
Equity in earnings of investees (9,484 ) (8,581 ) (2,739 ) (7,516 ) (8,668 ) (20,804 ) (28,002 )
Income tax expense 22 25 18 38 13 65 63
Net (gain) loss on issuance of shares by SIR (51 ) (21 ) — 2 (72 ) (72 ) (88 )
Loss (gain) on early extinguishment of debt 1,715 — — — — 1,715 (104 )
Interest expense 16,055 13,963 13,581 12,774 12,608 43,599 32,286
Interest income (1,715 ) (67 ) (61 ) (95 ) (47 ) (1,843 ) (63 )
Dividend income (304 ) (303 ) (304 ) (304 ) (304 ) (911 ) (667 )
Operating income 16,765 16,838 18,054 17,124 15,183 51,657 49,553
General and administrative 3,266 5,086 3,962 3,547 3,816 12,314 11,350
Acquisition related costs — — — 828 147 — 363
Loss on impairment of real estate 230 — — — — 230 —
Depreciation and amortization 20,781 20,663 20,505 18,440 18,404 61,949 54,713
NOI 41,042 42,587 42,521 39,939 37,550 126,150 115,979
Non-cash amortization included in property operating expenses (4) (121 ) (121 ) (121 ) (121 ) (121 ) (363 ) (363 )
Lease value amortization included in rental income (3) 619 617 627 355 370 1,863 1,103
Non-cash straight line rent adjustments included in rental income (3) (711 ) (1,104 ) (1,300 ) (902 ) (1,205 ) (3,115 ) (1,789 )
Cash Basis NOI $ 40,829 $ 41,979 $ 41,727 $ 39,271 $ 36,594 $ 124,535 $ 114,930
Calculation of property net operating income (NOI)
and cash basis NOI(1).
($ in 000s)
(1) See definitions of Certain Non-GAAP Financial Measures on page 24 for the definition of NOI and Cash Basis NOI, a description of why we believe they are appropriate supplemental measures and a description of how we use these measures.
(2) Excludes one property (one building) classified as discontinued operations which was sold on August 31, 2017.
(3) We report rental income on a straight line basis over the terms of the respective leases; accordingly, rental income includes non-cash straight line rent adjustments. Rental income also includes expense reimbursements, tax escalations, parking revenues,
service income and other fixed and variable charges paid to us by our tenants, as well as the net effect of non-cash amortization of intangible lease assets and liabilities.
(4) We recorded a liability for the amount by which the estimated fair value for accounting purposes exceeded the price we paid for our investment in RMR Inc. common stock in June 2015. A portion of this liability is being amortized on a straight line basis
through December 31, 2035 as a reduction to property management fee expense, which are included in property operating expenses.

Government Properties Income Trust 22
Calculation of EBITDA and adjusted EBITDA(1).
($ in 000s)
(1) See Definitions of Certain Non-GAAP Financial Measures on page 24 for the definitions of EBITDA and Adjusted EBITDA and a description of why we believe they are appropriate supplemental measures.
(2) Amounts represent equity compensation awarded to our trustees, officers and certain other employees of RMR’s operating subsidiary, The RMR Group LLC.
(3) Incentive fees under our business management agreement with RMR LLC are payable after the end of each calendar year, are calculated based on common share total return, as defined, and are included
in general and administrative expense in our condensed consolidated statements of income. In calculating net income in accordance with GAAP, we recognize estimated business management incentive
fee expense, if any, in the first, second and third quarters. Although we recognize this expense, if any, in the first, second and third quarter for purposes of calculating net income, we do not include such
expense in the calculation of Adjusted EBITDA until the fourth quarter, when the amount of the business management incentive fee expense for the calendar year, if any, is determined. Incentive fees for
2017, if any, will be payable in cash in January 2018.
For the Three Months Ended For the Nine Months Ended
9/30/2017 6/30/2017 3/31/2017 12/31/2016 9/30/2016 9/30/2017 9/30/2016
Net income $ 10,989 $ 11,677 $ 7,415 $ 12,065 $ 11,578 $ 30,081 $ 45,778
Add: Interest expense 16,055 13,963 13,581 12,774 12,608 43,599 32,286
Income tax expense 22 25 18 38 13 65 63
Depreciation and amortization 20,781 20,663 20,505 18,440 18,404 61,949 54,713
EBITDA 47,847 46,328 41,519 43,317 42,603 135,694 132,840
Add (less): Acquisition related costs — — — 828 147 — 363
General and administrative expense paid in common shares (2) 432 459 277 55 470 1,168 1,314
Estimated business management incentive fees (3) (893 ) 893 — — — — —
Increase in carrying value of property included in discontinued operations (619 ) — — — — (619 ) —
Loss on impairment of real estate 230 — — — — 230 —
Distributions received from SIR 12,708 12,708 12,708 12,708 12,708 38,125 37,627
Gain (loss) on early extinguishment of debt 1,715 — — — — 1,715 (104 )
Equity in earnings of SIR (9,453 ) (8,207 ) (2,611 ) (7,486 ) (8,655 ) (20,271 ) (27,895 )
Gain (loss) on issuance of shares by SIR (51 ) (21 ) — 2 (72 ) (72 ) (88 )
Gain on sale of property — — — — (79 ) — (79 )
Adjusted EBITDA $ 51,916 $ 52,160 $ 51,893 $ 49,424 $ 47,122 $ 155,970 $ 143,978

Government Properties Income Trust 23
For the Three Months Ended For the Nine Months Ended
9/30/2017 6/30/2017 3/31/2017 12/31/2016 9/30/2016 9/30/2017 9/30/2016
Net income $ 10,989 $ 11,677 $ 7,415 $ 12,065 $ 11,578 $ 30,081 $ 45,778
Add: Depreciation and amortization 20,781 20,663 20,505 18,440 18,404 61,949 54,713
FFO attributable to SIR investment 18,429 17,149 12,404 17,618 17,264 47,982 53,609
Loss on impairment of real estate 230 — — — — 230 —
Less: Equity in earnings of SIR (9,453 ) (8,207 ) (2,611 ) (7,486 ) (8,655 ) (20,271 ) (27,895 )
Increase in carrying value of property included in discontinued operations (619 ) — — — — (619 ) —
Gain on sale of property — — — — (79 ) — (79 )
FFO 40,357 41,282 37,713 40,637 38,512 119,352 126,126
Add (less): Acquisition related costs — — — 828 147 — 363
Loss (gain) on early extinguishment of debt 1,715 — — — — 1,715 (104 )
Normalized FFO attributable to SIR investment 16,903 17,407 14,590 17,684 17,267 48,900 53,629
FFO attributable to SIR investment (18,429 ) (17,149 ) (12,404 ) (17,618 ) (17,264 ) (47,982 ) (53,609 )
(Gain) loss on issuance of shares by SIR (51 ) (21 ) — 2 (72 ) (72 ) (88 )
Estimated business management incentive fees (2) (893 ) 893 — — — — —
Normalized FFO $ 39,602 $ 42,412 $ 39,899 $ 41,533 $ 38,590 $ 121,913 $ 126,317
Weighted average common shares outstanding (basic) 96,883 71,088 71,079 71,079 71,054 79,778 71,041
Weighted average common shares outstanding (diluted) 96,958 71,119 71,094 71,079 71,084 79,852 71,064
Per common share amounts:
Net income (basic and diluted) $ 0.11 $ 0.16 $ 0.10 $ 0.17 $ 0.16 $ 0.38 $ 0.64
FFO (basic) $ 0.42 $ 0.58 $ 0.53 $ 0.57 $ 0.54 $ 1.50 $ 1.78
FFO (diluted) $ 0.42 $ 0.58 $ 0.53 $ 0.57 $ 0.54 $ 1.49 $ 1.77
Normalized FFO (basic and diluted) $ 0.41 $ 0.60 $ 0.56 $ 0.58 $ 0.54 $ 1.53 $ 1.78
Calculation of funds from operations (FFO) and
normalized FFO(1).
($ in 000s, except per share amounts)
(1) See Definitions of Certain Non-GAAP Financial Measures on page 24 for the definitions of FFO and Normalized FFO, a description of why we believe they are appropriate supplemental measures and a description of how we use these measures.
(2) Incentive fees under our business management agreement with RMR LLC are payable after the end of each calendar year, are calculated based on common share total return, as defined, and are included in general and administrative expense in
our condensed consolidated statements of income. In calculating net income in accordance with GAAP, we recognize estimated business management incentive fee expense, if any, in the first, second and third quarters. Although we recognize
this expense, if any, in the first, second and third quarter for purposes of calculating net income, we do not include such expense in the calculation of Adjusted EBITDA until the fourth quarter, when the amount of the business management
incentive fee expense for the calendar year, if any, is determined. Incentive fees for 2017, if any, will be payable in cash in January 2018.

Government Properties Income Trust 24
NON-GAAP financial measures definitions. Definition of NOI and Cash Basis NOI
We calculate NOI and Cash Basis NOI as shown on page 21. The calculations of NOI and Cash Basis NOI exclude certain components of net income in order to provide results that are more
closely related to our property level results of operations. We define NOI as income from our rental of real estate less property operating expenses. NOI excludes
amortization of capitalized tenant improvement costs and leasing commissions that we record as depreciation and amortization. We define Cash Basis NOI as NOI excluding non-cash straight line
rent adjustments, lease value amortization and non-cash amortization included in other operating expenses. We consider NOI and Cash Basis NOI to be appropriate supplemental measures to
net income because they may help both investors and management to understand the operations of our properties. We use NOI and Cash Basis NOI to evaluate individual and company wide
property level performance, and we believe that NOI and Cash Basis NOI provide useful information to investors regarding our results of operations because they reflect only those income and
expense items that are generated and incurred at the property level and may facilitate comparisons of our operating performance between periods and with other REITs. NOI and Cash Basis NOI
do not represent cash generated by operating activities in accordance with GAAP and should not be considered alternatives to net income or operating income as indicators of our operating
performance or as measures of our liquidity. These measures should be considered in conjunction with net income and operating income as presented in our Condensed Consolidated Statements
of Income. Other REITs and real estate companies may calculate NOI and Cash Basis NOI differently than we do.
Definition of EBITDA and Adjusted EBITDA
We calculate EBITDA and Adjusted EBITDA as shown on page 22. We consider EBITDA and Adjusted EBITDA to be appropriate supplemental measures of our operating performance, along with
net income and operating income. We believe that EBITDA and Adjusted EBITDA provide useful information to investors because by excluding the effects of certain historical amounts, such as
interest, depreciation and amortization expense, EBITDA and Adjusted EBITDA may facilitate a comparison of current operating performance with our past operating performance. EBITDA and
Adjusted EBITDA do not represent cash generated by operating activities in accordance with GAAP and should not be considered alternatives to net income or operating income as indicators of
operating performance or as measures of GOV’s liquidity. These measures should be considered in conjunction with net income and operating income as presented in our Condensed
Consolidated Statements of Income. Other REITs and real estate companies may calculate EBITDA and Adjusted EBITDA differently than we do.
Definition of FFO and Normalized FFO
We calculate FFO and Normalized FFO as shown on page 23. FFO is calculated on the basis defined by The National Association of Real Estate Investment Trusts, or NAREIT, which is net
income, calculated in accordance with GAAP, plus real estate depreciation and amortization and the difference between FFO attributable to an equity investment and equity in earnings of an
equity investee but excluding impairment charges on and increases in the carrying value of real estate assets, any gain or loss on sale of properties, as well as certain other adjustments currently
not applicable to us. Our calculation of Normalized FFO differs from NAREIT's definition of FFO because we include SIR's Normalized FFO attributable to our equity investment in SIR (net of FFO
attributable to our equity investment in SIR), we include business management incentive fees, if any, only in the fourth quarter versus the quarter when they are recognized as expense in
accordance with GAAP due to their quarterly volatility not necessarily being indicative of our core operating performance and the uncertainty as to whether any such business management
incentive fees will be payable when all contingencies for determining such fees are known at the end of the calendar year and we exclude acquisition related costs expensed under GAAP, gains
and losses on issuance of shares by SIR and gains and losses on early extinguishment of debt. We consider FFO and Normalized FFO to be appropriate supplemental measures of operating
performance for a REIT, along with net income and operating income. We believe that FFO and Normalized FFO provide useful information to investors because by excluding the effects of certain
historical amounts, such as depreciation expense, FFO and Normalized FFO may facilitate a comparison of our operating performance between periods and with other REITs. FFO and
Normalized FFO are among the factors considered by our Board of Trustees when determining the amount of distributions to our shareholders. Other factors include, but are not limited to,
requirements to maintain our qualification for taxation as a REIT, limitations in our credit agreement and public debt covenants, the availability to us of debt and equity capital, our expectation of
our future capital requirements and operating performance, our receipt of distributions from SIR and our expected needs and availability of cash to pay our obligations. FFO and Normalized FFO
do not represent cash generated by operating activities in accordance with GAAP and should not be considered alternatives to net income or operating income as indicators of our operating
performance or as measures of our liquidity. These measures should be considered in conjunction with net income and operating income as presented in our Condensed Consolidated Statements
of Income. Other REITs and real estate companies may calculate FFO and Normalized FFO differently than we do.

Government Properties Income Trust Investor Presentation
November 2017
Stevens Center, Richland, WA
Two Buildings, Square Feet: 140,152
Agency Occupant: U.S. Department of Energy
Energy Star Certified