Government of Karnataka - fpibangalore.gov.in · Government of Karnataka ... in the year 2003. FRBM...
52
i Government of Karnataka Report: IMPACT OF FISCAL RULES ON STATE FINANCES IN INDIA: A COMPARATIVE STUDY OF SOUTHERN STATES Center for Financial Accountability and Decentralization Fiscal Policy Institute Kengeri, Bengaluru-60 February, 2017
Transcript of Government of Karnataka - fpibangalore.gov.in · Government of Karnataka ... in the year 2003. FRBM...
i
Government of Karnataka
Report:
IMPACT OF FISCAL RULES ON STATE FINANCES IN INDIA: A COMPARATIVE
STUDY OF SOUTHERN STATES
Center for Financial Accountability and Decentralization
Fiscal Policy Institute
Kengeri, Bengaluru-60
February, 2017
ii

iii
TABLE OF CONTENTS
Abstract ii
Executive Summary iii
List of Chapters v
List of Tables vi
List of Illustrations vi
List of Appendices vi
List of Abbreviations vii
iv
Abstract:
Indian economy was under severe fiscal distress in the early and late 90s. Combined fiscal
deficit of Centre and State Governments has reached almost double digit in early 2000. In order
to overcome the fiscal distress, Government of India initiated rule based fiscal correction
mechanism and enacted Fiscal Responsibility & Budget Management Act in 2003. Following
the Central Government, many State Governments have enacted Fiscal Responsibility
Legislations (FRLs). This study examines and compares the FRLs across southern Indian States
namely Andhra Pradesh, Karnataka, Kerala and Tamil Nadu. FRLs have been amended by
State Governments several times in lieu of redefinition of fiscal deficit, implementation of 13th
Finance Commission recommendations and mostly in the name of stimulus package to
overcome the 2008 global financial crisis.
Trend analysis indicated that there is a clear improvement in fiscal health of all southern States.
However, how significant is this improvement forms an empirical question. This study using
structural break analysis finds that there is a significant change in fiscal indicators in the fiscal
reform period. Karnataka’s fiscal indicators have moved in the expected direction, i.e.
reduction in revenue expenditure and non-development expenditure and increase in
development expenditure. Contrary to the expectations, in Tamil Nadu and Kerala, deficits are
growing at a faster rate in reform period than earlier. Southern States except Karnataka, have
adhered to FRLs by cutting the capital outlay. This was clearly found in insignificant growth
of capital outlay in reform period as well as insignificant changes in non-development
expenditure. State Government should strictly follow laid down fiscal consolidation roadmap
by raising the tempo of capital outlay and minimizing the non-development expenditure.
Breaching fiscal consolidation path using unconventional amendments would result in
unsustainable deficits and debt.
v
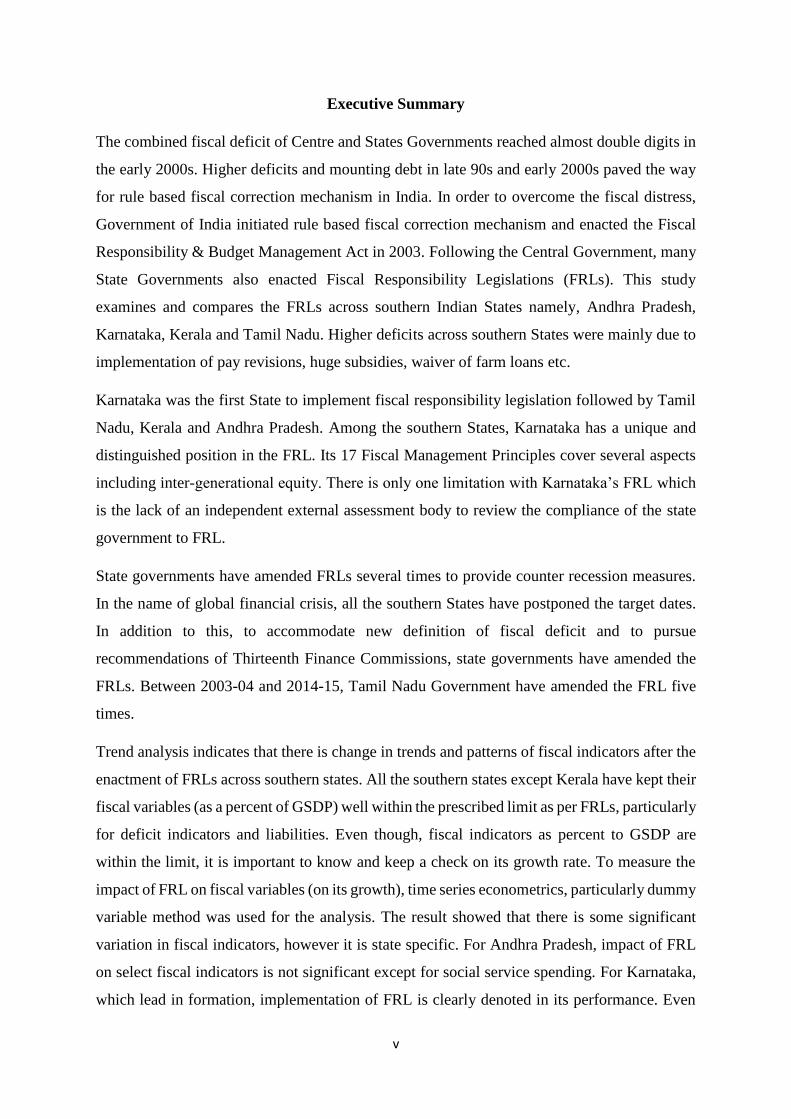
Executive Summary
The combined fiscal deficit of Centre and States Governments reached almost double digits in
the early 2000s. Higher deficits and mounting debt in late 90s and early 2000s paved the way
for rule based fiscal correction mechanism in India. In order to overcome the fiscal distress,
Government of India initiated rule based fiscal correction mechanism and enacted the Fiscal
Responsibility & Budget Management Act in 2003. Following the Central Government, many
State Governments also enacted Fiscal Responsibility Legislations (FRLs). This study
examines and compares the FRLs across southern Indian States namely, Andhra Pradesh,
Karnataka, Kerala and Tamil Nadu. Higher deficits across southern States were mainly due to
implementation of pay revisions, huge subsidies, waiver of farm loans etc.
Karnataka was the first State to implement fiscal responsibility legislation followed by Tamil
Nadu, Kerala and Andhra Pradesh. Among the southern States, Karnataka has a unique and
distinguished position in the FRL. Its 17 Fiscal Management Principles cover several aspects
including inter-generational equity. There is only one limitation with Karnataka’s FRL which
is the lack of an independent external assessment body to review the compliance of the state
government to FRL.
State governments have amended FRLs several times to provide counter recession measures.
In the name of global financial crisis, all the southern States have postponed the target dates.
In addition to this, to accommodate new definition of fiscal deficit and to pursue
recommendations of Thirteenth Finance Commissions, state governments have amended the
FRLs. Between 2003-04 and 2014-15, Tamil Nadu Government have amended the FRL five
times.
Trend analysis indicates that there is change in trends and patterns of fiscal indicators after the
enactment of FRLs across southern states. All the southern states except Kerala have kept their
fiscal variables (as a percent of GSDP) well within the prescribed limit as per FRLs, particularly
for deficit indicators and liabilities. Even though, fiscal indicators as percent to GSDP are
within the limit, it is important to know and keep a check on its growth rate. To measure the
impact of FRL on fiscal variables (on its growth), time series econometrics, particularly dummy
variable method was used for the analysis. The result showed that there is some significant
variation in fiscal indicators, however it is state specific. For Andhra Pradesh, impact of FRL
on select fiscal indicators is not significant except for social service spending. For Karnataka,
which lead in formation, implementation of FRL is clearly denoted in its performance. Even
vi
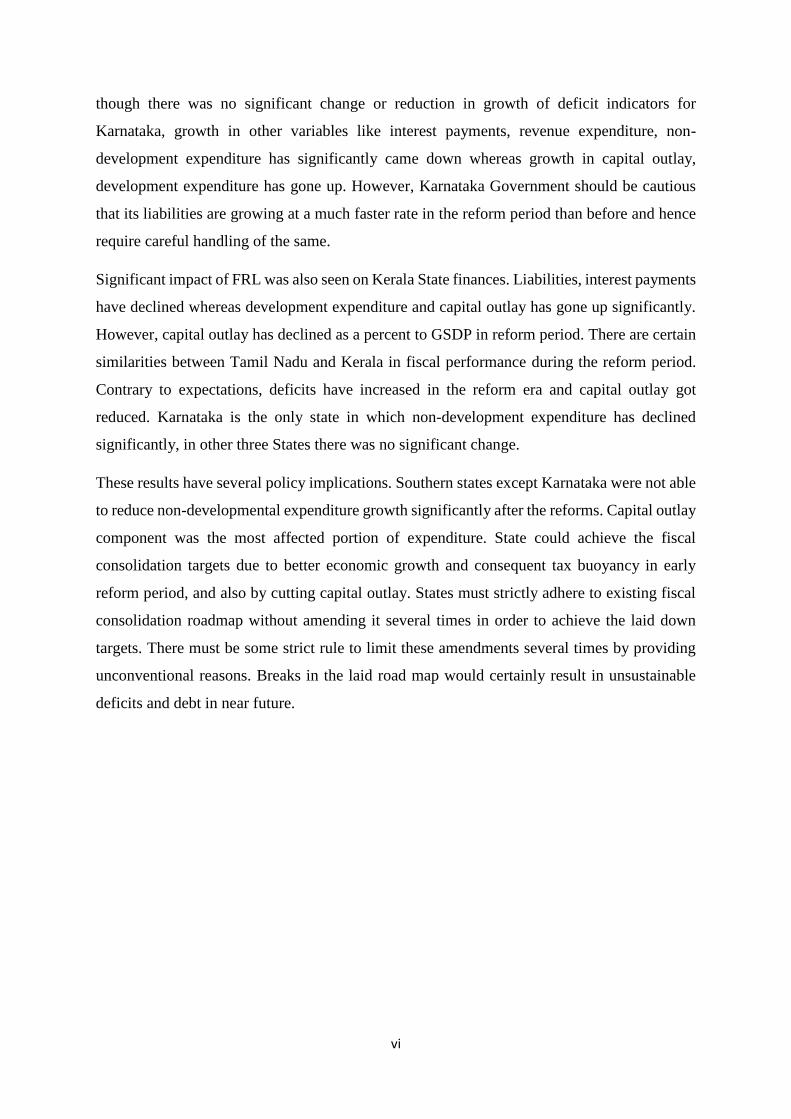
though there was no significant change or reduction in growth of deficit indicators for
Karnataka, growth in other variables like interest payments, revenue expenditure, non-
development expenditure has significantly came down whereas growth in capital outlay,
development expenditure has gone up. However, Karnataka Government should be cautious
that its liabilities are growing at a much faster rate in the reform period than before and hence
require careful handling of the same.
Significant impact of FRL was also seen on Kerala State finances. Liabilities, interest payments
have declined whereas development expenditure and capital outlay has gone up significantly.
However, capital outlay has declined as a percent to GSDP in reform period. There are certain
similarities between Tamil Nadu and Kerala in fiscal performance during the reform period.
Contrary to expectations, deficits have increased in the reform era and capital outlay got
reduced. Karnataka is the only state in which non-development expenditure has declined
significantly, in other three States there was no significant change.
These results have several policy implications. Southern states except Karnataka were not able
to reduce non-developmental expenditure growth significantly after the reforms. Capital outlay
component was the most affected portion of expenditure. State could achieve the fiscal
consolidation targets due to better economic growth and consequent tax buoyancy in early
reform period, and also by cutting capital outlay. States must strictly adhere to existing fiscal
consolidation roadmap without amending it several times in order to achieve the laid down
targets. There must be some strict rule to limit these amendments several times by providing
unconventional reasons. Breaks in the laid road map would certainly result in unsustainable
deficits and debt in near future.
vii
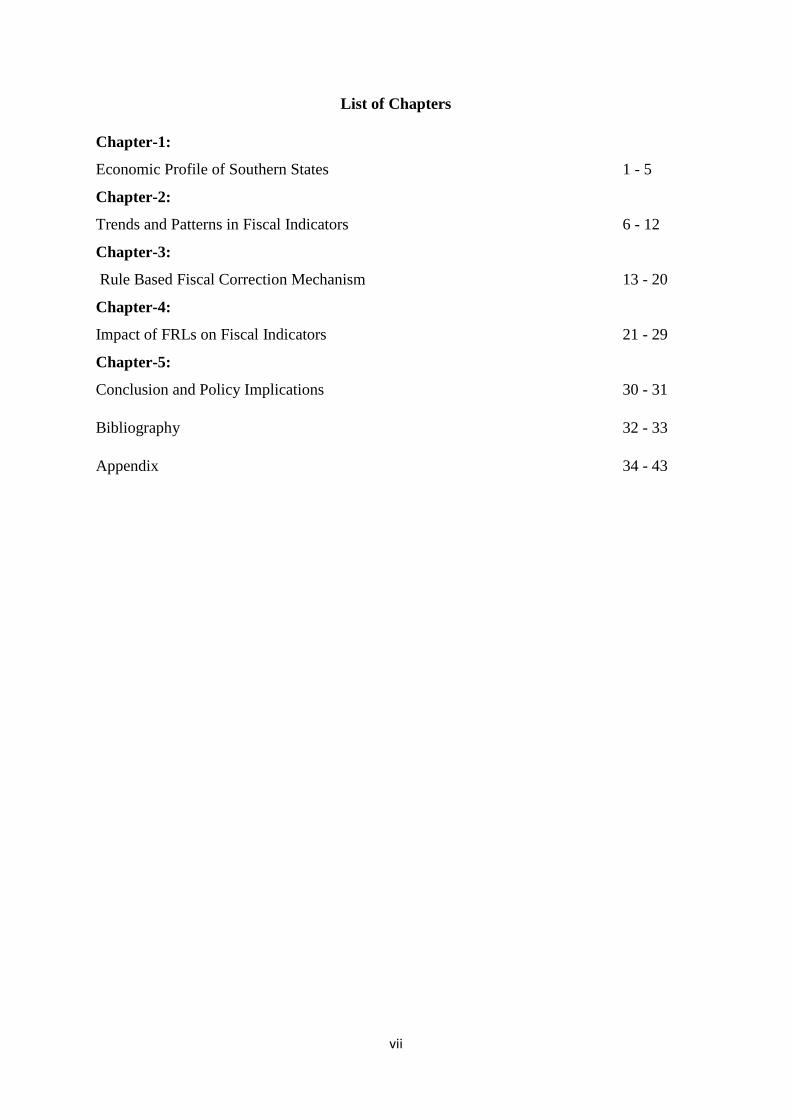
List of Chapters
Chapter-1:
Economic Profile of Southern States 1 - 5
Chapter-2:
Trends and Patterns in Fiscal Indicators 6 - 12
Chapter-3:
Rule Based Fiscal Correction Mechanism 13 - 20
Chapter-4:
Impact of FRLs on Fiscal Indicators 21 - 29
Chapter-5:
Conclusion and Policy Implications 30 - 31
Bibliography 32 - 33
Appendix 34 - 43
viii
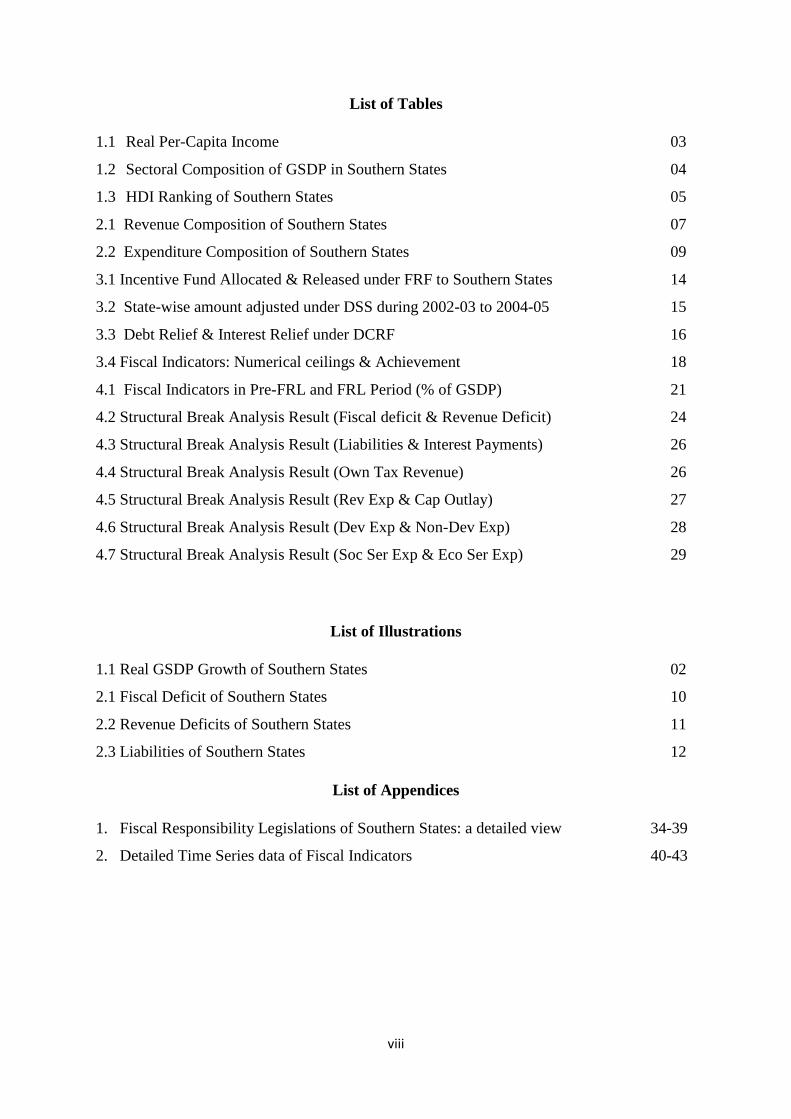
List of Tables
1.1 Real Per-Capita Income 03
1.2 Sectoral Composition of GSDP in Southern States 04
1.3 HDI Ranking of Southern States 05
2.1 Revenue Composition of Southern States 07
2.2 Expenditure Composition of Southern States 09
3.1 Incentive Fund Allocated & Released under FRF to Southern States 14
3.2 State-wise amount adjusted under DSS during 2002-03 to 2004-05 15
3.3 Debt Relief & Interest Relief under DCRF 16
3.4 Fiscal Indicators: Numerical ceilings & Achievement 18
4.1 Fiscal Indicators in Pre-FRL and FRL Period (% of GSDP) 21
4.2 Structural Break Analysis Result (Fiscal deficit & Revenue Deficit) 24
4.3 Structural Break Analysis Result (Liabilities & Interest Payments) 26
4.4 Structural Break Analysis Result (Own Tax Revenue) 26
4.5 Structural Break Analysis Result (Rev Exp & Cap Outlay) 27
4.6 Structural Break Analysis Result (Dev Exp & Non-Dev Exp) 28
4.7 Structural Break Analysis Result (Soc Ser Exp & Eco Ser Exp) 29
List of Illustrations
1.1 Real GSDP Growth of Southern States 02
2.1 Fiscal Deficit of Southern States 10
2.2 Revenue Deficits of Southern States 11
2.3 Liabilities of Southern States 12
List of Appendices
1. Fiscal Responsibility Legislations of Southern States: a detailed view 34-39
2. Detailed Time Series data of Fiscal Indicators 40-43
ix
List of Abbreviations
APFRBMA: Andhra Pradesh Fiscal Responsibility & Budget Management Act
BoP: Balance of Payments
FRA: Fiscal Responsibility Act
FRBM: Fiscal Responsibility and Budget Management
FRF: Fiscal Reforms Facility
FRL: Fiscal Responsibility Legislation
GDP: Gross Domestic Product
GSDP: Gross State Domestic Product
HDI: Human Development Index
HPEC: High-Powered Expert Committee
KCGGA: Karnataka Ceiling on Government Guarantee Act
KeFRA: Kerala Fiscal responsibility Act
KFRA: Karnataka Fiscal Responsibility Act
MTFP: Medium Term Fiscal Plan
MTFRP: Medium Term Fiscal Reforms Program
NIPFP: National Institute of Public Finance and Policy
PCI: Per Capita Income
TNFRA: Tamil Nadu Fiscal Responsibility Act
UNDP: United Nations Development Program
1
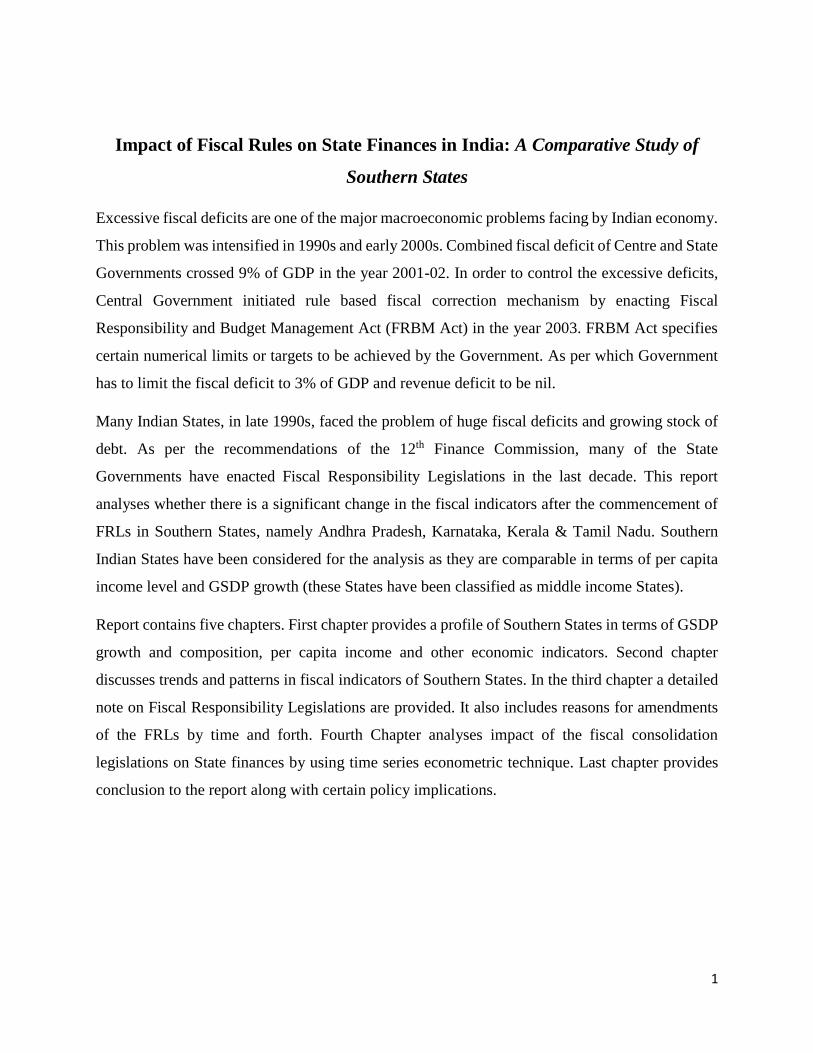
Impact of Fiscal Rules on State Finances in India: A Comparative Study of
Southern States
Excessive fiscal deficits are one of the major macroeconomic problems facing by Indian economy.
This problem was intensified in 1990s and early 2000s. Combined fiscal deficit of Centre and State
Governments crossed 9% of GDP in the year 2001-02. In order to control the excessive deficits,
Central Government initiated rule based fiscal correction mechanism by enacting Fiscal
Responsibility and Budget Management Act (FRBM Act) in the year 2003. FRBM Act specifies
certain numerical limits or targets to be achieved by the Government. As per which Government
has to limit the fiscal deficit to 3% of GDP and revenue deficit to be nil.
Many Indian States, in late 1990s, faced the problem of huge fiscal deficits and growing stock of
debt. As per the recommendations of the 12th Finance Commission, many of the State
Governments have enacted Fiscal Responsibility Legislations in the last decade. This report
analyses whether there is a significant change in the fiscal indicators after the commencement of
FRLs in Southern States, namely Andhra Pradesh, Karnataka, Kerala & Tamil Nadu. Southern
Indian States have been considered for the analysis as they are comparable in terms of per capita
income level and GSDP growth (these States have been classified as middle income States).
Report contains five chapters. First chapter provides a profile of Southern States in terms of GSDP
growth and composition, per capita income and other economic indicators. Second chapter
discusses trends and patterns in fiscal indicators of Southern States. In the third chapter a detailed
note on Fiscal Responsibility Legislations are provided. It also includes reasons for amendments
of the FRLs by time and forth. Fourth Chapter analyses impact of the fiscal consolidation
legislations on State finances by using time series econometric technique. Last chapter provides
conclusion to the report along with certain policy implications.

2
Chapter-1
Economic Profile of Southern States
Southern States have experienced modest growth on an average over the last two and half decade.
GSDP growth of Andhra Pradesh and Kerala between 1990-91 and 2014-15 were 6.4% and 6.7%
respectively, whereas for Karnataka and Tamil Nadu it was 7%. Figure-1.1 provides trends in real
GSDP growth of Southern States from 1990-91 to 2014-15.
Figure-1.1
Real GSDP Growth of Southern States (in %)
Data Source: RBI State Finances: A Study of Budget, Various Issues
The Indian economy faced severe crisis in terms of low growth, high inflation, worsening Balance
of Payments (BoP) situation etc in early 90s, where impact was reflected on State’s growth too. In
early 90s, GSDP growth of all the four States was just around 3%. With the introduction of major
structural reforms, India’s GDP and also States GSDP started moving upwards. Southern States
have achieved growth of 8% in the year 1993-94. However, in the corresponding years, there was
a decline in the GSDP growth owing to setback in agricultural production due to unfavorable
monsoons and widespread recessionary trend in industrial production in Karnataka (GoK, 1994).
The situation further worsened in late 1990s once again due to bad monsoons and consequent high
food inflation in Karnataka (GoK, 1999).
-4
-2
0
2
4
6
8
10
12
14
16
18
IN %
YEARAndhra Pradesh Karnataka Kerala Tamil Nadu
3
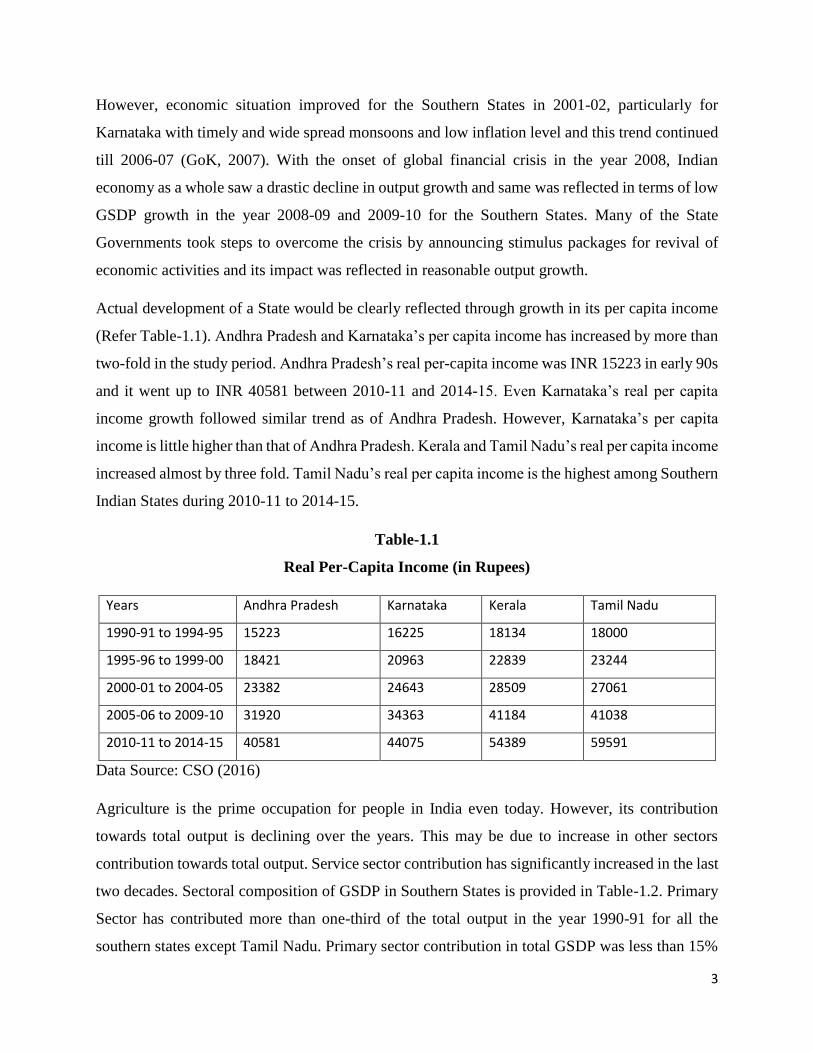
However, economic situation improved for the Southern States in 2001-02, particularly for
Karnataka with timely and wide spread monsoons and low inflation level and this trend continued
till 2006-07 (GoK, 2007). With the onset of global financial crisis in the year 2008, Indian
economy as a whole saw a drastic decline in output growth and same was reflected in terms of low
GSDP growth in the year 2008-09 and 2009-10 for the Southern States. Many of the State
Governments took steps to overcome the crisis by announcing stimulus packages for revival of
economic activities and its impact was reflected in reasonable output growth.
Actual development of a State would be clearly reflected through growth in its per capita income
(Refer Table-1.1). Andhra Pradesh and Karnataka’s per capita income has increased by more than
two-fold in the study period. Andhra Pradesh’s real per-capita income was INR 15223 in early 90s
and it went up to INR 40581 between 2010-11 and 2014-15. Even Karnataka’s real per capita
income growth followed similar trend as of Andhra Pradesh. However, Karnataka’s per capita
income is little higher than that of Andhra Pradesh. Kerala and Tamil Nadu’s real per capita income
increased almost by three fold. Tamil Nadu’s real per capita income is the highest among Southern
Indian States during 2010-11 to 2014-15.
Table-1.1
Real Per-Capita Income (in Rupees)
Years Andhra Pradesh Karnataka Kerala Tamil Nadu
1990-91 to 1994-95 15223 16225 18134 18000
1995-96 to 1999-00 18421 20963 22839 23244
2000-01 to 2004-05 23382 24643 28509 27061
2005-06 to 2009-10 31920 34363 41184 41038
2010-11 to 2014-15 40581 44075 54389 59591
Data Source: CSO (2016)
Agriculture is the prime occupation for people in India even today. However, its contribution
towards total output is declining over the years. This may be due to increase in other sectors
contribution towards total output. Service sector contribution has significantly increased in the last
two decades. Sectoral composition of GSDP in Southern States is provided in Table-1.2. Primary
Sector has contributed more than one-third of the total output in the year 1990-91 for all the
southern states except Tamil Nadu. Primary sector contribution in total GSDP was less than 15%
4
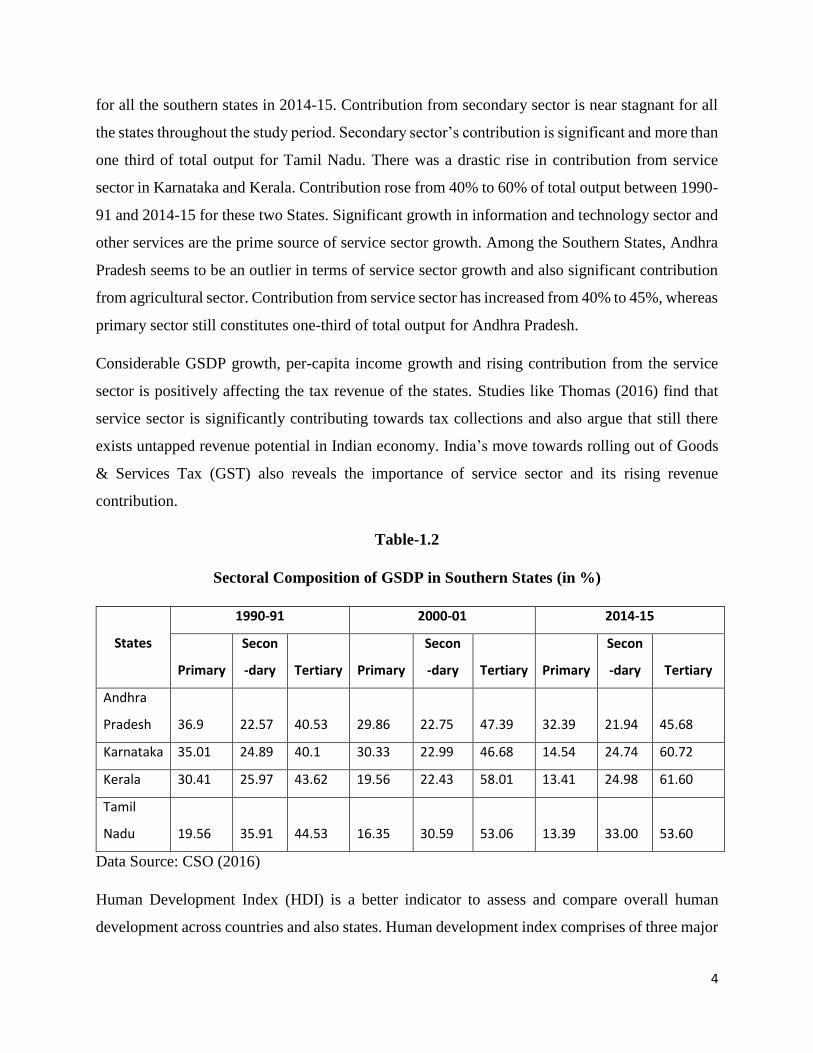
for all the southern states in 2014-15. Contribution from secondary sector is near stagnant for all
the states throughout the study period. Secondary sector’s contribution is significant and more than
one third of total output for Tamil Nadu. There was a drastic rise in contribution from service
sector in Karnataka and Kerala. Contribution rose from 40% to 60% of total output between 1990-
91 and 2014-15 for these two States. Significant growth in information and technology sector and
other services are the prime source of service sector growth. Among the Southern States, Andhra
Pradesh seems to be an outlier in terms of service sector growth and also significant contribution
from agricultural sector. Contribution from service sector has increased from 40% to 45%, whereas
primary sector still constitutes one-third of total output for Andhra Pradesh.
Considerable GSDP growth, per-capita income growth and rising contribution from the service
sector is positively affecting the tax revenue of the states. Studies like Thomas (2016) find that
service sector is significantly contributing towards tax collections and also argue that still there
exists untapped revenue potential in Indian economy. India’s move towards rolling out of Goods
& Services Tax (GST) also reveals the importance of service sector and its rising revenue
contribution.
Table-1.2
Sectoral Composition of GSDP in Southern States (in %)
States
1990-91 2000-01 2014-15
Primary
Secon
-dary Tertiary Primary
Secon
-dary Tertiary Primary
Secon
-dary Tertiary
Andhra
Pradesh 36.9 22.57 40.53 29.86 22.75 47.39 32.39 21.94 45.68
Karnataka 35.01 24.89 40.1 30.33 22.99 46.68 14.54 24.74 60.72
Kerala 30.41 25.97 43.62 19.56 22.43 58.01 13.41 24.98 61.60
Tamil
Nadu 19.56 35.91 44.53 16.35 30.59 53.06 13.39 33.00 53.60
Data Source: CSO (2016)
Human Development Index (HDI) is a better indicator to assess and compare overall human
development across countries and also states. Human development index comprises of three major
5
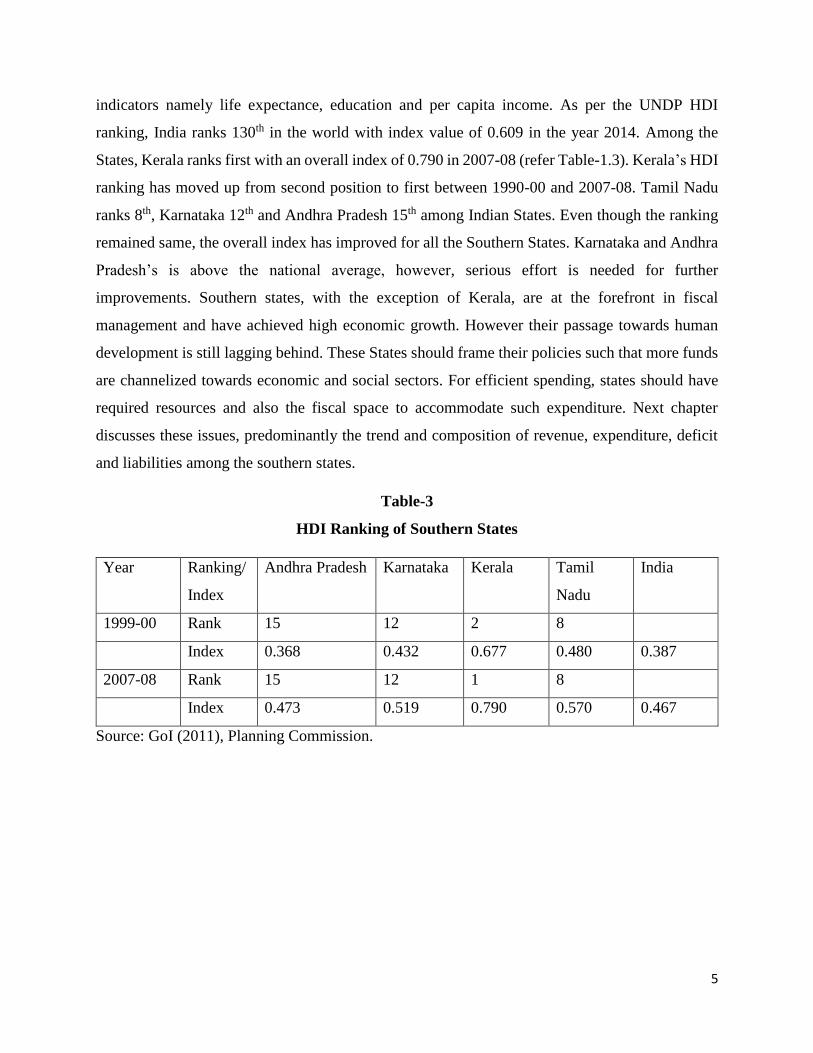
indicators namely life expectance, education and per capita income. As per the UNDP HDI
ranking, India ranks 130th in the world with index value of 0.609 in the year 2014. Among the
States, Kerala ranks first with an overall index of 0.790 in 2007-08 (refer Table-1.3). Kerala’s HDI
ranking has moved up from second position to first between 1990-00 and 2007-08. Tamil Nadu
ranks 8th, Karnataka 12th and Andhra Pradesh 15th among Indian States. Even though the ranking
remained same, the overall index has improved for all the Southern States. Karnataka and Andhra
Pradesh’s is above the national average, however, serious effort is needed for further
improvements. Southern states, with the exception of Kerala, are at the forefront in fiscal
management and have achieved high economic growth. However their passage towards human
development is still lagging behind. These States should frame their policies such that more funds
are channelized towards economic and social sectors. For efficient spending, states should have
required resources and also the fiscal space to accommodate such expenditure. Next chapter
discusses these issues, predominantly the trend and composition of revenue, expenditure, deficit
and liabilities among the southern states.
Table-3
HDI Ranking of Southern States
Year Ranking/
Index
Andhra Pradesh Karnataka Kerala Tamil
Nadu
India
1999-00 Rank 15 12 2 8
Index 0.368 0.432 0.677 0.480 0.387
2007-08 Rank 15 12 1 8
Index 0.473 0.519 0.790 0.570 0.467
Source: GoI (2011), Planning Commission.
6
Chapter-2
Trends and Patterns in Fiscal Indicators
Fiscal stance of southern states have been analyzed under three heads namely, revenue,
expenditure and deficits. The study period is from 1990-91 to 2014-15 for Karnataka, Kerala and
Tamil Nadu. For Andhra Pradesh, the study period is from 1990-91 to 2013-14. This is mainly due
to bifurcation of Andhra Pradesh into Andhra Pradesh and Telangana in the year 2014 and
consequent changes in fiscal indicators.
Revenue:
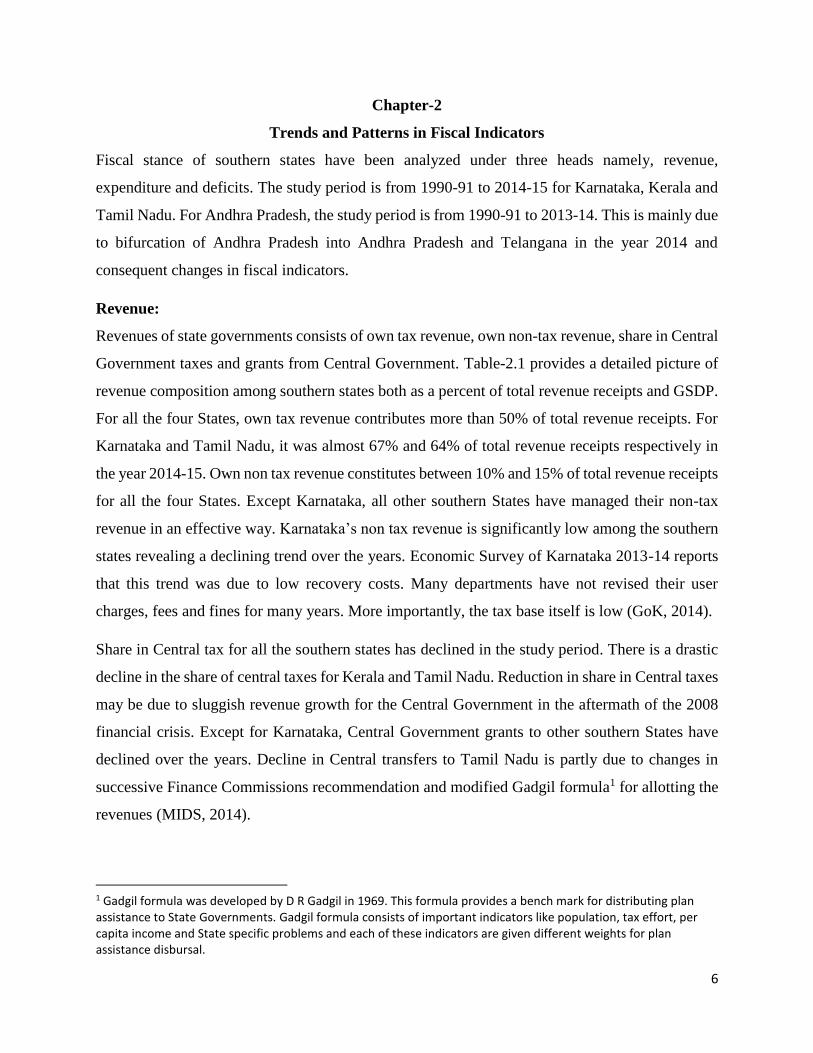
Revenues of state governments consists of own tax revenue, own non-tax revenue, share in Central
Government taxes and grants from Central Government. Table-2.1 provides a detailed picture of
revenue composition among southern states both as a percent of total revenue receipts and GSDP.
For all the four States, own tax revenue contributes more than 50% of total revenue receipts. For
Karnataka and Tamil Nadu, it was almost 67% and 64% of total revenue receipts respectively in
the year 2014-15. Own non tax revenue constitutes between 10% and 15% of total revenue receipts
for all the four States. Except Karnataka, all other southern States have managed their non-tax
revenue in an effective way. Karnataka’s non tax revenue is significantly low among the southern
states revealing a declining trend over the years. Economic Survey of Karnataka 2013-14 reports
that this trend was due to low recovery costs. Many departments have not revised their user
charges, fees and fines for many years. More importantly, the tax base itself is low (GoK, 2014).
Share in Central tax for all the southern states has declined in the study period. There is a drastic
decline in the share of central taxes for Kerala and Tamil Nadu. Reduction in share in Central taxes
may be due to sluggish revenue growth for the Central Government in the aftermath of the 2008
financial crisis. Except for Karnataka, Central Government grants to other southern States have
declined over the years. Decline in Central transfers to Tamil Nadu is partly due to changes in
successive Finance Commissions recommendation and modified Gadgil formula1 for allotting the
revenues (MIDS, 2014).
1 Gadgil formula was developed by D R Gadgil in 1969. This formula provides a bench mark for distributing plan assistance to State Governments. Gadgil formula consists of important indicators like population, tax effort, per capita income and State specific problems and each of these indicators are given different weights for plan assistance disbursal.
7
Table- 2.1
Revenue Composition of Southern States
States/
Indicators
Andhra Pradesh Karnataka Kerala Tamil Nadu
1990-
91
2000-
01
2013-
14
2014-
15*
1990-
91
2000-
01
2014-
15
1990-
91
2000-
01
2014-
15
1990-
91
2000-
01
2014-
15
as % of Total Revenue Receipts
Own Tax
Rev 49.51 54.18 57.92 50.7 59.92 61.01
67.39 55.78 67.24 60.80 61.40 67.06 64.25
Own
Non-Tax
Rev 14.52 14.08 13.97 12.3 13.29 11.20 4.50 8.69 7.55 12.56 7.50 9.34 6.82
Share in
Central
Tax 21.45 20.43 19.99 16.6 16.96 17.37 14.07 20.23 18.17 13.67 19.71 15.20 13.74
Grants
from
Central
Govt 14.51 11.30 8.12 20.4 9.84 10.43 14.03 15.31 7.06 12.95 11.38 8.41 15.18
as % of GSDP
Own Tax
Rev 7.65 7.29 6.90 7.56 10.01 8.34 7.62 9.51 8.08 6.69 9.97 8.37 7.20
Own
Non-Tax
Rev 2.24 1.90 1.66 1.83 2.22 1.53 0.51 1.48 0.91 1.38 1.22 1.17 0.76
Share in
Central
Tax 3.31 2.75 2.38 2.47 2.83 2.38 1.59 3.45 2.18 1.50 3.20 1.90 1.54
Grants
from
Central
Govt 2.24 1.52 0.96 3.03 1.64 1.43 1.58 2.61 0.85 1.42 1.85 1.05 1.70
Revenue
Receipts 15.44 13.46 11.92 14.9 16.70 13.68 11.31 17.05 12.02 11.00 16.23 12.48 11.20
Source: RBI State Finances, Various Issues. GoK (2017a), GoKE (2017) & GoTN (2017)
*data for 2014-15 is summation of Andhra Pradesh & Telangana fiscal variables

8
Karnataka stands first in own tax revenue collection with 7.62% of GSDP in the year 2014-15. It
also assumes first place in overall revenue receipts amounting 11.31% of GSDP in 2014-152. Tax-
GSDP ratio is the best indicator of tax efforts of any Government. This achievement is mainly due
to better tax efforts3 of Karnataka Government when compared to other States. A study on State
Finances of Karnataka (ISEC, 2014) reveals that Karnataka stands first among 14 major Indian
States in the tax efforts pertaining to excise duty, motor vehicle tax and occupies second place in
sales tax collection for the year 2010-11. Increase in central grants to states in 2014-15 was mainly
due to increase in central assistance to state plans following a move to restructure ‘Centrally
Sponsored Schemes’ and reduce their number from 126 to 66. Because of this restructuring, grants
flow from center to states has increased in the year 2014-15 (Mukherjee, 2014).
Expenditure:
Government Expenditure in practice is being classified under three different heads, namely
1. Revenue expenditure and capital expenditure
2. Plan Expenditure and Non-plan Expenditure
3. Development Expenditure and Non-Development expenditure
An expert committee on Efficient Management of Public Expenditure, constituted by Planning
Commission, India, has recommended to follow revenue expenditure and capital expenditure
classification and do away with plan and non-plan classification (GoI, 2011a). Expert committee
observed that over a period of time several issues have cropped up with regard to distinction
between plan and non-plan expenditure and are becoming an obstacle in outcome based budgeting
and hence, this classification has to be removed.
Following on going practice with regard to expenditure classifications, present study concentrates
on revenue and capital expenditure and also on development and non-development expenditure
classifications. In the capital expenditure, capital outlay component is considered as it implies
actual capital formation in the economy. Spending on interest payments was also tracked as it is
one of the major items of government committed expenditures.
2 Andhra Pradesh own-tax revenue-GSDP ratio was 11.9% in 2013-14. 3 Tax effort is the ratio of actual tax revenue of a Government to its taxable capacity.

9
Table-2.2 provides expenditure composition of southern states under two broad heads, namely
revenue expenditure & capital outlay and development & non-development expenditure. Revenue
expenditure as a percent of GSDP has declined for all the southern states (refer Table-2.2). This
reduction is highest for Kerala and Tamil Nadu with almost 5% to 6% of GSDP. This may be due
to strict fiscal consolidation roadmap. Capital outlay has increased marginally for all the southern
states except Kerala where it actually declined for the year 2014-15 when compared to early 2000s.
However, Karnataka has the highest capital outlay to GSDP ratio when compared to other southern
states. This implies that Karnataka has followed a better fiscal consolidation roadmap without
cutting down the capital outlay component of the expenditure. The development and non-
development expenditure has declined for all the southern states. The decline in development
expenditure is highest for Kerala. Interest payments, which is one of the major component in total
expenditure has declined significantly. This scenario is mostly due to fiscal correction mechanisms
adopted by the state governments, where they cap debt and deficits.
Table-2.2
Expenditure Composition of Southern States (as % of GSDP)
States/
Indicators
Andhra Pradesh Karnataka Kerala Tamil Nadu
1990-
91
2000-
01
2013-
14
2014-
15*
1990-
91
2000-
01
2014-
15
1990-
91
2000-
01
2014-
15
1990-
91
2000-
01
2014-
15
Rev Exp 15.9 15.9 11.9 17.4 17.0 15.4 11.3 20.0 16.4 13.6 18.0 14.8 11.8
Cap
Outlay 1.33 1.88 1.64 2.08 2.81 1.80 2.13 1.82 0.79 0.80 0.71 1.05 1.63
Dev Exp 12.7 11.8 9.85 15.1 14.3 11.5 9.66 14.6 9.50 8.24 13.7 9.41 9.90
Non-Dev
Exp 4.37 5.90 4.05 4.6 5.04 5.20 4.05 7.02 7.51 6.32 4.64 5.69 3.91
Interest
payments 1.70 2.62 1.39 1.6 1.87 2.20 1.02 2.42 3.11 1.85 1.45 2.13 1.43
Source: RBI State Finances, Various Issues. GoK (2017a), GoKE (2017) & GoTN (2017)
*data for 2014-15 is summation of Andhra Pradesh & Telangana fiscal variables

10
Deficits and Liabilities:
Developing nations need to spend more to achieve higher rate of economic growth. However, they
have hard budget constraints to finance the required amount. Excess spending over the revenues
leads to deficit and higher deficit results in accumulation of debt. Fiscal deficit is one of the major
macroeconomic issues facing by many States and also the Central Government in India. Fiscal
deficit is the difference between total expenditure (both revenue expenditure and capital
expenditure) and revenue receipts and non-debt capital receipts.
Fiscal deficit level for southern states, particularly for Kerala in early 90s was under alarming
situation (refer Figure-2.1). After the 1991 economic reforms, there was a reduction in fiscal
deficits for these states. However, in late 90s and early 2000s, it increased drastically. Once again
for Kerala fiscal deficit stood at 7.25% of GSDP in 1999-00. Deficit indicators started deteriorating
for Karnataka in 1997-98 and this trend continued for next three years. This trend was due to
constant own tax revenue and marginal decline in non-tax revenues as well as Central Government
transfers (Rao & Chakraborty, 2006). Stagnant revenue efforts in Karnataka, in late 90s was due
to insufficient tax efforts and erosion of tax base due to granting of tax exemptions to industries
(GoK, 2005). While the resource saw stagnation, expenditure saw a steep increase. The extension
of certain recommendations of 5th Pay Commission to Karnataka State Government employees
caused severe strain on available resources. The increase in expenditure especially on salaries,
pensions and interest payments imposed serious pressure on State Finances (GoK, 2005).
Figure-2.1
Fiscal Deficit of Southern States (% of GSDP)
Source: RBI State Finances, Various Issues. GoK (2017a), GoKE (2017) & GoTN (2017)
0
1
2
3
4
5
6
7
8
% O
F G
SDP
YEARAP Karnataka Kerala Tamil Nadu

11
For Andhra Pradesh, during 1999-00 salary expenditure grew by more than 28% mainly on account
of implementation of pay revisions (GoAP, 2000). Between 1995-96 and 1998-99 it grew at an
average of 12%. In order to overcome the fiscal distress, state governments have enacted fiscal
responsibility laws to cap the excessive spending and keep deficits under control. With the fiscal
reforms and also better economic growth rate, deficits have declined considerably until 2008. With
the onset of global financial crisis in 2008, fiscal deficit started rising again. Similar trend can be
witnessed in revenue deficits among southern states (refer Figure-2.2). Revenue deficit was highest
for all states in late 90s and early 2000 mainly owing to implementation of pay revisions. Kerala
appears to be an outlier among the southern states in managing the revenue balance. Kerala’s
revenue deficit level is highest among the southern states. Finance minister, Government of Kerala,
in the 2016-17 Budget Speech mentions that higher revenue deficit is due to inordinate rise in
expenditure for paying arrears of pay revision. There was a sharp decline in state tax receipts. He
further added that “mismanagement and corruption in tax administration are the main reasons
behind the collapse of tax receipts. In addition to this, anarchy in expenditure has also contributed
to present crisis. Decisions were taken in an adhoc manner, often without consulting Finance
Department, outside the scope of what was specified in the budget” (GoKE, 2016).
Figure-2.2
Revenue Deficits of Southern States (% of GSDP)
Source: RBI State Finances, Various Issues. GoK (2017a), GoKE (2017) & GoTN (2017)
There is a clear trend in liabilities of all the southern states. Kerala has the highest liabilities (as %
of GSDP) when compared to other southern states. Hump shaped pattern can be witnessed in the
trend, with peak in early 2000s. There was a significant decline in the liabilities after 2003-04 with
-3
-2
-1
0
1
2
3
4
5
6
7
% O
F G
SDP
YEARAP Karnataka Kerala Tamil Nadu

12
the implementation of state specific fiscal reforms. Among the southern states, Kerala is
categorized as a fiscally stressed state by the Central Government. As per the new norms, states
which have debt-GSDP ratio of 27% and more are classified as fiscally stressed ones. Earlier, the
threshold was 35% of GSDP or more (GoKE, 2016).
Figure-2.3
Liabilities of Southern States (% of GSDP)
Source: RBI State Finances, Various Issues. GoK (2017a), GoKE (2017) & GoTN (2017)
The trends and patterns clearly imply that there is a positive trend in maintaining fiscal balances
after 2003-04. This would probably be because of rule based fiscal correction mechanism followed
by the Indian states. Next chapter briefly discusses and compares the rule based fiscal correction
mechanisms followed by the southern states and adherence to it.
0
5
10
15
20
25
30
35
40
45
% O
F G
SDP
YEARAP Karnataka Kerala Tamil Nadu
13
Chapter-3
Rule Based Fiscal Correction Mechanism
A ‘Fiscal Rule’ imposes a long lasting constraint on fiscal policy through numerical limits on
budgetary aggregates. Fiscal rules typically aim at correcting distorted incentives and containing
pressures to overspend, particularly in good times, so as to ensure fiscal responsibility and debt
sustainability (Schaechter et al, 2012). As per Organization for Economic Cooperation and
Development (OECD), fiscal consolidation is a policy aimed at reducing government deficits and
debt accumulation.
Excessive deficit spending by the Government would adversely impact the macro economy.
Higher fiscal deficits lead to inflation, higher interest rate and adversely affect the economic
growth and external sector balance. Several studies like Khundrakpam & Pattnaik (2010) have
found that fiscal deficit creates inflationary situation. Few other studies like Ramu, M R & Gayithri
(2016) and Ramu, M R (2016) have found that fiscal deficit adversely affects economic growth
and external sector variables in India. Fiscal deficit level for both Central and State Governments
has peaked in early 2000s. The reasons are increased military spending, subsidies etc for the
Central Government. There are several factors which are responsible for the emergence of
unsustainable fiscal imbalance in the States. Anand, Bagchi & Sen (2002) argue that on the demand
side, fiscal problems of both the Centre and States would appear to have been the product of
‘Populism’ and deficit bias of unstable Government in democracy. On the supply side, budget
problem of the states seem to reflect a softening of hard budget constraint implicit in the
Constitution restrictions on their borrowing and in adequate oversight on the part of Centre. In
order to control the deficit and debt, Government of India constitutionally enacted Fiscal
Responsibility and Budget Management Act in the year 2003. Several States followed the path of
Central Government and enacted State specific fiscal responsibility legislations. Karnataka
Government was the first to enact the Fiscal responsibility legislation in the year 2002, even before
the Central Government.
There are few schemes which incentivized and also obliged the state governments to enact fiscal
responsibility legislations. They are:
1. Fiscal Reforms Facility (2000-01 to 2004-05)

14
Pursuant to the recommendations of the Eleventh Finance Commission, Government of India
created a Fiscal Reforms Facility (FRF) for incentivizing the states to undertake Medium Term
Fiscal Reforms Program (MTFRP) for fiscal consolidation. The state governments were asked to
draw up MTFRP incorporating time-bound action points on fiscal objectives and reforms, power
sector reforms, public sector restructuring and budgetary reforms. FRF envisaged that if the state
on an average achieves a five percentage point reduction in revenue deficit as percentage of
revenue receipts consistently each year, by the year 2005-06 the sector as whole would come into
revenue balance. An incentive fund was created and release of it was based on the single
monitorable fiscal objective as mentioned above. Karnataka has availed maximum of allocated
fund under FRF (refer Table-3.1). Tamil Nadu has received the highest amount followed by
Andhra Pradesh.
Table-3.1
Incentive Fund Allocated & Released under FRF to Southern States
(in INR crore)
States Incentive Fund Allocated Released
Andhra Pradesh 427.84 221.61
Karnataka 286.15 217.23
Kerala 208.48 64.44
Tamil Nadu 402.36 305.44
Source: MoF (2017)
2. Debt Swap Scheme:
Government of India formulated a Debt Swap Scheme (DSS) realizing the mounting burden of
interest payments on the states and supplement their effort towards fiscal management. The
scheme was in operation from 2002-03 to 2004-05. The scheme capitalized on the current low
interest regime, to enable states to prepay expensive loans contracted from Government of India,
with low coupon bearing small savings and open market loans. This scheme covered outstanding
high cost loans with interest rate of 13% and above. An amount of INR 106076 crore was prepaid
to Government of India by the States from small saving loans and open market borrowings. Total
debt swapped under DSS for Karnataka during 2002-03 to 2004-05 was INR 56.42 billion (refer
15
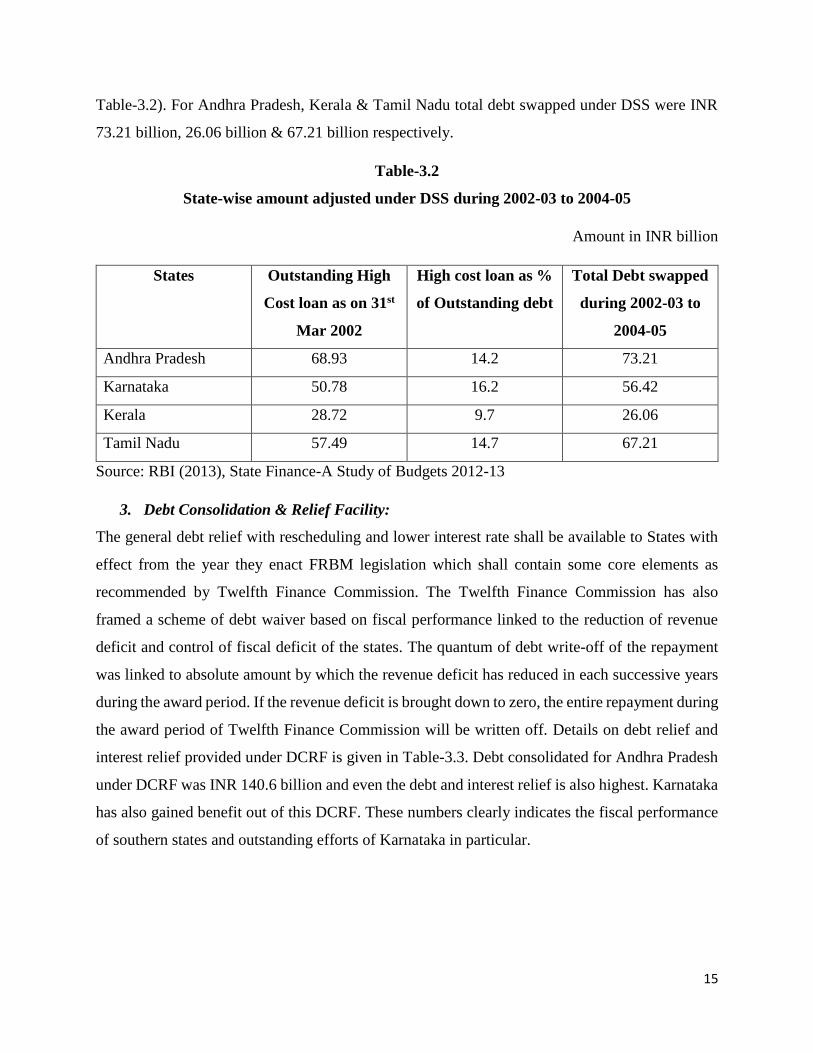
Table-3.2). For Andhra Pradesh, Kerala & Tamil Nadu total debt swapped under DSS were INR
73.21 billion, 26.06 billion & 67.21 billion respectively.
Table-3.2
State-wise amount adjusted under DSS during 2002-03 to 2004-05
Amount in INR billion
States Outstanding High
Cost loan as on 31st
Mar 2002
High cost loan as %
of Outstanding debt
Total Debt swapped
during 2002-03 to
2004-05
Andhra Pradesh 68.93 14.2 73.21
Karnataka 50.78 16.2 56.42
Kerala 28.72 9.7 26.06
Tamil Nadu 57.49 14.7 67.21
Source: RBI (2013), State Finance-A Study of Budgets 2012-13
3. Debt Consolidation & Relief Facility:
The general debt relief with rescheduling and lower interest rate shall be available to States with
effect from the year they enact FRBM legislation which shall contain some core elements as
recommended by Twelfth Finance Commission. The Twelfth Finance Commission has also
framed a scheme of debt waiver based on fiscal performance linked to the reduction of revenue
deficit and control of fiscal deficit of the states. The quantum of debt write-off of the repayment
was linked to absolute amount by which the revenue deficit has reduced in each successive years
during the award period. If the revenue deficit is brought down to zero, the entire repayment during
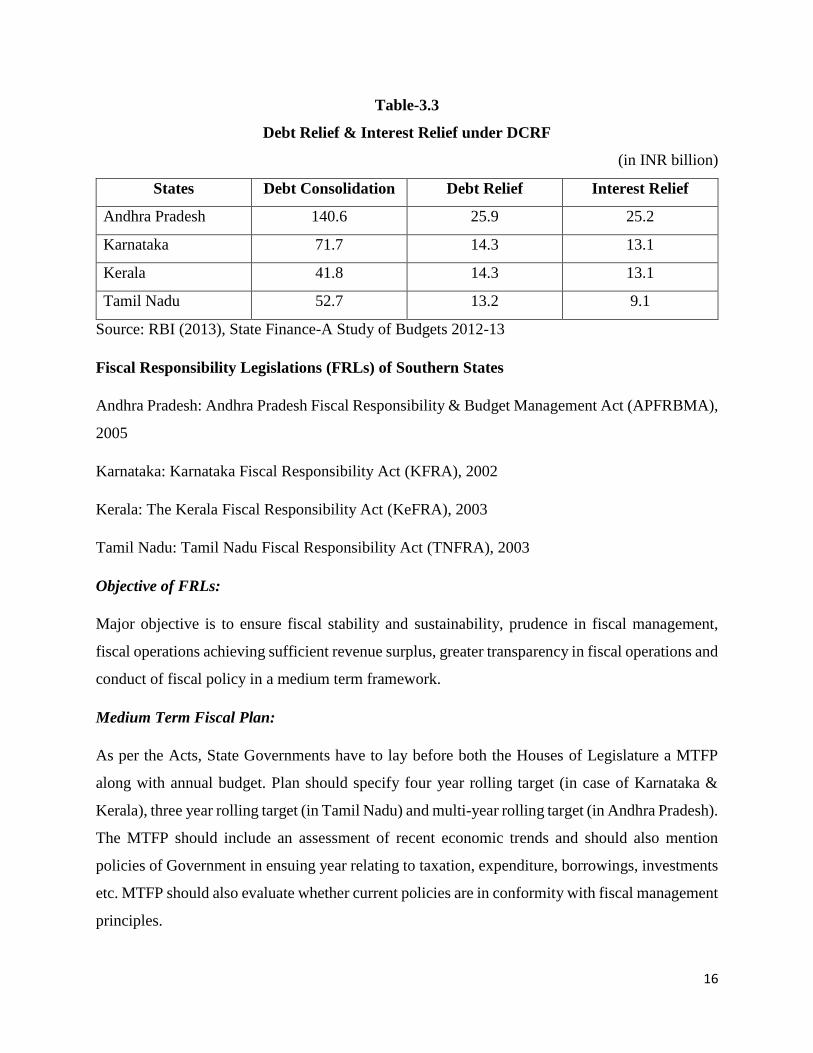
the award period of Twelfth Finance Commission will be written off. Details on debt relief and
interest relief provided under DCRF is given in Table-3.3. Debt consolidated for Andhra Pradesh
under DCRF was INR 140.6 billion and even the debt and interest relief is also highest. Karnataka
has also gained benefit out of this DCRF. These numbers clearly indicates the fiscal performance
of southern states and outstanding efforts of Karnataka in particular.
16
Table-3.3
Debt Relief & Interest Relief under DCRF
(in INR billion)
States Debt Consolidation Debt Relief Interest Relief
Andhra Pradesh 140.6 25.9 25.2
Karnataka 71.7 14.3 13.1
Kerala 41.8 14.3 13.1
Tamil Nadu 52.7 13.2 9.1
Source: RBI (2013), State Finance-A Study of Budgets 2012-13
Fiscal Responsibility Legislations (FRLs) of Southern States
Andhra Pradesh: Andhra Pradesh Fiscal Responsibility & Budget Management Act (APFRBMA),
2005
Karnataka: Karnataka Fiscal Responsibility Act (KFRA), 2002
Kerala: The Kerala Fiscal Responsibility Act (KeFRA), 2003
Tamil Nadu: Tamil Nadu Fiscal Responsibility Act (TNFRA), 2003
Objective of FRLs:
Major objective is to ensure fiscal stability and sustainability, prudence in fiscal management,
fiscal operations achieving sufficient revenue surplus, greater transparency in fiscal operations and
conduct of fiscal policy in a medium term framework.
Medium Term Fiscal Plan:
As per the Acts, State Governments have to lay before both the Houses of Legislature a MTFP
along with annual budget. Plan should specify four year rolling target (in case of Karnataka &
Kerala), three year rolling target (in Tamil Nadu) and multi-year rolling target (in Andhra Pradesh).
The MTFP should include an assessment of recent economic trends and should also mention
policies of Government in ensuing year relating to taxation, expenditure, borrowings, investments
etc. MTFP should also evaluate whether current policies are in conformity with fiscal management
principles.

17
Fiscal Management Principles:
Karnataka’s FRL is unique when it comes to fiscal management principle. Karnataka Fiscal
Responsibility Act specifies 17 principles which include maintaining debt at prudent level,
managing guarantees and liabilities prudently, borrowings to be used for capital formation,
maintaining integrity of tax system, and pursuing expenditure policies that would provide impetus
to economic growth, poverty reduction & improvement in human welfare. It also includes aspects
of inter-generational equity, publicizing the information etc. Fiscal responsibility principles of
other states basically prescribe the fiscal targets to be achieved. Tamil Nadu FRL has few similar
Principles as exhibited in Karnataka’s FRL. Detailed review of FRLs of southern states is provided
in Appendix-1.
Fiscal Indicators: Central FRA and also State FRAs defines Fiscal Indicators as the measures
such as numerical ceilings and proportion to GSDP (GDP for Central Government), as may be
prescribed for evaluation of fiscal position of state governments.
FRLs specifies limits on fiscal deficit, revenue deficit, liabilities, guarantees provided by the
Governments.
Definitions:
Fiscal deficit: Total disbursement from the Consolidated Fund of the state (excluding repayment
of debt) over total receipts into the fund excluding the debt receipts during a financial year.
Revenue deficit: Difference between revenue receipts and revenue expenditure
Liabilities: It means the liabilities under the Consolidate Fund of the state and Public Account of
the state.
Guarantees: (a) Government Guarantee: as per Karnataka Ceiling on Government Guarantee Act,
1999 (KCGGA, 1999), Government Guarantee implies the guarantee given by State Government
on behalf of Departmental Undertakings, Public Sector Undertakings, Local Authorities, Statutory
Boards & Corporations & Co-operative Institutions (GoK, 2017). (b). Performance Guarantee
includes the letters of comfort, power purchase agreement, state support agreement, concession
agreement for infrastructure project and other agreements guaranteed in certain performance on
18
behalf of Government, Local authorities, Statutory Boards & Corporations & Co-operative
Institutions as well as public sector undertakings.
Table-3.4
Fiscal Indicators: Numerical ceilings & Achievement
FRLs
Numerical Ceiling
(as per Initial Act)
Target Year Achievement (as on
target year)
FD RD Liabilities FD RD Liabiliti
es
APFRBMA,
2005
3% Nil 35% of
GSDP
March end 2009
(for RD), March
end 2010 (for FD
& Liabilities)
2.94% -0.23
%
25.9%
KFRA,2002
3% of
GSDP
Nil 25% of
GSDP
March end 2006
(for FD & RD).
March end 2015
(for liabilities)
1.88% -1.18
%
22.5%
As per
2014-
15RE)
KeFRA,
2003
2% of
estimated
GSDP
Nil Not
specified
March end 2007
(for FD & RD)
2.48% 1.71
%
-
TNFRA,
2003
2.5% of
estimated
GSDP
Below
5% of
Rev
receipt
Not
specified
March end 2007
(for FD & RD)
1.27% 6.47
% of
rev
rec
-
Data Source: RBI State Finances: A Study of Budgets, Various issues & State specific FRLs.
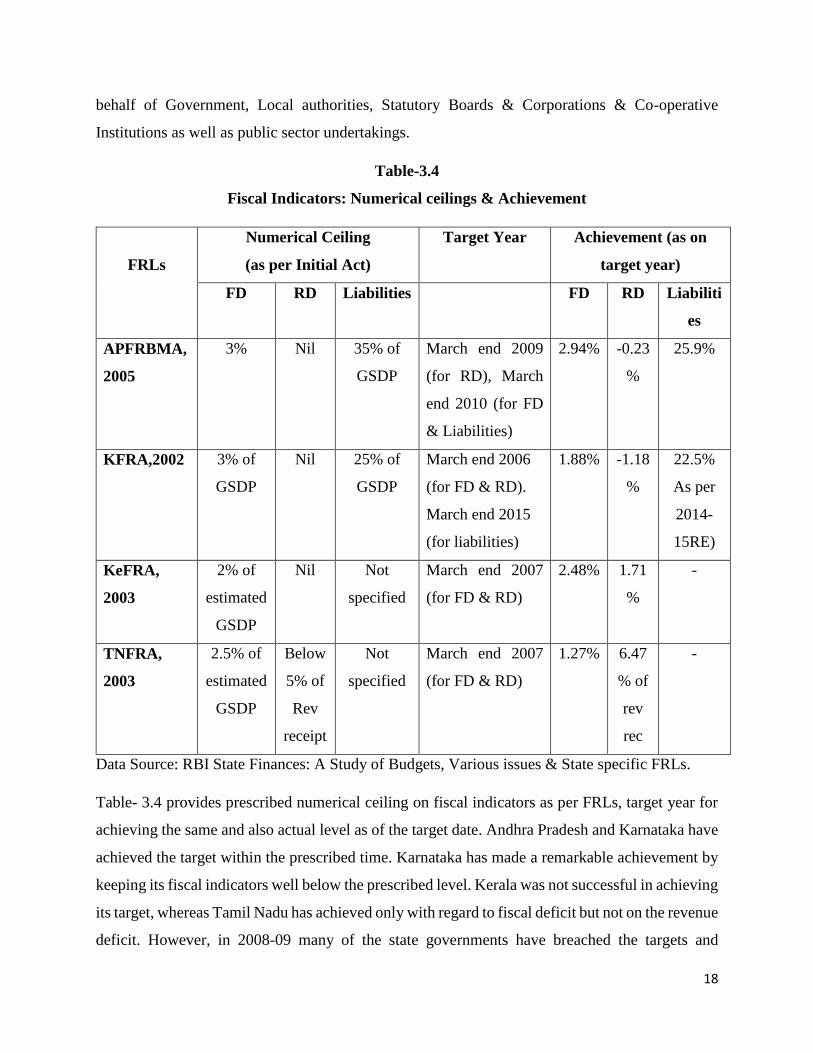
Table- 3.4 provides prescribed numerical ceiling on fiscal indicators as per FRLs, target year for
achieving the same and also actual level as of the target date. Andhra Pradesh and Karnataka have
achieved the target within the prescribed time. Karnataka has made a remarkable achievement by
keeping its fiscal indicators well below the prescribed level. Kerala was not successful in achieving
its target, whereas Tamil Nadu has achieved only with regard to fiscal deficit but not on the revenue
deficit. However, in 2008-09 many of the state governments have breached the targets and
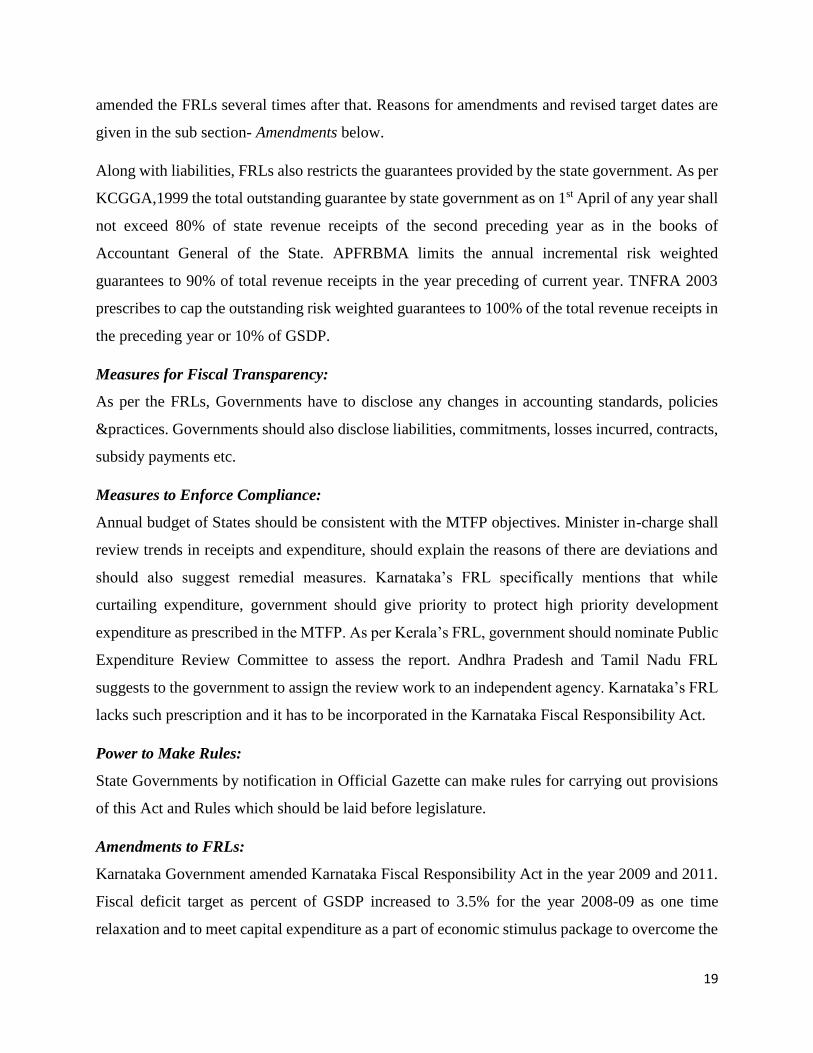
19
amended the FRLs several times after that. Reasons for amendments and revised target dates are
given in the sub section- Amendments below.
Along with liabilities, FRLs also restricts the guarantees provided by the state government. As per
KCGGA,1999 the total outstanding guarantee by state government as on 1st April of any year shall
not exceed 80% of state revenue receipts of the second preceding year as in the books of
Accountant General of the State. APFRBMA limits the annual incremental risk weighted
guarantees to 90% of total revenue receipts in the year preceding of current year. TNFRA 2003
prescribes to cap the outstanding risk weighted guarantees to 100% of the total revenue receipts in
the preceding year or 10% of GSDP.
Measures for Fiscal Transparency:
As per the FRLs, Governments have to disclose any changes in accounting standards, policies
&practices. Governments should also disclose liabilities, commitments, losses incurred, contracts,
subsidy payments etc.
Measures to Enforce Compliance:
Annual budget of States should be consistent with the MTFP objectives. Minister in-charge shall
review trends in receipts and expenditure, should explain the reasons of there are deviations and
should also suggest remedial measures. Karnataka’s FRL specifically mentions that while
curtailing expenditure, government should give priority to protect high priority development
expenditure as prescribed in the MTFP. As per Kerala’s FRL, government should nominate Public
Expenditure Review Committee to assess the report. Andhra Pradesh and Tamil Nadu FRL
suggests to the government to assign the review work to an independent agency. Karnataka’s FRL
lacks such prescription and it has to be incorporated in the Karnataka Fiscal Responsibility Act.
Power to Make Rules:
State Governments by notification in Official Gazette can make rules for carrying out provisions
of this Act and Rules which should be laid before legislature.
Amendments to FRLs:
Karnataka Government amended Karnataka Fiscal Responsibility Act in the year 2009 and 2011.
Fiscal deficit target as percent of GSDP increased to 3.5% for the year 2008-09 as one time
relaxation and to meet capital expenditure as a part of economic stimulus package to overcome the
20
financial crisis. Further, target was raised to 4% as one time relaxation for the year 2009-10. As a
counter recession measure, once again FD target was hiked to 3.44% of estimated GSDP for the
year 2010-11. The target of debt ratio raised to 25.2% of estimated GSDP to be achieved by March
2015. These amendments were due to adopting the measures prescribed by Government of India
based on Thirteenth Finance Commission recommendation as a condition precedent to release
specific grants & debt relief measures to the state. In the year 2014, Act was amended to
incorporate the redefinition of fiscal deficit in the lines of Central’s FRBM Act and Finance
Commission reports. Off-budget borrowings that are to be paid from the State’s budget are
included in the definition of term ‘Total Liabilities’ in order to provide true picture of sustainability
of debt.
Kerala Government has amended FRA in the year 2011 and postponed the target date to March
2015. Tamil Nadu, as on date, has amended Tamil Nadu Fiscal Responsibility Act five times. First
amendment was in 2004. Target date was extended from 2007 to 2008. Cap on risk weighted
guarantees raised to 100% of revenue receipts or 10% of GSDP whichever is lower. Cap
outstanding guarantees to 100% of revenue receipts in preceding year or 10% of GSDP whichever
is lower. TNFRA was amended in 2005 to extend the target date. It was added to the Act that
details of number of employees in Government, Public Sector Undertakings, aided institutions and
the related salaries are be given. Act was amended in 2010, 2011 and in 2015 to extend the target
date.
Andhra Pradesh Government amended APFRBMA, 2005 in the year 2010 and 2011. Cap on fiscal
deficit raised from 3% of GSDP to 4% of GSDP in 2010 amendment. Amendment in 2011 was
mainly to accommodate 13th Finance Commission’s recommendations.

21
Chapter-4
Impact of FRLs on Fiscal Indicators
Descriptive analysis as presented in Chapter-2 indicated the changing trends and pattern of fiscal
indicators in the study period. Table-4.1 provides an average of fiscal indicators as % to GSDP in
the pre-reform4 and reform period. Pre-reform (pre-FRL) period is from 1990-91 to 2002-03 for
Karnataka, 1990-91 to 2003-04 for Kerala & Tamil Nadu and 1990-91 to 2005-06 for Andhra
Pradesh. Post reform period is until 2014-15 (until 2013-14 for Andhra Pradesh) from the year of
FRL enforcement. A detailed time series data of fiscal variables in pre-reform and reform period
is provided in Appendix-2.
Table-4.1
Fiscal Indicators in Pre-FRL and FRL Period (% of GSDP)
States / Indicators
FD RD Liabilities
Interest Payments
Own Tax Rev
Rev Exp
Cap Outlay
Dev Exp
Non-Dev Exp
Soc Ser
Eco Ser
Andhra Pradesh
Pre-FRL
3.62 1.2 26.94 2.41 7.02 14.97 1.89 11.54 5.17 5.68 5.86
FRL 2.29 -0.31 24.49 1.77 7.53 13.31 2.42 11.32 4.5 5.37 5.85
Karnataka
Pre-FRL
3.45 1.03 22.38 1.98 8.89 15.62 2.2 12.36 5.03 5.98 6.38
FRL 2.37 -0.68 22.32 1.58 8.89 13.22 2.84 11.21 4.32 5.31 5.88
Kerala
Pre-FRL
4.73 2.84 33.22 2.81 8.7 16.79 1.22 10.97 6.84 6.59 4.38
FRL 3.32 2.2 31.2 2.26 7.44 13.49 0.87 7.45 6.18 4.64 2.66
Tamil Nadu
Pre-FRL
3.16 2.11 22.52 1.89 8.9 16 1.01 11.32 5.06 6.28 5.04
FRL 2.00 -0.12 20.64 1.52 8.23 12.19 1.92 8.91 4.48 5.17 3.55
Source: RBI State Finances, Various Issues. GoK (2017a), GoKE (2017) & GoTN (2017)
Table-4.1 denotes that there is a healthy change in all the fiscal indicators. Fiscal deficit and
revenue deficit as a percent of GSDP has declined for all the southern states. Liabilities have
declined for all selected states except Karnataka where there is only a minute decline in liabilities
from 22.38% to 22.32% of GSDP. Consequent to reduction in liabilities, interest payments have
also declined. With regard to own tax revenue, there was only a marginal increase for Andhra
4 Reform here refers to fiscal reforms through enactment of FRLs

22
Pradesh, whereas it remained same for Karnataka. For Tamil Nadu and Kerala, it declined in
reform era. Revenue expenditure has declined and capital outlay went up in the reform era for all
the southern states except Kerala where capital outlay has declined. Non-development expenditure
declined marginally for all the four States, but development expenditure as percent of GSDP too
declined for Kerala and Tamil Nadu almost by 3% of GSDP. Even though there is minimal
variation with regard to social service spending, economic service expenditure has declined for all
the southern states and the decline is maximum for Kerala followed by Tamil Nadu.
All the southern states except Kerala have kept their fiscal variables (as a percent of GSDP) well
within the prescribed limit as per FRLs particularly for deficit indicators and liabilities. Even
though, fiscal indicators as % to GSDP are within the limit, it is important to know and keep a
check on its growth rate. It is also important to know whether the change is significant or not. To
measure the impact of FRL on growth of fiscal indicators, time series econometrics is being used
here for the analysis. It may happen that even though there might be a reduction or expansion of a
particular variable in the reform era than earlier but that change may not be a significant one. These
dynamics can be clearly captured by using time series econometrics. A brief methodological note
of the same is given below.
Methodology:
Time Period: 1990-91 to 2014-15
Dummy variable technique is being adopted for the analysis. Structural change can be effectively
captured using dummy variable technique if exact year of break is known. Even in advanced
Regime Switching models, dummy variable are being used.
Consider following equation
lnFD𝑡 = α1 + β1𝑡𝑖𝑚𝑒 + 𝒖𝒕 …….. (1)
In equation-1 lnFD is natural log of fiscal deficit, time is the independent variable. Subscript ′𝒕′
indicates time. α, β & 𝑢 are the parameters to be estimated. Estimation of equation-1 indicates how fiscal
deficit has grown in the study period.
To see a structural break, equation-1 need to be modified as follows
lnFD𝑡 = α1 + β1𝑡𝑖𝑚𝑒 + β2𝐹𝑅𝐴 𝑑𝑢𝑚𝑚𝑦𝑡 + 𝒖𝒕 …….. (2)
23
Where 𝐹𝑅𝐴 𝑑𝑢𝑚𝑚𝑦 is the dummy variable introduced to capture the impact of Fiscal Responsibility
Act on fiscal variable, say fiscal deficit. For instance FRA came into force in the year 2003-04 for
Karnataka and in order to capture its impact, we have considered 2004-05 as break year (with
assumption that its impact may not be immediate and takes at least a lag of one year). Hence FRA
dummy takes values of ‘1’ after 2004-05 and ‘0’ before that. β2 is a differential intercept which
shows how much change has happened in fiscal deficit after the FRLs.
There is a possibility that it is not just the intercept but also the slope coefficient might have
changed (Gujarati, 2011). If both differential intercept and differential slope dummies are
introduced, equation-2 need to be modified as follows
lnFD𝑡 = α1 + β1𝑡𝑖𝑚𝑒 + β2𝐹𝑅𝐴 𝑑𝑢𝑚𝑚𝑦𝑡 + β3𝑡𝑖𝑚𝑒 × 𝐹𝑅𝐴 𝑑𝑢𝑚𝑚𝑦𝑡 + 𝒖𝒕 …….. (3)
β3 is the differencial slope coefficient. Movement or growth in the fiscal indicators before and in
reform era can be derived from equation-3.
Fiscal deficit growth in Pre-FRA period
lnFD𝑡 = α1 + β1𝑡𝑖𝑚𝑒
Fiscal deficit growth in FRA period
lnFD𝑡 = (α1 + β2𝐹𝑅𝐴 𝑑𝑢𝑚𝑚𝑦𝑡) + (β1𝑡𝑖𝑚𝑒 + β3𝑡𝑖𝑚𝑒 × 𝐹𝑅𝐴 𝑑𝑢𝑚𝑚𝑦𝑡)
Variables: All the major fiscal variables have been considered for the analysis. Variables are
classified under three major heads namely deficit indicators, revenue variables & expenditure
variables. Deficit related variables includes fiscal deficit, revenue deficit, liabilities and also
interest payments. States’ own tax revenue is considered as revenue indicator. Expenditure
variables include revenue expenditure, capital outlay, development & non-development
expenditure, social service and economic service expenditure. For each State and each variable,
separate regression has been run. This exercise provides a detailed picture of impact of fiscal rule
on each fiscal variable across States.
All the variables have been converted into 2004-05 prices using state specific GSDP deflator. Year
2004-05 for Karnataka, 2005-06 for Kerala and Tamil Nadu and 2006-07 for Andhra Pradesh has
been considered as break year and introduced FRA time dummy, which takes values of ‘1’ after
the said years and ‘0’ before that.

24
Discussion on Results
Deficit Indicators:
Regression results on FRLs impact on fiscal deficit and revenue deficit across the southern states
are presented in Table-4.2. In the Table-4.2 FRA is the time dummy and it is the intercept for the
regression equation representing fiscal reforms period and FRA*time is the slope coefficient.
Significant FRA (intercept) indicates that there is a shift in base of regression equation in reform
period. A significant slope coefficient indicates that there is structural break in the growth of
dependent variable. Insignificant LM-test statistics indicate that there is no autocorrelation
problem. R-squared value is high for all the models as required under time series analysis.
Table- 4.2
Structural Break Analysis Results (Fiscal Deficit & Revenue Deficit)
Andhra Pradesh Karnataka Kerala Tamil Nadu
Fisc
al D
efi
cit
Constant 8.006 (0.00)* 7.39 (0.00)* 7.48(0.00)* 7.95(0.00)*
Time 0.065 (0.00)* 0.09(0.00)* 0.072(0.00)* 0.061(0.00)*
FRA 0.481 (0.51) -0.796 (0.05)** -1.21 (0.18) -3.211 (0.00)*
FRA*time -0.036 (0.31) 0.007 (0.74) 0.048 (0.10)*** 0.135 (0.00)*
R-squared 0.77 0.87 0.85 0.75
LM-test Stats 0.74 (0.49) 1.94 (0.16) 2.06 (0.15) 1.42 (0.26)
Re
ven
ue
De
fici
t Constant 8.75 (0.00)* 8.36(0.00)* 6.23(0.00)* 8.8203 (0.00)*
Time 0.0006(0.96) 0.048(0.00)* 0.138(0.00)* 0.016 (0.39)
FRA -0.6801 (0.53) -1.82 (0.00)* 0.073 (0.96) -3.193 (0.00)*
FRA*time 0.011 (0.82) 0.021 (0.21) -0.039 (0.65) 0.113 (0.00)*
R-squared 0.32 0.85 0.84 0.70
LM-test Stats 1.07 (0.32) 1.34 (0.29) 0.79 (0.46) 1.37 (0.28)
Note: p-values are given in parenthesis ( ). *sig at 1% level, **sig at 5% level & ***sig at 10%
level
As indicated by significant coefficient of Time variable, Fiscal deficit has grown at a significant
rate in the pre-reform era for all the southern states (refer Table-4.2). For Andhra Pradesh there
was no significant impact of fiscal rule on reducing fiscal deficit. Andhra Pradesh has witnessed
significant growth of fiscal deficit in pre-reform period. This was basically owing to increased
salary bill, introduction of new welfare schemes, huge subsidy burden and most importantly
changes in political power. For Karnataka, there is a significant decline in the base value of fiscal
deficit but there was no significant impact on growth of fiscal deficit. Notably, for Kerala fiscal
deficit is growing at a faster rate in the reform period than earlier. Fiscal deficit has grown by 7.2%

25
in pre-reform period, which is growing at 12% in the reform period. For Tamil Nadu there is no
significant reduction in the fiscal deficit after the FRL.
Similar impact was observed on revenue deficit level. Impact of fiscal rule is not significant in
reducing fiscal deficit growth for Andhra Pradesh and Kerala. For Karnataka, only the base got
reduced but no significant change in its growth. Interestingly, revenue deficit is growing at a faster
rate and much significantly in reform period compared to pre-reform period for Tamil Nadu. The
growth rate is in double digit. Significant growth in revenue deficit is mainly owing to drastic fall
in commercial tax and sales tax collection, implementation of many popular programs as promised
by political parties during elections like free distribution of mixer grinder, laptops, color TVs,
special public distribution system, social security pension schemes etc (GoTN, 2016a). Many other
important programs like free power up to 100 units to domestic consumers, waiver of agricultural
loans of small and marginal farmers owed to the cooperative institutions have indeed increased the
expenditure of state and consequently lead to higher revenue deficit (GoTN, 2016).
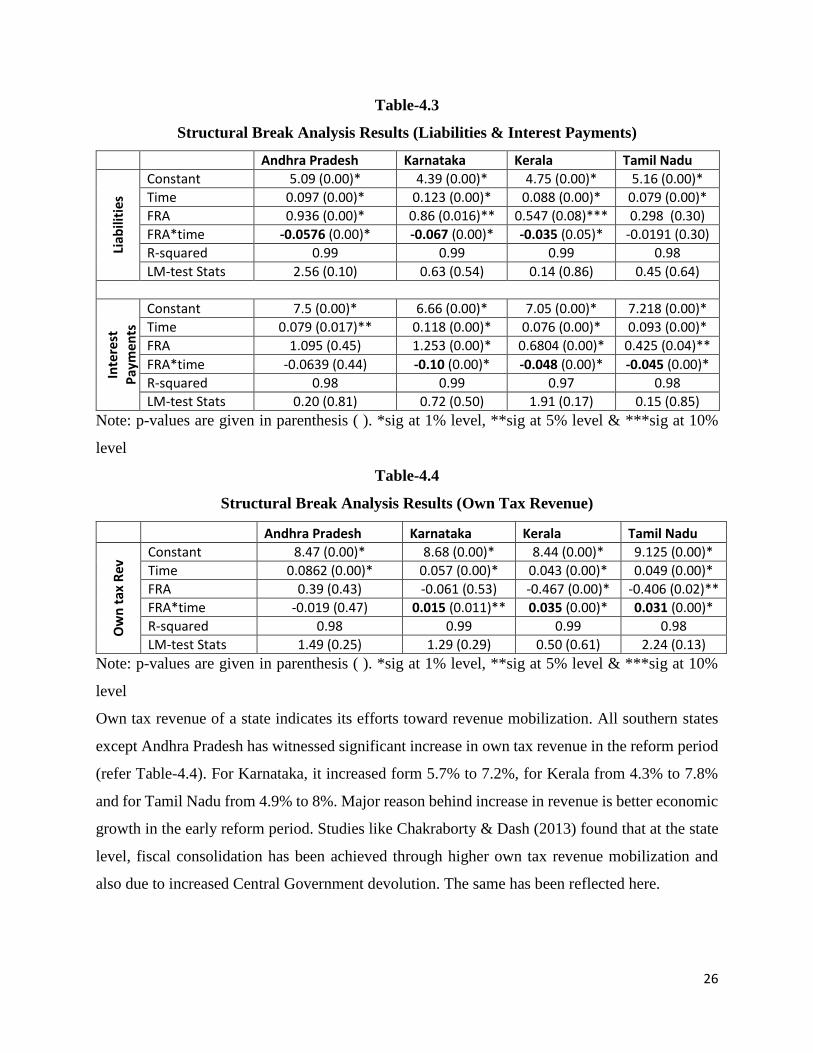
In the case of Liabilities (refer Table-4.3), all southern states except Tamil Nadu have achieved
significant reduction in its growth. However constant value has increased in the reform period.
Growth rate has declined from 9.7% in pre-reform era to 3.9% in reform period for Andhra
Pradesh, from 12.3% to 5.6% for Karnataka and from 8.8% to 5.3% for Kerala. Interest Payments
constitute major portion of expenditure both for Central Government and also among the states.
Structural break analysis results (refer Table-4.3) indicate that interest payments growth have
significantly declined for Karnataka, Kerala and Tamil Nadu. However, the constant value has
significantly increased. The decline in interest payment burden is mainly due to softening of
interest rates on Government securities in the reform period, particularly in mid of last decade.
Also measures like debt swap schemes in a low interest rate regime has benefited the states in
reducing interest rates (Chakraborty, 2005). Low interest rates in the reform period is the main
reason behind reduction in interest payments. Reduction in deficits and consequently the liabilities
has also contributed for reduction in interest payments. A report on Tamil Nadu State Finances
argue that reduction in liabilities (even though not significant for Tamil Nadu) and interest
payments was due to diversification of debt portfolio towards cheapest source of borrowing like
external loans, open market loans etc (MIDS, 2014).
26
Table-4.3
Structural Break Analysis Results (Liabilities & Interest Payments)
Andhra Pradesh Karnataka Kerala Tamil Nadu
Liab
iliti
es
Constant 5.09 (0.00)* 4.39 (0.00)* 4.75 (0.00)* 5.16 (0.00)*
Time 0.097 (0.00)* 0.123 (0.00)* 0.088 (0.00)* 0.079 (0.00)*
FRA 0.936 (0.00)* 0.86 (0.016)** 0.547 (0.08)*** 0.298 (0.30)
FRA*time -0.0576 (0.00)* -0.067 (0.00)* -0.035 (0.05)* -0.0191 (0.30)
R-squared 0.99 0.99 0.99 0.98
LM-test Stats 2.56 (0.10) 0.63 (0.54) 0.14 (0.86) 0.45 (0.64)
Inte
rest
P
aym
en
ts
Constant 7.5 (0.00)* 6.66 (0.00)* 7.05 (0.00)* 7.218 (0.00)*
Time 0.079 (0.017)** 0.118 (0.00)* 0.076 (0.00)* 0.093 (0.00)*
FRA 1.095 (0.45) 1.253 (0.00)* 0.6804 (0.00)* 0.425 (0.04)**
FRA*time -0.0639 (0.44) -0.10 (0.00)* -0.048 (0.00)* -0.045 (0.00)*
R-squared 0.98 0.99 0.97 0.98
LM-test Stats 0.20 (0.81) 0.72 (0.50) 1.91 (0.17) 0.15 (0.85)
Note: p-values are given in parenthesis ( ). *sig at 1% level, **sig at 5% level & ***sig at 10%
level
Table-4.4
Structural Break Analysis Results (Own Tax Revenue)
Andhra Pradesh Karnataka Kerala Tamil Nadu
Ow
n t
ax R
ev Constant 8.47 (0.00)* 8.68 (0.00)* 8.44 (0.00)* 9.125 (0.00)*
Time 0.0862 (0.00)* 0.057 (0.00)* 0.043 (0.00)* 0.049 (0.00)*
FRA 0.39 (0.43) -0.061 (0.53) -0.467 (0.00)* -0.406 (0.02)**
FRA*time -0.019 (0.47) 0.015 (0.011)** 0.035 (0.00)* 0.031 (0.00)*
R-squared 0.98 0.99 0.99 0.98
LM-test Stats 1.49 (0.25) 1.29 (0.29) 0.50 (0.61) 2.24 (0.13)
Note: p-values are given in parenthesis ( ). *sig at 1% level, **sig at 5% level & ***sig at 10%
level
Own tax revenue of a state indicates its efforts toward revenue mobilization. All southern states
except Andhra Pradesh has witnessed significant increase in own tax revenue in the reform period
(refer Table-4.4). For Karnataka, it increased form 5.7% to 7.2%, for Kerala from 4.3% to 7.8%
and for Tamil Nadu from 4.9% to 8%. Major reason behind increase in revenue is better economic
growth in the early reform period. Studies like Chakraborty & Dash (2013) found that at the state
level, fiscal consolidation has been achieved through higher own tax revenue mobilization and
also due to increased Central Government devolution. The same has been reflected here.
27
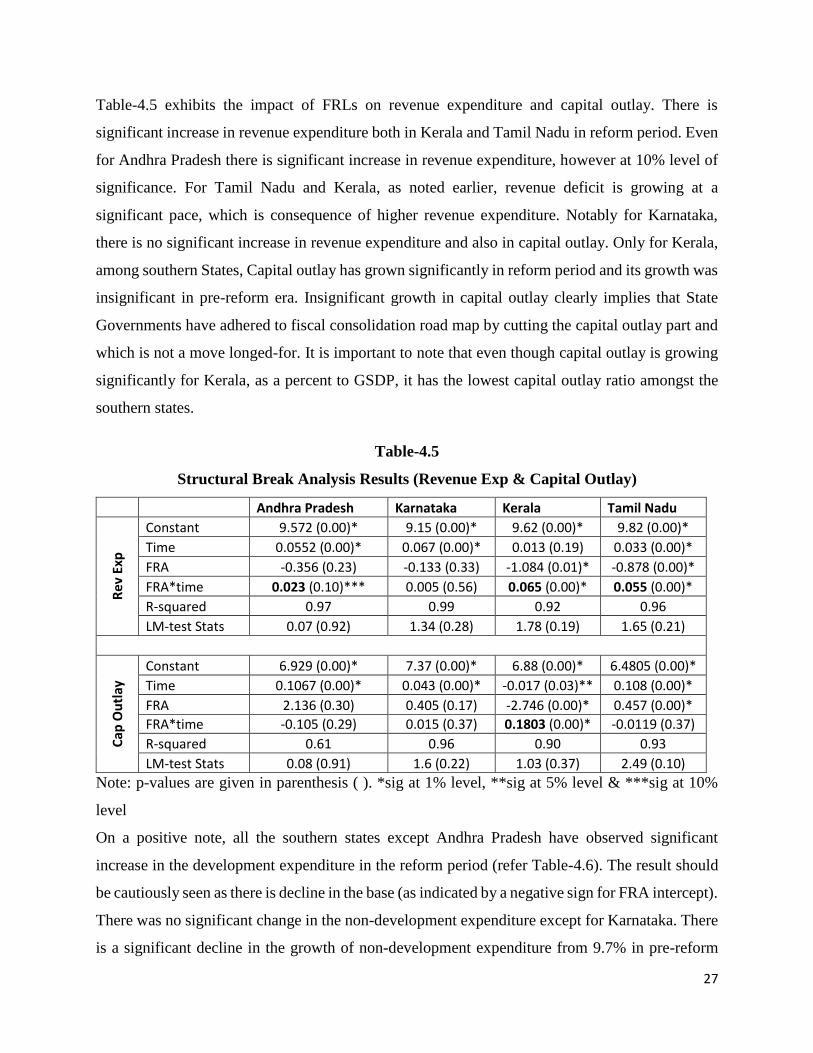
Table-4.5 exhibits the impact of FRLs on revenue expenditure and capital outlay. There is
significant increase in revenue expenditure both in Kerala and Tamil Nadu in reform period. Even
for Andhra Pradesh there is significant increase in revenue expenditure, however at 10% level of
significance. For Tamil Nadu and Kerala, as noted earlier, revenue deficit is growing at a
significant pace, which is consequence of higher revenue expenditure. Notably for Karnataka,
there is no significant increase in revenue expenditure and also in capital outlay. Only for Kerala,
among southern States, Capital outlay has grown significantly in reform period and its growth was
insignificant in pre-reform era. Insignificant growth in capital outlay clearly implies that State
Governments have adhered to fiscal consolidation road map by cutting the capital outlay part and
which is not a move longed-for. It is important to note that even though capital outlay is growing
significantly for Kerala, as a percent to GSDP, it has the lowest capital outlay ratio amongst the
southern states.
Table-4.5
Structural Break Analysis Results (Revenue Exp & Capital Outlay)
Andhra Pradesh Karnataka Kerala Tamil Nadu
Re
v Ex
p
Constant 9.572 (0.00)* 9.15 (0.00)* 9.62 (0.00)* 9.82 (0.00)*
Time 0.0552 (0.00)* 0.067 (0.00)* 0.013 (0.19) 0.033 (0.00)*
FRA -0.356 (0.23) -0.133 (0.33) -1.084 (0.01)* -0.878 (0.00)*
FRA*time 0.023 (0.10)*** 0.005 (0.56) 0.065 (0.00)* 0.055 (0.00)*
R-squared 0.97 0.99 0.92 0.96
LM-test Stats 0.07 (0.92) 1.34 (0.28) 1.78 (0.19) 1.65 (0.21)
Cap
Ou
tlay
Constant 6.929 (0.00)* 7.37 (0.00)* 6.88 (0.00)* 6.4805 (0.00)*
Time 0.1067 (0.00)* 0.043 (0.00)* -0.017 (0.03)** 0.108 (0.00)*
FRA 2.136 (0.30) 0.405 (0.17) -2.746 (0.00)* 0.457 (0.00)*
FRA*time -0.105 (0.29) 0.015 (0.37) 0.1803 (0.00)* -0.0119 (0.37)
R-squared 0.61 0.96 0.90 0.93
LM-test Stats 0.08 (0.91) 1.6 (0.22) 1.03 (0.37) 2.49 (0.10)
Note: p-values are given in parenthesis ( ). *sig at 1% level, **sig at 5% level & ***sig at 10%
level
On a positive note, all the southern states except Andhra Pradesh have observed significant
increase in the development expenditure in the reform period (refer Table-4.6). The result should
be cautiously seen as there is decline in the base (as indicated by a negative sign for FRA intercept).
There was no significant change in the non-development expenditure except for Karnataka. There
is a significant decline in the growth of non-development expenditure from 9.7% in pre-reform
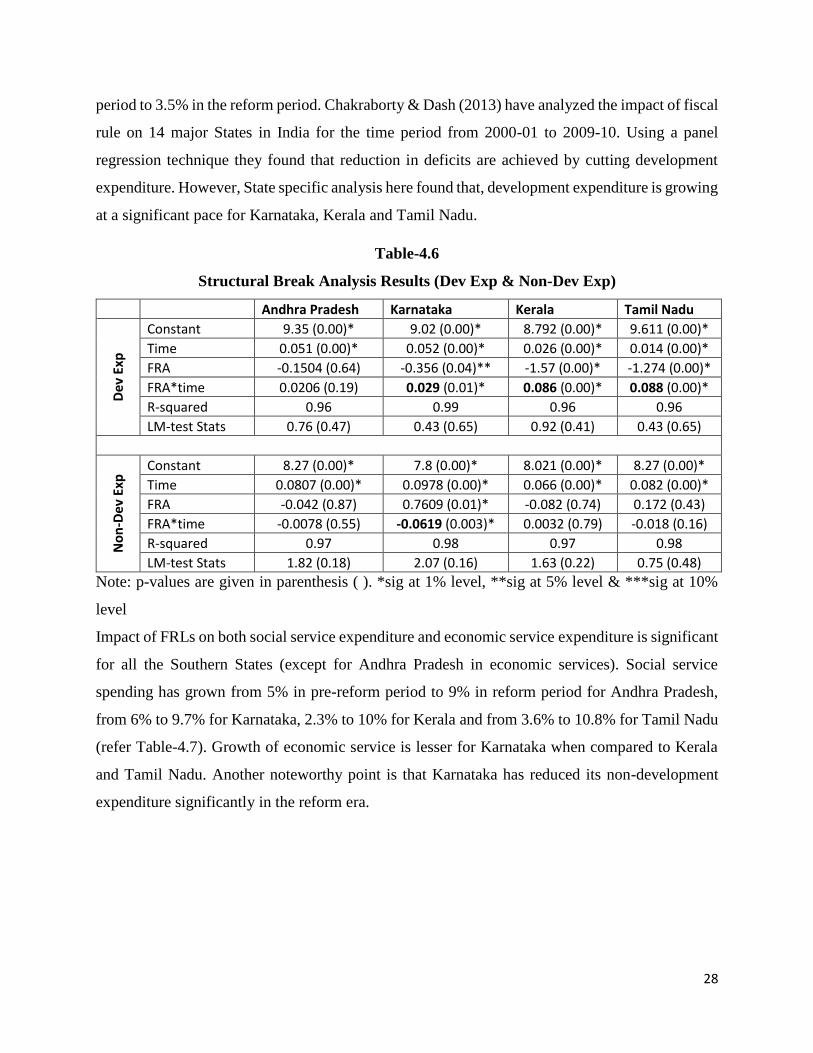
28
period to 3.5% in the reform period. Chakraborty & Dash (2013) have analyzed the impact of fiscal
rule on 14 major States in India for the time period from 2000-01 to 2009-10. Using a panel
regression technique they found that reduction in deficits are achieved by cutting development
expenditure. However, State specific analysis here found that, development expenditure is growing
at a significant pace for Karnataka, Kerala and Tamil Nadu.
Table-4.6
Structural Break Analysis Results (Dev Exp & Non-Dev Exp)
Andhra Pradesh Karnataka Kerala Tamil Nadu
De
v Ex
p
Constant 9.35 (0.00)* 9.02 (0.00)* 8.792 (0.00)* 9.611 (0.00)*
Time 0.051 (0.00)* 0.052 (0.00)* 0.026 (0.00)* 0.014 (0.00)*
FRA -0.1504 (0.64) -0.356 (0.04)** -1.57 (0.00)* -1.274 (0.00)*
FRA*time 0.0206 (0.19) 0.029 (0.01)* 0.086 (0.00)* 0.088 (0.00)*
R-squared 0.96 0.99 0.96 0.96
LM-test Stats 0.76 (0.47) 0.43 (0.65) 0.92 (0.41) 0.43 (0.65)
No
n-D
ev
Exp
Constant 8.27 (0.00)* 7.8 (0.00)* 8.021 (0.00)* 8.27 (0.00)*
Time 0.0807 (0.00)* 0.0978 (0.00)* 0.066 (0.00)* 0.082 (0.00)*
FRA -0.042 (0.87) 0.7609 (0.01)* -0.082 (0.74) 0.172 (0.43)
FRA*time -0.0078 (0.55) -0.0619 (0.003)* 0.0032 (0.79) -0.018 (0.16)
R-squared 0.97 0.98 0.97 0.98
LM-test Stats 1.82 (0.18) 2.07 (0.16) 1.63 (0.22) 0.75 (0.48)
Note: p-values are given in parenthesis ( ). *sig at 1% level, **sig at 5% level & ***sig at 10%
level
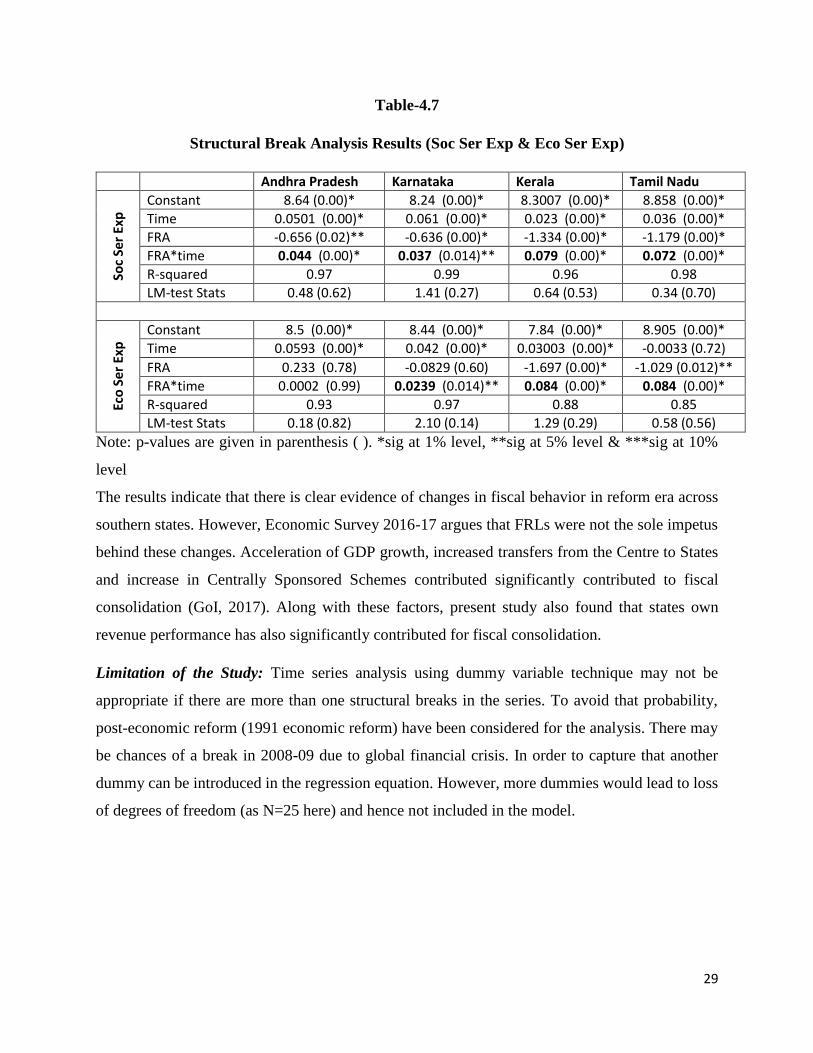
Impact of FRLs on both social service expenditure and economic service expenditure is significant
for all the Southern States (except for Andhra Pradesh in economic services). Social service
spending has grown from 5% in pre-reform period to 9% in reform period for Andhra Pradesh,
from 6% to 9.7% for Karnataka, 2.3% to 10% for Kerala and from 3.6% to 10.8% for Tamil Nadu
(refer Table-4.7). Growth of economic service is lesser for Karnataka when compared to Kerala
and Tamil Nadu. Another noteworthy point is that Karnataka has reduced its non-development
expenditure significantly in the reform era.
29
Table-4.7
Structural Break Analysis Results (Soc Ser Exp & Eco Ser Exp)
Andhra Pradesh Karnataka Kerala Tamil Nadu
Soc
Ser
Exp
Constant 8.64 (0.00)* 8.24 (0.00)* 8.3007 (0.00)* 8.858 (0.00)*
Time 0.0501 (0.00)* 0.061 (0.00)* 0.023 (0.00)* 0.036 (0.00)*
FRA -0.656 (0.02)** -0.636 (0.00)* -1.334 (0.00)* -1.179 (0.00)*
FRA*time 0.044 (0.00)* 0.037 (0.014)** 0.079 (0.00)* 0.072 (0.00)*
R-squared 0.97 0.99 0.96 0.98
LM-test Stats 0.48 (0.62) 1.41 (0.27) 0.64 (0.53) 0.34 (0.70)
Eco
Ser
Exp
Constant 8.5 (0.00)* 8.44 (0.00)* 7.84 (0.00)* 8.905 (0.00)*
Time 0.0593 (0.00)* 0.042 (0.00)* 0.03003 (0.00)* -0.0033 (0.72)
FRA 0.233 (0.78) -0.0829 (0.60) -1.697 (0.00)* -1.029 (0.012)**
FRA*time 0.0002 (0.99) 0.0239 (0.014)** 0.084 (0.00)* 0.084 (0.00)*
R-squared 0.93 0.97 0.88 0.85
LM-test Stats 0.18 (0.82) 2.10 (0.14) 1.29 (0.29) 0.58 (0.56)
Note: p-values are given in parenthesis ( ). *sig at 1% level, **sig at 5% level & ***sig at 10%
level
The results indicate that there is clear evidence of changes in fiscal behavior in reform era across
southern states. However, Economic Survey 2016-17 argues that FRLs were not the sole impetus
behind these changes. Acceleration of GDP growth, increased transfers from the Centre to States
and increase in Centrally Sponsored Schemes contributed significantly contributed to fiscal
consolidation (GoI, 2017). Along with these factors, present study also found that states own
revenue performance has also significantly contributed for fiscal consolidation.
Limitation of the Study: Time series analysis using dummy variable technique may not be
appropriate if there are more than one structural breaks in the series. To avoid that probability,
post-economic reform (1991 economic reform) have been considered for the analysis. There may
be chances of a break in 2008-09 due to global financial crisis. In order to capture that another
dummy can be introduced in the regression equation. However, more dummies would lead to loss
of degrees of freedom (as N=25 here) and hence not included in the model.
30
Chapter-5
Conclusion and Policy Implications
Higher deficits and mounting debt in late 90s and early 2000s paved the way for rule based fiscal
correction mechanism in India. Higher deficits across southern states were mainly due to
implementation of pay revisions, huge subsidies, waiver of farm loans etc. For instance, in Andhra
Pradesh the rice subsidy given in the year 1995-96 was so huge that it was about half of total
budgetary allocations to education and health together. There are recent episodes in Tamil Nadu
that government wants to amend the FRLs in order to fulfill the promise they have made during
Assembly elections.
Karnataka was the first State to implement fiscal responsibility legislation followed by Tamil
Nadu, Kerala and Andhra Pradesh. Among the southern states, Karnataka has a unique and
distinguished feature in the FRL. Its 17 Fiscal Management Principles covers several aspects
including inter-generational equity. There is only one limitation with Karnataka’s FRL is lack of
independent external assessment body to review the compliance of the State Government to FRL.
State Governments have amended FRLs several times to provide counter recession measures. In
the name of global financial crisis, all the southern states have postponed the target dates. In
addition to it, to accommodate new definition of fiscal deficit and to pursue recommendations of
Thirteenth Finance Commissions State Governments have amended the FRLs. Between 2003-04
and 2014-15 Tamil Nadu Government have amended FRL five times. There must be some strict
rule to limit these amendments several times by providing unconventional reasons.
Trend analysis indicated that there is change in trends and patterns of fiscal indicators after the
enactment of FRLs across southern states. All the southern states except Kerala have kept their
fiscal variables (as a percent of GSDP) well within the prescribed limit as per FRLs particularly
for deficit indicators and liabilities. Even though, fiscal indicators as % to GSDP are within the
limit, it is important to know and keep a check on its growth rate. To measure the impact of FRL
on fiscal variables (on its growth), time series econometrics, particularly dummy variable method
was used for the analysis. The result showed that there are some significant variations in fiscal
indicators, however, it is state specific. For Andhra Pradesh, impact of FRL on select fiscal
indicators is not significant except for social service spending. Karnataka which lead in formation,
31
implementation of FRL is clearly denoted in its performance. Even though there was no significant
change in deficit indicators growth for Karnataka, growth in other variables like interest payments,
revenue expenditure, non-development expenditure have significantly come down whereas growth
in capital outlay, development expenditure have gone up. This clearly implies that Karnataka’s
fiscal indicators are on right track. However, Karnataka Government should be cautious that its
liabilities are growing at a much faster rate in reform period than before and hence require careful
handling of the same.
Significant impact of FRL was also seen on Kerala State finances. Liabilities, interest payments
have declined whereas development expenditure and capital outlay have gone up significantly.
However, as a percent to GSDP capital outlay has declined in reform period. There are certain
similarities between Tamil Nadu and Kerala in the fiscal performance in reform period. Contrary
to the expectations, deficits are growing at a faster rate for Tamil Nadu and Kerala. Karnataka is
the only state in which growth of non-development expenditure has declined significantly in
reform period, in other states there were no significant changes.
These results have several policy implications. Southern states except Karnataka were not able to
reduce growth in non-developmental expenditure significantly after the reforms. Capital outlay
part was the most affected portion of expenditure. States could achieve the fiscal consolidation
targets due to better economic growth and consequent tax buoyancy in early reform period and
also by cutting capital outlay. States must strictly adhere to existing fiscal consolidation roadmap
without amending it several times in order to achieve the laid down targets. Breaks in the laid road
map would certainly result in unsustainable deficits and debt in near future.

32
Bibliography
Chakraborty, P. (2005). Debt Swap Schemes in Low Interest Rate Regime: Unequal Gains and Future
Worries. Economic & Political Weekly, 40, 4357-4362.
Chakraborty, P., & Dash, B. B. (2013). Fiscal Reforms, Fiscal Rule and Development Spending: How Indian
States have Performed? NIPFP Working Paper-122.
GoAP. (2000). Andhra Pradesh Budget, 2000-01 Budget Speech. Hyderabad: Finance Department,
Government of Andhra Pradesh.
GoI. (2011). India Human Development Report 2011: Towards Social Inclusion. New Delhi: Planning
Commission, Government of India.
GoI. (2011a). Report of the High Level Committee on Efficient Management of Public Expenditure. New
Delhi: Planning Commission, Government of India.
GoI. (2017). Economic Survey 2016-17. New Delhi: Ministry of Finance, Government of India.
GoK. (1994). Economic Survey 1993-94. Bangalore: Palnning Department, Government of Karnataka.
GoK. (1999). Economic Survey 1998-99. Bangalore: Planning Department, Government of Karnataka.
GoK. (2005). Medium Term Fiscal Plan for Karnataka 2005-2009. Bangalore: Finance Department,
Government of Karnataka.
GoK. (2007). Economic Survey 2006-07. Bangalore: Planning Department, Government of Karnataka.
GoK. (2014). Economic Survey of Karnataka 2013-14. Bangalore: Planning, Programe Monitoring &
Statistics Department, Government of Karnataka.
GoK. (2017, February 17). Retrieved from www.finance.kar.nic.in:
http://www.finance.kar.nic.in/actsrules/acts/govtguar.pdf
GoK. (2017a). Economic Survey of Karnataka 2016-17. Bangalore: Directorate of Economics & Statistics,
Government of Karnataka.
GoKE. (2016). Revised Budget Speech 2016-17. Thiruvananthapuram: Finance Department, Government
of Kerala.
GoKE. (2017). Budget Documents 2017-18. Thiruvananthapuram: Finance Department, Government of
Kerala.
GoTN. (2016). Tamil Nadu Interim Budget 2016-17. Chennai: Finance Department, Government of Tamil
Nadu.
GoTN. (2016a). Tamil Nadu Budget 2016-17. Chennai: Finance Department, Government of Tamil Nadu.
Gujarati, D. (2011). Econometric by Example. London: Palgrave Macmillan.
ISEC. (2014). Evaluation of State Finances of Karnataka. Bangalore: Institute for Social and Economic
Change.
33
Khundrakpam, J., & Pattnaik, S. (2010). Fiscal Stimulus and Potential Inflationary Risks- An Empirical
Assessment of Fiscal Deficit and Inflation Relationship in India. Journal of Economic Integration,
25(4), 703-721.
MIDS. (2014). Tamil Nadu State Finances. Chennai: Madras Institute of Development Studies.
MoF. (2017, February 16). www.finmin.nic.in. Retrieved from
http://www.finmin.nic.in/the_ministry/dept_expenditure/plan_finance/Fiscal_Reforms_Facility
/Fiscal%20Reform%20Facility.asp
Mukherjee, S. (2014, February 19). New Mechanism of Central Fund Flow to States to add to
Transparency. Business Standard.
Ramu, M. R. (2016). "Twin Deficits" Hypothesis: An Assessment of Relationship & Transmission
Mechanism in India. Foreign Trade Review, 20(10), 1-15.
Ramu, M. R., & Gayithri, K. (2016). Relationship between Fiscal Deficit Composition and Economic
Growth in India: A Time Series Econometric Analysis. ISEC Working Paper- 367, 1-18.
Rao, M. G., & Chakraborty, P. (2006). Finances of Karnataka: Fiscal Implications of Salary Hike. New
Delhi: NIPFP.
RBI. (2013). State Finances-A Study of Budgets 2012-13. Mumbai: Reserve Bank of India.
RBI. (2016). RBI State Finances, Various Issues. Mumbai: Reserve Bank of India.
Schaechter, A., Kinda, T., Nina, B., & Weba, A. (2012). Fiscal Rules in Response to the Crisis- Toward the
"Next Generation" Rules. A New Dataset. IMF Working Paper- 187.
Thomas, M. (2015). Tax Contribution of Service Sector: An Empirical Study of Service Taxation in India.
ISEC Working Paper-344, 1-19.

34
Appendix-1
Fiscal Responsibility Legislations of Southern States: A detailed view
Rules/St
ates
Karnataka Kerala Tamil Nadu Andhra Pradesh
Act
Karnataka Fiscal Responsibility Act,
2002
The Kerala Fiscal
Responsibility Act, 2003
Tamil Nadu Fiscal Responsibility
Act, 2003
Andhra Pradesh Fiscal
Responsibility & Budget
Management Act, 2005
Enactme
nt Year
30-Aug-2002 17-Sep-2003 17-May-2003 25-Oct-2005
Year of
Commen
cement
1-Apr-2003
5-Dec-2003 3-June-2005
Objectiv
e
An Act to provide for the
responsibility of the State
Government to ensure fiscal stability
and sustainability, and to enhance the
scope for improving social and
physical infrastructure and human
development by achieving sufficient
revenue surplus, reducing fiscal
deficit and removing impediments to
the effective conduct of fiscal policy
and prudent debt management
through limits on State Government
borrowings, debt and deficits, greater
transparency in fiscal operations of
the State Government and use of a
medium-term fiscal framework and
for matters connected therewith or
incidental thereto
To provide for the
responsibility of the Govt to
ensure prudence in fiscal
management and fiscal
stability by progressive
elimination of RD and
sustainable debt
management consistent with
fiscal stability, greater
transparency in fiscal
operations of the Govt and
conduct of fiscal policy in a
medium term fiscal
framework and for matters
connected therewith or
incidental thereto.
To provide that it shall be the
responsibility of the State
Govt to ensure fiscal stability and
sustainability, and to enhance
the scope for improving social and
physical infra and human
development by achieving sufficient
revenue surplus, reducing FD and
removing impediments to the
effective conduct of fiscal policy and
prudent debt management through
limits on State
Govt's borrowings, debts and
deficits, greater transparency in
fiscal framework and for matters
connected therewith or incidental
thereto.
To provide for the
responsibility of the Govt to
ensure prudence in fiscal
management and fiscal
stability by progressive
elimination of RD, reduction
in FD, prudent debt
management consistent with
fiscal sustainability, greater
transparency in
fiscal operations of the Govt
and conduct of fiscal policy in
a medium term fiscal
framework and for matters
connected therewith or
incidental thereto.
1. take appropriate measures
to reduce RD & build up
adequate surplus and utilize
for productive purpose,
contain FD at sustainable
level.

35
2. pursue policies to raise non-
tax rev with due regard to cost
recovery & equity
3.prirotisation of cap exp &
pursue the exp which policies
that would provide impetus to
growth
Medium
Term
Fiscal
Plan
Lay before both Houses of
Legislature a MTFP along with
annual budget.
1.Four year rolling target
2. Should contain medium term fiscal
objectives
3.Evaluation of performance of fiscal
indicators
4. A statement on recent economic
trends and future prospects for
growth and development affecting
fiscal position of the State Govt.
5. Strategic priorities of Govt in
ensuing year
6. Policies of Govt for ensuing year
relating to taxation, exp, borrowings,
lending, pricing of administered
goods and services, key fiscal
measures and target pertaining to
each of these.
7. Evaluation of whether current
policies are in conformity with fiscal
management principles
Lay before both Houses of
Legislature a MTFP and
fiscal policy strategy
statement along with annual
budget.
1.Four year rolling target
2. MTFP should contain
assessment of sustainability
relating to balance between
revenue receipts & rev exp.
3. And capital receipts
should be used for
generating productive
assets.
4. FP strategy statement
should contain policies of
Govt for ensuing fin year
relating to taxation, exp,
borrowings, liabilities,
investments, guarantees &
strategic priorities. And it
should also contain
evaluation of how current
policies are in conformity
with fiscal management
principles.
Lay before legislative assembly a
MTFP along with budget document.
MTFP should include:
-Multi-year rolling target for fiscal
indicators
- should contain assessment of
sustainability relating to balance
between revenue receipts & rev exp.
-And capital receipts should be used
for generating productive assets.
- should contain medium term fiscal
objectives, an evaluation of
performance of fiscal indicators with
previous year targets and likely
performance in current year
-Statement of recent economic
trends & prospects of EG
-strategic priorities of Govt in
ensuing year
- Policies of Govt for ensuing year
relating to taxation, exp, borrowings,
lending, pricing of administered
goods and services, key fiscal
measures and target pertaining to
each of these. And it should also
contain evaluation of how current
policies are in conformity with fiscal
management principles
Govt should lay before
legislature
-Macroeconomic Framework
Statement
-MTF policy statement
-FP Strategy Statement
MTF Policy statement should
include:
-3 year rolling target
-should contain assessment of
sustainability relating to
balance between revenue
receipts & rev exp.
-And capital receipts should
be used for generating
productive assets.
-the estimated yearly pension
liabilities worked out on
actuarial basis for next 10
years
- FP strategy statement should
contain policies of Govt for
ensuing fin year relating to
taxation, exp, borrowings,
liabilities, investments,
guarantees & strategic
priorities. And it should also
contain evaluation of how
current policies are in

36
conformity with fiscal
management principles.
Fiscal
Manage
ment
Principle
s
1.Maintain Govt debt at prudent level
2. manage guarantees & liabilities
prudently
3.Ensure policy decisions of Govt
have due regard to future generations
4.Ensure borrowings are used for
capital formation
5. ensure a reasonable degree of
predictability in the level of tax
burden
6. maintain integrity of tax system by
minimizing exemptions, concessions
7. Pursue tax policies with due regard
to economic efficiency and
compliance cost
8. Pursue non-tax revenue policies
with due regard to cost recovery &
equity
9. Pursue exp policies that would
provide impetus to EG, poverty
reduction & improvement in human
welfare
10. Build up Rev surplus for
productive exp
11. proper maintenance of physical
assets of Govt
12. Publicize the Info on FP & state
of Public Fin
13. Ensure best use of public
resources
14. Minimize fiscal risk associated
with running PSU & utilities
providing public G&S
1. Govt shall take measures
to reduce RD & build up
revenue surplus
2. Following targets to be
achieved by March 2007
commencing from 1 Apr
2003.
- RD to be nil
- build up surplus of revenue
& utilize such amount for
discharging liabilities in
excess of assets.
- FD to be 2% of GSDP
1. Govt shall take appropriate
measure to manage, RD, FD & debt
at sustainable level
2. Reduce RD as a % of Rev receipts
to 5% by March 2007
3. FD as % of estimated GSDP
should not be more than 2.5% by
Mar 2007
4. Cap risk weighted guarantees to
100% of total rev receipts in the
preceding year or at 10% of GSDP.
1. transparency in setting of
FP objectives, implementation
of public policy & publication
of info
2. Stability & predictability in
FP making process
3.responsibility in
management of Public
finances, including integrity in
budget formulation
4.Ensure that policy decisions
have due regard on financial
implications on future gen
5.Efficiency in design &
implementation FP &
managing the assets &
liabilities of public sector
balance sheet.
Fiscal Targets:
1. Reduce RD by 0.32% of
GSDP every year from 1-Apr-
2005 to eliminate it by Mar
2009 and build surplus later
on.
2. Reduce FD by 0.25% of
GSDP every year from 1-Apr-
2005 to reduce it by Mar 2010
to 3% of GSDP
3.Ensure that within 5 year
outstanding liabilities should
not be more than 35% of
GSDP
4.Limit the annual increment
risk weighted guarantees to
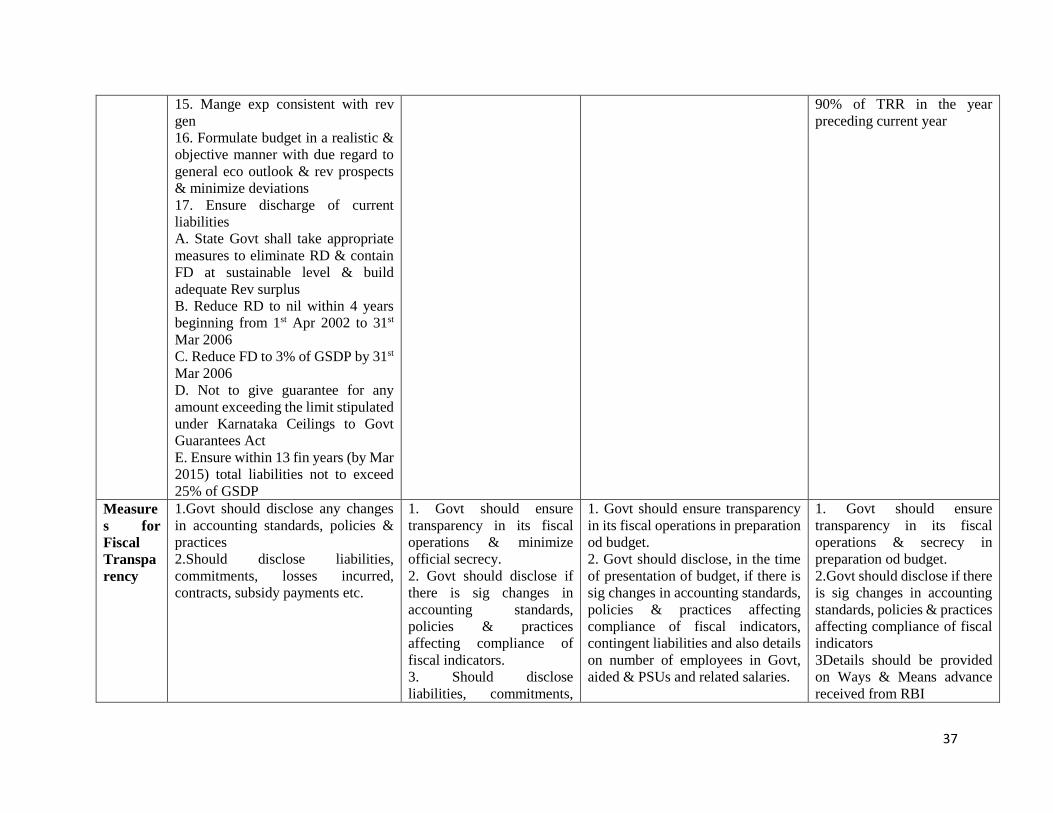
37
15. Mange exp consistent with rev
gen
16. Formulate budget in a realistic &
objective manner with due regard to
general eco outlook & rev prospects
& minimize deviations
17. Ensure discharge of current
liabilities
A. State Govt shall take appropriate
measures to eliminate RD & contain
FD at sustainable level & build
adequate Rev surplus
B. Reduce RD to nil within 4 years
beginning from 1st Apr 2002 to 31st
Mar 2006
C. Reduce FD to 3% of GSDP by 31st
Mar 2006
D. Not to give guarantee for any
amount exceeding the limit stipulated
under Karnataka Ceilings to Govt
Guarantees Act
E. Ensure within 13 fin years (by Mar
2015) total liabilities not to exceed
25% of GSDP
90% of TRR in the year
preceding current year
Measure
s for
Fiscal
Transpa
rency
1.Govt should disclose any changes
in accounting standards, policies &
practices
2.Should disclose liabilities,
commitments, losses incurred,
contracts, subsidy payments etc.
1. Govt should ensure
transparency in its fiscal
operations & minimize
official secrecy.
2. Govt should disclose if
there is sig changes in
accounting standards,
policies & practices
affecting compliance of
fiscal indicators.
3. Should disclose
liabilities, commitments,
1. Govt should ensure transparency
in its fiscal operations in preparation
od budget.
2. Govt should disclose, in the time
of presentation of budget, if there is
sig changes in accounting standards,
policies & practices affecting
compliance of fiscal indicators,
contingent liabilities and also details
on number of employees in Govt,
aided & PSUs and related salaries.
1. Govt should ensure
transparency in its fiscal
operations & secrecy in
preparation od budget.
2.Govt should disclose if there
is sig changes in accounting
standards, policies & practices
affecting compliance of fiscal
indicators
3Details should be provided
on Ways & Means advance
received from RBI
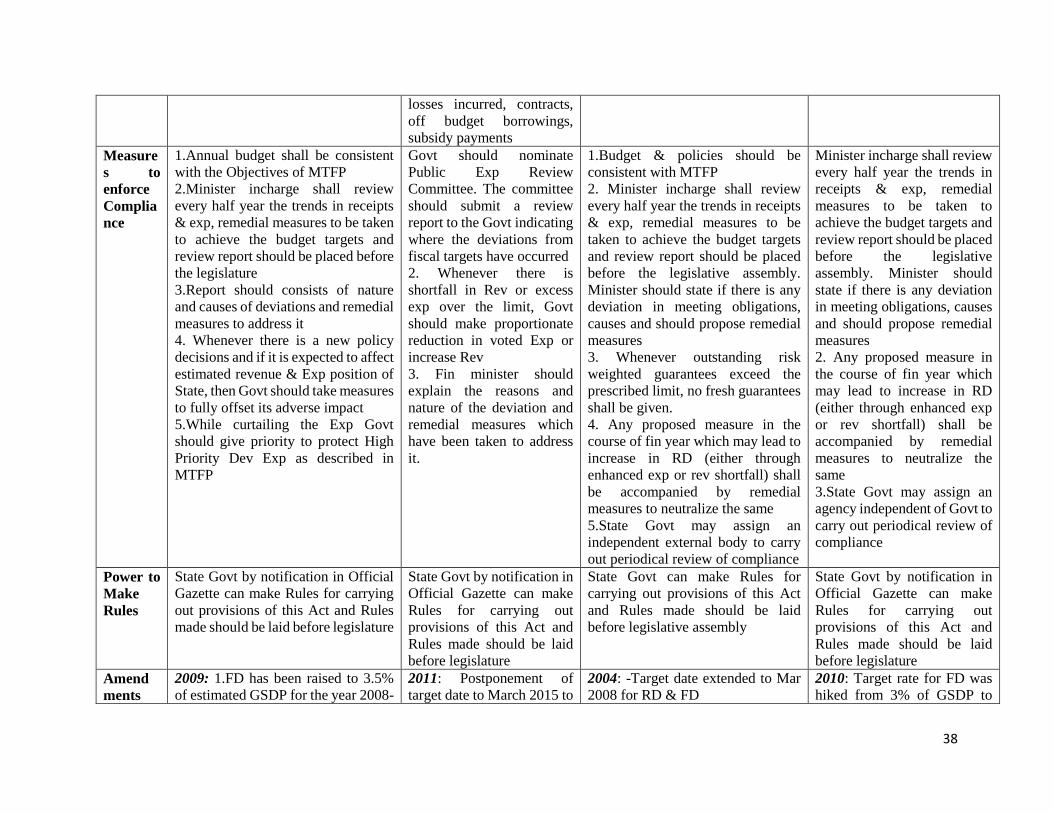
38
losses incurred, contracts,
off budget borrowings,
subsidy payments
Measure
s to
enforce
Complia
nce
1.Annual budget shall be consistent
with the Objectives of MTFP
2.Minister incharge shall review
every half year the trends in receipts
& exp, remedial measures to be taken
to achieve the budget targets and
review report should be placed before
the legislature
3.Report should consists of nature
and causes of deviations and remedial
measures to address it
4. Whenever there is a new policy
decisions and if it is expected to affect
estimated revenue & Exp position of
State, then Govt should take measures
to fully offset its adverse impact
5.While curtailing the Exp Govt
should give priority to protect High
Priority Dev Exp as described in
MTFP
Govt should nominate
Public Exp Review
Committee. The committee
should submit a review
report to the Govt indicating
where the deviations from
fiscal targets have occurred
2. Whenever there is
shortfall in Rev or excess
exp over the limit, Govt
should make proportionate
reduction in voted Exp or
increase Rev
3. Fin minister should
explain the reasons and
nature of the deviation and
remedial measures which
have been taken to address
it.
1.Budget & policies should be
consistent with MTFP
2. Minister incharge shall review
every half year the trends in receipts
& exp, remedial measures to be
taken to achieve the budget targets
and review report should be placed
before the legislative assembly.
Minister should state if there is any
deviation in meeting obligations,
causes and should propose remedial
measures
3. Whenever outstanding risk
weighted guarantees exceed the
prescribed limit, no fresh guarantees
shall be given.
4. Any proposed measure in the
course of fin year which may lead to
increase in RD (either through
enhanced exp or rev shortfall) shall
be accompanied by remedial
measures to neutralize the same
5.State Govt may assign an
independent external body to carry
out periodical review of compliance
Minister incharge shall review
every half year the trends in
receipts & exp, remedial
measures to be taken to
achieve the budget targets and
review report should be placed
before the legislative
assembly. Minister should
state if there is any deviation
in meeting obligations, causes
and should propose remedial
measures
2. Any proposed measure in
the course of fin year which
may lead to increase in RD
(either through enhanced exp
or rev shortfall) shall be
accompanied by remedial
measures to neutralize the
same
3.State Govt may assign an
agency independent of Govt to
carry out periodical review of
compliance
Power to
Make
Rules
State Govt by notification in Official
Gazette can make Rules for carrying
out provisions of this Act and Rules
made should be laid before legislature
State Govt by notification in
Official Gazette can make
Rules for carrying out
provisions of this Act and
Rules made should be laid
before legislature
State Govt can make Rules for
carrying out provisions of this Act
and Rules made should be laid
before legislative assembly
State Govt by notification in
Official Gazette can make
Rules for carrying out
provisions of this Act and
Rules made should be laid
before legislature
Amend
ments
2009: 1.FD has been raised to 3.5%
of estimated GSDP for the year 2008-
2011: Postponement of
target date to March 2015 to
2004: -Target date extended to Mar
2008 for RD & FD
2010: Target rate for FD was
hiked from 3% of GSDP to
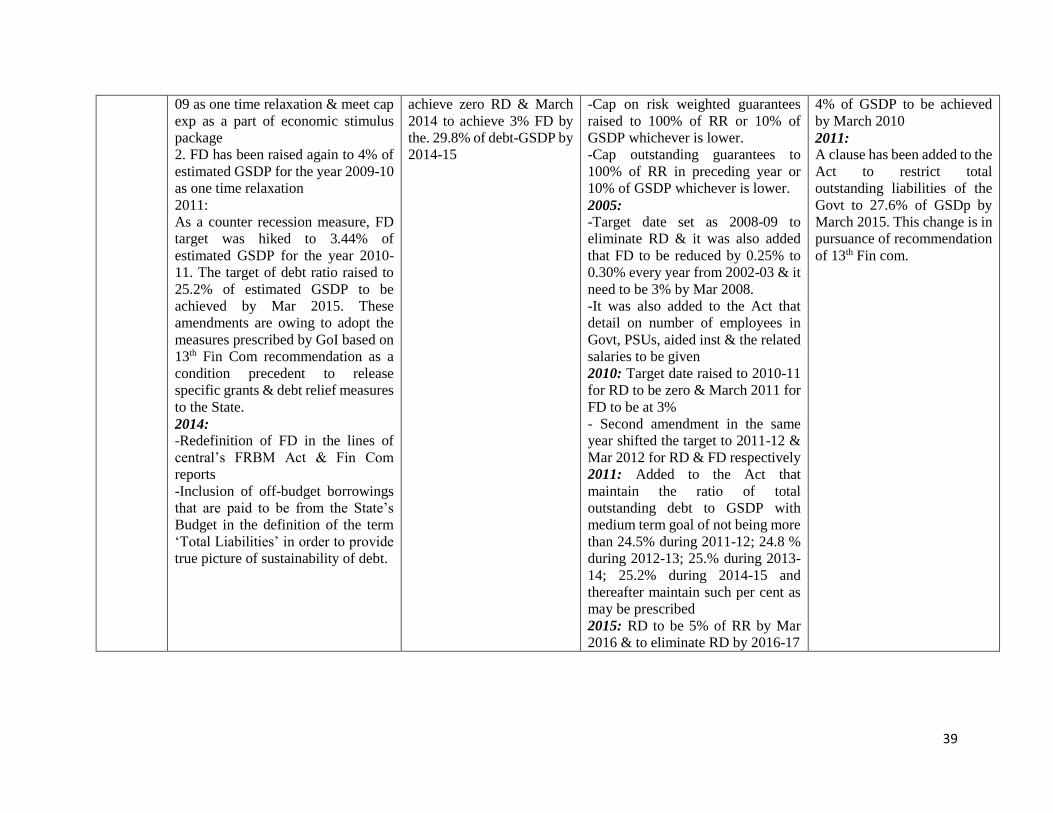
39
09 as one time relaxation & meet cap
exp as a part of economic stimulus
package
2. FD has been raised again to 4% of
estimated GSDP for the year 2009-10
as one time relaxation
2011:
As a counter recession measure, FD
target was hiked to 3.44% of
estimated GSDP for the year 2010-
11. The target of debt ratio raised to
25.2% of estimated GSDP to be
achieved by Mar 2015. These
amendments are owing to adopt the
measures prescribed by GoI based on
13th Fin Com recommendation as a
condition precedent to release
specific grants & debt relief measures
to the State.
2014:
-Redefinition of FD in the lines of
central’s FRBM Act & Fin Com
reports
-Inclusion of off-budget borrowings
that are paid to be from the State’s
Budget in the definition of the term
‘Total Liabilities’ in order to provide
true picture of sustainability of debt.
achieve zero RD & March
2014 to achieve 3% FD by
the. 29.8% of debt-GSDP by
2014-15
-Cap on risk weighted guarantees
raised to 100% of RR or 10% of
GSDP whichever is lower.
-Cap outstanding guarantees to
100% of RR in preceding year or
10% of GSDP whichever is lower.
2005:
-Target date set as 2008-09 to
eliminate RD & it was also added
that FD to be reduced by 0.25% to
0.30% every year from 2002-03 & it
need to be 3% by Mar 2008.
-It was also added to the Act that
detail on number of employees in
Govt, PSUs, aided inst & the related
salaries to be given
2010: Target date raised to 2010-11
for RD to be zero & March 2011 for
FD to be at 3%
- Second amendment in the same
year shifted the target to 2011-12 &
Mar 2012 for RD & FD respectively
2011: Added to the Act that
maintain the ratio of total
outstanding debt to GSDP with
medium term goal of not being more
than 24.5% during 2011-12; 24.8 %
during 2012-13; 25.% during 2013-
14; 25.2% during 2014-15 and
thereafter maintain such per cent as
may be prescribed
2015: RD to be 5% of RR by Mar
2016 & to eliminate RD by 2016-17
4% of GSDP to be achieved
by March 2010
2011:
A clause has been added to the
Act to restrict total
outstanding liabilities of the
Govt to 27.6% of GSDp by
March 2015. This change is in
pursuance of recommendation
of 13th Fin com.
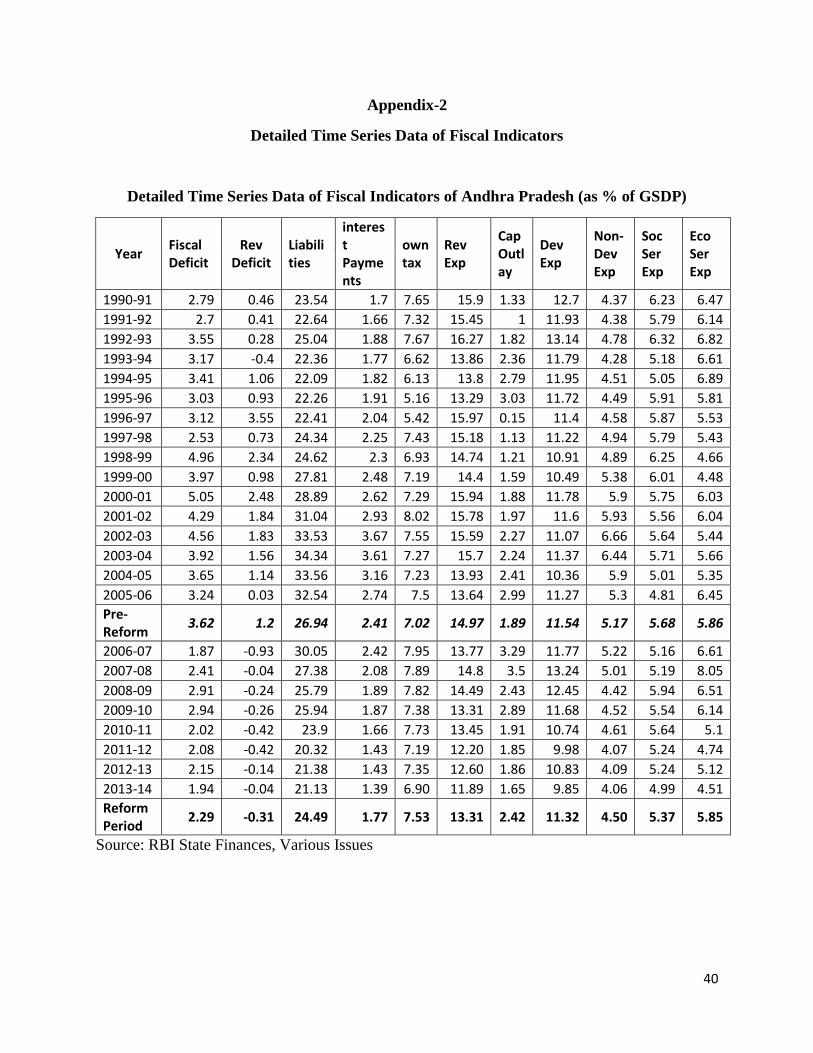
40
Appendix-2
Detailed Time Series Data of Fiscal Indicators
Detailed Time Series Data of Fiscal Indicators of Andhra Pradesh (as % of GSDP)
Year Fiscal Deficit
Rev Deficit
Liabilities
interest Payments
own tax
Rev Exp
Cap Outlay
Dev Exp
Non-Dev Exp
Soc Ser Exp
Eco Ser Exp
1990-91 2.79 0.46 23.54 1.7 7.65 15.9 1.33 12.7 4.37 6.23 6.47
1991-92 2.7 0.41 22.64 1.66 7.32 15.45 1 11.93 4.38 5.79 6.14
1992-93 3.55 0.28 25.04 1.88 7.67 16.27 1.82 13.14 4.78 6.32 6.82
1993-94 3.17 -0.4 22.36 1.77 6.62 13.86 2.36 11.79 4.28 5.18 6.61
1994-95 3.41 1.06 22.09 1.82 6.13 13.8 2.79 11.95 4.51 5.05 6.89
1995-96 3.03 0.93 22.26 1.91 5.16 13.29 3.03 11.72 4.49 5.91 5.81
1996-97 3.12 3.55 22.41 2.04 5.42 15.97 0.15 11.4 4.58 5.87 5.53
1997-98 2.53 0.73 24.34 2.25 7.43 15.18 1.13 11.22 4.94 5.79 5.43
1998-99 4.96 2.34 24.62 2.3 6.93 14.74 1.21 10.91 4.89 6.25 4.66
1999-00 3.97 0.98 27.81 2.48 7.19 14.4 1.59 10.49 5.38 6.01 4.48
2000-01 5.05 2.48 28.89 2.62 7.29 15.94 1.88 11.78 5.9 5.75 6.03
2001-02 4.29 1.84 31.04 2.93 8.02 15.78 1.97 11.6 5.93 5.56 6.04
2002-03 4.56 1.83 33.53 3.67 7.55 15.59 2.27 11.07 6.66 5.64 5.44
2003-04 3.92 1.56 34.34 3.61 7.27 15.7 2.24 11.37 6.44 5.71 5.66
2004-05 3.65 1.14 33.56 3.16 7.23 13.93 2.41 10.36 5.9 5.01 5.35
2005-06 3.24 0.03 32.54 2.74 7.5 13.64 2.99 11.27 5.3 4.81 6.45
Pre-Reform
3.62 1.2 26.94 2.41 7.02 14.97 1.89 11.54 5.17 5.68 5.86
2006-07 1.87 -0.93 30.05 2.42 7.95 13.77 3.29 11.77 5.22 5.16 6.61
2007-08 2.41 -0.04 27.38 2.08 7.89 14.8 3.5 13.24 5.01 5.19 8.05
2008-09 2.91 -0.24 25.79 1.89 7.82 14.49 2.43 12.45 4.42 5.94 6.51
2009-10 2.94 -0.26 25.94 1.87 7.38 13.31 2.89 11.68 4.52 5.54 6.14
2010-11 2.02 -0.42 23.9 1.66 7.73 13.45 1.91 10.74 4.61 5.64 5.1
2011-12 2.08 -0.42 20.32 1.43 7.19 12.20 1.85 9.98 4.07 5.24 4.74
2012-13 2.15 -0.14 21.38 1.43 7.35 12.60 1.86 10.83 4.09 5.24 5.12
2013-14 1.94 -0.04 21.13 1.39 6.90 11.89 1.65 9.85 4.06 4.99 4.51
Reform Period
2.29 -0.31 24.49 1.77 7.53 13.31 2.42 11.32 4.50 5.37 5.85
Source: RBI State Finances, Various Issues
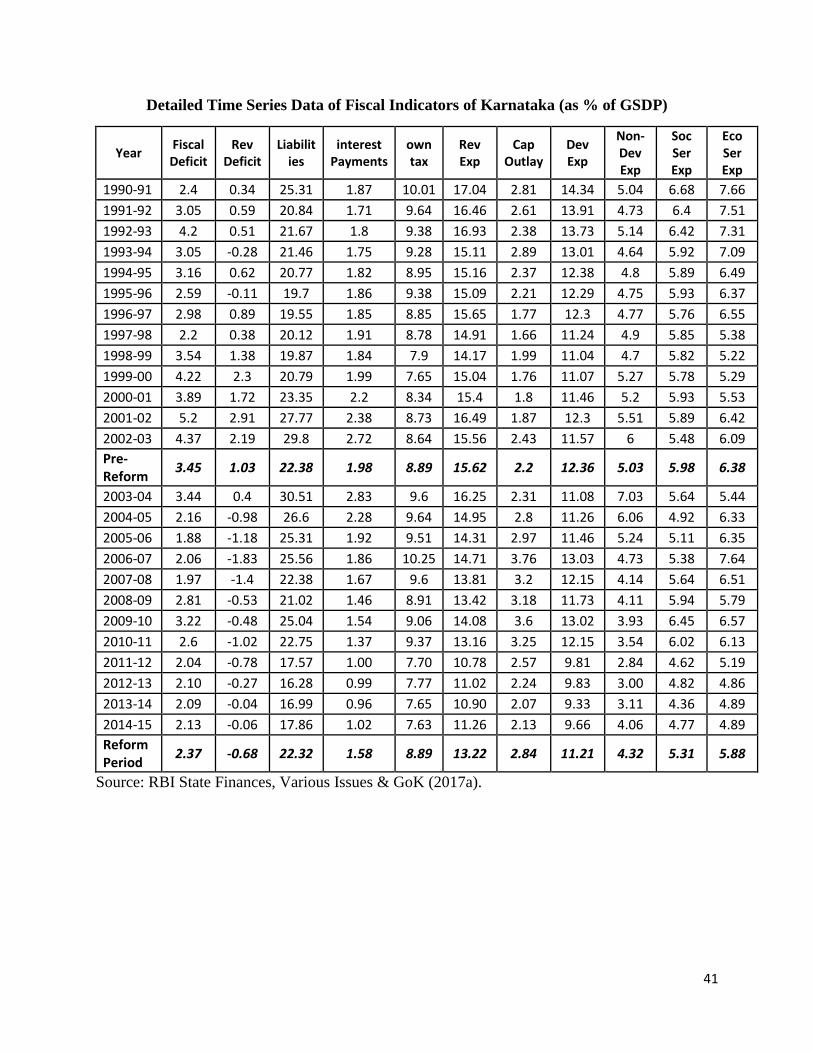
41
Detailed Time Series Data of Fiscal Indicators of Karnataka (as % of GSDP)
Year Fiscal Deficit
Rev Deficit
Liabilities
interest Payments
own tax
Rev Exp
Cap Outlay
Dev Exp
Non-Dev Exp
Soc Ser Exp
Eco Ser Exp
1990-91 2.4 0.34 25.31 1.87 10.01 17.04 2.81 14.34 5.04 6.68 7.66
1991-92 3.05 0.59 20.84 1.71 9.64 16.46 2.61 13.91 4.73 6.4 7.51
1992-93 4.2 0.51 21.67 1.8 9.38 16.93 2.38 13.73 5.14 6.42 7.31
1993-94 3.05 -0.28 21.46 1.75 9.28 15.11 2.89 13.01 4.64 5.92 7.09
1994-95 3.16 0.62 20.77 1.82 8.95 15.16 2.37 12.38 4.8 5.89 6.49
1995-96 2.59 -0.11 19.7 1.86 9.38 15.09 2.21 12.29 4.75 5.93 6.37
1996-97 2.98 0.89 19.55 1.85 8.85 15.65 1.77 12.3 4.77 5.76 6.55
1997-98 2.2 0.38 20.12 1.91 8.78 14.91 1.66 11.24 4.9 5.85 5.38
1998-99 3.54 1.38 19.87 1.84 7.9 14.17 1.99 11.04 4.7 5.82 5.22
1999-00 4.22 2.3 20.79 1.99 7.65 15.04 1.76 11.07 5.27 5.78 5.29
2000-01 3.89 1.72 23.35 2.2 8.34 15.4 1.8 11.46 5.2 5.93 5.53
2001-02 5.2 2.91 27.77 2.38 8.73 16.49 1.87 12.3 5.51 5.89 6.42
2002-03 4.37 2.19 29.8 2.72 8.64 15.56 2.43 11.57 6 5.48 6.09
Pre-Reform
3.45 1.03 22.38 1.98 8.89 15.62 2.2 12.36 5.03 5.98 6.38
2003-04 3.44 0.4 30.51 2.83 9.6 16.25 2.31 11.08 7.03 5.64 5.44
2004-05 2.16 -0.98 26.6 2.28 9.64 14.95 2.8 11.26 6.06 4.92 6.33
2005-06 1.88 -1.18 25.31 1.92 9.51 14.31 2.97 11.46 5.24 5.11 6.35
2006-07 2.06 -1.83 25.56 1.86 10.25 14.71 3.76 13.03 4.73 5.38 7.64
2007-08 1.97 -1.4 22.38 1.67 9.6 13.81 3.2 12.15 4.14 5.64 6.51
2008-09 2.81 -0.53 21.02 1.46 8.91 13.42 3.18 11.73 4.11 5.94 5.79
2009-10 3.22 -0.48 25.04 1.54 9.06 14.08 3.6 13.02 3.93 6.45 6.57
2010-11 2.6 -1.02 22.75 1.37 9.37 13.16 3.25 12.15 3.54 6.02 6.13
2011-12 2.04 -0.78 17.57 1.00 7.70 10.78 2.57 9.81 2.84 4.62 5.19
2012-13 2.10 -0.27 16.28 0.99 7.77 11.02 2.24 9.83 3.00 4.82 4.86
2013-14 2.09 -0.04 16.99 0.96 7.65 10.90 2.07 9.33 3.11 4.36 4.89
2014-15 2.13 -0.06 17.86 1.02 7.63 11.26 2.13 9.66 4.06 4.77 4.89
Reform Period
2.37 -0.68 22.32 1.58 8.89 13.22 2.84 11.21 4.32 5.31 5.88
Source: RBI State Finances, Various Issues & GoK (2017a).
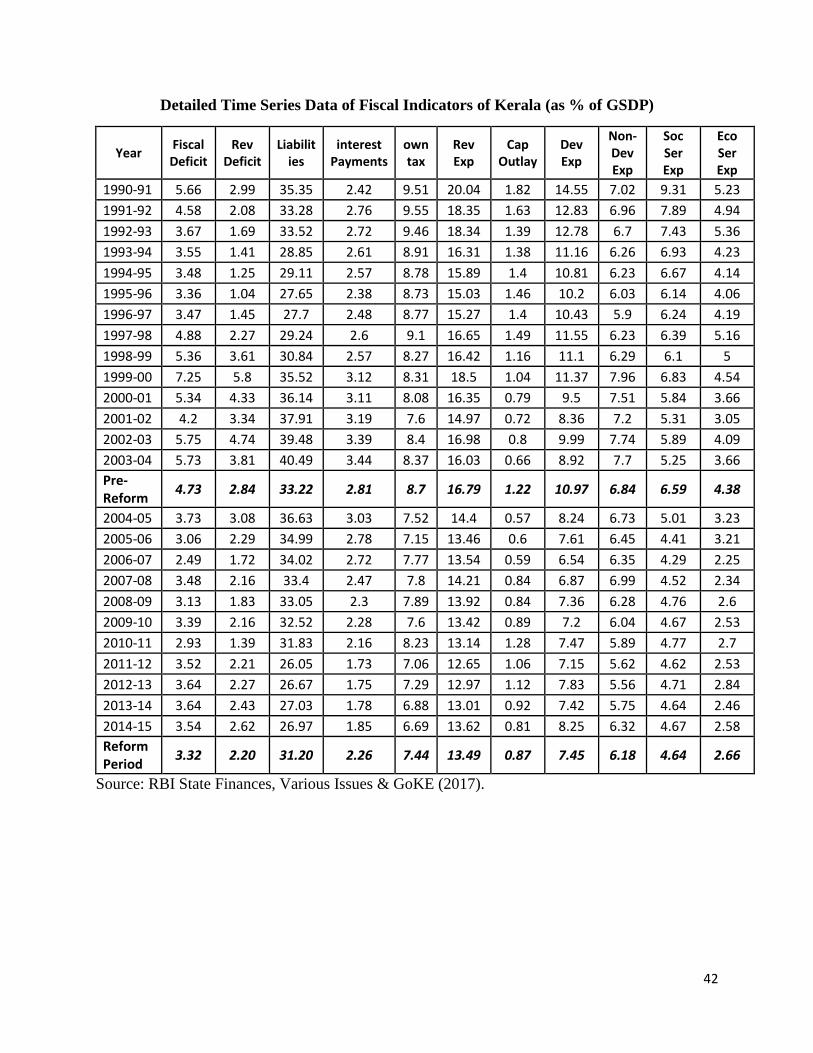
42
Detailed Time Series Data of Fiscal Indicators of Kerala (as % of GSDP)
Year Fiscal Deficit
Rev Deficit
Liabilities
interest Payments
own tax
Rev Exp
Cap Outlay
Dev Exp
Non-Dev Exp
Soc Ser Exp
Eco Ser Exp
1990-91 5.66 2.99 35.35 2.42 9.51 20.04 1.82 14.55 7.02 9.31 5.23
1991-92 4.58 2.08 33.28 2.76 9.55 18.35 1.63 12.83 6.96 7.89 4.94
1992-93 3.67 1.69 33.52 2.72 9.46 18.34 1.39 12.78 6.7 7.43 5.36
1993-94 3.55 1.41 28.85 2.61 8.91 16.31 1.38 11.16 6.26 6.93 4.23
1994-95 3.48 1.25 29.11 2.57 8.78 15.89 1.4 10.81 6.23 6.67 4.14
1995-96 3.36 1.04 27.65 2.38 8.73 15.03 1.46 10.2 6.03 6.14 4.06
1996-97 3.47 1.45 27.7 2.48 8.77 15.27 1.4 10.43 5.9 6.24 4.19
1997-98 4.88 2.27 29.24 2.6 9.1 16.65 1.49 11.55 6.23 6.39 5.16
1998-99 5.36 3.61 30.84 2.57 8.27 16.42 1.16 11.1 6.29 6.1 5
1999-00 7.25 5.8 35.52 3.12 8.31 18.5 1.04 11.37 7.96 6.83 4.54
2000-01 5.34 4.33 36.14 3.11 8.08 16.35 0.79 9.5 7.51 5.84 3.66
2001-02 4.2 3.34 37.91 3.19 7.6 14.97 0.72 8.36 7.2 5.31 3.05
2002-03 5.75 4.74 39.48 3.39 8.4 16.98 0.8 9.99 7.74 5.89 4.09
2003-04 5.73 3.81 40.49 3.44 8.37 16.03 0.66 8.92 7.7 5.25 3.66
Pre-Reform
4.73 2.84 33.22 2.81 8.7 16.79 1.22 10.97 6.84 6.59 4.38
2004-05 3.73 3.08 36.63 3.03 7.52 14.4 0.57 8.24 6.73 5.01 3.23
2005-06 3.06 2.29 34.99 2.78 7.15 13.46 0.6 7.61 6.45 4.41 3.21
2006-07 2.49 1.72 34.02 2.72 7.77 13.54 0.59 6.54 6.35 4.29 2.25
2007-08 3.48 2.16 33.4 2.47 7.8 14.21 0.84 6.87 6.99 4.52 2.34
2008-09 3.13 1.83 33.05 2.3 7.89 13.92 0.84 7.36 6.28 4.76 2.6
2009-10 3.39 2.16 32.52 2.28 7.6 13.42 0.89 7.2 6.04 4.67 2.53
2010-11 2.93 1.39 31.83 2.16 8.23 13.14 1.28 7.47 5.89 4.77 2.7
2011-12 3.52 2.21 26.05 1.73 7.06 12.65 1.06 7.15 5.62 4.62 2.53
2012-13 3.64 2.27 26.67 1.75 7.29 12.97 1.12 7.83 5.56 4.71 2.84
2013-14 3.64 2.43 27.03 1.78 6.88 13.01 0.92 7.42 5.75 4.64 2.46
2014-15 3.54 2.62 26.97 1.85 6.69 13.62 0.81 8.25 6.32 4.67 2.58
Reform Period
3.32 2.20 31.20 2.26 7.44 13.49 0.87 7.45 6.18 4.64 2.66
Source: RBI State Finances, Various Issues & GoKE (2017).

43
Detailed Time Series Data of Fiscal Indicators of Tamil Nadu (as % of GSDP)
Year Fiscal Deficit
Rev Deficit
Liabili interest Payments
own tax
Rev Exp
Cap Outlay
Dev Exp
Non-Dev Exp
Soc Ser Exp
Eco Ser Exp ties
1990-91 3.59 1.77 22.48 1.45 9.97 18 0.71 13.68 4.64 8.11 5.57
1991-92 3.52 5.15 22.57 1.51 10.1 23.49 0.75 19.03 4.65 8.02 11.01
1992-93 4.07 3.55 23.73 1.6 9.68 19.86 0.75 15.24 4.67 7.54 7.7
1993-94 2.36 1.2 20.18 1.66 8.34 15.22 0.96 11.61 4.29 6.39 5.22
1994-95 2.18 0.61 19.72 1.59 8.5 14.03 0.99 10.63 4.17 5.76 4.87
1995-96 1.61 0.4 19.35 1.65 9.14 13.95 0.76 10.04 4.36 5.83 4.2
1996-97 2.74 1.24 19.34 1.65 8.95 14.64 1.03 10.68 4.59 5.97 4.7
1997-98 2.05 1.32 18.84 1.7 8.39 14.44 1.42 10.49 4.51 5.66 4.83
1998-99 4.04 2.91 19.62 1.8 8.14 14.97 0.98 10 4.97 6.2 3.8
1999-00 4.01 3.28 22.04 2.02 8.14 15.45 0.48 9.28 5.77 5.9 3.38
2000-01 3.46 2.34 23.53 2.13 8.37 14.82 1.05 9.41 5.69 5.74 3.67
2001-02 3.18 1.84 26.25 2.36 8.74 14.48 1.19 9.1 5.99 5.6 3.5
2002-03 4.26 3.07 28.12 2.61 9.07 16.24 1.03 9.92 6.38 5.43 4.49
2003-04 3.19 0.89 29.51 2.68 9.09 14.41 2.05 9.43 6.19 5.76 3.67
Pre-Reform 3.16 2.11 22.52 1.89 8.9 16 1.01 11.32 5.06 6.28 5.04
2004-05 2.54 0.32 25.56 2.17 8.84 13.31 2.08 8.82 5.68 5.54 3.28
2005-06 0.87 -0.76 24.76 1.77 9.05 12.41 1.57 8.15 5.05 4.82 3.33
2006-07 1.27 -0.85 22.08 1.77 8.94 12.32 1.92 8.56 4.9 4.56 4
2007-08 1.05 -1.3 21.06 1.73 8.44 12.25 2.13 8.75 4.68 4.84 3.91
2008-09 2.13 -0.36 21.47 1.49 8.39 13.35 2.27 9.94 4.69 5.68 4.26
2009-10 2.46 0.74 21.2 1.39 7.62 12.38 1.79 8.99 4.35 5.23 3.76
2010-11 2.85 0.47 19.57 1.36 8.17 12.47 2.13 9.03 4.57 5.65 3.38
2011-12 2.30 -0.18 17.38 1.18 7.92 11.16 2.17 8.45 3.90 5.07 3.38
2012-13 1.93 -0.21 17.86 1.19 8.33 11.35 1.70 8.77 3.77 5.12 3.11
2013-14 2.12 0.18 18.49 1.28 7.59 11.31 1.77 8.61 3.75 5.35 3.04
2014-15 2.49 0.59 17.56 1.44 7.20 11.79 1.63 9.90 3.92 5.00 3.60
Reform Period
2.00 -0.12 20.64 1.52 8.23 12.19 1.92 8.91 4.48 5.17 3.55
Source: RBI State Finances, Various Issues & GoTN (2017)