GOURMET’S DELIGHT MUSHROOMS POST ... MODEL – 1YR STORM 13 HYDRAFLOW MODEL – 2YR - 100YR...
145
GOURMET’S DELIGHT MUSHROOMS POST-CONSTRUCTION STORMWATER MANAGEMENT NARRATIVE Prepared by: April 2016 Revised August 2016
Transcript of GOURMET’S DELIGHT MUSHROOMS POST ... MODEL – 1YR STORM 13 HYDRAFLOW MODEL – 2YR - 100YR...

GOURMET’S DELIGHT MUSHROOMS
POST-CONSTRUCTION STORMWATER MANAGEMENT
NARRATIVE
Prepared by:
April 2016 Revised August 2016


Table of Contents
NARRATIVE
INTRODUCTION 1 PURPOSE 1 STORMWATER MANAGEMENT NARRATIVE 1 FIGURE 1 - LOCATION MAP 4 TABLE 1 – VOLUME & PEAK RUNOFF SUMMARY 5 APPENDIX
7
STORMWATER PEAK CALCULATIONS 9 RUNOFF CURVE NUMBER CALCULATIONS 11 HYDRAFLOW MODEL – 1YR STORM 13 HYDRAFLOW MODEL – 2YR - 100YR SUMMARY 43 STORMWATER VOLUME CALCULATIONS 49 INFILTRATION TESTS 57 DEWATER CALCULATIONS 61 WEIR CAPACITY 65 DOWNSPOUT CAPACITY 73 ANTI-SEEP COLLAR CALCULATIONS 81 RIP-RAP CALCULATIONS 85 STORMSEWER CALCULATIONS 91 WAST WATER LAGOON SIZING 115 NOI APPENDIX “D” WORKSHEETS 119 SOILS DATA TABLE 135 WORKSHEET #22 – PLAN WRITER CREDENTIALS 139


GOURMET’S DELIGHT MUSHROOMS
STORMWATER MANAGEMENT PLAN GENERAL INFORMATION This project consists of the construction of a new agricultural facility on an existing 32.2298 +/- acre parcel. An existing dwelling and several outbuildings will remain and will continue to be utilized by the landowners. The tract is situated on the west side of Auburn Road in Franklin Township, Chester County (see Figure 1). No new streets are proposed as part of the project. The parcel will access Auburn Road via a new driveway entrance and will be served by on-lot water and sewer. The tract of land has moderately sloping terrain ranging from 3% to 25% that drains to Indian Run – TSF/MF. During the last five years, the fields have been used as a spray irrigation area for the compost/growing operation on the adjoining farm. The entire property has been farmed for the last fifty years. PURPOSE The purpose of this narrative is to describe methodologies used to manage the increased runoff peak and volume of flow from the land development during and after construction of the residential facilities and appurtenances. A professional, experienced in post construction stormwater management design methods and techniques prepared this plan for the applicant.
• The Erosion & Sedimentation Control Plan and the Post Construction Stormwater Management Plan have been designed to be consistent with each other in such a way as to preserve the integrity of stream channels.
• Precautions have been built into the plans in order to maintain and protect the physical, biological, and chemical qualities of the receiving stream.
SOILS Glenlg (GeB) soils are mapped within the project boundary as identified in the Soil Survey of Chester and Delaware Counties, Pennsylvania. The silt loams present on the site are moderately well-drained soils with slopes of 3-25% percent. They have a hydrologic soil group classification of B. Detailed soils information can be found in the attached appendix. This site does not fall under Act 2 nor are there any known karst soils within the project. There are several pockets of wetlands present on the site that have been delineated by a qualified wetlands specialist. A detailed wetlands report can be provided upon request.
STORMWATER MANAGEMENT Post construction stormwater calculations were based solely on the area within the limit of disturbance. This was further broken down into three distinct drainage areas. A drywell located along the driveway in Drainage Area #2 is being proposed to lower post construction peak rates but is not being utilized as an infiltration practice. The wet pond and infiltration basin will capture runoff from the roof areas of the buildings, the majority of the access and parking areas, and a portion of the proposed vegetated area. An area upslope of the wet pond will serve as a filter strip between the driveway and the pond. The area immediately below the infiltration basin will be restored to a natural meadow condition. Storm sewers will discharge to the forebay, which will overflow to both the wet pond and the infiltration basin. The
1
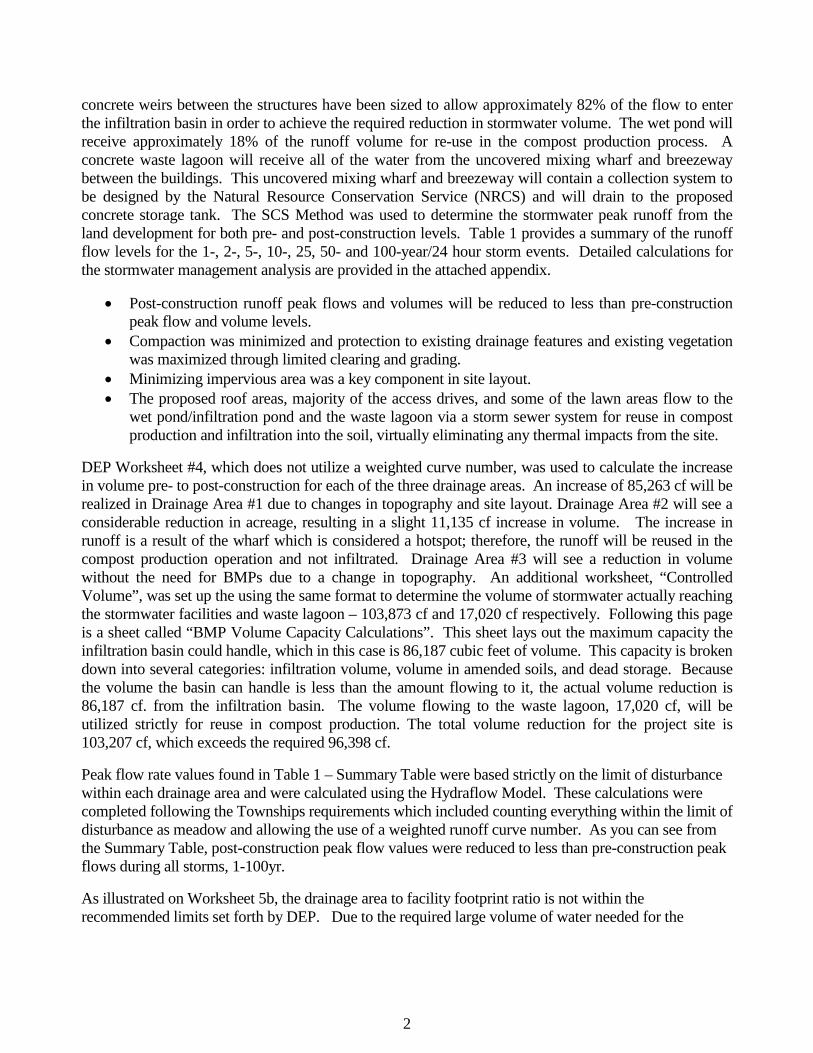
concrete weirs between the structures have been sized to allow approximately 82% of the flow to enter the infiltration basin in order to achieve the required reduction in stormwater volume. The wet pond will receive approximately 18% of the runoff volume for re-use in the compost production process. A concrete waste lagoon will receive all of the water from the uncovered mixing wharf and breezeway between the buildings. This uncovered mixing wharf and breezeway will contain a collection system to be designed by the Natural Resource Conservation Service (NRCS) and will drain to the proposed concrete storage tank. The SCS Method was used to determine the stormwater peak runoff from the land development for both pre- and post-construction levels. Table 1 provides a summary of the runoff flow levels for the 1-, 2-, 5-, 10-, 25, 50- and 100-year/24 hour storm events. Detailed calculations for the stormwater management analysis are provided in the attached appendix.
• Post-construction runoff peak flows and volumes will be reduced to less than pre-construction peak flow and volume levels.
• Compaction was minimized and protection to existing drainage features and existing vegetation was maximized through limited clearing and grading.
• Minimizing impervious area was a key component in site layout. • The proposed roof areas, majority of the access drives, and some of the lawn areas flow to the
wet pond/infiltration pond and the waste lagoon via a storm sewer system for reuse in compost production and infiltration into the soil, virtually eliminating any thermal impacts from the site.
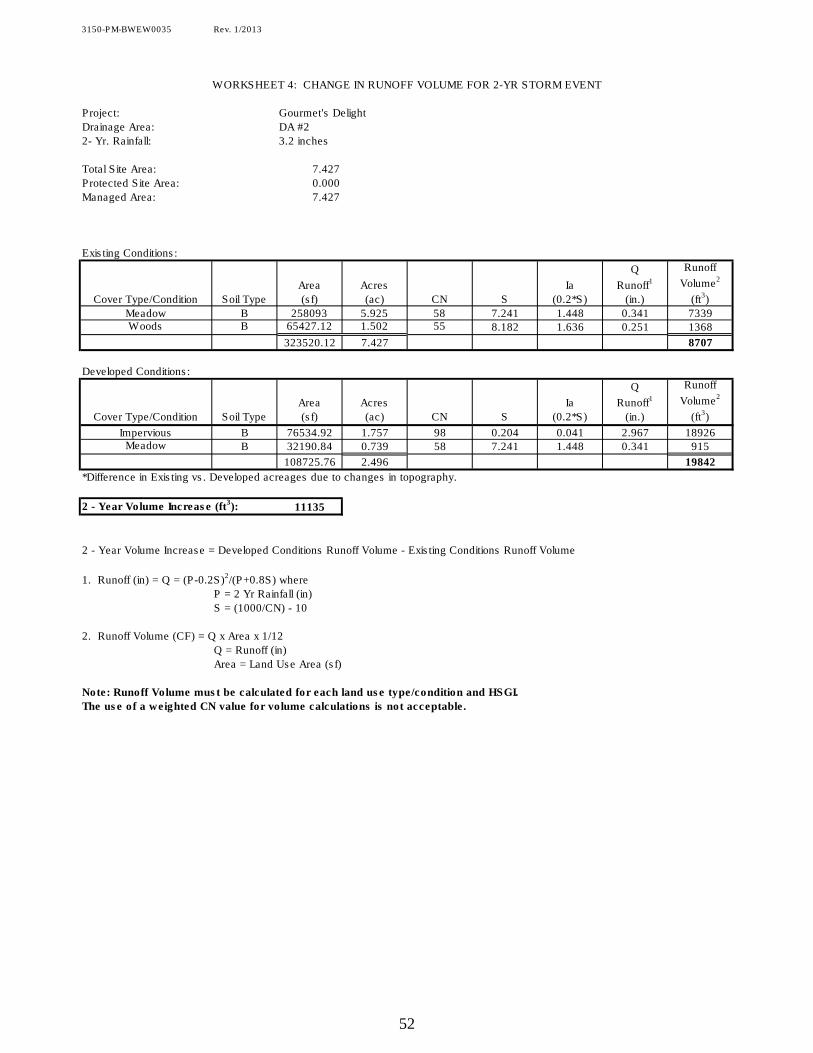
DEP Worksheet #4, which does not utilize a weighted curve number, was used to calculate the increase in volume pre- to post-construction for each of the three drainage areas. An increase of 85,263 cf will be realized in Drainage Area #1 due to changes in topography and site layout. Drainage Area #2 will see a considerable reduction in acreage, resulting in a slight 11,135 cf increase in volume. The increase in runoff is a result of the wharf which is considered a hotspot; therefore, the runoff will be reused in the compost production operation and not infiltrated. Drainage Area #3 will see a reduction in volume without the need for BMPs due to a change in topography. An additional worksheet, “Controlled Volume”, was set up the using the same format to determine the volume of stormwater actually reaching the stormwater facilities and waste lagoon – 103,873 cf and 17,020 cf respectively. Following this page is a sheet called “BMP Volume Capacity Calculations”. This sheet lays out the maximum capacity the infiltration basin could handle, which in this case is 86,187 cubic feet of volume. This capacity is broken down into several categories: infiltration volume, volume in amended soils, and dead storage. Because the volume the basin can handle is less than the amount flowing to it, the actual volume reduction is 86,187 cf. from the infiltration basin. The volume flowing to the waste lagoon, 17,020 cf, will be utilized strictly for reuse in compost production. The total volume reduction for the project site is 103,207 cf, which exceeds the required 96,398 cf. Peak flow rate values found in Table 1 – Summary Table were based strictly on the limit of disturbance within each drainage area and were calculated using the Hydraflow Model. These calculations were completed following the Townships requirements which included counting everything within the limit of disturbance as meadow and allowing the use of a weighted runoff curve number. As you can see from the Summary Table, post-construction peak flow values were reduced to less than pre-construction peak flows during all storms, 1-100yr. As illustrated on Worksheet 5b, the drainage area to facility footprint ratio is not within the recommended limits set forth by DEP. Due to the required large volume of water needed for the
2

compost production occurring on-site, some of the stormwater is being diverted to the wet pond. In actuality, once compost production reaches the anticipated capacity, the wet pond and waste water lagoon combined will not provide enough water. The weirs between the basins have been designed to allow approximately 82% of the water to flow to the infiltration basin and the other 18% to flow to the wet pond. Due to these circumstances, it is anticipated that the high ratio limits will not have an effect on the longevity of the facility.
3

600 0 600 1200 1800 Feet
N
GOURMET'S DELIGHTFIGURE 1
LOCATION MAP
SITELOCATION
4

PE
AK
RU
NO
FF
.
Tc
1-Y
r2
-Yr
5-Y
r1
0-Y
r2
5-Y
r5
0-Y
r1
00
-Yr
Mo
de
lin
g ID
No
.S
ub
are
a ID
No
.A
cre
sR
CN
(min
)(c
fs)
(cfs
)(c
fs)
(cfs
)(c
fs)
(cfs
)(c
fs)
Ex
isti
ng
Co
nd
itio
ns
DA
#1
9.7
85
57
.71
6.5
00
.58
92
.15
55
.96
51
0.0
60
16
.93
02
3.3
10
30
.68
0
DA
#2
7.4
27
57
.41
3.2
00
.47
21
.84
55
.29
88
.84
31
.72
02
0.1
60
26
.43
0
DA
#3
0.0
61
58
.05
.00
0.0
06
0.0
22
0.0
57
0.0
90
0.1
45
0.1
95
0.2
53
Po
st-
de
ve
lop
me
nt D
A #
1U
ncon
trolle
d1
.13
45
8.0
11
.60
0.0
87
0.3
18
0.8
63
1.4
15
2.3
26
3.1
67
4.1
35
DA
to F
ore
bay
- N
on
LD
4.5
25
60
.32
6.9
00
.42
71
.13
32
.67
34
.26
56
.90
69
.33
21
2.1
20
DA
to F
ore
bay
- w
/in
LD
13
.58
28
2.3
5.0
02
3.7
20
32
.91
04
7.1
20
59
.23
07
7.1
80
92
.36
01
08
.80
0
Tota
l D
A t
o F
ore
bay
18
.10
72
3.7
70
33
.15
04
7.9
70
60
.88
08
0.2
90
96
.86
01
14
.93
0
Flo
w t
o I
nfiltra
tion
Basin
19
.49
02
7.1
80
39
.34
04
9.9
20
65
.83
07
9.4
20
94
.25
0
Flo
w t
o W
et
Pon
d4
.24
95
.96
78
.63
51
0.9
60
14
.45
01
7.4
30
20
.69
0
Wet
Pon
d R
ou
ted
0.9
30
1.5
26
2.6
83
3.7
95
5.5
81
7.3
14
9.9
61
DA
#1
-Tota
l P
roposed P
ost
Rou
tin
g0
.95
01
.56
8*
2.7
75
4.0
85
6.3
33
8.4
34
10
.93
0
DA
#2
Un
con
trolle
d0
.60
66
3.8
11
.00
0.1
78
0.3
84
0.7
53
1.1
00
1.6
55
2.1
61
2.7
47
DA
to D
ryw
ell
0.5
16
64
.91
6.9
00
.14
70
.30
50
.59
10
.85
91
.28
71
.67
12
.11
4
Dry
well
Rou
ted
0.0
47
0.2
59
0.5
94
0.8
59
1.2
93
1.6
83
2.1
22
DA
#2
-Tota
l P
roposed P
ost
Rou
tin
g0
.17
80
.47
11
.25
21
.90
72
.89
83
.78
84
.79
5
DA
#3
Un
con
trolle
d0
.01
25
8.0
5.0
00
.00
10
.00
40
.01
10
.01
80
.02
90
.03
80
.05
0
*NO
TE
S -
(1
) T
he
fig
ure
s i
n t
his
ta
ble
are
fro
m t
he
Hyd
rafl
ow
Mo
de
l.
(2)
Dif
fere
nc
es
in
Ex
isti
ng
an
d P
os
t-D
eve
lop
me
nt
Ac
rea
ge
s a
re d
ue
to
ch
an
ge
s i
n t
op
og
rap
hy.
(3)
On
ce
th
e n
on
-re
gu
late
d a
rea
(D
A t
o B
as
in-N
on
LD
) is
re
mo
ve
d f
rom
to
tal,
th
e 2
yr
po
st
co
ns
tru
cti
on
is
re
du
ce
d t
o l
es
s t
ha
n
the
1yr
pre
-co
ns
tru
cti
on
(1
.56
8 c
fs -
1.1
33
cfs
= 0
.43
5 c
fs <
0.5
89
cfs
)
Go
urm
et'
s D
elig
ht
Mu
sh
roo
ms
Tab
le 1
- R
un
off
Su
mm
ary
5

This page intentionally left blank.
6

APPENDIX
7

This page intentionally left blank.
8

STORMWATER PEAK CALCULATIONS
9

This page intentionally left blank.
10

DA
HY
GROUP
ACTUAL
LAND USE
MODELED
LAND USE ACRES RCN
WTD.
RCN
1 B Meadow Meadow 8.652 58 501.816
1 B Woods Woods 1.134 55 62.37
9.786 564.186 57.7
2 B Meadow Meadow 5.925 58 343.65
2 B Woods Woods 1.502 55 82.61
7.427 426.26 57.4
3 B Meadow Meadow 0.061 58 3.538
0.061 3.538 58.0
GOURMET'S DELIGHT MUSHROOMS
RUNOFF CURVE NUMBER (RCN) CALCULATION
EXISTING CONDITIONS
11

DA
HY
GROUP LAND USE ACRES RCN
WTD.
RCN
UNC -1 B Meadow 1.134 58 65.772
1.134 65.772 58.0
UNC-2 B Impervious 0.088 98 8.624
UNC-2 B Meadow 0.518 58 30.044
0.606 38.668 63.8
UNC-3 B Meadow 0.012 58 0.696
0.012 0.696 58.0
BASIN NON-LD B Impervious 0.295 98 28.91
BASIN NON-LD B Meadow 3.770 58 218.66
BASIN NON-LD B Woods 0.460 55 25.3
4.525 272.87 60.3
BASIN-LD B Impervious 8.266 98 810.068
BASIN-LD B Meadow 5.260 58 305.08
BASIN-LD B Woods 0.056 55 3.08
13.582 1118.228 82.3
DRYWELL #1 B Impervious 0.089 98 8.722
DRYWELL #1 B Meadow 0.427 58 24.766
0.516 33.488 64.9
TANK B Impervious 1.580 98 154.84
1.580 154.84 98.0
RUNOFF CURVE NUMBER (RCN) CALCULATION
PROPOSED CONDITIONS
GOURMET'S DELIGHT MUSHROOMS
12

Watershed Model SchematicHydraflow Hydrographs by Intelisolve v9.02
Project: Benmark Hydro.gpw Friday, Aug 12, 2016
Hyd. Origin Description
Legend
1 SCS Runoff DA #1 - Existing
2 SCS Runoff DA #1 - Proposed Uncontrolled
3 SCS Runoff DA #1 Controlled Forebay (Non-LD)
4 SCS Runoff DA #1 - Controlled Forebay (w/In LD)
5 Combine Total DA to Forebay
6 Diversion1 Flow to Infiltration Basin
7 Diversion2 Flow to Wet Pond
8 Reservoir Wet Pond Routed
9 Combine DA #1 - Total Proposed Post Routing
11 Reservoir Basin Plugged Routed
13 SCS Runoff DA #2 Existing
14 SCS Runoff DA #2 - Uncontrolled
15 SCS Runoff DA #2 - Controlled Drywell
16 Reservoir Drywell Routed
17 Combine DA #2 - Total Proposed Post Routing
19 SCS Runoff DA #3 - Existing
20 SCS Runoff DA #3 - Uncontrolled
13

Hydrograph Return Period Recap
Hyd. Hydrograph Inflow Peak Outflow (cfs) Hydrograph
No. type Hyd(s) description
(origin) 1-Yr 2-Yr 3-Yr 5-Yr 10-Yr 25-Yr 50-Yr 100-Yr
1 SCS Runoff ------- 0.589 2.155 ------- 5.965 10.06 16.93 23.31 30.68 DA #1 - Existing
2 SCS Runoff ------- 0.087 0.318 ------- 0.863 1.415 2.326 3.167 4.135 DA #1 - Proposed Uncontrolled
3 SCS Runoff ------- 0.427 1.133 ------- 2.673 4.265 6.906 9.332 12.12 DA #1 Controlled Forebay (Non-LD)
4 SCS Runoff ------- 23.72 32.91 ------- 47.12 59.23 77.18 92.36 108.80 DA #1 - Controlled Forebay (w/In LD)
5 Combine 3, 4 23.77 33.15 ------- 47.97 60.88 80.29 96.86 114.93 Total DA to Forebay
6 Diversion1 5 19.49 27.18 ------- 39.34 49.92 65.83 79.42 94.25 Flow to Infiltration Basin
7 Diversion2 5 4.279 5.967 ------- 8.635 10.96 14.45 17.43 20.69 Flow to Wet Pond
8 Reservoir 5 0.930 1.526 ------- 2.683 3.795 5.581 7.314 9.961 Wet Pond Routed
9 Combine 2, 8 0.950 1.568 ------- 2.775 4.085 6.333 8.434 10.93 DA #1 - Total Proposed Post Routing
11 Reservoir 5 0.000 0.000 ------- 0.000 0.000 0.609 1.739 3.767 Basin Plugged Routed
13 SCS Runoff ------- 0.472 1.845 ------- 5.298 8.843 14.72 20.16 26.43 DA #2 Existing
14 SCS Runoff ------- 0.178 0.384 ------- 0.753 1.100 1.655 2.161 2.747 DA #2 - Uncontrolled
15 SCS Runoff ------- 0.147 0.305 ------- 0.591 0.859 1.287 1.671 2.114 DA #2 - Controlled Drywell
16 Reservoir 15 0.047 0.259 ------- 0.594 0.859 1.293 1.683 2.122 Drywell Routed
17 Combine 14, 16 0.178 0.471 ------- 1.252 1.907 2.898 3.788 4.795 DA #2 - Total Proposed Post Routing
19 SCS Runoff ------- 0.006 0.022 ------- 0.057 0.090 0.145 0.195 0.253 DA #3 - Existing
20 SCS Runoff ------- 0.001 0.004 ------- 0.011 0.018 0.029 0.038 0.050 DA #3 - Uncontrolled
Proj. file: Benmark Hydro.gpw Friday, Aug 12, 2016
Hydraflow Hydrographs by Intelisolve v9.02
14

Hydrograph Summary Report
Hyd. Hydrograph Peak Time Time to Hyd. Inflow Maximum Total Hydrograph
No. type flow interval peak volume hyd(s) elevation strge used description
(origin) (cfs) (min) (min) (cuft) (ft) (cuft)
1 SCS Runoff 0.589 3 735 6,488 ---- ------ ------ DA #1 - Existing
2 SCS Runoff 0.087 3 726 755 ---- ------ ------ DA #1 - Proposed Uncontrolled
3 SCS Runoff 0.427 3 738 3,945 ---- ------ ------ DA #1 Controlled Forebay (Non-LD)
4 SCS Runoff 23.72 3 717 53,873 ---- ------ ------ DA #1 - Controlled Forebay (w/In LD)
5 Combine 23.77 3 717 57,817 3, 4 ------ ------ Total DA to Forebay
6 Diversion1 19.49 3 717 47,410 5 ------ ------ Flow to Infiltration Basin
7 Diversion2 4.279 3 717 10,407 5 ------ ------ Flow to Wet Pond
8 Reservoir 0.930 3 873 57,744 5 389.43 181,004 Wet Pond Routed
9 Combine 0.950 3 867 58,499 2, 8 ------ ------ DA #1 - Total Proposed Post Routing
11 Reservoir 0.000 3 n/a 0 5 389.76 206,082 Basin Plugged Routed
13 SCS Runoff 0.472 3 726 4,604 ---- ------ ------ DA #2 Existing
14 SCS Runoff 0.178 3 723 744 ---- ------ ------ DA #2 - Uncontrolled
15 SCS Runoff 0.147 3 726 719 ---- ------ ------ DA #2 - Controlled Drywell
16 Reservoir 0.047 3 753 541 15 403.48 198 Drywell Routed
17 Combine 0.178 3 723 1,285 14, 16 ------ ------ DA #2 - Total Proposed Post Routing
19 SCS Runoff 0.006 3 723 38 ---- ------ ------ DA #3 - Existing
20 SCS Runoff 0.001 3 723 7 ---- ------ ------ DA #3 - Uncontrolled
Benmark Hydro.gpw Return Period: 1 Year Friday, Aug 12, 2016
Hydraflow Hydrographs by Intelisolve v9.02
15

Hydrograph Report
Hydraflow Hydrographs by Intelisolve v9.02 Friday, Aug 12, 2016
Hyd. No. 1
DA #1 - Existing
Hydrograph type = SCS Runoff Peak discharge = 0.589 cfsStorm frequency = 1 yrs Time to peak = 735 minTime interval = 3 min Hyd. volume = 6,488 cuftDrainage area = 9.785 ac Curve number = 57.7Basin Slope = 0.0 % Hydraulic length = 0 ftTc method = TR55 Time of conc. (Tc) = 16.50 minTotal precip. = 2.70 in Distribution = Type IIStorm duration = 24 hrs Shape factor = 484
0 180 360 540 720 900 1080 1260 1440 1620
Q (cfs)
0.00 0.00
0.10 0.10
0.20 0.20
0.30 0.30
0.40 0.40
0.50 0.50
0.60 0.60
0.70 0.70
0.80 0.80
0.90 0.90
1.00 1.00
Q (cfs)
Time (min)
DA #1 - Existing
Hyd. No. 1 -- 1 Year
Hyd No. 1
16
TR55 Tc Worksheet
Hydraflow Hydrographs by Intelisolve v9.02
Hyd. No. 1
DA #1 - Existing
Description A B C Totals
Sheet FlowManning's n-value = 0.240 0.011 0.011Flow length (ft) = 150.0 0.0 0.0Two-year 24-hr precip. (in) = 3.26 0.00 0.00Land slope (%) = 4.60 0.00 0.00
Travel Time (min) = 14.01 + 0.00 + 0.00 = 14.01
Shallow Concentrated FlowFlow length (ft) = 595.00 0.00 0.00Watercourse slope (%) = 6.20 0.00 0.00Surface description = Unpaved Paved PavedAverage velocity (ft/s) = 4.02 0.00 0.00
Travel Time (min) = 2.47 + 0.00 + 0.00 = 2.47
Channel FlowX sectional flow area (sqft) = 0.00 0.00 0.00Wetted perimeter (ft) = 0.00 0.00 0.00Channel slope (%) = 0.00 0.00 0.00Manning's n-value = 0.015 0.015 0.015Velocity (ft/s) = 0.00 0.00 0.00Flow length (ft) = 0.0 0.0 0.0
Travel Time (min) = 0.00 + 0.00 + 0.00 = 0.00
Total Travel Time, Tc .............................................................................. 16.50 min
17

Hydrograph Report
Hydraflow Hydrographs by Intelisolve v9.02 Friday, Aug 12, 2016
Hyd. No. 2
DA #1 - Proposed Uncontrolled
Hydrograph type = SCS Runoff Peak discharge = 0.087 cfsStorm frequency = 1 yrs Time to peak = 726 minTime interval = 3 min Hyd. volume = 755 cuftDrainage area = 1.134 ac Curve number = 58Basin Slope = 0.0 % Hydraulic length = 0 ftTc method = TR55 Time of conc. (Tc) = 11.60 minTotal precip. = 2.70 in Distribution = Type IIStorm duration = 24 hrs Shape factor = 484
0 180 360 540 720 900 1080 1260 1440 1620
Q (cfs)
0.00 0.00
0.01 0.01
0.02 0.02
0.03 0.03
0.04 0.04
0.05 0.05
0.06 0.06
0.07 0.07
0.08 0.08
0.09 0.09
0.10 0.10
Q (cfs)
Time (min)
DA #1 - Proposed Uncontrolled
Hyd. No. 2 -- 1 Year
Hyd No. 2
18
TR55 Tc Worksheet
Hydraflow Hydrographs by Intelisolve v9.02
Hyd. No. 2
DA #1 - Proposed Uncontrolled
Description A B C Totals
Sheet FlowManning's n-value = 0.240 0.011 0.011Flow length (ft) = 150.0 0.0 0.0Two-year 24-hr precip. (in) = 3.26 0.00 0.00Land slope (%) = 8.20 0.00 0.00
Travel Time (min) = 11.12 + 0.00 + 0.00 = 11.12
Shallow Concentrated FlowFlow length (ft) = 115.00 0.00 0.00Watercourse slope (%) = 6.30 0.00 0.00Surface description = Unpaved Paved PavedAverage velocity (ft/s) = 4.05 0.00 0.00
Travel Time (min) = 0.47 + 0.00 + 0.00 = 0.47
Channel FlowX sectional flow area (sqft) = 0.00 0.00 0.00Wetted perimeter (ft) = 0.00 0.00 0.00Channel slope (%) = 0.00 0.00 0.00Manning's n-value = 0.015 0.015 0.015Velocity (ft/s) = 0.00 0.00 0.00Flow length (ft) = 0.0 0.0 0.0
Travel Time (min) = 0.00 + 0.00 + 0.00 = 0.00
Total Travel Time, Tc .............................................................................. 11.60 min
19

Hydrograph Report
Hydraflow Hydrographs by Intelisolve v9.02 Friday, Aug 12, 2016
Hyd. No. 3
DA #1 Controlled Forebay (Non-LD)
Hydrograph type = SCS Runoff Peak discharge = 0.427 cfsStorm frequency = 1 yrs Time to peak = 738 minTime interval = 3 min Hyd. volume = 3,945 cuftDrainage area = 4.525 ac Curve number = 60.3Basin Slope = 0.0 % Hydraulic length = 0 ftTc method = TR55 Time of conc. (Tc) = 26.90 minTotal precip. = 2.70 in Distribution = Type IIStorm duration = 24 hrs Shape factor = 484
0 180 360 540 720 900 1080 1260 1440 1620
Q (cfs)
0.00 0.00
0.05 0.05
0.10 0.10
0.15 0.15
0.20 0.20
0.25 0.25
0.30 0.30
0.35 0.35
0.40 0.40
0.45 0.45
0.50 0.50
Q (cfs)
Time (min)
DA #1 Controlled Forebay (Non-LD)
Hyd. No. 3 -- 1 Year
Hyd No. 3
20

TR55 Tc Worksheet
Hydraflow Hydrographs by Intelisolve v9.02
Hyd. No. 3
DA #1 Controlled Forebay (Non-LD)
Description A B C Totals
Sheet FlowManning's n-value = 0.240 0.011 0.011Flow length (ft) = 150.0 0.0 0.0Two-year 24-hr precip. (in) = 3.26 0.00 0.00Land slope (%) = 1.00 0.00 0.00
Travel Time (min) = 25.80 + 0.00 + 0.00 = 25.80
Shallow Concentrated FlowFlow length (ft) = 260.00 0.00 0.00Watercourse slope (%) = 6.30 0.00 0.00Surface description = Unpaved Paved PavedAverage velocity (ft/s) = 4.05 0.00 0.00
Travel Time (min) = 1.07 + 0.00 + 0.00 = 1.07
Channel FlowX sectional flow area (sqft) = 0.00 0.00 0.00Wetted perimeter (ft) = 0.00 0.00 0.00Channel slope (%) = 0.00 0.00 0.00Manning's n-value = 0.015 0.015 0.015Velocity (ft/s) = 0.00 0.00 0.00Flow length (ft) = 0.0 0.0 0.0
Travel Time (min) = 0.00 + 0.00 + 0.00 = 0.00
Total Travel Time, Tc .............................................................................. 26.90 min
21

Hydrograph Report
Hydraflow Hydrographs by Intelisolve v9.02 Friday, Aug 12, 2016
Hyd. No. 4
DA #1 - Controlled Forebay (w/In LD)
Hydrograph type = SCS Runoff Peak discharge = 23.72 cfsStorm frequency = 1 yrs Time to peak = 717 minTime interval = 3 min Hyd. volume = 53,873 cuftDrainage area = 13.582 ac Curve number = 82.3Basin Slope = 0.0 % Hydraulic length = 0 ftTc method = USER Time of conc. (Tc) = 5.00 minTotal precip. = 2.70 in Distribution = Type IIStorm duration = 24 hrs Shape factor = 484
0 180 360 540 720 900 1080 1260 1440 1620
Q (cfs)
0.00 0.00
4.00 4.00
8.00 8.00
12.00 12.00
16.00 16.00
20.00 20.00
24.00 24.00
Q (cfs)
Time (min)
DA #1 - Controlled Forebay (w/In LD)
Hyd. No. 4 -- 1 Year
Hyd No. 4
22

Hydrograph Report
Hydraflow Hydrographs by Intelisolve v9.02 Friday, Aug 12, 2016
Hyd. No. 5
Total DA to Forebay
Hydrograph type = Combine Peak discharge = 23.77 cfsStorm frequency = 1 yrs Time to peak = 717 minTime interval = 3 min Hyd. volume = 57,817 cuftInflow hyds. = 3, 4 Contrib. drain. area = 18.107 ac
0 180 360 540 720 900 1080 1260 1440 1620
Q (cfs)
0.00 0.00
4.00 4.00
8.00 8.00
12.00 12.00
16.00 16.00
20.00 20.00
24.00 24.00
Q (cfs)
Time (min)
Total DA to Forebay
Hyd. No. 5 -- 1 Year
Hyd No. 5 Hyd No. 3 Hyd No. 4
23

Hydrograph Report
Hydraflow Hydrographs by Intelisolve v9.02 Friday, Aug 12, 2016
Hyd. No. 6
Flow to Infiltration Basin
Hydrograph type = Diversion1 Peak discharge = 19.49 cfsStorm frequency = 1 yrs Time to peak = 717 minTime interval = 3 min Hyd. volume = 47,410 cuftInflow hydrograph = 5 - Total DA to Forebay 2nd diverted hyd. = 7 Diversion method = Flow Ratio Flow ratio = 0.82
0 180 360 540 720 900 1080 1260 1440 1620
Q (cfs)
0.00 0.00
4.00 4.00
8.00 8.00
12.00 12.00
16.00 16.00
20.00 20.00
24.00 24.00
Q (cfs)
Time (min)
Flow to Infiltration Basin
Hyd. No. 6 -- 1 Year
Hyd No. 6 -- Q = 0.82 x Qin Hyd No. 5 -- Inflow Hyd No. 7 -- 5 minus 6
24

Hydrograph Report
Hydraflow Hydrographs by Intelisolve v9.02 Friday, Aug 12, 2016
Hyd. No. 7
Flow to Wet Pond
Hydrograph type = Diversion2 Peak discharge = 4.279 cfsStorm frequency = 1 yrs Time to peak = 717 minTime interval = 3 min Hyd. volume = 10,407 cuftInflow hydrograph = 5 - Total DA to Forebay 2nd diverted hyd. = 6 Diversion method = Flow Ratio Flow ratio = 0.82
0 180 360 540 720 900 1080 1260 1440 1620
Q (cfs)
0.00 0.00
4.00 4.00
8.00 8.00
12.00 12.00
16.00 16.00
20.00 20.00
24.00 24.00
Q (cfs)
Time (min)
Flow to Wet Pond
Hyd. No. 7 -- 1 Year
Hyd No. 7 -- Q = 0.18 x Qin Hyd No. 5 -- Inflow Hyd No. 6
25

Hydrograph Report
Hydraflow Hydrographs by Intelisolve v9.02 Friday, Aug 12, 2016
Hyd. No. 8
Wet Pond Routed
Hydrograph type = Reservoir Peak discharge = 0.930 cfsStorm frequency = 1 yrs Time to peak = 873 minTime interval = 3 min Hyd. volume = 57,744 cuftInflow hyd. No. = 5 - Total DA to Forebay Max. Elevation = 389.43 ftReservoir name = Wet Pond Max. Storage = 181,004 cuft
Storage Indication method used. Wet pond routing start elevation = 389.00 ft.
0 540 1080 1620 2160 2700 3240 3780 4320 4860 5400 5940
Q (cfs)
0.00 0.00
4.00 4.00
8.00 8.00
12.00 12.00
16.00 16.00
20.00 20.00
24.00 24.00
Q (cfs)
Time (min)
Wet Pond Routed
Hyd. No. 8 -- 1 Year
Hyd No. 8 Hyd No. 5 Total storage used = 181,004 cuft
26

Pond ReportHydraflow Hydrographs by Intelisolve v9.02 Friday, Aug 12, 2016
Pond No. 1 - Wet Pond
Pond Data
Contours - User-defined contour areas. Conic method used for volume calculation. Begining Elevation = 382.00 ft
Stage / Storage Table
Stage (ft) Elevation (ft) Contour area (sqft) Incr. Storage (cuft) Total storage (cuft)
0.00 382.00 11,390 0 02.00 384.00 15,118 26,418 26,4184.00 386.00 19,226 34,258 60,6766.00 388.00 23,771 42,912 103,5887.00 389.00 69,597 44,676 148,2658.00 390.00 81,789 75,604 223,868
10.00 392.00 97,203 178,753 402,62110.50 392.50 100,490 49,416 452,037
Culvert / Orifice Structures Weir Structures
[A] [B] [C] [PrfRsr] [A] [B] [C] [D]
Rise (in) = 15.00 0.00 0.00 0.00
Span (in) = 15.00 0.00 0.00 0.00
No. Barrels = 1 0 0 0
Invert El. (ft) = 382.00 0.00 0.00 0.00
Length (ft) = 80.00 0.00 0.00 0.00
Slope (%) = 2.50 0.00 0.00 n/a
N-Value = .013 .013 .013 n/a
Orifice Coeff. = 0.60 0.60 0.60 0.60
Multi-Stage = n/a No No No
Crest Len (ft) = 20.00 1.25 30.00 0.00
Crest El. (ft) = 391.00 389.00 391.50 0.00
Weir Coeff. = 3.33 2.60 3.33 3.33
Weir Type = Riser Rect Broad ---
Multi-Stage = Yes Yes No No
Exfil.(in/hr) = 0.000 (by Contour)
TW Elev. (ft) = 0.00
Note: Culvert/Orifice outflows are analyzed under inlet and outlet control. Weir risers are checked for orifice conditions.
0.0 10.0 20.0 30.0 40.0 50.0 60.0 70.0 80.0 90.0 100.0 110.0 120.0
Stage (ft)
0.00 382.00
2.00 384.00
4.00 386.00
6.00 388.00
8.00 390.00
10.00 392.00
12.00 394.00
Elev (ft)
Discharge (cfs)
Stage / Discharge
Total Q
27

Hydrograph Report
Hydraflow Hydrographs by Intelisolve v9.02 Friday, Aug 12, 2016
Hyd. No. 9
DA #1 - Total Proposed Post Routing
Hydrograph type = Combine Peak discharge = 0.950 cfsStorm frequency = 1 yrs Time to peak = 867 minTime interval = 3 min Hyd. volume = 58,499 cuftInflow hyds. = 2, 8 Contrib. drain. area = 1.134 ac
0 540 1080 1620 2160 2700 3240 3780 4320 4860 5400 5940
Q (cfs)
0.00 0.00
0.10 0.10
0.20 0.20
0.30 0.30
0.40 0.40
0.50 0.50
0.60 0.60
0.70 0.70
0.80 0.80
0.90 0.90
1.00 1.00
Q (cfs)
Time (min)
DA #1 - Total Proposed Post Routing
Hyd. No. 9 -- 1 Year
Hyd No. 9 Hyd No. 2 Hyd No. 8
28

Hydrograph Report
Hydraflow Hydrographs by Intelisolve v9.02 Friday, Aug 12, 2016
Hyd. No. 11
Basin Plugged Routed
Hydrograph type = Reservoir Peak discharge = 0.000 cfsStorm frequency = 1 yrs Time to peak = n/aTime interval = 3 min Hyd. volume = 0 cuftInflow hyd. No. = 5 - Total DA to Forebay Max. Elevation = 389.76 ftReservoir name = Wet Pond Plugged Max. Storage = 206,082 cuft
Storage Indication method used. Wet pond routing start elevation = 389.00 ft.
0 180 360 540 720 900 1080 1260 1440 1620
Q (cfs)
0.00 0.00
4.00 4.00
8.00 8.00
12.00 12.00
16.00 16.00
20.00 20.00
24.00 24.00
Q (cfs)
Time (min)
Basin Plugged Routed
Hyd. No. 11 -- 1 Year
Hyd No. 11 Hyd No. 5 Total storage used = 206,082 cuft
29

Pond ReportHydraflow Hydrographs by Intelisolve v9.02 Friday, Aug 12, 2016
Pond No. 2 - Wet Pond Plugged
Pond Data
Contours - User-defined contour areas. Conic method used for volume calculation. Begining Elevation = 382.00 ft
Stage / Storage Table
Stage (ft) Elevation (ft) Contour area (sqft) Incr. Storage (cuft) Total storage (cuft)
0.00 382.00 11,390 0 02.00 384.00 15,118 26,418 26,4184.00 386.00 19,226 34,258 60,6766.00 388.00 23,771 42,912 103,5887.00 389.00 69,597 44,676 148,2658.00 390.00 81,789 75,604 223,868
10.00 392.00 97,203 178,753 402,62110.50 392.50 100,490 49,416 452,037
Culvert / Orifice Structures Weir Structures
[A] [B] [C] [PrfRsr] [A] [B] [C] [D]
Rise (in) = 0.00 0.00 0.00 0.00
Span (in) = 0.00 0.00 0.00 0.00
No. Barrels = 0 0 0 0
Invert El. (ft) = 0.00 0.00 0.00 0.00
Length (ft) = 0.00 0.00 0.00 0.00
Slope (%) = 0.00 0.00 0.00 n/a
N-Value = .013 .013 .013 n/a
Orifice Coeff. = 0.60 0.60 0.60 0.60
Multi-Stage = n/a No No No
Crest Len (ft) = 30.00 0.00 0.00 0.00
Crest El. (ft) = 391.50 0.00 0.00 0.00
Weir Coeff. = 3.33 3.33 3.33 3.33
Weir Type = Broad --- --- ---
Multi-Stage = No No No No
Exfil.(in/hr) = 0.000 (by Contour)
TW Elev. (ft) = 0.00
Note: Culvert/Orifice outflows are analyzed under inlet and outlet control. Weir risers are checked for orifice conditions.
0.00 10.00 20.00 30.00 40.00 50.00 60.00 70.00 80.00 90.00 100.00
Stage (ft)
0.00 382.00
2.00 384.00
4.00 386.00
6.00 388.00
8.00 390.00
10.00 392.00
12.00 394.00
Elev (ft)
Discharge (cfs)
Stage / Discharge
Total Q
30

Hydrograph Report
Hydraflow Hydrographs by Intelisolve v9.02 Friday, Aug 12, 2016
Hyd. No. 13
DA #2 Existing
Hydrograph type = SCS Runoff Peak discharge = 0.472 cfsStorm frequency = 1 yrs Time to peak = 726 minTime interval = 3 min Hyd. volume = 4,604 cuftDrainage area = 7.427 ac Curve number = 57.4Basin Slope = 0.0 % Hydraulic length = 0 ftTc method = TR55 Time of conc. (Tc) = 13.20 minTotal precip. = 2.70 in Distribution = Type IIStorm duration = 24 hrs Shape factor = 484
0 180 360 540 720 900 1080 1260 1440 1620
Q (cfs)
0.00 0.00
0.05 0.05
0.10 0.10
0.15 0.15
0.20 0.20
0.25 0.25
0.30 0.30
0.35 0.35
0.40 0.40
0.45 0.45
0.50 0.50
Q (cfs)
Time (min)
DA #2 Existing
Hyd. No. 13 -- 1 Year
Hyd No. 13
31

TR55 Tc Worksheet
Hydraflow Hydrographs by Intelisolve v9.02
Hyd. No. 13
DA #2 Existing
Description A B C Totals
Sheet FlowManning's n-value = 0.240 0.011 0.011Flow length (ft) = 150.0 0.0 0.0Two-year 24-hr precip. (in) = 3.26 0.00 0.00Land slope (%) = 6.70 0.00 0.00
Travel Time (min) = 12.06 + 0.00 + 0.00 = 12.06
Shallow Concentrated FlowFlow length (ft) = 250.00 0.00 0.00Watercourse slope (%) = 5.00 0.00 0.00Surface description = Unpaved Paved PavedAverage velocity (ft/s) = 3.61 0.00 0.00
Travel Time (min) = 1.15 + 0.00 + 0.00 = 1.15
Channel FlowX sectional flow area (sqft) = 0.00 0.00 0.00Wetted perimeter (ft) = 0.00 0.00 0.00Channel slope (%) = 0.00 0.00 0.00Manning's n-value = 0.015 0.015 0.015Velocity (ft/s) = 0.00 0.00 0.00Flow length (ft) = 0.0 0.0 0.0
Travel Time (min) = 0.00 + 0.00 + 0.00 = 0.00
Total Travel Time, Tc .............................................................................. 13.20 min
32

Hydrograph Report
Hydraflow Hydrographs by Intelisolve v9.02 Friday, Aug 12, 2016
Hyd. No. 14
DA #2 - Uncontrolled
Hydrograph type = SCS Runoff Peak discharge = 0.178 cfsStorm frequency = 1 yrs Time to peak = 723 minTime interval = 3 min Hyd. volume = 744 cuftDrainage area = 0.606 ac Curve number = 63.8Basin Slope = 0.0 % Hydraulic length = 0 ftTc method = TR55 Time of conc. (Tc) = 11.00 minTotal precip. = 2.70 in Distribution = Type IIStorm duration = 24 hrs Shape factor = 484
0 180 360 540 720 900 1080 1260 1440 1620
Q (cfs)
0.00 0.00
0.05 0.05
0.10 0.10
0.15 0.15
0.20 0.20
0.25 0.25
0.30 0.30
0.35 0.35
0.40 0.40
0.45 0.45
0.50 0.50
Q (cfs)
Time (min)
DA #2 - Uncontrolled
Hyd. No. 14 -- 1 Year
Hyd No. 14
33

TR55 Tc Worksheet
Hydraflow Hydrographs by Intelisolve v9.02
Hyd. No. 14
DA #2 - Uncontrolled
Description A B C Totals
Sheet FlowManning's n-value = 0.240 0.011 0.011Flow length (ft) = 150.0 0.0 0.0Two-year 24-hr precip. (in) = 3.26 0.00 0.00Land slope (%) = 8.50 0.00 0.00
Travel Time (min) = 10.96 + 0.00 + 0.00 = 10.96
Shallow Concentrated FlowFlow length (ft) = 15.00 0.00 0.00Watercourse slope (%) = 6.00 0.00 0.00Surface description = Unpaved Paved PavedAverage velocity (ft/s) = 3.95 0.00 0.00
Travel Time (min) = 0.06 + 0.00 + 0.00 = 0.06
Channel FlowX sectional flow area (sqft) = 0.00 0.00 0.00Wetted perimeter (ft) = 0.00 0.00 0.00Channel slope (%) = 0.00 0.00 0.00Manning's n-value = 0.015 0.015 0.015Velocity (ft/s) = 0.00 0.00 0.00Flow length (ft) = 0.0 0.0 0.0
Travel Time (min) = 0.00 + 0.00 + 0.00 = 0.00
Total Travel Time, Tc .............................................................................. 11.00 min
34

Hydrograph Report
Hydraflow Hydrographs by Intelisolve v9.02 Friday, Aug 12, 2016
Hyd. No. 15
DA #2 - Controlled Drywell
Hydrograph type = SCS Runoff Peak discharge = 0.147 cfsStorm frequency = 1 yrs Time to peak = 726 minTime interval = 3 min Hyd. volume = 719 cuftDrainage area = 0.516 ac Curve number = 64.9Basin Slope = 0.0 % Hydraulic length = 0 ftTc method = TR55 Time of conc. (Tc) = 16.90 minTotal precip. = 2.70 in Distribution = Type IIStorm duration = 24 hrs Shape factor = 484
0 180 360 540 720 900 1080 1260 1440 1620
Q (cfs)
0.00 0.00
0.05 0.05
0.10 0.10
0.15 0.15
0.20 0.20
0.25 0.25
0.30 0.30
0.35 0.35
0.40 0.40
0.45 0.45
0.50 0.50
Q (cfs)
Time (min)
DA #2 - Controlled Drywell
Hyd. No. 15 -- 1 Year
Hyd No. 15
35

TR55 Tc Worksheet
Hydraflow Hydrographs by Intelisolve v9.02
Hyd. No. 15
DA #2 - Controlled Drywell
Description A B C Totals
Sheet FlowManning's n-value = 0.240 0.011 0.011Flow length (ft) = 150.0 0.0 0.0Two-year 24-hr precip. (in) = 3.26 3.26 0.00Land slope (%) = 3.00 0.00 0.00
Travel Time (min) = 16.63 + 0.00 + 0.00 = 16.63
Shallow Concentrated FlowFlow length (ft) = 110.00 0.00 0.00Watercourse slope (%) = 17.00 0.00 0.00Surface description = Unpaved Paved PavedAverage velocity (ft/s) = 6.65 0.00 0.00
Travel Time (min) = 0.28 + 0.00 + 0.00 = 0.28
Channel FlowX sectional flow area (sqft) = 0.00 0.00 0.00Wetted perimeter (ft) = 0.00 0.00 0.00Channel slope (%) = 0.00 0.00 0.00Manning's n-value = 0.015 0.015 0.015Velocity (ft/s) = 0.00 0.00 0.00Flow length (ft) = 0.0 0.0 0.0
Travel Time (min) = 0.00 + 0.00 + 0.00 = 0.00
Total Travel Time, Tc .............................................................................. 16.90 min
36

Hydrograph Report
Hydraflow Hydrographs by Intelisolve v9.02 Friday, Aug 12, 2016
Hyd. No. 16
Drywell Routed
Hydrograph type = Reservoir Peak discharge = 0.047 cfsStorm frequency = 1 yrs Time to peak = 753 minTime interval = 3 min Hyd. volume = 541 cuftInflow hyd. No. = 15 - DA #2 - Controlled Drywell Max. Elevation = 403.48 ftReservoir name = Drywell #1 Max. Storage = 198 cuft
Storage Indication method used.
0 180 360 540 720 900 1080 1260 1440 1620
Q (cfs)
0.00 0.00
0.05 0.05
0.10 0.10
0.15 0.15
0.20 0.20
0.25 0.25
0.30 0.30
0.35 0.35
0.40 0.40
0.45 0.45
0.50 0.50
Q (cfs)
Time (min)
Drywell Routed
Hyd. No. 16 -- 1 Year
Hyd No. 16 Hyd No. 15 Total storage used = 198 cuft
37

Pond ReportHydraflow Hydrographs by Intelisolve v9.02 Friday, Aug 12, 2016
Pond No. 3 - Drywell #1
Pond Data
UG Chambers - Invert elev. = 403.00 ft, Rise x Span = 0.67 x 0.67 ft, Barrel Len = 32.00 ft, No. Barrels = 2, Slope = 0.00%, Headers = NoEncasement - Invert elev. = 402.50 ft, Width = 7.50 ft, Height = 2.50 ft, Voids = 40.00%
Stage / Storage Table
Stage (ft) Elevation (ft) Contour area (sqft) Incr. Storage (cuft) Total storage (cuft)
0.00 402.50 n/a 0 00.25 402.75 n/a 48 480.50 403.00 n/a 48 960.75 403.25 n/a 53 1491.00 403.50 n/a 54 2031.25 403.75 n/a 51 2541.50 404.00 n/a 48 3021.75 404.25 n/a 48 3502.00 404.50 n/a 48 3982.25 404.75 n/a 48 4462.50 405.00 n/a 48 494
Culvert / Orifice Structures Weir Structures
[A] [B] [C] [PrfRsr] [A] [B] [C] [D]
Rise (in) = 15.00 0.00 0.00 0.00
Span (in) = 15.00 0.00 0.00 0.00
No. Barrels = 1 0 0 0
Invert El. (ft) = 403.38 0.00 0.00 0.00
Length (ft) = 93.00 0.00 0.00 0.00
Slope (%) = 3.30 0.00 0.00 n/a
N-Value = .013 .013 .013 n/a
Orifice Coeff. = 0.60 0.60 0.60 0.60
Multi-Stage = n/a No No No
Crest Len (ft) = 0.00 0.00 0.00 0.00
Crest El. (ft) = 0.00 0.00 0.00 0.00
Weir Coeff. = 3.33 3.33 3.33 3.33
Weir Type = --- --- --- ---
Multi-Stage = No No No No
Exfil.(in/hr) = 0.000 (by Wet area)
TW Elev. (ft) = 0.00
Note: Culvert/Orifice outflows are analyzed under inlet and outlet control. Weir risers are checked for orifice conditions.
0.00 1.00 2.00 3.00 4.00 5.00 6.00
Stage (ft)
0.00 402.50
1.00 403.50
2.00 404.50
3.00 405.50
Elev (ft)
Discharge (cfs)
Stage / Discharge
Total Q
38

Hydrograph Report
Hydraflow Hydrographs by Intelisolve v9.02 Friday, Aug 12, 2016
Hyd. No. 17
DA #2 - Total Proposed Post Routing
Hydrograph type = Combine Peak discharge = 0.178 cfsStorm frequency = 1 yrs Time to peak = 723 minTime interval = 3 min Hyd. volume = 1,285 cuftInflow hyds. = 14, 16 Contrib. drain. area = 0.606 ac
0 180 360 540 720 900 1080 1260 1440 1620
Q (cfs)
0.00 0.00
0.05 0.05
0.10 0.10
0.15 0.15
0.20 0.20
0.25 0.25
0.30 0.30
0.35 0.35
0.40 0.40
0.45 0.45
0.50 0.50
Q (cfs)
Time (min)
DA #2 - Total Proposed Post Routing
Hyd. No. 17 -- 1 Year
Hyd No. 17 Hyd No. 14 Hyd No. 16
39

Hydrograph Report
Hydraflow Hydrographs by Intelisolve v9.02 Friday, Aug 12, 2016
Hyd. No. 19
DA #3 - Existing
Hydrograph type = SCS Runoff Peak discharge = 0.006 cfsStorm frequency = 1 yrs Time to peak = 723 minTime interval = 3 min Hyd. volume = 38 cuftDrainage area = 0.061 ac Curve number = 58Basin Slope = 0.0 % Hydraulic length = 0 ftTc method = USER Time of conc. (Tc) = 5.00 minTotal precip. = 2.70 in Distribution = Type IIStorm duration = 24 hrs Shape factor = 484
0 180 360 540 720 900 1080 1260 1440 1620
Q (cfs)
0.00 0.00
0.01 0.01
0.02 0.02
0.03 0.03
0.04 0.04
0.05 0.05
0.06 0.06
0.07 0.07
0.08 0.08
0.09 0.09
0.10 0.10
Q (cfs)
Time (min)
DA #3 - Existing
Hyd. No. 19 -- 1 Year
Hyd No. 19
40

Hydrograph Report
Hydraflow Hydrographs by Intelisolve v9.02 Friday, Aug 12, 2016
Hyd. No. 20
DA #3 - Uncontrolled
Hydrograph type = SCS Runoff Peak discharge = 0.001 cfsStorm frequency = 1 yrs Time to peak = 723 minTime interval = 3 min Hyd. volume = 7 cuftDrainage area = 0.012 ac Curve number = 58Basin Slope = 0.0 % Hydraulic length = 0 ftTc method = USER Time of conc. (Tc) = 5.00 minTotal precip. = 2.70 in Distribution = Type IIStorm duration = 24 hrs Shape factor = 484
0 180 360 540 720 900 1080 1260 1440 1620
Q (cfs)
0.00 0.00
0.01 0.01
0.02 0.02
0.03 0.03
0.04 0.04
0.05 0.05
0.06 0.06
0.07 0.07
0.08 0.08
0.09 0.09
0.10 0.10
Q (cfs)
Time (min)
DA #3 - Uncontrolled
Hyd. No. 20 -- 1 Year
Hyd No. 20
41

Hydraflow Rainfall Report
Hydraflow Hydrographs by Intelisolve v9.02 Friday, Aug 12, 2016
Return Intensity-Duration-Frequency Equation Coefficients (FHA)Period
(Yrs) B D E (N/A)
1 16.4027 3.9000 0.6351 --------
2 33.3274 8.5000 0.7586 --------
3 0.0000 0.0000 0.0000 --------
5 36.3659 7.8000 0.7483 --------
10 42.5539 9.1000 0.7403 --------
25 40.8315 8.7000 0.6906 --------
50 58.6058 11.1000 0.7398 --------
100 84.6606 15.5000 0.7740 --------
File name: PennDOT.IDF
Intensity = B / (Tc + D)^E
Return Intensity Values (in/hr)Period
(Yrs) 5 min 10 15 20 25 30 35 40 45 50 55 60
1 4.09 3.08 2.54 2.19 1.94 1.75 1.60 1.49 1.39 1.30 1.23 1.17
2 4.63 3.64 3.04 2.63 2.32 2.09 1.91 1.75 1.63 1.52 1.43 1.35
3 0.00 0.00 0.00 0.00 0.00 0.00 0.00 0.00 0.00 0.00 0.00 0.00
5 5.40 4.22 3.50 3.02 2.67 2.40 2.19 2.01 1.87 1.75 1.64 1.55
10 6.00 4.79 4.03 3.51 3.12 2.82 2.58 2.38 2.22 2.08 1.96 1.85
25 6.70 5.40 4.59 4.02 3.60 3.27 3.01 2.79 2.61 2.45 2.32 2.20
50 7.50 6.14 5.25 4.61 4.13 3.75 3.44 3.19 2.98 2.80 2.64 2.50
100 8.17 6.90 6.01 5.34 4.83 4.41 4.07 3.78 3.54 3.33 3.14 2.98
Tc = time in minutes. Values may exceed 60.
Rainfall Precipitation Table (in)
Precip. file name: NOAA Franklin Twp.pcp
StormDistribution 1-yr 2-yr 3-yr 5-yr 10-yr 25-yr 50-yr 100-yr
SCS 24-hour 2.70 3.26 0.00 4.09 4.78 5.79 6.64 7.56
SCS 6-Hr 0.00 1.80 0.00 0.00 2.60 0.00 0.00 4.00
Huff-1st 0.00 1.55 0.00 2.75 4.00 5.38 6.50 8.00
Huff-2nd 0.00 0.00 0.00 0.00 0.00 0.00 0.00 0.00
Huff-3rd 0.00 0.00 0.00 0.00 0.00 0.00 0.00 0.00
Huff-4th 0.00 0.00 0.00 0.00 0.00 0.00 0.00 0.00
Huff-Indy 0.00 1.55 0.00 2.75 4.00 5.38 6.50 8.00
Custom 0.00 1.75 0.00 2.80 3.90 5.25 6.00 7.1042

Hydrograph Summary Report
Hyd. Hydrograph Peak Time Time to Hyd. Inflow Maximum Total Hydrograph
No. type flow interval peak volume hyd(s) elevation strge used description
(origin) (cfs) (min) (min) (cuft) (ft) (cuft)
1 SCS Runoff 2.155 3 729 12,897 ---- ------ ------ DA #1 - Existing
2 SCS Runoff 0.318 3 723 1,491 ---- ------ ------ DA #1 - Proposed Uncontrolled
3 SCS Runoff 1.133 3 735 7,267 ---- ------ ------ DA #1 Controlled Forebay (Non-LD)
4 SCS Runoff 32.91 3 717 74,319 ---- ------ ------ DA #1 - Controlled Forebay (w/In LD)
5 Combine 33.15 3 717 81,585 3, 4 ------ ------ Total DA to Forebay
6 Diversion1 27.18 3 717 66,900 5 ------ ------ Flow to Infiltration Basin
7 Diversion2 5.967 3 717 14,685 5 ------ ------ Flow to Wet Pond
8 Reservoir 1.526 3 831 81,512 5 389.60 193,916 Wet Pond Routed
9 Combine 1.568 3 825 83,003 2, 8 ------ ------ DA #1 - Total Proposed Post Routing
11 Reservoir 0.000 3 n/a 0 5 390.07 229,850 Basin Plugged Routed
13 SCS Runoff 1.845 3 723 9,219 ---- ------ ------ DA #2 Existing
14 SCS Runoff 0.384 3 723 1,274 ---- ------ ------ DA #2 - Uncontrolled
15 SCS Runoff 0.305 3 726 1,208 ---- ------ ------ DA #2 - Controlled Drywell
16 Reservoir 0.259 3 732 1,030 15 403.61 226 Drywell Routed
17 Combine 0.471 3 732 2,303 14, 16 ------ ------ DA #2 - Total Proposed Post Routing
19 SCS Runoff 0.022 3 720 75 ---- ------ ------ DA #3 - Existing
20 SCS Runoff 0.004 3 720 15 ---- ------ ------ DA #3 - Uncontrolled
Benmark Hydro.gpw Return Period: 2 Year Friday, Aug 12, 2016
Hydraflow Hydrographs by Intelisolve v9.02
43

Hydrograph Summary Report
Hyd. Hydrograph Peak Time Time to Hyd. Inflow Maximum Total Hydrograph
No. type flow interval peak volume hyd(s) elevation strge used description
(origin) (cfs) (min) (min) (cuft) (ft) (cuft)
1 SCS Runoff 5.965 3 726 25,330 ---- ------ ------ DA #1 - Existing
2 SCS Runoff 0.863 3 723 2,907 ---- ------ ------ DA #1 - Proposed Uncontrolled
3 SCS Runoff 2.673 3 732 13,500 ---- ------ ------ DA #1 Controlled Forebay (Non-LD)
4 SCS Runoff 47.12 3 717 106,551 ---- ------ ------ DA #1 - Controlled Forebay (w/In LD)
5 Combine 47.97 3 717 120,050 3, 4 ------ ------ Total DA to Forebay
6 Diversion1 39.34 3 717 98,441 5 ------ ------ Flow to Infiltration Basin
7 Diversion2 8.635 3 717 21,609 5 ------ ------ Flow to Wet Pond
8 Reservoir 2.683 3 804 119,977 5 389.88 214,750 Wet Pond Routed
9 Combine 2.775 3 795 122,884 2, 8 ------ ------ DA #1 - Total Proposed Post Routing
11 Reservoir 0.000 3 n/a 0 5 390.50 268,315 Basin Plugged Routed
13 SCS Runoff 5.298 3 723 18,250 ---- ------ ------ DA #2 Existing
14 SCS Runoff 0.753 3 723 2,226 ---- ------ ------ DA #2 - Uncontrolled
15 SCS Runoff 0.591 3 726 2,077 ---- ------ ------ DA #2 - Controlled Drywell
16 Reservoir 0.594 3 726 1,899 15 403.74 251 Drywell Routed
17 Combine 1.252 3 726 4,125 14, 16 ------ ------ DA #2 - Total Proposed Post Routing
19 SCS Runoff 0.057 3 720 147 ---- ------ ------ DA #3 - Existing
20 SCS Runoff 0.011 3 720 29 ---- ------ ------ DA #3 - Uncontrolled
Benmark Hydro.gpw Return Period: 5 Year Friday, Aug 12, 2016
Hydraflow Hydrographs by Intelisolve v9.02
44

Hydrograph Summary Report
Hyd. Hydrograph Peak Time Time to Hyd. Inflow Maximum Total Hydrograph
No. type flow interval peak volume hyd(s) elevation strge used description
(origin) (cfs) (min) (min) (cuft) (ft) (cuft)
1 SCS Runoff 10.06 3 726 37,787 ---- ------ ------ DA #1 - Existing
2 SCS Runoff 1.415 3 723 4,322 ---- ------ ------ DA #1 - Proposed Uncontrolled
3 SCS Runoff 4.265 3 732 19,609 ---- ------ ------ DA #1 Controlled Forebay (Non-LD)
4 SCS Runoff 59.23 3 717 134,538 ---- ------ ------ DA #1 - Controlled Forebay (w/In LD)
5 Combine 60.88 3 717 154,147 3, 4 ------ ------ Total DA to Forebay
6 Diversion1 49.92 3 717 126,400 5 ------ ------ Flow to Infiltration Basin
7 Diversion2 10.96 3 717 27,746 5 ------ ------ Flow to Wet Pond
8 Reservoir 3.795 3 789 154,073 5 390.11 233,399 Wet Pond Routed
9 Combine 4.085 3 726 158,395 2, 8 ------ ------ DA #1 - Total Proposed Post Routing
11 Reservoir 0.000 3 n/a 0 5 390.88 302,411 Basin Plugged Routed
13 SCS Runoff 8.843 3 723 27,322 ---- ------ ------ DA #2 Existing
14 SCS Runoff 1.100 3 723 3,136 ---- ------ ------ DA #2 - Uncontrolled
15 SCS Runoff 0.859 3 726 2,901 ---- ------ ------ DA #2 - Controlled Drywell
16 Reservoir 0.859 3 726 2,723 15 403.82 266 Drywell Routed
17 Combine 1.907 3 723 5,859 14, 16 ------ ------ DA #2 - Total Proposed Post Routing
19 SCS Runoff 0.090 3 720 218 ---- ------ ------ DA #3 - Existing
20 SCS Runoff 0.018 3 720 43 ---- ------ ------ DA #3 - Uncontrolled
Benmark Hydro.gpw Return Period: 10 Year Friday, Aug 12, 2016
Hydraflow Hydrographs by Intelisolve v9.02
45

Hydrograph Summary Report
Hyd. Hydrograph Peak Time Time to Hyd. Inflow Maximum Total Hydrograph
No. type flow interval peak volume hyd(s) elevation strge used description
(origin) (cfs) (min) (min) (cuft) (ft) (cuft)
1 SCS Runoff 16.93 3 726 58,756 ---- ------ ------ DA #1 - Existing
2 SCS Runoff 2.326 3 723 6,699 ---- ------ ------ DA #1 - Proposed Uncontrolled
3 SCS Runoff 6.906 3 732 29,726 ---- ------ ------ DA #1 Controlled Forebay (Non-LD)
4 SCS Runoff 77.18 3 717 176,798 ---- ------ ------ DA #1 - Controlled Forebay (w/In LD)
5 Combine 80.29 3 717 206,524 3, 4 ------ ------ Total DA to Forebay
6 Diversion1 65.83 3 717 169,350 5 ------ ------ Flow to Infiltration Basin
7 Diversion2 14.45 3 717 37,174 5 ------ ------ Flow to Wet Pond
8 Reservoir 5.581 3 777 206,451 5 390.43 262,569 Wet Pond Routed
9 Combine 6.333 3 726 213,150 2, 8 ------ ------ DA #1 - Total Proposed Post Routing
11 Reservoir 0.609 3 1446 5,788 5 391.44 352,437 Basin Plugged Routed
13 SCS Runoff 14.72 3 723 42,619 ---- ------ ------ DA #2 Existing
14 SCS Runoff 1.655 3 723 4,615 ---- ------ ------ DA #2 - Uncontrolled
15 SCS Runoff 1.287 3 726 4,233 ---- ------ ------ DA #2 - Controlled Drywell
16 Reservoir 1.293 3 726 4,054 15 403.93 287 Drywell Routed
17 Combine 2.898 3 723 8,669 14, 16 ------ ------ DA #2 - Total Proposed Post Routing
19 SCS Runoff 0.145 3 720 338 ---- ------ ------ DA #3 - Existing
20 SCS Runoff 0.029 3 720 66 ---- ------ ------ DA #3 - Uncontrolled
Benmark Hydro.gpw Return Period: 25 Year Friday, Aug 12, 2016
Hydraflow Hydrographs by Intelisolve v9.02
46

Hydrograph Summary Report
Hyd. Hydrograph Peak Time Time to Hyd. Inflow Maximum Total Hydrograph
No. type flow interval peak volume hyd(s) elevation strge used description
(origin) (cfs) (min) (min) (cuft) (ft) (cuft)
1 SCS Runoff 23.31 3 726 78,410 ---- ------ ------ DA #1 - Existing
2 SCS Runoff 3.167 3 723 8,924 ---- ------ ------ DA #1 - Proposed Uncontrolled
3 SCS Runoff 9.332 3 732 39,091 ---- ------ ------ DA #1 Controlled Forebay (Non-LD)
4 SCS Runoff 92.36 3 717 213,193 ---- ------ ------ DA #1 - Controlled Forebay (w/In LD)
5 Combine 96.86 3 717 252,284 3, 4 ------ ------ Total DA to Forebay
6 Diversion1 79.42 3 717 206,873 5 ------ ------ Flow to Infiltration Basin
7 Diversion2 17.43 3 717 45,411 5 ------ ------ Flow to Wet Pond
8 Reservoir 7.314 3 771 252,209 5 390.72 287,853 Wet Pond Routed
9 Combine 8.434 3 726 261,133 2, 8 ------ ------ DA #1 - Total Proposed Post Routing
11 Reservoir 1.739 3 1098 51,547 5 391.51 358,822 Basin Plugged Routed
13 SCS Runoff 20.16 3 723 56,978 ---- ------ ------ DA #2 Existing
14 SCS Runoff 2.161 3 720 5,964 ---- ------ ------ DA #2 - Uncontrolled
15 SCS Runoff 1.671 3 726 5,442 ---- ------ ------ DA #2 - Controlled Drywell
16 Reservoir 1.683 3 726 5,263 15 404.02 304 Drywell Routed
17 Combine 3.788 3 723 11,227 14, 16 ------ ------ DA #2 - Total Proposed Post Routing
19 SCS Runoff 0.195 3 720 450 ---- ------ ------ DA #3 - Existing
20 SCS Runoff 0.038 3 720 89 ---- ------ ------ DA #3 - Uncontrolled
Benmark Hydro.gpw Return Period: 50 Year Friday, Aug 12, 2016
Hydraflow Hydrographs by Intelisolve v9.02
47

Hydrograph Summary Report
Hyd. Hydrograph Peak Time Time to Hyd. Inflow Maximum Total Hydrograph
No. type flow interval peak volume hyd(s) elevation strge used description
(origin) (cfs) (min) (min) (cuft) (ft) (cuft)
1 SCS Runoff 30.68 3 726 101,321 ---- ------ ------ DA #1 - Existing
2 SCS Runoff 4.135 3 723 11,515 ---- ------ ------ DA #1 - Proposed Uncontrolled
3 SCS Runoff 12.12 3 732 49,914 ---- ------ ------ DA #1 Controlled Forebay (Non-LD)
4 SCS Runoff 108.80 3 717 253,181 ---- ------ ------ DA #1 - Controlled Forebay (w/In LD)
5 Combine 114.93 3 717 303,095 3, 4 ------ ------ Total DA to Forebay
6 Diversion1 94.25 3 717 248,538 5 ------ ------ Flow to Infiltration Basin
7 Diversion2 20.69 3 717 54,557 5 ------ ------ Flow to Wet Pond
8 Reservoir 9.961 3 762 303,018 5 391.02 315,354 Wet Pond Routed
9 Combine 10.93 3 726 314,533 2, 8 ------ ------ DA #1 - Total Proposed Post Routing
11 Reservoir 3.767 3 882 102,359 5 391.61 367,684 Basin Plugged Routed
13 SCS Runoff 26.43 3 723 73,733 ---- ------ ------ DA #2 Existing
14 SCS Runoff 2.747 3 720 7,506 ---- ------ ------ DA #2 - Uncontrolled
15 SCS Runoff 2.114 3 723 6,820 ---- ------ ------ DA #2 - Controlled Drywell
16 Reservoir 2.122 3 726 6,642 15 404.11 321 Drywell Routed
17 Combine 4.795 3 723 14,147 14, 16 ------ ------ DA #2 - Total Proposed Post Routing
19 SCS Runoff 0.253 3 720 581 ---- ------ ------ DA #3 - Existing
20 SCS Runoff 0.050 3 720 114 ---- ------ ------ DA #3 - Uncontrolled
Benmark Hydro.gpw Return Period: 100 Year Friday, Aug 12, 2016
Hydraflow Hydrographs by Intelisolve v9.02
48

STORMWATER VOLUME CALCULATIONS
49

This page intentionally left blank.
50

3150-PM-BWEW0035 Rev. 1/2013
Project: Gourmet's Delight
Drainage Area: DA #1
2- Yr. Rainfall: 3.2 inches
Total Site Area: 9.786
Protected Site Area: 0.000
Managed Area: 9.786
Existing Conditions:
Cover Type/Condition Soil Type
Area
(sf)
Acres
(ac) CN S
Ia
(0.2*S)
Q
Runoff1
(in.)
Runoff
Volume2
(ft3)
Meadow B 376881.12 8.652 58 7.241 1.448 0.341 10716Woods B 49397.04 1.134 55 8.182 1.636 0.251 1033
426278.16 9.786 11749
Developed Conditions:
Cover Type/Condition Soil Type
Area
(sf)
Acres
(ac) CN S
Ia
(0.2*S)
Q
Runoff1
(in.)
Runoff
Volume2
(ft3)
Impervious B 360066.96 8.266 98 0.204 0.041 2.967 89041
Meadow B 278522.64 6.394 58 7.241 1.448 0.341 7920Woods B 2439.36 0.056 55 8.182 1.636 0.251 51
641028.96 14.716 97012
*Difference in Existing vs. Developed acreages due to changes in topography.
2 - Year Volume Increase (ft3): 85263
2 - Year Volume Increase = Developed Conditions Runoff Volume - Existing Conditions Runoff Volume
1. Runoff (in) = Q = (P-0.2S)2/(P+0.8S) where
P = 2 Yr Rainfall (in)
S = (1000/CN) - 10
2. Runoff Volume (CF) = Q x Area x 1/12
Q = Runoff (in)
Area = Land Use Area (sf)
Note: Runoff Volume must be calculated for each land use type/condition and HSGI.
The use of a weighted CN value for volume calculations is not acceptable.
WORKSHEET 4: CHANGE IN RUNOFF VOLUME FOR 2-YR STORM EVENT
51
3150-PM-BWEW0035 Rev. 1/2013
Project: Gourmet's Delight
Drainage Area: DA #2
2- Yr. Rainfall: 3.2 inches
Total Site Area: 7.427
Protected Site Area: 0.000
Managed Area: 7.427
Existing Conditions:
Cover Type/Condition Soil Type
Area
(sf)
Acres
(ac) CN S
Ia
(0.2*S)
Q
Runoff1
(in.)
Runoff
Volume2
(ft3)
Meadow B 258093 5.925 58 7.241 1.448 0.341 7339Woods B 65427.12 1.502 55 8.182 1.636 0.251 1368
323520.12 7.427 8707
Developed Conditions:
Cover Type/Condition Soil Type
Area
(sf)
Acres
(ac) CN S
Ia
(0.2*S)
Q
Runoff1
(in.)
Runoff
Volume2
(ft3)
Impervious B 76534.92 1.757 98 0.204 0.041 2.967 18926Meadow B 32190.84 0.739 58 7.241 1.448 0.341 915
108725.76 2.496 19842
*Difference in Existing vs. Developed acreages due to changes in topography.
2 - Year Volume Increase (ft3): 11135
2 - Year Volume Increase = Developed Conditions Runoff Volume - Existing Conditions Runoff Volume
1. Runoff (in) = Q = (P-0.2S)2/(P+0.8S) where
P = 2 Yr Rainfall (in)
S = (1000/CN) - 10
2. Runoff Volume (CF) = Q x Area x 1/12
Q = Runoff (in)
Area = Land Use Area (sf)
Note: Runoff Volume must be calculated for each land use type/condition and HSGI.
The use of a weighted CN value for volume calculations is not acceptable.
WORKSHEET 4: CHANGE IN RUNOFF VOLUME FOR 2-YR STORM EVENT
52

3150-PM-BWEW0035 Rev. 1/2013
Project: Gourmet's Delight
Drainage Area: DA #3
2- Yr. Rainfall: 3.2 inches
Total Site Area: 0.061
Protected Site Area: 0.000
Managed Area: 0.061
Existing Conditions:
Cover Type/Condition Soil Type
Area
(sf)
Acres
(ac) CN S
Ia
(0.2*S)
Q
Runoff1
(in.)
Runoff
Volume2
(ft3)
Meadow B 2657.16 0.061 58 7.241 1.448 0.341 76
2657.16 0.061 76
Developed Conditions:
Cover Type/Condition Soil Type
Area
(sf)
Acres
(ac) CN S
Ia
(0.2*S)
Q
Runoff1
(in.)
Runoff
Volume2
(ft3)
Meadow B 522.72 0.012 58 7.241 1.448 0.341 15
522.72 0.012 15
2 - Year Volume Increase (ft3): -61
2 - Year Volume Increase = Developed Conditions Runoff Volume - Existing Conditions Runoff Volume
1. Runoff (in) = Q = (P-0.2S)2/(P+0.8S) where
P = 2 Yr Rainfall (in)
S = (1000/CN) - 10
2. Runoff Volume (CF) = Q x Area x 1/12
Q = Runoff (in)
Area = Land Use Area (sf)
Note: Runoff Volume must be calculated for each land use type/condition and HSGI.
The use of a weighted CN value for volume calculations is not acceptable.
WORKSHEET 4: CHANGE IN RUNOFF VOLUME FOR 2-YR STORM EVENT
53

DRAINAGE AREA:
2- YR. RAINFALL: 3.2 inches
DA to Infiltration Basin
Land Use Hy Group Acres
Area
(sq. ft.) CN S
Ia
(0.2*S)
Q
Runoff (in.)
Runoff
Volume (ft3)
Impervious B 8.561 372917.16 98.0 0.204 0.041 2.967 92219
Meadow B 9.030 393346.80 58.0 7.241 1.448 0.341 11184
Woods B 0.516 22476.96 55.0 8.182 1.636 0.251 470
18.107 788740.92 103873
DA to Concrete Tank
Land Use Hy Group Acres
Area
(sq. ft.) CN S
Ia
(0.2*S)
Q
Runoff (in.)
Runoff
Volume (ft3)
Tank B 0.259 11282.04 98.0 0.204 0.041 2.967 2790
Wharf B 1.321 57542.76 98.0 0.204 0.041 2.967 14230
1.580 68824.80 17020
Total Controlled: 120893
CONTROLLED VOLUME
GOURMET'S DELIGHT MUSHROOM'S
54

Are
a o
f
Infi
ltra
tio
n
(sf)
2
Ob
serv
ed
Infi
ltra
tio
n
Ra
te
(in
/hr)
Fa
cto
r o
f
Sa
fety
Ap
pli
ed
Infi
ltra
tio
n
Ra
te
(in
/hr)
Du
rati
on
(hr)
Vo
lum
e o
f
Infi
ltra
tio
n
(cf)
Av
g.
Are
a
of
Am
en
de
d
So
ils
(sf)
Bo
tto
m
Ele
v.
Of
Am
en
de
d
So
ils
(ft)
To
p E
lev
.
Of
Mu
lch
(ft)
Av
g.
De
pth
of
Am
en
de
d
So
ils
(ft)
Vo
lum
e o
f
Am
en
de
d
So
ils
(cf)
Vo
id
Ra
tio
Vo
lum
e o
f
Ru
no
ff
Re
ten
tio
n
(cf)
Are
a o
f
De
ad
Sto
rag
e
(sf)
2
Bo
tto
m
Ele
v.
Of
De
ad
Sto
rag
e
(ft)
To
p E
lev
.
Of
De
ad
Sto
rag
e
(ft)
Av
g.
De
pth
of
De
ad
Sto
rag
e
(ft)
Vo
lum
e o
f
De
ad
Sto
rag
e
(cf)
To
tal
Vo
lum
e(2
)
(cf)
0.0
0.0
0.0
0.0
Ba
sin
34
38
95
.62
52
2.8
16
48
35
9.5
34
38
9.0
38
7.0
38
8.0
1.0
34
38
9.0
10
%3
43
8.9
34
38
9.0
38
8.0
38
9.0
01
.00
34
38
9.0
86
18
7.4
0.0
0.0
0.0
0.0
TO
TA
L4
83
59
.50
.00
.00
.08
61
87
.4
(1)
- in
clu
de
s a
me
nd
ed
so
ils
an
d h
ard
wo
od
mu
lch
.C
on
tro
lle
d D
rain
ag
e A
rea
Vo
lum
e3:
10
38
73
(2)
- sq
ua
re f
oo
tag
e o
f th
e b
ott
om
co
nto
ur
of
the
fa
cili
ty.
Act
ua
l C
on
tro
lle
d V
olu
me
4:
86
18
7
(3)
- se
e w
ork
she
et
lab
ele
d "
Co
ntr
oll
ed
Vo
lum
e"
for
de
tail
ed
ca
lcu
lati
on
s
(4)
- T
he
sto
rmw
ate
r fa
cili
ty h
as
the
ca
pa
city
to
ha
nd
le 8
61
87
cf
of
vo
lum
e,
wit
h 1
03
,87
3 c
f fl
ow
ing
to
th
e s
tru
ctu
re,
the
act
ua
l co
ntr
oll
ed
vo
lum
e i
s 8
61
87
cf.
GO
UR
ME
T'S
DE
LIG
HT
MU
SH
RO
OM
'S
BM
P V
OLU
ME
CA
PA
CIT
Y C
ALC
ULA
TIO
NS
Infi
ltra
tio
n V
olu
me
BM
P I
D
De
ad
Sto
rag
e V
olu
me
Vo
lum
e i
n A
me
nd
ed
So
ils1
55

Drainage
Area Existing Proposed 2 Yr Delta
1" Rainfall on
Impervious Infiltration Reuse
#1 11749 97012 85263 23732 85176 18697
#2 8707 19842 11135 5044 0* 17020
#3 76 15 -61 0 0
*DA #2 contains a large impervious hot spot (wharf). Due to the potential polluting characteristics of
this area, the runoff will be reused in the compost production operation and not infiltrated.
Stormwater Volume Summary
Gourmet's Delight
56

INFILTRATION TESTS AND TEST PIT DESCRIPTIONS
57

This page intentionally left blank.
58

SITE INVESTIGATION AND PERCOLATION TEST REPORT FOR STORMWATER MANAGEMENT AREA
DOUBLE-RING INFILTROMETER TEST Project .Gourmet's Delight Mushtooms Municipality: Franklin Township County:Site Location:
Chester Auburn Road Subdivision Name:
SUITABLE Soil Type N/A
GeC3 Slope 8 % Depth to Limiting Zone: UNSUITABLE Mottling Seeps or Ponded Water Bedrock Fractures Coarse Fragments
84"+
Perc. Rate Slope Unstabilized Fill Floodplain Other
SOILS DESCRIPTION: Soils Description Completed by: Kathern Heed SEO #1768 Test Pit 3 Date:
Inches Description of Horizon
08/08/2016
0 TO 7
Dk BrLo, Gran, Fri, Abt
7 TO 32
Rd Br SiLo, Mod Sbk, Firm/Fri, Grad
32 TO 50
Lt Rd Br Miacaceous SiLo, Wk Sbk, Frk, Cl
50 TO 84
Var (Tan, Br, Lt Br) Micaceous SiLo/SiLo, Massive Structureless, Loose
TO
TO
No limiting zone of rock or water
PERCOLATION TEST: Percolation Test Completed by: Crossan-Raimato, Inc. Date:Weather Conditions: Below 40°F 40°F or above Dry Rain, Sleet, Snow (last 24 hours)
08/08/2016
Soil Conditions: Wet Dry Frozen
Hole No. *** Reading Interval
Reading No. 1:
Reading No. 2:
Reading No. 3:
Reading No. 4:
Reading No. 5:
Reading No. 6:
Reading No. 7
Reading No. 8:
Yes No Inches of drop Inches of drop Inches of drop Inches of drop Inches of drop Inches of drop Inches of drop Inches of drop
"E" 10 1 1/8 1 1/8 1 1/8 1 1/8 1 1/8
"F" 10 3/4 3/4 3/4 3/4 3/4
10 / 30
10 / 30
10 / 30
10 / 30
***Water remaining in the hole at the end of the final 30-minute presoak? Yes, use 30-minute interval; No, use 10-minute interval.
Calculation of Average Percolation Rate: Drop during Infiltration Rate Depth Hole No. final period Inches/Hour of Hole "E" 11/8 “ 6.75 60 “ "F" 3/4 “ 4.5 60 “ “ “ “ “ “ “ “
“
59

This page intentionally left blank.
60

DEWATER CALCULATIONS
61

This page intentionally left blank.
62

Basin
AVERAGE INFILTRATION RATE: (6.75 IN/HR + 4.5 IN/IN)/2 = 5.63 IN/HR
FACTOR OF SAFETY: 5.63 IN/HR / 2 = 2.81 IN/HR
DEWATERING TIME: 2.0 FT X 12 IN/FT / 2.81 IN/HR = 8.53 HR
Gourmet's Delight Mushrooms
Infiltration Facility Dewatering Time Calculations
63

This page intentionally left blank.
64

WEIR CAPACITY
65

This page intentionally left blank.
66

Facility
Weir
Coefficient
C
Width of Weir
L (ft)
Head Above
Weir
H (ft)
Discharge
Capacity
Q (cfs)
Forebay to
Infiltration Basin 3.33 24.6 2.02 231.32
Forebay to Wet
Pond 3.33 5.4 2.02 47.76
GOURMET'S DELIGHT
SPILLWAY CAPACITY CALCULATIONS
67
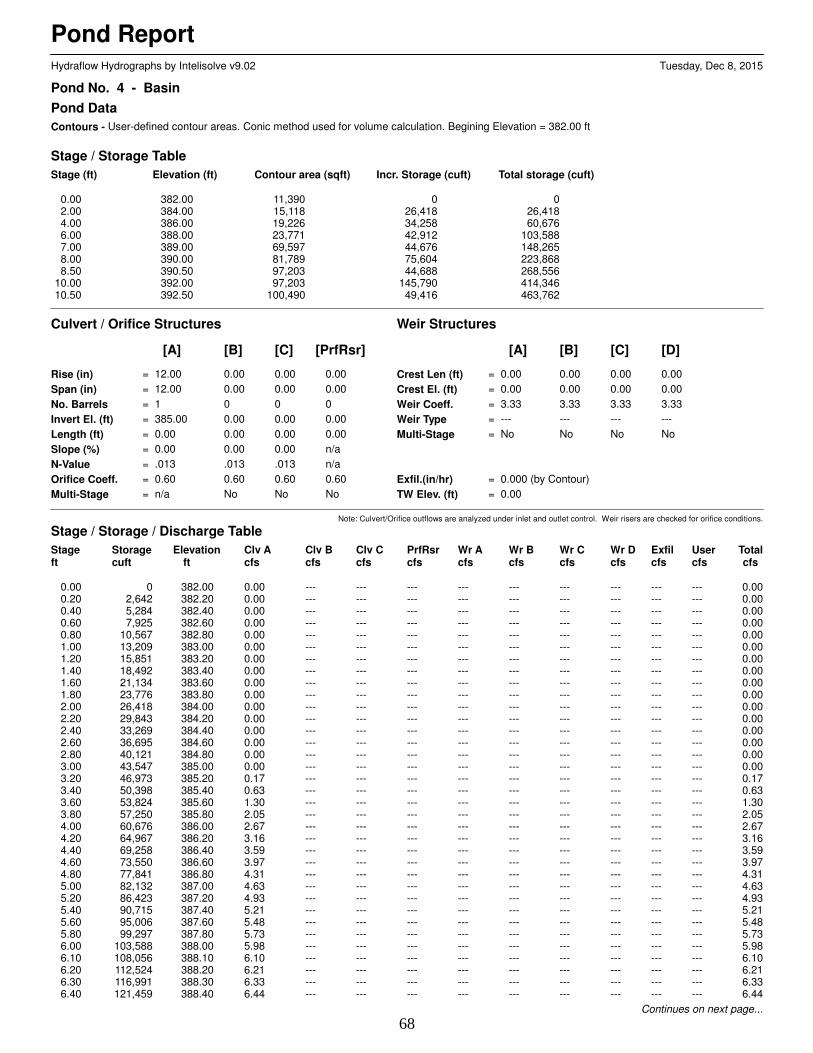
Pond ReportHydraflow Hydrographs by Intelisolve v9.02 Tuesday, Dec 8, 2015
Pond No. 4 - Basin
Pond Data
Contours - User-defined contour areas. Conic method used for volume calculation. Begining Elevation = 382.00 ft
Stage / Storage Table
Stage (ft) Elevation (ft) Contour area (sqft) Incr. Storage (cuft) Total storage (cuft)
0.00 382.00 11,390 0 02.00 384.00 15,118 26,418 26,4184.00 386.00 19,226 34,258 60,6766.00 388.00 23,771 42,912 103,5887.00 389.00 69,597 44,676 148,2658.00 390.00 81,789 75,604 223,8688.50 390.50 97,203 44,688 268,556
10.00 392.00 97,203 145,790 414,34610.50 392.50 100,490 49,416 463,762
Culvert / Orifice Structures Weir Structures
[A] [B] [C] [PrfRsr] [A] [B] [C] [D]
Rise (in) = 12.00 0.00 0.00 0.00
Span (in) = 12.00 0.00 0.00 0.00
No. Barrels = 1 0 0 0
Invert El. (ft) = 385.00 0.00 0.00 0.00
Length (ft) = 0.00 0.00 0.00 0.00
Slope (%) = 0.00 0.00 0.00 n/a
N-Value = .013 .013 .013 n/a
Orifice Coeff. = 0.60 0.60 0.60 0.60
Multi-Stage = n/a No No No
Crest Len (ft) = 0.00 0.00 0.00 0.00
Crest El. (ft) = 0.00 0.00 0.00 0.00
Weir Coeff. = 3.33 3.33 3.33 3.33
Weir Type = --- --- --- ---
Multi-Stage = No No No No
Exfil.(in/hr) = 0.000 (by Contour)
TW Elev. (ft) = 0.00
Note: Culvert/Orifice outflows are analyzed under inlet and outlet control. Weir risers are checked for orifice conditions.
Stage / Storage / Discharge Table
Stage Storage Elevation Clv A Clv B Clv C PrfRsr Wr A Wr B Wr C Wr D Exfil User Totalft cuft ft cfs cfs cfs cfs cfs cfs cfs cfs cfs cfs cfs
0.00 0 382.00 0.00 --- --- --- --- --- --- --- --- --- 0.000.20 2,642 382.20 0.00 --- --- --- --- --- --- --- --- --- 0.000.40 5,284 382.40 0.00 --- --- --- --- --- --- --- --- --- 0.000.60 7,925 382.60 0.00 --- --- --- --- --- --- --- --- --- 0.000.80 10,567 382.80 0.00 --- --- --- --- --- --- --- --- --- 0.001.00 13,209 383.00 0.00 --- --- --- --- --- --- --- --- --- 0.001.20 15,851 383.20 0.00 --- --- --- --- --- --- --- --- --- 0.001.40 18,492 383.40 0.00 --- --- --- --- --- --- --- --- --- 0.001.60 21,134 383.60 0.00 --- --- --- --- --- --- --- --- --- 0.001.80 23,776 383.80 0.00 --- --- --- --- --- --- --- --- --- 0.002.00 26,418 384.00 0.00 --- --- --- --- --- --- --- --- --- 0.002.20 29,843 384.20 0.00 --- --- --- --- --- --- --- --- --- 0.002.40 33,269 384.40 0.00 --- --- --- --- --- --- --- --- --- 0.002.60 36,695 384.60 0.00 --- --- --- --- --- --- --- --- --- 0.002.80 40,121 384.80 0.00 --- --- --- --- --- --- --- --- --- 0.003.00 43,547 385.00 0.00 --- --- --- --- --- --- --- --- --- 0.003.20 46,973 385.20 0.17 --- --- --- --- --- --- --- --- --- 0.173.40 50,398 385.40 0.63 --- --- --- --- --- --- --- --- --- 0.633.60 53,824 385.60 1.30 --- --- --- --- --- --- --- --- --- 1.303.80 57,250 385.80 2.05 --- --- --- --- --- --- --- --- --- 2.054.00 60,676 386.00 2.67 --- --- --- --- --- --- --- --- --- 2.674.20 64,967 386.20 3.16 --- --- --- --- --- --- --- --- --- 3.164.40 69,258 386.40 3.59 --- --- --- --- --- --- --- --- --- 3.594.60 73,550 386.60 3.97 --- --- --- --- --- --- --- --- --- 3.974.80 77,841 386.80 4.31 --- --- --- --- --- --- --- --- --- 4.315.00 82,132 387.00 4.63 --- --- --- --- --- --- --- --- --- 4.635.20 86,423 387.20 4.93 --- --- --- --- --- --- --- --- --- 4.935.40 90,715 387.40 5.21 --- --- --- --- --- --- --- --- --- 5.215.60 95,006 387.60 5.48 --- --- --- --- --- --- --- --- --- 5.485.80 99,297 387.80 5.73 --- --- --- --- --- --- --- --- --- 5.736.00 103,588 388.00 5.98 --- --- --- --- --- --- --- --- --- 5.986.10 108,056 388.10 6.10 --- --- --- --- --- --- --- --- --- 6.106.20 112,524 388.20 6.21 --- --- --- --- --- --- --- --- --- 6.216.30 116,991 388.30 6.33 --- --- --- --- --- --- --- --- --- 6.336.40 121,459 388.40 6.44 --- --- --- --- --- --- --- --- --- 6.44
Continues on next page...
68

Basin
Stage / Storage / Discharge Table
Stage Storage Elevation Clv A Clv B Clv C PrfRsr Wr A Wr B Wr C Wr D Exfil User Totalft cuft ft cfs cfs cfs cfs cfs cfs cfs cfs cfs cfs cfs
6.50 125,927 388.50 6.55 --- --- --- --- --- --- --- --- --- 6.556.60 130,394 388.60 6.66 --- --- --- --- --- --- --- --- --- 6.666.70 134,862 388.70 6.76 --- --- --- --- --- --- --- --- --- 6.766.80 139,329 388.80 6.87 --- --- --- --- --- --- --- --- --- 6.876.90 143,797 388.90 6.97 --- --- --- --- --- --- --- --- --- 6.977.00 148,265 389.00 7.07 --- --- --- --- --- --- --- --- --- 7.077.10 155,825 389.10 7.17 --- --- --- --- --- --- --- --- --- 7.177.20 163,385 389.20 7.27 --- --- --- --- --- --- --- --- --- 7.277.30 170,946 389.30 7.37 --- --- --- --- --- --- --- --- --- 7.377.40 178,506 389.40 7.47 --- --- --- --- --- --- --- --- --- 7.477.50 186,066 389.50 7.56 --- --- --- --- --- --- --- --- --- 7.567.60 193,627 389.60 7.66 --- --- --- --- --- --- --- --- --- 7.667.70 201,187 389.70 7.75 --- --- --- --- --- --- --- --- --- 7.757.80 208,747 389.80 7.84 --- --- --- --- --- --- --- --- --- 7.847.90 216,308 389.90 7.93 --- --- --- --- --- --- --- --- --- 7.938.00 223,868 390.00 8.02 --- --- --- --- --- --- --- --- --- 8.028.05 228,337 390.05 8.07 --- --- --- --- --- --- --- --- --- 8.078.10 232,806 390.10 8.11 --- --- --- --- --- --- --- --- --- 8.118.15 237,275 390.15 8.15 --- --- --- --- --- --- --- --- --- 8.158.20 241,743 390.20 8.20 --- --- --- --- --- --- --- --- --- 8.208.25 246,212 390.25 8.24 --- --- --- --- --- --- --- --- --- 8.248.30 250,681 390.30 8.28 --- --- --- --- --- --- --- --- --- 8.288.35 255,150 390.35 8.33 --- --- --- --- --- --- --- --- --- 8.338.40 259,619 390.40 8.37 --- --- --- --- --- --- --- --- --- 8.378.45 264,087 390.45 8.41 --- --- --- --- --- --- --- --- --- 8.418.50 268,556 390.50 8.46 --- --- --- --- --- --- --- --- --- 8.468.65 283,135 390.65 8.58 --- --- --- --- --- --- --- --- --- 8.588.80 297,714 390.80 8.70 --- --- --- --- --- --- --- --- --- 8.708.95 312,293 390.95 8.83 --- --- --- --- --- --- --- --- --- 8.839.10 326,872 391.10 8.95 --- --- --- --- --- --- --- --- --- 8.959.25 341,451 391.25 9.07 --- --- --- --- --- --- --- --- --- 9.079.40 356,030 391.40 9.18 --- --- --- --- --- --- --- --- --- 9.189.55 370,609 391.55 9.30 --- --- --- --- --- --- --- --- --- 9.309.70 385,188 391.70 9.42 --- --- --- --- --- --- --- --- --- 9.429.85 399,767 391.85 9.53 --- --- --- --- --- --- --- --- --- 9.53
10.00 414,346 392.00 9.64 --- --- --- --- --- --- --- --- --- 9.6410.05 419,288 392.05 9.68 --- --- --- --- --- --- --- --- --- 9.6810.10 424,229 392.10 9.71 --- --- --- --- --- --- --- --- --- 9.7110.15 429,171 392.15 9.75 --- --- --- --- --- --- --- --- --- 9.7510.20 434,113 392.20 9.79 --- --- --- --- --- --- --- --- --- 9.7910.25 439,054 392.25 9.82 --- --- --- --- --- --- --- --- --- 9.8210.30 443,996 392.30 9.86 --- --- --- --- --- --- --- --- --- 9.8610.35 448,937 392.35 9.90 --- --- --- --- --- --- --- --- --- 9.9010.40 453,879 392.40 9.93 --- --- --- --- --- --- --- --- --- 9.9310.45 458,821 392.45 9.97 --- --- --- --- --- --- --- --- --- 9.9710.50 463,762 392.50 10.00 --- --- --- --- --- --- --- --- --- 10.00
...End
69

Pond ReportHydraflow Hydrographs by Intelisolve v9.02 Tuesday, Aug 16, 2016
Pond No. 1 - Wet Pond
Pond Data
Contours - User-defined contour areas. Conic method used for volume calculation. Begining Elevation = 382.00 ft
Stage / Storage Table
Stage (ft) Elevation (ft) Contour area (sqft) Incr. Storage (cuft) Total storage (cuft)
0.00 382.00 11,390 0 02.00 384.00 15,118 26,418 26,4184.00 386.00 19,226 34,258 60,6766.00 388.00 23,771 42,912 103,5887.00 389.00 69,597 44,676 148,2658.00 390.00 81,789 75,604 223,868
10.00 392.00 97,203 178,753 402,62110.50 392.50 100,490 49,416 452,037
Culvert / Orifice Structures Weir Structures
[A] [B] [C] [PrfRsr] [A] [B] [C] [D]
Rise (in) = 15.00 0.00 0.00 0.00
Span (in) = 15.00 0.00 0.00 0.00
No. Barrels = 1 0 0 0
Invert El. (ft) = 382.00 0.00 0.00 0.00
Length (ft) = 80.00 0.00 0.00 0.00
Slope (%) = 2.50 0.00 0.00 n/a
N-Value = .013 .013 .013 n/a
Orifice Coeff. = 0.60 0.60 0.60 0.60
Multi-Stage = n/a No No No
Crest Len (ft) = 20.00 1.25 30.00 0.00
Crest El. (ft) = 391.00 389.00 391.50 0.00
Weir Coeff. = 3.33 2.60 3.33 3.33
Weir Type = Riser Rect Broad ---
Multi-Stage = Yes Yes No No
Exfil.(in/hr) = 0.000 (by Contour)
TW Elev. (ft) = 0.00
Note: Culvert/Orifice outflows are analyzed under inlet and outlet control. Weir risers are checked for orifice conditions.
Stage / Storage / Discharge Table
Stage Storage Elevation Clv A Clv B Clv C PrfRsr Wr A Wr B Wr C Wr D Exfil User Totalft cuft ft cfs cfs cfs cfs cfs cfs cfs cfs cfs cfs cfs
0.00 0 382.00 0.00 --- --- --- 0.00 0.00 0.00 --- --- --- 0.000.20 2,642 382.20 0.00 --- --- --- 0.00 0.00 0.00 --- --- --- 0.000.40 5,284 382.40 0.00 --- --- --- 0.00 0.00 0.00 --- --- --- 0.000.60 7,925 382.60 0.00 --- --- --- 0.00 0.00 0.00 --- --- --- 0.000.80 10,567 382.80 0.00 --- --- --- 0.00 0.00 0.00 --- --- --- 0.001.00 13,209 383.00 0.00 --- --- --- 0.00 0.00 0.00 --- --- --- 0.001.20 15,851 383.20 0.00 --- --- --- 0.00 0.00 0.00 --- --- --- 0.001.40 18,492 383.40 0.00 --- --- --- 0.00 0.00 0.00 --- --- --- 0.001.60 21,134 383.60 0.00 --- --- --- 0.00 0.00 0.00 --- --- --- 0.001.80 23,776 383.80 0.00 --- --- --- 0.00 0.00 0.00 --- --- --- 0.002.00 26,418 384.00 0.00 --- --- --- 0.00 0.00 0.00 --- --- --- 0.002.20 29,843 384.20 0.00 --- --- --- 0.00 0.00 0.00 --- --- --- 0.002.40 33,269 384.40 0.00 --- --- --- 0.00 0.00 0.00 --- --- --- 0.002.60 36,695 384.60 0.00 --- --- --- 0.00 0.00 0.00 --- --- --- 0.002.80 40,121 384.80 0.00 --- --- --- 0.00 0.00 0.00 --- --- --- 0.003.00 43,547 385.00 0.00 --- --- --- 0.00 0.00 0.00 --- --- --- 0.003.20 46,973 385.20 0.00 --- --- --- 0.00 0.00 0.00 --- --- --- 0.003.40 50,398 385.40 0.00 --- --- --- 0.00 0.00 0.00 --- --- --- 0.003.60 53,824 385.60 0.00 --- --- --- 0.00 0.00 0.00 --- --- --- 0.003.80 57,250 385.80 0.00 --- --- --- 0.00 0.00 0.00 --- --- --- 0.004.00 60,676 386.00 0.00 --- --- --- 0.00 0.00 0.00 --- --- --- 0.004.20 64,967 386.20 0.00 --- --- --- 0.00 0.00 0.00 --- --- --- 0.004.40 69,258 386.40 0.00 --- --- --- 0.00 0.00 0.00 --- --- --- 0.004.60 73,550 386.60 0.00 --- --- --- 0.00 0.00 0.00 --- --- --- 0.004.80 77,841 386.80 0.00 --- --- --- 0.00 0.00 0.00 --- --- --- 0.005.00 82,132 387.00 0.00 --- --- --- 0.00 0.00 0.00 --- --- --- 0.005.20 86,423 387.20 0.00 --- --- --- 0.00 0.00 0.00 --- --- --- 0.005.40 90,715 387.40 0.00 --- --- --- 0.00 0.00 0.00 --- --- --- 0.005.60 95,006 387.60 0.00 --- --- --- 0.00 0.00 0.00 --- --- --- 0.005.80 99,297 387.80 0.00 --- --- --- 0.00 0.00 0.00 --- --- --- 0.006.00 103,588 388.00 0.00 --- --- --- 0.00 0.00 0.00 --- --- --- 0.006.10 108,056 388.10 0.00 --- --- --- 0.00 0.00 0.00 --- --- --- 0.006.20 112,524 388.20 0.00 --- --- --- 0.00 0.00 0.00 --- --- --- 0.006.30 116,991 388.30 0.00 --- --- --- 0.00 0.00 0.00 --- --- --- 0.006.40 121,459 388.40 0.00 --- --- --- 0.00 0.00 0.00 --- --- --- 0.006.50 125,927 388.50 0.00 --- --- --- 0.00 0.00 0.00 --- --- --- 0.00
Continues on next page...
70

Wet Pond
Stage / Storage / Discharge Table
Stage Storage Elevation Clv A Clv B Clv C PrfRsr Wr A Wr B Wr C Wr D Exfil User Totalft cuft ft cfs cfs cfs cfs cfs cfs cfs cfs cfs cfs cfs
6.60 130,394 388.60 0.00 --- --- --- 0.00 0.00 0.00 --- --- --- 0.006.70 134,862 388.70 0.00 --- --- --- 0.00 0.00 0.00 --- --- --- 0.006.80 139,329 388.80 0.00 --- --- --- 0.00 0.00 0.00 --- --- --- 0.006.90 143,797 388.90 0.00 --- --- --- 0.00 0.00 0.00 --- --- --- 0.007.00 148,265 389.00 0.00 --- --- --- 0.00 0.00 0.00 --- --- --- 0.007.10 155,825 389.10 0.11 --- --- --- 0.00 0.10 0.00 --- --- --- 0.107.20 163,385 389.20 0.29 --- --- --- 0.00 0.29 0.00 --- --- --- 0.297.30 170,946 389.30 0.53 --- --- --- 0.00 0.53 0.00 --- --- --- 0.537.40 178,506 389.40 0.83 --- --- --- 0.00 0.82 0.00 --- --- --- 0.827.50 186,066 389.50 1.16 --- --- --- 0.00 1.15 0.00 --- --- --- 1.157.60 193,627 389.60 1.51 --- --- --- 0.00 1.51 0.00 --- --- --- 1.517.70 201,187 389.70 1.92 --- --- --- 0.00 1.90 0.00 --- --- --- 1.907.80 208,747 389.80 2.36 --- --- --- 0.00 2.33 0.00 --- --- --- 2.337.90 216,308 389.90 2.80 --- --- --- 0.00 2.78 0.00 --- --- --- 2.788.00 223,868 390.00 3.27 --- --- --- 0.00 3.25 0.00 --- --- --- 3.258.20 241,743 390.20 4.27 --- --- --- 0.00 4.27 0.00 --- --- --- 4.278.40 259,619 390.40 5.38 --- --- --- 0.00 5.38 0.00 --- --- --- 5.388.60 277,494 390.60 6.58 --- --- --- 0.00 6.58 0.00 --- --- --- 6.588.80 295,369 390.80 7.85 --- --- --- 0.00 7.85 0.00 --- --- --- 7.859.00 313,244 391.00 9.19 --- --- --- 0.00 9.19 0.00 --- --- --- 9.199.20 331,120 391.20 15.70 --- --- --- 5.96 9.74 0.00 --- --- --- 15.709.40 348,995 391.40 17.05 --- --- --- 12.43 4.61 0.00 --- --- --- 17.049.60 366,870 391.60 17.29 --- --- --- 13.81 3.48 3.16 --- --- --- 20.459.80 384,745 391.80 17.47 --- --- --- 14.58 2.88 16.42 --- --- --- 33.88
10.00 402,621 392.00 17.65 --- --- --- 15.10 2.51 35.32 --- --- --- 52.9310.05 407,562 392.05 17.69 --- --- --- 15.22 2.44 40.75 --- --- --- 58.4110.10 412,504 392.10 17.73 --- --- --- 15.32 2.37 46.43 --- --- --- 64.1210.15 417,445 392.15 17.77 --- --- --- 15.40 2.31 52.35 --- --- --- 70.0610.20 422,387 392.20 17.82 --- --- --- 15.50 2.26 58.50 --- --- --- 76.2610.25 427,329 392.25 17.86 --- --- --- 15.57 2.21 64.88 --- --- --- 82.6610.30 432,270 392.30 17.90 --- --- --- 15.70 2.17 71.47 --- --- --- 89.3410.35 437,212 392.35 17.94 --- --- --- 15.75 2.12 78.28 --- --- --- 96.1510.40 442,153 392.40 17.98 --- --- --- 15.82 2.08 85.28 --- --- --- 103.1710.45 447,095 392.45 18.02 --- --- --- 15.90 2.04 92.49 --- --- --- 110.4310.50 452,037 392.50 18.06 --- --- --- 15.94 2.00 99.90 --- --- --- 117.84
...End
71

This page intentionally left blank.
72

DOWNSPOUT CAPACITY
BASED ON LARGEST AREA DRAINING TO ONE LOCATION
(40’X127’ ROOF AREA=0.116AC.)
73

This page intentionally left blank.
74

75

76

77
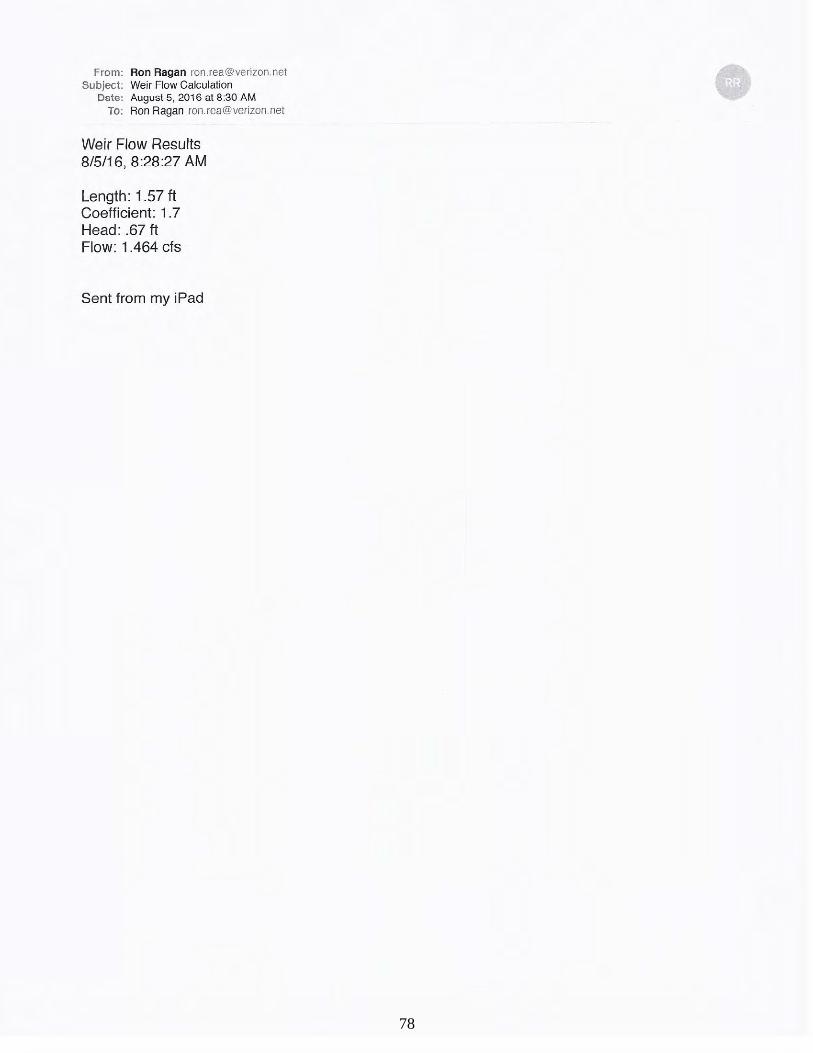
78

79

This page intentionally left blank.
80

ANTI-SEEP COLLAR CALCULATIONS
81

This page intentionally left blank.
82

LENGTH OF PIPE IN THE SATURATED ZONE (LS)
LS = y * (z + 4) [1 + (pipe slope ft/ft /( 0.25 - pipe slope))]
LS = 9 * (4 + 4) [1 + (0.025 / (0.25 - 0.025))]
LS = 9 *8 [1 + 0.111111]
LS = 80.0’
INCREASE IN FLOW PATH
LF = 1.15 LS
LF = 1.15 * 80.0
LF = 92.0’
MINIMUM COLLAR PROJECTION
Vmin = (LF – LS) / 2(no. of collars)
Vmin = 12.0 / 4
Vmin = 3.0
SIDE DIMENSION (S)
S = 2V + Barrel Diameter
S = 2(3) + 1.25
S = 7.25’
83

84

RIP-RAP CALCULATIONS
85

This page intentionally left blank.
86
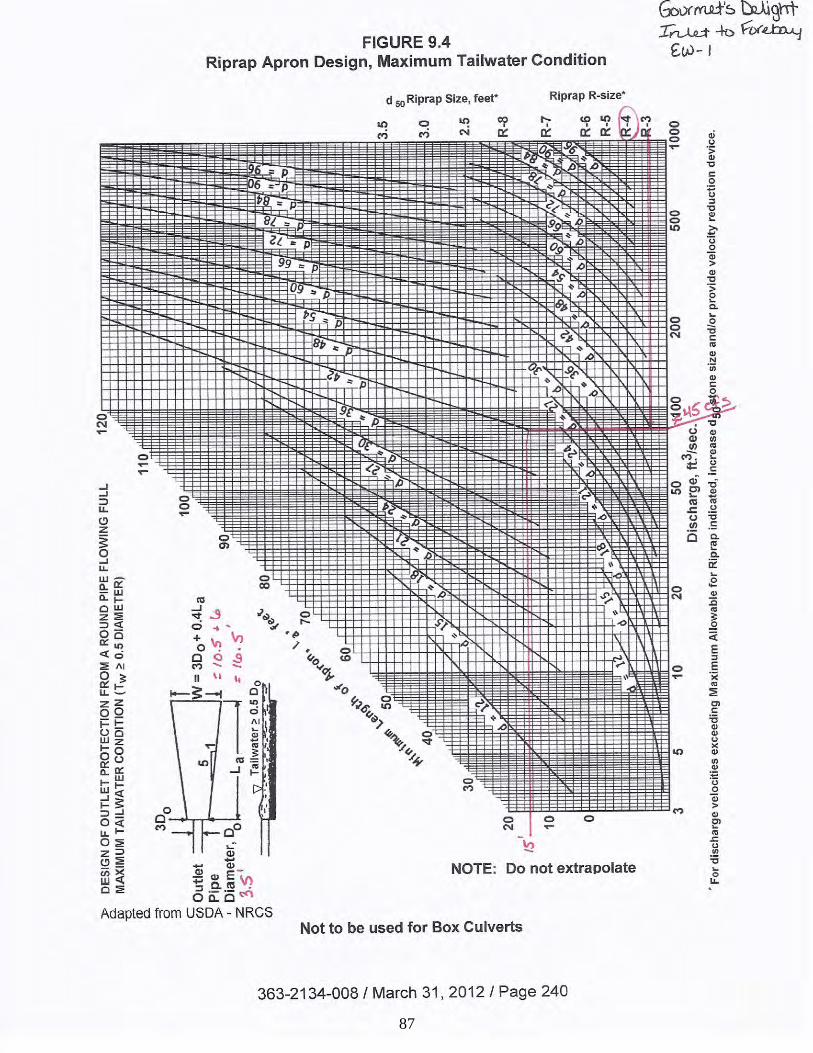
87
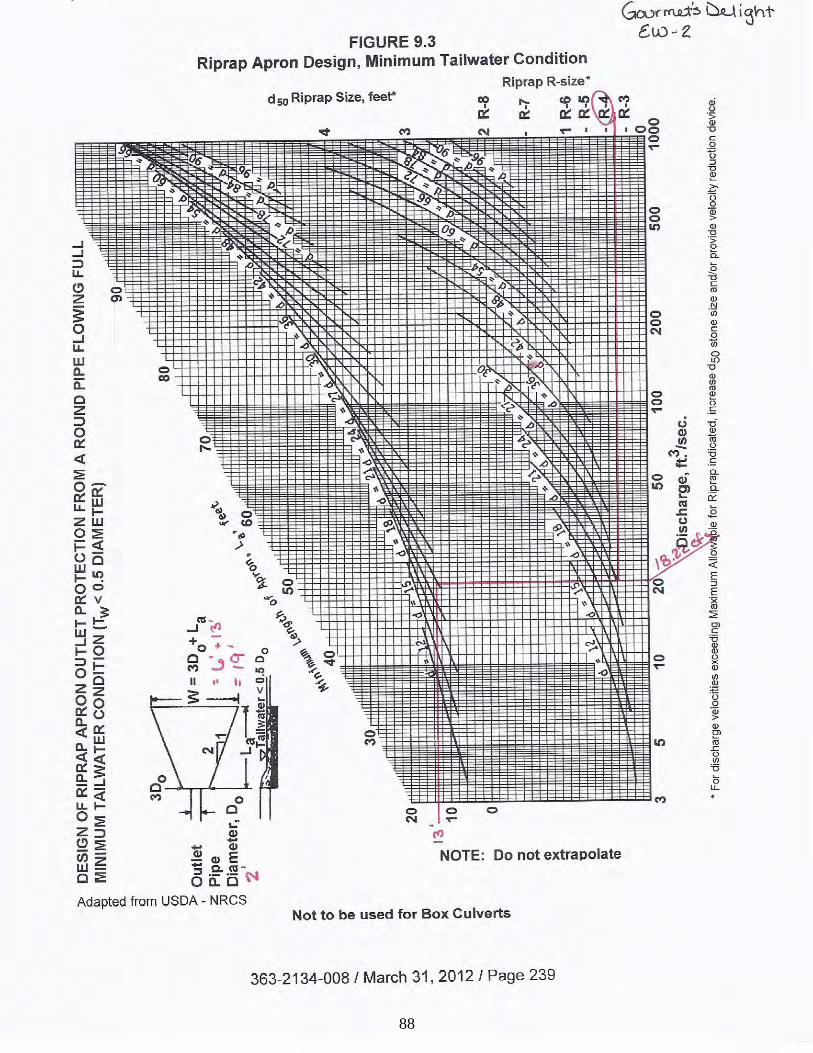
88
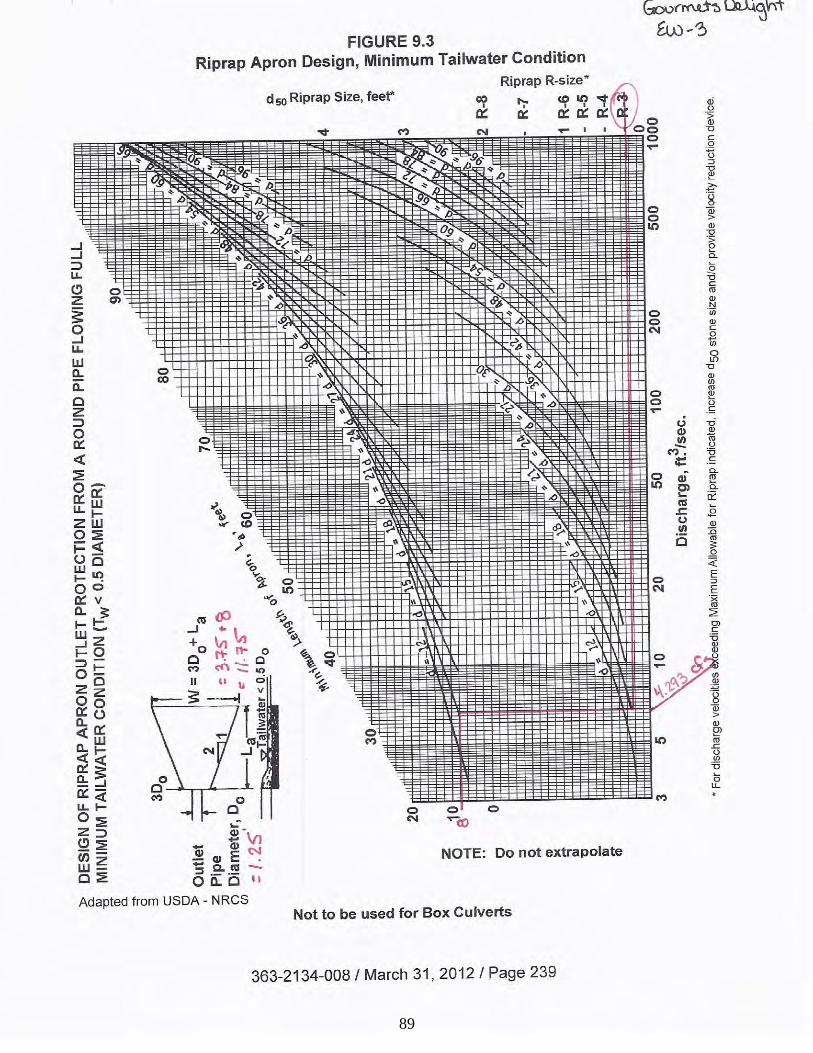
89

Structure
Mannings
"n"
Pipe
Diameter
(ft) Multiplier
Flow Area
(ft2)
Wetted
Perimeter
(ft)
Slope
(ft/ft)
Velocity
(fps)
EW-1 0.013 3.5 1.486 9.62 10.990 0.010 10.40
EW-2 0.013 2.0 1.486 3.14 6.280 0.023 11.02
Level Spreader 0.013 1.25 1.486 1.23 3.925 0.025 8.32
Infil. Basin 0.009 0.33 1.486 0.09 1.047 0.03 5.45
GOURMET'S DELIGHT
OUTLET VELOCITY CALCULATIONS
90

STORMSEWER CALCULATIONS
91

This page intentionally left blank.
92

Hyd
rafl
ow
Pla
n V
iew
Pro
ject F
ile: N
ort
h R
un
.stm
No
. L
ine
s: 1
00
2-1
2-2
01
6
Hyd
raflo
w S
torm
Se
we
rs 2
00
5
93

Sto
rm S
ew
er
Inven
tory
Rep
ort
Pag
e
1
Lin
eA
lig
nm
en
tF
low
Data
Ph
ysic
al
Data
Lin
e I
DN
o.
Dn
str
Lin
eD
efl
Ju
nc
Kn
ow
nD
rng
Ru
no
ffIn
let
Invert
Lin
eIn
vert
Lin
eL
ine
NJ-l
oss
Inle
t/li
ne
len
gth
an
gle
typ
eQ
are
aco
eff
tim
eE
l D
nslo
pe
El
Up
siz
ety
pe
valu
eco
eff
Rim
El
No
.(f
t)(d
eg
)(c
fs)
(ac)
(C)
(min
)(f
t)(%
)(f
t)(i
n)
(n)
(K)
(ft)
1E
nd
76.1
-7.4
Gra
te0.0
00.1
70.9
55.0
388.0
08.5
4394.5
042
Cir
0.0
12
1.5
0411
.00
I1-E
W1
21
97.0
-90.0
Gra
te0.0
00.3
40.9
55.0
395.0
02.9
6397.8
736
Cir
0.0
12
0.5
0411
.00
I2-I
1
32
100.0
0.0
Gra
te0.0
00.3
60.9
55.0
398.0
71.0
0399.0
736
Cir
0.0
12
0.5
0411
.00
I3-I
2
43
134.7
16.4
Gra
te0.0
00.1
20.9
55.0
399.2
71.0
7400.7
136
Cir
0.0
12
1.5
0410.5
0I4
-I3
54
118.8
95.9
Gra
te0.0
00.0
70.9
55.0
400.9
11.1
9402.3
236
Cir
0.0
12
0.6
5411
.00
I5-I
4
65
100.0
-22.3
Gra
te0.0
00.0
60.9
55.0
402.5
20.7
0403.2
236
Cir
0.0
12
0.5
0411
.00
I6-I
5
76
29.0
2.0
MH
0.0
03.8
90.9
55.0
403.4
21.4
8403.8
536
Cir
0.0
12
1.0
0411
.50
MH
1-I
6
87
37.0
-0.4
Gra
te0.0
00.1
80.9
55.0
406.5
51.2
2407.0
015
Cir
0.0
12
1.0
0410.5
0I7
-MH
1
97
198.4
89.6
MH
0.0
00.5
00.9
55.0
404.8
50.8
1406.4
524
Cir
0.0
12
1.0
0412.0
0M
H2-M
H1
10
9295.0
-90.4
MH
0.0
00.3
00.9
55.0
407.1
50.5
5408.7
615
Cir
0.0
12
1.0
0412.0
0M
H3-M
H2
Pro
ject
File
: N
ort
h R
un.s
tmN
um
ber
of
lines:
10
Date
: 0
2-1
2-2
016
Hyd
raflo
w S
torm
Se
we
rs 2
00
5
94

Inle
t R
ep
ort
Pag
e
1
Lin
eIn
let
IDQ
=Q
Ju
nc
Cu
rb I
nle
tG
rate
In
let
Gu
tter
Inle
tB
yp
No
CIA
carr
ycap
tb
yp
typ
eli
ne
Ht
Lare
aL
WS
oW
Sw
Sx
nD
ep
thS
pre
ad
Dep
thS
pre
ad
Dep
rN
o(c
fs)
(cfs
)(c
fs)
(cfs
)(i
n)
(ft)
(sq
ft)
(ft)
(ft)
(ft/
ft)
(ft)
(ft/
ft)
(ft/
ft)
(ft)
(ft)
(ft)
(ft)
(in
)
1I1
1.3
40.0
01.3
40.0
0G
rate
0.0
0.0
08.0
04.0
02.0
0S
ag
2.0
00.0
10
0.0
10
0.0
00
0.0
66.2
60.1
56.2
61.0
0O
ff
2I2
2.6
80.0
02.6
80.0
0G
rate
0.0
0.0
08.0
04.0
02.0
0S
ag
2.0
00.0
10
0.0
10
0.0
00
0.1
514.8
40.2
314.8
41.0
0O
ff
3I3
2.8
40.0
02.8
40.0
0G
rate
0.0
0.0
08.0
04.0
02.0
0S
ag
2.0
00.0
10
0.0
10
0.0
00
0.1
615.7
40.2
415.7
41.0
0O
ff
4I4
0.9
50.0
00.9
50.0
0G
rate
0.0
0.0
08.0
04.0
02.0
0S
ag
2.0
00.0
10
0.0
10
0.0
00
0.0
33.2
40.1
23.2
41.0
0O
ff
5I5
0.5
50.0
00.5
50.0
0G
rate
0.0
0.0
08.0
04.0
02.0
0S
ag
2.0
00.0
10
0.0
10
0.0
00
0.0
0-0
.26
0.0
81.5
61.0
0O
ff
6I6
0.4
70.0
00.4
70.0
0G
rate
0.0
0.0
08.0
04.0
02.0
0S
ag
2.0
00.0
10
0.0
10
0.0
00
-0.0
1-1
.05
0.0
71.4
11.0
0O
ff
7M
H1
30.6
70.0
00.0
030.6
7M
H0.0
0.0
00.0
00.0
00.0
0S
ag
0.0
00.0
00
0.0
00
0.0
00
0.0
00.0
00.0
00.0
00.0
0O
ff
8I7
1.4
20.0
01.4
20.0
0G
rate
0.0
0.0
08.0
04.0
02.0
0S
ag
2.0
00.0
10
0.0
10
0.0
00
0.0
76.8
30.1
56.8
31.0
0O
ff
9M
H2
3.9
40.0
00.0
03.9
4M
H0.0
0.0
00.0
00.0
00.0
0S
ag
0.0
00.0
00
0.0
00
0.0
00
0.0
00.0
00.0
00.0
00.0
0O
ff
10
MH
32.3
70.0
00.0
02.3
7M
H0.0
0.0
00.0
00.0
00.0
0S
ag
0.0
00.0
00
0.0
00
0.0
00
0.0
00.0
00.0
00.0
00.0
0O
ff
Pro
ject
File
: N
ort
h R
un.s
tmN
um
ber
of
lines:
10
Run D
ate
: 0
2-1
2-2
016
NO
TE
S:
Inle
t N
-Valu
es =
0.0
16 ;
Inte
nsity =
12725630.0
0 /
(In
let
tim
e +
126.8
0)
^ 2.9
2;
R
etu
rn p
eriod =
100 Y
rs.
; *
Indic
ate
s K
now
n Q
added
Hyd
raflo
w S
torm
Se
we
rs 2
00
5
95

Storm Sewer Summary Report Page 1
Line Line ID Flow Line Line Invert Invert Line HGL HGL Minor HGL DnsNo. rate size length EL Dn EL Up slope down up loss Junct line
(cfs) (in) (ft) (ft) (ft) (%) (ft) (ft) (ft) (ft) No.
1 I1-EW1 41.41 42 c 76.1 388.00 394.50 8.541 390.04 396.47 n/a 396.47 j End
2 I2-I1 40.48 36 c 97.0 395.00 397.87 2.959 396.82 399.90 n/a 399.90 j 1
3 I3-I2 38.36 36 c 100.0 398.07 399.07 1.000 400.43 401.04 n/a 401.04 j 2
4 I4-I3 36.17 36 c 134.7 399.27 400.71 1.069 401.58 402.63 n/a 402.63 j 3
5 I5-I4 35.61 36 c 118.8 400.91 402.32 1.187 403.13 404.22 n/a 404.22 j 4
6 I6-I5 35.36 36 c 100.0 402.52 403.22 0.700 404.72 405.12 0.44 405.12 5
7 MH1-I6 35.00 36 c 29.0 403.42 403.85 1.481 405.61 405.74 n/a 405.74 6
8 I7-MH1 1.42 15 c 37.0 406.55 407.00 1.215 406.91 407.48 n/a 407.48 j 7
9 MH2-MH1 5.96 24 c 198.4 404.85 406.45 0.807 406.55 407.32 n/a 407.32 j 7
10 MH3-MH2 2.37 15 c 295.0 407.15 408.76 0.546 407.75 409.38 n/a 409.38 j 9
Project File: North Run.stm Number of lines: 10 Run Date: 02-12-2016
NOTES: c = cir; e = ellip; b = box; Return period = 100 Yrs. ; j - Line contains hyd. jump.
Hydraflow Storm Sewers 2005
96

Hyd
rafl
ow
Pla
n V
iew
Pro
ject F
ile: N
ort
he
ast.stm
No
. L
ine
s: 6
08
-16
-20
16
Hyd
raflo
w S
torm
Se
we
rs 2
00
5
97
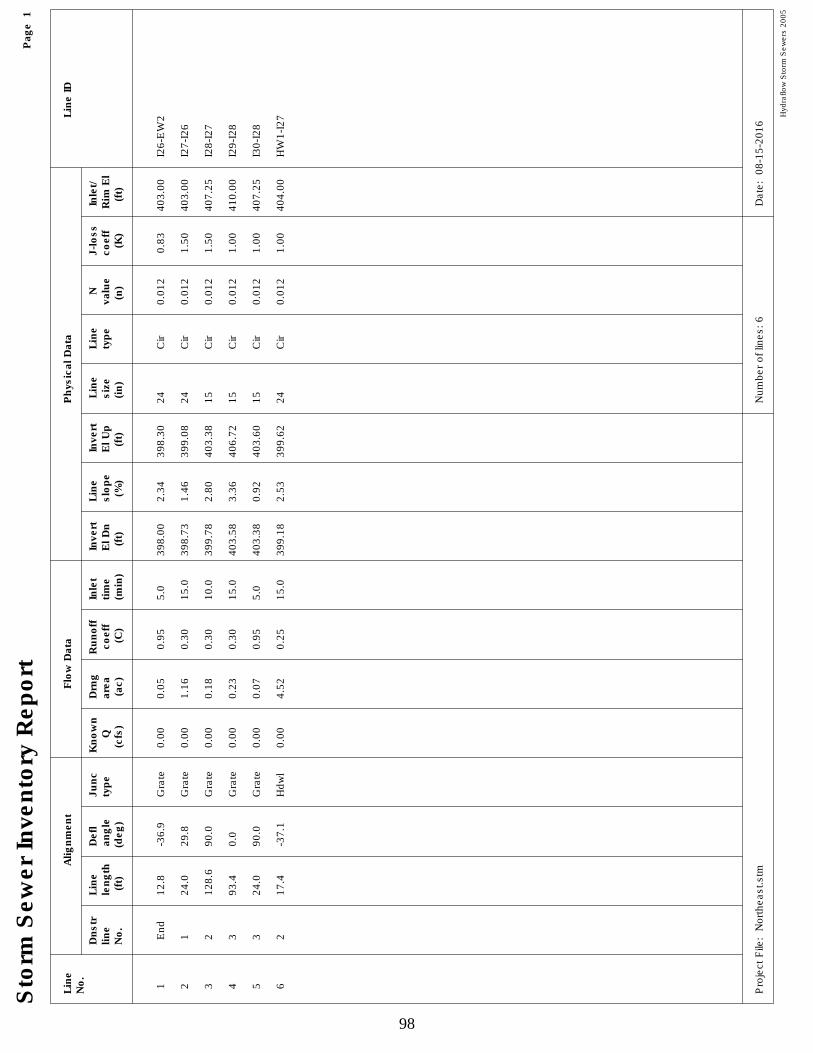
Sto
rm S
ew
er
Inven
tory
Rep
ort
Pag
e
1
Lin
eA
lig
nm
en
tF
low
Data
Ph
ysic
al
Data
Lin
e I
DN
o.
Dn
str
Lin
eD
efl
Ju
nc
Kn
ow
nD
rng
Ru
no
ffIn
let
Invert
Lin
eIn
vert
Lin
eL
ine
NJ-l
oss
Inle
t/li
ne
len
gth
an
gle
typ
eQ
are
aco
eff
tim
eE
l D
nslo
pe
El
Up
siz
ety
pe
valu
eco
eff
Rim
El
No
.(f
t)(d
eg
)(c
fs)
(ac)
(C)
(min
)(f
t)(%
)(f
t)(i
n)
(n)
(K)
(ft)
1E
nd
12.8
-36.9
Gra
te0.0
00.0
50.9
55.0
398.0
02.3
4398.3
024
Cir
0.0
12
0.8
3403.0
0I2
6-E
W2
21
24.0
29.8
Gra
te0.0
01.1
60.3
015.0
398.7
31.4
6399.0
824
Cir
0.0
12
1.5
0403.0
0I2
7-I
26
32
128.6
90.0
Gra
te0.0
00.1
80.3
010.0
399.7
82.8
0403.3
815
Cir
0.0
12
1.5
0407.2
5I2
8-I
27
43
93.4
0.0
Gra
te0.0
00.2
30.3
015.0
403.5
83.3
6406.7
215
Cir
0.0
12
1.0
0410.0
0I2
9-I
28
53
24.0
90.0
Gra
te0.0
00.0
70.9
55.0
403.3
80.9
2403.6
015
Cir
0.0
12
1.0
0407.2
5I3
0-I
28
62
17.4
-37.1
Hdw
l0.0
04.5
20.2
515.0
399.1
82.5
3399.6
224
Cir
0.0
12
1.0
0404.0
0H
W1-I
27
Pro
ject
File
: N
ort
heast.
stm
Num
ber
of
lines:
6D
ate
: 0
8-1
5-2
016
Hyd
raflo
w S
torm
Se
we
rs 2
00
5
98

Inle
t R
ep
ort
Pag
e
1
Lin
eIn
let
IDQ
=Q
Ju
nc
Cu
rb I
nle
tG
rate
In
let
Gu
tter
Inle
tB
yp
No
CIA
carr
ycap
tb
yp
typ
eli
ne
Ht
Lare
aL
WS
oW
Sw
Sx
nD
ep
thS
pre
ad
Dep
thS
pre
ad
Dep
rN
o(c
fs)
(cfs
)(c
fs)
(cfs
)(i
n)
(ft)
(sq
ft)
(ft)
(ft)
(ft/
ft)
(ft)
(ft/
ft)
(ft/
ft)
(ft)
(ft)
(ft)
(ft)
(in
)
1I2
60.3
90.0
00.3
90.0
0G
rate
0.0
0.0
08.0
04.0
02.0
0S
ag
2.0
00.0
10
0.0
10
0.0
00
-0.0
2-1
.88
0.0
61.2
51.0
0O
ff
2I2
72.3
30.0
02.3
30.0
0G
rate
0.0
0.0
08.0
04.0
02.0
0S
ag
2.0
00.0
10
0.0
10
0.0
00
0.1
312.7
90.2
112.7
91.0
0O
ff
3I2
80.4
00.0
00.4
00.0
0G
rate
0.0
0.0
08.0
04.0
02.0
0S
ag
2.0
00.0
10
0.0
10
0.0
00
-0.0
2-1
.80
0.0
71.2
71.0
0O
ff
4I2
90.4
60.0
00.4
60.0
0G
rate
0.0
0.0
08.0
04.0
02.0
0S
ag
2.0
00.0
10
0.0
10
0.0
00
-0.0
1-1
.15
0.0
71.3
91.0
0O
ff
5I3
00.5
50.0
00.5
50.0
0G
rate
0.0
0.0
08.0
04.0
02.0
0S
ag
2.0
00.0
10
0.0
10
0.0
00
0.0
0-0
.26
0.0
81.5
61.0
0O
ff
6H
W2
7.5
80.0
07.5
80.0
0H
dw
l0.0
0.0
00.0
00.0
00.0
0S
ag
0.0
00.0
00
0.0
00
0.0
00
0.0
00.0
00.0
00.0
00.0
0O
ff
Pro
ject
File
: N
ort
heast.
stm
Num
ber
of
lines:
6R
un D
ate
: 0
8-1
6-2
016
NO
TE
S:
Inle
t N
-Valu
es =
0.0
16 ;
Inte
nsity =
12725630.0
0 /
(In
let
tim
e +
126.8
0)
^ 2.9
2;
R
etu
rn p
eriod =
100 Y
rs.
; *
Indic
ate
s K
now
n Q
added
Hyd
raflo
w S
torm
Se
we
rs 2
00
5
99

Storm Sewer Summary Report Page 1
Line Line ID Flow Line Line Invert Invert Line HGL HGL Minor HGL DnsNo. rate size length EL Dn EL Up slope down up loss Junct line
(cfs) (in) (ft) (ft) (ft) (%) (ft) (ft) (ft) (ft) No.
1 I26-EW2 10.12 24 c 12.8 398.00 398.30 2.344 398.87 399.43 n/a 399.43 End
2 I27-I26 9.86 24 c 24.0 398.73 399.08 1.458 399.75 400.19 n/a 400.19 j 1
3 I28-I27 1.17 15 c 128.6 399.78 403.38 2.799 400.65 403.81 n/a 403.81 j 2
4 I29-I28 0.46 15 c 93.4 403.58 406.72 3.362 403.96 406.99 n/a 406.99 j 3
5 I30-I28 0.55 15 c 24.0 403.38 403.60 0.917 403.96 403.94 0.06 404.01 3
6 HW1-I27 7.58 24 c 17.4 399.18 399.62 2.529 400.57 400.59 n/a 400.59 j 2
Project File: Northeast.stm Number of lines: 6 Run Date: 08-16-2016
NOTES: c = cir; e = ellip; b = box; Return period = 100 Yrs. ; j - Line contains hyd. jump.
Hydraflow Storm Sewers 2005
100

Hyd
rafl
ow
Pla
n V
iew
Pro
ject F
ile: S
ou
th R
un
.stm
No
. L
ine
s: 2
40
2-1
2-2
01
6
Hyd
raflo
w S
torm
Se
we
rs 2
00
5
101

Sto
rm S
ew
er
Inven
tory
Rep
ort
Pag
e
1
Lin
eA
lig
nm
en
tF
low
Data
Ph
ysic
al
Data
Lin
e I
DN
o.
Dn
str
Lin
eD
efl
Ju
nc
Kn
ow
nD
rng
Ru
no
ffIn
let
Invert
Lin
eIn
vert
Lin
eL
ine
NJ-l
oss
Inle
t/li
ne
len
gth
an
gle
typ
eQ
are
aco
eff
tim
eE
l D
nslo
pe
El
Up
siz
ety
pe
valu
eco
eff
Rim
El
No
.(f
t)(d
eg
)(c
fs)
(ac)
(C)
(min
)(f
t)(%
)(f
t)(i
n)
(n)
(K)
(ft)
1E
nd
76.1
-7.4
Gra
te0.0
00.1
70.9
55.0
388.0
00.9
9388.7
542
Cir
0.0
12
1.5
0411
.00
I1-E
W1
21
97.5
90.0
Gra
te0.0
00.3
40.9
55.0
389.2
50.9
2390.1
536
Cir
0.0
02
0.5
0411
.00
I8-I
1
32
100.0
0.0
Gra
te0.0
00.3
40.9
55.0
390.1
51.3
7391.5
236
Cir
0.0
12
0.5
0411
.00
I9-I
8
43
158.8
0.0
Gra
te0.0
00.1
30.9
55.0
392.0
20.8
6393.3
930
Cir
0.0
12
1.5
0411
.00
I10-I
9
54
147.8
-106.9
Gra
te0.0
00.4
10.3
010.0
393.3
90.9
4394.7
830
Cir
0.0
12
0.5
0411
.00
I11-I
10
65
100.5
11.2
Gra
te0.0
00.2
50.3
010.0
394.7
80.8
9395.6
730
Cir
0.0
12
0.5
0411
.00
I12-I
11
76
35.1
0.0
MH
0.0
00.7
50.9
55.0
395.6
71.5
7396.2
230
Cir
0.0
12
1.0
0411
.30
MH
7-I
12
87
64.9
0.0
Gra
te0.0
00.3
50.3
010.0
396.2
20.7
7396.7
230
Cir
0.0
12
0.5
0411
.00
I13-M
H7
98
100.0
0.0
Gra
te0.0
00.4
30.3
010.0
397.2
21.0
6398.2
824
Cir
0.0
12
0.5
0411
.00
I14-I
13
10
9100.0
0.0
Gra
te0.0
00.5
30.3
010.0
398.2
80.8
0399.0
824
Cir
0.0
12
0.5
0411
.00
I15-I
14
1110
100.0
0.3
Gra
te0.0
00.6
40.3
010.0
399.0
81.7
5400.8
324
Cir
0.0
12
0.5
0411
.00
I16-I
15
12
11150.4
3.8
Gra
te0.0
00.7
60.3
015.0
400.8
30.9
1402.2
024
Cir
0.0
12
1.2
4411
.00
I17-I
16
13
7259.0
-90.0
MH
0.0
00.7
50.9
55.0
398.7
21.7
2403.1
830
Cir
0.0
12
1.0
0412.0
0M
H6-M
H7
14
13
273.0
90.0
MH
0.0
01.0
90.9
55.0
403.3
80.6
9405.2
630
Cir
0.0
12
0.1
5412.0
0M
H8-M
H7
15
14
273.0
0.0
MH
0.0
01.0
90.9
55.0
406.2
60.7
9408.4
218
Cir
0.0
12
1.0
0412.0
0M
H9-M
H8
16
12
185.8
-1.8
Gra
te0.0
00.2
30.5
05.0
402.7
06.2
9414.3
918
Cir
0.0
12
1.5
0420.0
0I1
8-I
17
17
16
173.4
6.7
Gra
te0.0
00.1
50.5
05.0
415.3
95.9
3425.6
715
Cir
0.0
12
1.5
0431.5
5I1
9-I
18
18
16
24.0
-85.9
Gra
te0.0
00.1
20.6
05.0
414.6
42.6
2415.2
715
Cir
0.0
12
1.0
0420.0
0I2
1-I
18
19
17
24.0
-88.2
Gra
te0.0
00.0
70.7
05.0
426.0
77.5
8427.8
915
Cir
0.0
12
1.0
0431.5
5I2
0-I
19
20
12
89.8
-52.6
Gra
te0.0
00.2
30.7
05.0
402.2
01.0
8403.1
724
Cir
0.0
12
0.9
8411
.00
I22-I
17
21
20
97.2
-36.9
Gra
te0.0
00.1
00.9
55.0
403.6
70.7
1404.3
618
Cir
0.0
12
0.5
0411
.00
I23-I
22
Pro
ject
File
: S
outh
Run.s
tmN
um
ber
of
lines:
24
Date
: 0
2-1
2-2
016
Hyd
raflo
w S
torm
Se
we
rs 2
00
5
102

Sto
rm S
ew
er
Inven
tory
Rep
ort
Pag
e
2
Lin
eA
lig
nm
en
tF
low
Data
Ph
ysic
al
Data
Lin
e I
DN
o.
Dn
str
Lin
eD
efl
Ju
nc
Kn
ow
nD
rng
Ru
no
ffIn
let
Invert
Lin
eIn
vert
Lin
eL
ine
NJ-l
oss
Inle
t/li
ne
len
gth
an
gle
typ
eQ
are
aco
eff
tim
eE
l D
nslo
pe
El
Up
siz
ety
pe
valu
eco
eff
Rim
El
No
.(f
t)(d
eg
)(c
fs)
(ac)
(C)
(min
)(f
t)(%
)(f
t)(i
n)
(n)
(K)
(ft)
22
21
54.8
1.1
MH
0.0
00.0
00.0
05.0
404.3
61.5
3405.2
018
Cir
0.0
12
1.0
0411
.40
MH
8-I
23
23
22
45.3
-0.2
Gra
te0.0
00.1
20.9
55.0
405.7
01.2
1406.2
515
Cir
0.0
12
1.0
0411
.00
I24-M
H8
24
22
24.0
89.1
Gra
te0.0
03.3
70.3
015.0
405.2
04.1
2406.1
918
Cir
0.0
12
1.0
0410.5
0I2
5-M
H8
Pro
ject
File
: S
outh
Run.s
tmN
um
ber
of
lines:
24
Date
: 0
2-1
2-2
016
Hyd
raflo
w S
torm
Se
we
rs 2
00
5
103

Inle
t R
ep
ort
Pag
e
1
Lin
eIn
let
IDQ
=Q
Ju
nc
Cu
rb I
nle
tG
rate
In
let
Gu
tter
Inle
tB
yp
No
CIA
carr
ycap
tb
yp
typ
eli
ne
Ht
Lare
aL
WS
oW
Sw
Sx
nD
ep
thS
pre
ad
Dep
thS
pre
ad
Dep
rN
o(c
fs)
(cfs
)(c
fs)
(cfs
)(i
n)
(ft)
(sq
ft)
(ft)
(ft)
(ft/
ft)
(ft)
(ft/
ft)
(ft/
ft)
(ft)
(ft)
(ft)
(ft)
(in
)
1I1
1.3
40.0
01.3
40.0
0G
rate
0.0
0.0
08.0
04.0
02.0
0S
ag
2.0
00.0
10
0.0
10
0.0
00
0.0
66.2
60.1
56.2
61.0
0O
ff
2I8
2.6
80.0
02.6
80.0
0G
rate
0.0
0.0
08.0
04.0
02.0
0S
ag
2.0
00.0
10
0.0
10
0.0
00
0.1
514.8
40.2
314.8
41.0
0O
ff
3I9
2.6
80.0
02.6
80.0
0G
rate
0.0
0.0
08.0
04.0
02.0
0S
ag
2.0
00.0
10
0.0
10
0.0
00
0.1
514.8
40.2
314.8
41.0
0O
ff
4I1
01.0
30.0
01.0
30.0
0G
rate
0.0
0.0
08.0
04.0
02.0
0S
ag
2.0
00.0
10
0.0
10
0.0
00
0.0
43.8
70.1
23.8
71.0
0O
ff
5I1
10.9
20.0
00.9
20.0
0G
rate
0.0
0.0
08.0
04.0
02.0
0S
ag
2.0
00.0
10
0.0
10
0.0
00
0.0
32.9
90.1
12.9
91.0
0O
ff
6I1
20.5
60.0
00.5
60.0
0G
rate
0.0
0.0
08.0
04.0
02.0
0S
ag
2.0
00.0
10
0.0
10
0.0
00
0.0
0-0
.19
0.0
81.5
81.0
0O
ff
7M
H7
5.9
10.0
00.0
05.9
1M
H0.0
0.0
00.0
00.0
00.0
0S
ag
0.0
00.0
00
0.0
00
0.0
00
0.0
00.0
00.0
00.0
00.0
0O
ff
8I1
30.7
80.0
00.7
80.0
0G
rate
0.0
0.0
08.0
04.0
02.0
0S
ag
2.0
00.0
10
0.0
10
0.0
00
0.0
21.8
50.1
01.9
71.0
0O
ff
9I1
40.9
60.0
00.9
60.0
0G
rate
0.0
0.0
08.0
04.0
02.0
0S
ag
2.0
00.0
10
0.0
10
0.0
00
0.0
33.3
50.1
23.3
51.0
0O
ff
10
I15
1.1
80.0
01.1
80.0
0G
rate
0.0
0.0
08.0
04.0
02.0
0S
ag
2.0
00.0
10
0.0
10
0.0
00
0.0
55.1
00.1
35.1
01.0
0O
ff
11I1
61.4
30.0
01.4
30.0
0G
rate
0.0
0.0
08.0
04.0
02.0
0S
ag
2.0
00.0
10
0.0
10
0.0
00
0.0
76.9
00.1
56.9
01.0
0O
ff
12
I17
1.5
30.0
01.5
30.0
0G
rate
0.0
0.0
08.0
04.0
02.0
0S
ag
2.0
00.0
10
0.0
10
0.0
00
0.0
87.6
00.1
67.6
01.0
0O
ff
13
MH
65.9
10.0
00.0
05.9
1M
H0.0
0.0
00.0
00.0
00.0
0S
ag
0.0
00.0
00
0.0
00
0.0
00
0.0
00.0
00.0
00.0
00.0
0O
ff
14
MH
58.5
90.0
00.0
08.5
9M
H0.0
0.0
00.0
00.0
00.0
0S
ag
0.0
00.0
00
0.0
00
0.0
00
0.0
00.0
00.0
00.0
00.0
0O
ff
15
MH
48.5
90.0
00.0
08.5
9M
H0.0
0.0
00.0
00.0
00.0
0S
ag
0.0
00.0
00
0.0
00
0.0
00
0.0
00.0
00.0
00.0
00.0
0O
ff
16
I18
0.9
50.0
00.9
50.0
0G
rate
0.0
0.0
02.0
04.0
02.0
0S
ag
2.0
00.0
10
0.0
10
0.0
00
0.0
33.3
10.1
23.3
11.0
0O
ff
17
I19
0.6
20.0
00.6
20.0
0G
rate
0.0
0.0
02.0
04.0
02.0
0S
ag
2.0
00.0
10
0.0
10
0.0
00
0.0
00.4
20.0
91.6
91.0
0O
ff
18
I21
0.6
00.0
00.6
00.0
0G
rate
0.0
0.0
02.0
04.0
02.0
0S
ag
2.0
00.0
10
0.0
10
0.0
00
0.0
00.1
80.0
91.6
51.0
0O
ff
19
I20
0.4
10.0
00.4
10.0
0G
rate
0.0
0.0
02.0
04.0
02.0
0S
ag
2.0
00.0
10
0.0
10
0.0
00
-0.0
2-1
.74
0.0
71.2
81.0
0O
ff
20
I22
1.3
40.0
01.3
40.0
0G
rate
0.0
0.0
02.0
04.0
02.0
0S
ag
2.0
00.0
10
0.0
10
0.0
00
0.0
66.2
30.1
56.2
31.0
0O
ff
21
I23
0.7
90.0
00.7
90.0
0G
rate
0.0
0.0
02.0
04.0
02.0
0S
ag
2.0
00.0
10
0.0
10
0.0
00
0.0
21.9
10.1
01.9
81.0
0O
ff
22
MH
80.0
00.0
00.0
00.0
0M
H0.0
0.0
00.0
00.0
00.0
0S
ag
0.0
00.0
00
0.0
00
0.0
00
0.0
00.0
00.0
00.0
00.0
0O
ff
Pro
ject
File
: S
outh
Run.s
tmN
um
ber
of
lines:
24
Run D
ate
: 0
2-1
2-2
016
NO
TE
S:
Inle
t N
-Valu
es =
0.0
16 ;
Inte
nsity =
12725630.0
0 /
(In
let
tim
e +
126.8
0)
^ 2.9
2;
R
etu
rn p
eriod =
100 Y
rs.
; *
Indic
ate
s K
now
n Q
added
Hyd
raflo
w S
torm
Se
we
rs 2
00
5
104

Inle
t R
ep
ort
Pag
e
2
Lin
eIn
let
IDQ
=Q
Ju
nc
Cu
rb I
nle
tG
rate
In
let
Gu
tter
Inle
tB
yp
No
CIA
carr
ycap
tb
yp
typ
eli
ne
Ht
Lare
aL
WS
oW
Sw
Sx
nD
ep
thS
pre
ad
Dep
thS
pre
ad
Dep
rN
o(c
fs)
(cfs
)(c
fs)
(cfs
)(i
n)
(ft)
(sq
ft)
(ft)
(ft)
(ft/
ft)
(ft)
(ft/
ft)
(ft/
ft)
(ft)
(ft)
(ft)
(ft)
(in
)
23
I24
0.9
50.0
00.9
50.0
0G
rate
0.0
0.0
02.0
04.0
02.0
0S
ag
2.0
00.0
10
0.0
10
0.0
00
0.0
33.2
40.1
23.2
41.0
0O
ff
24
I25
6.7
80.0
06.7
80.0
0G
rate
0.0
0.0
02.0
04.0
02.0
0S
ag
2.0
00.0
10
0.0
10
0.0
00
0.3
534.7
00.4
334.7
01.0
0O
ff
Pro
ject
File
: S
outh
Run.s
tmN
um
ber
of
lines:
24
Run D
ate
: 0
2-1
2-2
016
NO
TE
S:
Inle
t N
-Valu
es =
0.0
16 ;
Inte
nsity =
12725630.0
0 /
(In
let
tim
e +
126.8
0)
^ 2.9
2;
R
etu
rn p
eriod =
100 Y
rs.
; *
Indic
ate
s K
now
n Q
added
Hyd
raflo
w S
torm
Se
we
rs 2
00
5
105

Storm Sewer Summary Report Page 1
Line Line ID Flow Line Line Invert Invert Line HGL HGL Minor HGL DnsNo. rate size length EL Dn EL Up slope down up loss Junct line
(cfs) (in) (ft) (ft) (ft) (%) (ft) (ft) (ft) (ft) No.
1 I1-EW1 43.36 42 c 76.1 388.00 388.75 0.985 390.02 390.77 n/a 390.77 End
2 I8-I1 42.62 36 c 97.5 389.25 390.15 0.923 391.09 392.23 n/a 392.23 j 1
3 I9-I8 40.89 36 c 100.0 390.15 391.52 1.370 392.74 393.56 n/a 393.56 j 2
4 I10-I9 39.18 30 c 158.8 392.02 393.39 0.863 393.96 395.48 n/a 395.48 j 3
5 I11-I10 38.66 30 c 147.8 393.39 394.78 0.941 395.76 396.86 n/a 396.86 j 4
6 I12-I11 38.06 30 c 100.5 394.78 395.67 0.885 397.14 397.73 n/a 397.73 j 5
7 MH7-I12 37.65 30 c 35.1 395.67 396.22 1.567 398.02 398.27 n/a 398.27 j 6
8 I13-MH7 15.83 30 c 64.9 396.22 396.72 0.770 399.30* 399.38* 0.08 399.46 7
9 I14-I13 15.27 24 c 100.0 397.22 398.28 1.060 399.46 399.67 n/a 400.00 j 8
10 I15-I14 14.56 24 c 100.0 398.28 399.08 0.800 400.34 400.52 0.28 400.80 9
11 I16-I15 13.64 24 c 100.0 399.08 400.83 1.750 401.07 402.14 n/a 402.14 j 10
12 I17-I16 12.56 24 c 150.4 400.83 402.20 0.911 402.50 403.46 n/a 403.46 j 11
13 MH6-MH7 21.98 30 c 259.0 398.72 403.18 1.722 399.79 404.75 n/a 404.75 j 7
14 MH8-MH7 16.84 30 c 273.0 403.38 405.26 0.689 405.28 406.63 n/a 406.63 j 13
15 MH9-MH8 8.59 18 c 273.0 406.26 408.42 0.791 407.32 409.54 n/a 409.54 j 14
16 I18-I17 2.33 18 c 185.8 402.70 414.39 6.292 404.00 414.97 n/a 414.97 j 12
17 I19-I18 1.00 15 c 173.4 415.39 425.67 5.928 415.60 426.07 n/a 426.07 j 16
18 I21-I18 0.60 15 c 24.0 414.64 415.27 2.625 415.18 415.58 n/a 415.58 j 16
19 I20-I19 0.41 15 c 24.0 426.07 427.89 7.583 426.20 428.15 n/a 428.15 j 17
20 I22-I17 9.13 24 c 89.8 402.20 403.17 1.080 403.89 404.24 n/a 404.24 j 12
21 I23-I22 8.13 18 c 97.2 403.67 404.36 0.710 404.73 405.45 0.27 405.72 20
22 MH8-I23 7.53 18 c 54.8 404.36 405.20 1.533 405.98 406.25 n/a 406.25 j 21
23 I24-MH8 0.95 15 c 45.3 405.70 406.25 1.214 406.75 406.73 0.07 406.80 22
24 I25-MH8 6.78 18 c 24.0 405.20 406.19 4.125 406.53 407.18 n/a 407.18 j 22
Project File: South Run.stm Number of lines: 24 Run Date: 02-12-2016
NOTES: c = cir; e = ellip; b = box; Return period = 100 Yrs. ; *Surcharged (HGL above crown). ; j - Line contains hyd. jump.
Hydraflow Storm Sewers 2005
106

Hyd
rafl
ow
Pla
n V
iew
Pro
ject F
ile: D
irty
Ea
st.stm
No
. L
ine
s: 5
08
-12
-20
16
Hyd
raflo
w S
torm
Se
we
rs 2
00
5
107

Sto
rm S
ew
er
Inven
tory
Rep
ort
Pag
e
1
Lin
eA
lig
nm
en
tF
low
Data
Ph
ysic
al
Data
Lin
e I
DN
o.
Dn
str
Lin
eD
efl
Ju
nc
Kn
ow
nD
rng
Ru
no
ffIn
let
Invert
Lin
eIn
vert
Lin
eL
ine
NJ-l
oss
Inle
t/li
ne
len
gth
an
gle
typ
eQ
are
aco
eff
tim
eE
l D
nslo
pe
El
Up
siz
ety
pe
valu
eco
eff
Rim
El
No
.(f
t)(d
eg
)(c
fs)
(ac)
(C)
(min
)(f
t)(%
)(f
t)(i
n)
(n)
(K)
(ft)
1E
nd
58.7
82.8
Gra
te0.0
00.1
40.9
55.0
403.0
02.9
7404.7
415
Cir
0.0
09
1.5
0411
.00
O-I
31
21
95.0
-90.1
Gra
te0.0
00.2
40.9
55.0
404.9
40.6
4405.5
515
Cir
0.0
09
0.9
6411
.00
I31-I
32
32
62.4
35.9
Gra
te0.0
00.0
80.9
55.0
405.7
50.8
2406.2
615
Cir
0.0
09
0.9
6411
.00
I32-I
33
43
100.0
-35.8
Gra
te0.0
00.1
00.9
55.0
406.4
60.5
0406.9
615
Cir
0.0
09
0.5
0411
.00
I33-I
34
54
100.0
0.0
Gra
te0.0
00.0
90.9
55.0
407.1
60.5
5407.7
115
Cir
0.0
09
1.0
0411
.00
I34-I
35
Pro
ject
File
: D
irty
East.
stm
Num
ber
of
lines:
5D
ate
: 0
8-1
2-2
016
Hyd
raflo
w S
torm
Se
we
rs 2
00
5
108

Inle
t R
ep
ort
Pag
e
1
Lin
eIn
let
IDQ
=Q
Ju
nc
Cu
rb I
nle
tG
rate
In
let
Gu
tter
Inle
tB
yp
No
CIA
carr
ycap
tb
yp
typ
eli
ne
Ht
Lare
aL
WS
oW
Sw
Sx
nD
ep
thS
pre
ad
Dep
thS
pre
ad
Dep
rN
o(c
fs)
(cfs
)(c
fs)
(cfs
)(i
n)
(ft)
(sq
ft)
(ft)
(ft)
(ft/
ft)
(ft)
(ft/
ft)
(ft/
ft)
(ft)
(ft)
(ft)
(ft)
(in
)
1I-
31
1.1
00.0
01.1
00.0
0G
rate
0.0
0.0
00.3
84.0
02.0
0S
ag
2.0
00.0
80
0.0
50
0.0
13
0.1
92.6
70.3
02.6
72.0
0O
ff
2I-
32
1.8
90.0
01.8
90.0
0G
rate
0.0
0.0
00.6
44.0
02.0
0S
ag
2.0
00.0
80
0.0
50
0.0
13
0.1
92.6
70.3
02.6
72.0
01
3I-
33
0.6
30.0
00.6
30.0
0G
rate
0.0
0.0
00.2
14.0
02.0
0S
ag
2.0
00.0
80
0.0
50
0.0
13
0.1
92.6
70.3
02.6
72.0
02
4I-
34
0.7
90.0
00.7
90.0
0G
rate
0.0
0.0
00.2
74.0
02.0
0S
ag
2.0
00.0
80
0.0
50
0.0
13
0.1
92.6
70.3
02.6
72.0
03
5I-
35
0.7
10.0
00.7
10.0
0G
rate
0.0
0.0
00.2
44.0
02.0
0S
ag
2.0
00.0
80
0.0
50
0.0
13
0.1
92.6
70.3
02.6
72.0
04
Pro
ject
File
: D
irty
East.
stm
Num
ber
of
lines:
5R
un D
ate
: 0
8-1
2-2
016
NO
TE
S:
Inle
t N
-Valu
es =
0.0
16 ;
Inte
nsity =
12725630.0
0 /
(In
let
tim
e +
126.8
0)
^ 2.9
2;
R
etu
rn p
eriod =
100 Y
rs.
; *
Indic
ate
s K
now
n Q
added
Hyd
raflo
w S
torm
Se
we
rs 2
00
5
109

Storm Sewer Summary Report Page 1
Line Line ID Flow Line Line Invert Invert Line HGL HGL Minor HGL DnsNo. rate size length EL Dn EL Up slope down up loss Junct line
(cfs) (in) (ft) (ft) (ft) (%) (ft) (ft) (ft) (ft) No.
1 O-I31 4.56 15 c 58.7 403.00 404.74 2.966 403.49 405.59 0.61 405.59 End
2 I31-I32 3.62 15 c 95.0 404.94 405.55 0.642 405.86 406.31 n/a 406.31 j 1
3 I32-I33 1.94 15 c 62.4 405.75 406.26 0.818 406.60 406.82 n/a 406.82 j 2
4 I33-I34 1.41 15 c 100.0 406.46 406.96 0.500 407.01 407.43 n/a 407.43 j 3
5 I34-I35 0.71 15 c 100.0 407.16 407.71 0.550 407.60 408.05 n/a 408.05 j 4
Project File: Dirty East.stm Number of lines: 5 Run Date: 08-12-2016
NOTES: c = cir; e = ellip; b = box; Return period = 100 Yrs. ; j - Line contains hyd. jump.
Hydraflow Storm Sewers 2005
110

Hyd
rafl
ow
Pla
n V
iew
Pro
ject F
ile: D
irty
We
st.stm
No
. L
ine
s: 6
08
-12
-20
16
Hyd
raflo
w S
torm
Se
we
rs 2
00
5
111

Sto
rm S
ew
er
Inven
tory
Rep
ort
Pag
e
1
Lin
eA
lig
nm
en
tF
low
Data
Ph
ysic
al
Data
Lin
e I
DN
o.
Dn
str
Lin
eD
efl
Ju
nc
Kn
ow
nD
rng
Ru
no
ffIn
let
Invert
Lin
eIn
vert
Lin
eL
ine
NJ-l
oss
Inle
t/li
ne
len
gth
an
gle
typ
eQ
are
aco
eff
tim
eE
l D
nslo
pe
El
Up
siz
ety
pe
valu
eco
eff
Rim
El
No
.(f
t)(d
eg
)(c
fs)
(ac)
(C)
(min
)(f
t)(%
)(f
t)(i
n)
(n)
(K)
(ft)
1E
nd
58.7
82.8
Gra
te0.0
00.1
40.9
55.0
403.0
02.9
7404.7
415
Cir
0.0
09
1.5
0411
.00
O-I
31
21
133.6
89.9
Gra
te0.0
00.0
30.9
55.0
404.9
40.7
0405.8
715
Cir
0.0
09
1.5
0411
.00
I31-I
37
32
63.5
-89.9
Gra
te0.0
00.0
50.9
55.0
405.9
70.5
4406.3
115
Cir
0.0
09
0.5
0411
.00
I37-I
38
43
100.0
0.0
Gra
te0.0
00.0
90.9
55.0
406.4
10.5
3406.9
415
Cir
0.0
09
0.5
0411
.00
I38-I
39
54
100.0
0.0
Gra
te0.0
00.0
90.9
55.0
407.1
40.6
0407.7
415
Cir
0.0
09
1.0
0411
.00
I39-I
40
62
51.8
90.1
Gra
te0.0
00.0
50.9
55.0
406.0
70.8
3406.5
015
Cir
0.0
09
1.0
0411
.00
I37-I
40
Pro
ject
File
: D
irty
West.
stm
Num
ber
of
lines:
6D
ate
: 0
8-1
2-2
016
Hyd
raflo
w S
torm
Se
we
rs 2
00
5
112

Inle
t R
ep
ort
Pag
e
1
Lin
eIn
let
IDQ
=Q
Ju
nc
Cu
rb I
nle
tG
rate
In
let
Gu
tter
Inle
tB
yp
No
CIA
carr
ycap
tb
yp
typ
eli
ne
Ht
Lare
aL
WS
oW
Sw
Sx
nD
ep
thS
pre
ad
Dep
thS
pre
ad
Dep
rN
o(c
fs)
(cfs
)(c
fs)
(cfs
)(i
n)
(ft)
(sq
ft)
(ft)
(ft)
(ft/
ft)
(ft)
(ft/
ft)
(ft/
ft)
(ft)
(ft)
(ft)
(ft)
(in
)
1I-
31
1.1
00.0
01.1
00.0
0G
rate
0.0
0.0
00.3
84.0
02.0
0S
ag
2.0
00.0
80
0.0
50
0.0
13
0.1
92.6
70.3
02.6
72.0
0O
ff
2I-
37
0.2
40.0
00.2
40.0
0G
rate
0.0
0.0
00.0
84.0
02.0
0S
ag
2.0
00.0
80
0.0
50
0.0
13
0.1
92.6
70.3
02.6
72.0
01
3I-
38
0.3
90.0
00.3
90.0
0G
rate
0.0
0.0
00.1
34.0
02.0
0S
ag
2.0
00.0
80
0.0
50
0.0
13
0.1
92.6
70.3
02.6
72.0
02
4I-
39
0.7
10.0
00.7
10.0
0G
rate
0.0
0.0
00.2
44.0
02.0
0S
ag
2.0
00.0
80
0.0
50
0.0
13
0.1
92.6
70.3
02.6
72.0
03
5I-
40
0.7
10.0
00.7
10.0
0G
rate
0.0
0.0
00.2
44.0
02.0
0S
ag
2.0
00.0
80
0.0
50
0.0
13
0.1
92.6
70.3
02.6
72.0
04
6I-
41
0.3
90.0
00.3
90.0
0G
rate
0.0
0.0
00.1
34.0
02.0
0S
ag
2.0
00.0
80
0.0
50
0.0
13
0.1
92.6
70.3
02.6
72.0
02
Pro
ject
File
: D
irty
West.
stm
Num
ber
of
lines:
6R
un D
ate
: 0
8-1
2-2
016
NO
TE
S:
Inle
t N
-Valu
es =
0.0
16 ;
Inte
nsity =
12725630.0
0 /
(In
let
tim
e +
126.8
0)
^ 2.9
2;
R
etu
rn p
eriod =
100 Y
rs.
; *
Indic
ate
s K
now
n Q
added
Hyd
raflo
w S
torm
Se
we
rs 2
00
5
113

Storm Sewer Summary Report Page 1
Line Line ID Flow Line Line Invert Invert Line HGL HGL Minor HGL DnsNo. rate size length EL Dn EL Up slope down up loss Junct line
(cfs) (in) (ft) (ft) (ft) (%) (ft) (ft) (ft) (ft) No.
1 O-I31 3.10 15 c 58.7 403.00 404.74 2.966 403.39 405.44 n/a 405.44 End
2 I31-I37 2.19 15 c 133.6 404.94 405.87 0.696 405.69 406.46 n/a 406.46 j 1
3 I37-I38 1.65 15 c 63.5 405.97 406.31 0.535 406.66 406.82 n/a 406.82 j 2
4 I38-I39 1.33 15 c 100.0 406.41 406.94 0.530 406.99 407.40 n/a 407.40 j 3
5 I39-I40 0.71 15 c 100.0 407.14 407.74 0.600 407.56 408.08 n/a 408.08 j 4
6 I37-I40 0.39 15 c 51.8 406.07 406.50 0.830 406.69 406.75 n/a 406.75 j 2
Project File: Dirty West.stm Number of lines: 6 Run Date: 08-12-2016
NOTES: c = cir; e = ellip; b = box; Return period = 100 Yrs. ; j - Line contains hyd. jump.
Hydraflow Storm Sewers 2005
114

WASTE WATER LAGOON
CALCULATIONS
115

This page intentionally left blank.
116

Gourmet's Delight - New Tank Sizing
57,350 sf (Exposed Impervious Area) x
0.63' (24 Hr - 100 Yr Rainfall) =
269,541 gal (Freeboard Req)
Full Build Out = 60 Doubles x
7 Crops/Dbl =
420 Crops/Year
420 / 52 weeks = 8 Doubles per Week Of MS
1 Dbls of MS Requires:
40,000 gal of 'dirty' water
10,000 gal of 'fresh' water
Weekly Requirement:
320,000 gal of 'dirty' water
Existing Tank Sizes:
75' x 14' = 429,375 gal w/ 1' of Freeboard
46' x 12' = 136,672 gal w/ 1' of Freeboard
New Tank Size:
112' x 14' = 1,031,182 gal
Need 4.2' of Freeboard at all times (3.7' + 0.5')
Volume of 112' x 9.8' = 721,827 gal
Storage Capacity in all Three Tanks:
1,287,874 gal / 320,000 gal =
1 MONTH
117

This page intentionally left blank.
118

NOI APPENDIX “D” WORKSHEETS
119

This page intentionally left blank.
120

Appendix D. Worksheets
Worksheet 1. General Site Information
INSTRUCTIONS: Fill out Worksheet 1 for each watershed
Date: February 12, 2016
Project Name: Gourmet's Delight Mushroom
Municipality: Franklin
County: Chester
Total Area (acres): 32.2
Major River Basin: Delaware
Watershed: Christina
Sub-Basin:
Nearest Surface Water(s) to Receive Runoff: Indian Run
Chapter 93 – Designated Water Use/Existing Water Use: TSF/MF
Impaired according to Category 4 or 5 of the Integrated Water Quality Monitoring and Assessment Report? Yes No
List Causes of Impairment: nutrients, pathogens, mercury
Is there an established TMDL that applies: Yes No
Total Maximum Daily Loads (TMDLS)
Is project subject to, or part of:
Municipal Separate Storm Sewer System (MS4) Requirements? Yes No
Existing or planned drinking water supply? Yes No
If yes, distance from proposed discharge (miles):
Approved Act 167 Plan? Yes No
Existing River Conservation Plan? Yes No
121

Worksheet 2. Sensitive Natural Resources from PA Stormwater Best Management Practices Chapter 5
INSTRUCTIONS
1. Provide Sensitive Resources Map according to non-structural BMP 5.4.1 in Chapter 5. This map should identify wetlands, woodlands, natural drainage ways, steep slopes, and other sensitive natural areas.
2. Summarize the existing extent of each sensitive resource in the Existing Sensitive Resources Table (below, using Acres). If none present, insert 0.
3. Summarize Total Protected Area as defined under BMPs in Chapter 5.
4. Do not count any area twice. For example, an area that is both a floodplain and a wetland may only be considered once.
EXISTING NATURAL SENSITIVE RESOURCE
MAPPED? Yes/no/n/a
TOTAL AREA (Ac.)
PROTECTED AREA (Ac.)
Waterbodies Floodplains Riparian Areas Wetlands Woodlands Y 2.636 0 Natural Drainage Ways Steep Slopes, 15% - 25% Steep Slopes, over 25% Other: Other: TOTAL EXISTING: 2.636 0
122
DA #1

Worksheet 2. Sensitive Natural Resources from PA Stormwater Best Management Practices Chapter 5
INSTRUCTIONS
1. Provide Sensitive Resources Map according to non-structural BMP 5.4.1 in Chapter 5. This map should identify wetlands, woodlands, natural drainage ways, steep slopes, and other sensitive natural areas.
2. Summarize the existing extent of each sensitive resource in the Existing Sensitive Resources Table (below, using Acres). If none present, insert 0.
3. Summarize Total Protected Area as defined under BMPs in Chapter 5.
4. Do not count any area twice. For example, an area that is both a floodplain and a wetland may only be considered once.
EXISTING NATURAL SENSITIVE RESOURCE
MAPPED? Yes/no/n/a
TOTAL AREA (Ac.)
PROTECTED AREA (Ac.)
Waterbodies Floodplains Riparian Areas Wetlands Woodlands Y 1.502 0 Natural Drainage Ways Steep Slopes, 15% - 25% Steep Slopes, over 25% Other: Other: TOTAL EXISTING: 1.502 0
123
DA #2

Worksheet 2. Sensitive Natural Resources from PA Stormwater Best Management Practices Chapter 5
INSTRUCTIONS
1. Provide Sensitive Resources Map according to non-structural BMP 5.4.1 in Chapter 5. This map should identify wetlands, woodlands, natural drainage ways, steep slopes, and other sensitive natural areas.
2. Summarize the existing extent of each sensitive resource in the Existing Sensitive Resources Table (below, using Acres). If none present, insert 0.
3. Summarize Total Protected Area as defined under BMPs in Chapter 5.
4. Do not count any area twice. For example, an area that is both a floodplain and a wetland may only be considered once.
EXISTING NATURAL SENSITIVE RESOURCE
MAPPED? Yes/no/n/a
TOTAL AREA (Ac.)
PROTECTED AREA (Ac.)
Waterbodies Floodplains Riparian Areas Wetlands Woodlands Natural Drainage Ways Steep Slopes, 15% - 25% Steep Slopes, over 25% Other: Other: TOTAL EXISTING: 0 0
124
DA #3
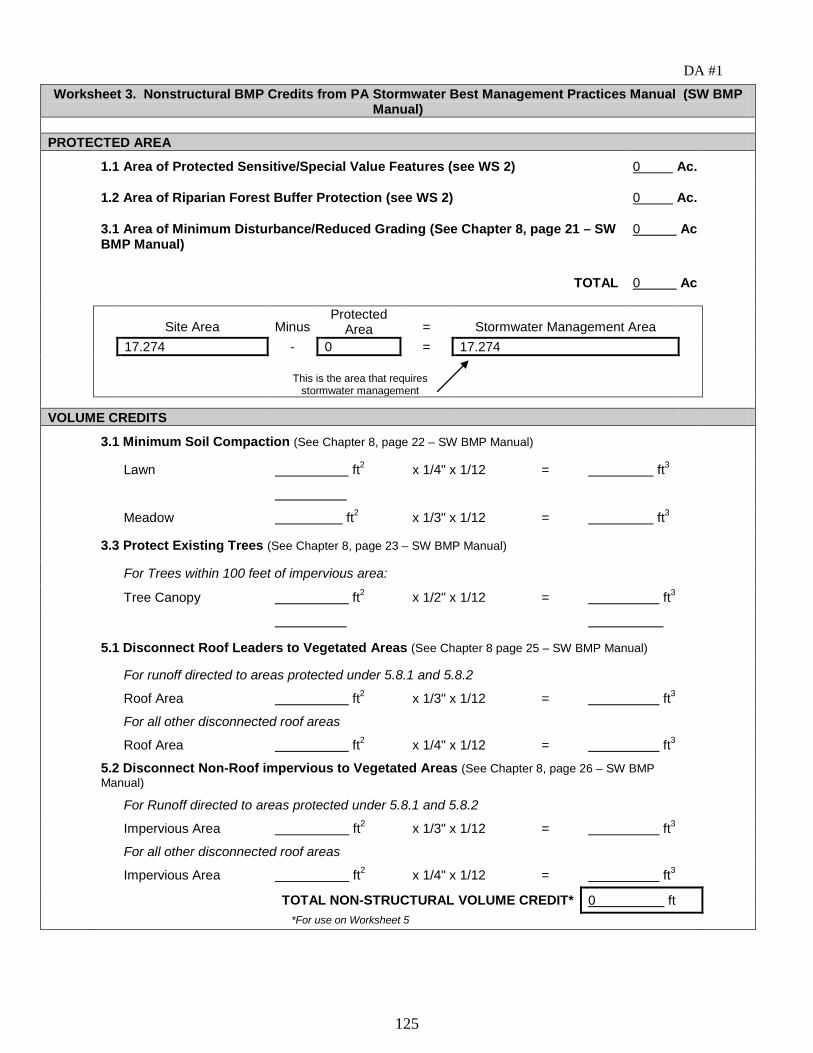
Worksheet 3. Nonstructural BMP Credits from PA Stormwater Best Management Practices Manual (SW BMP Manual)
PROTECTED AREA 1.1 Area of Protected Sensitive/Special Value Features (see WS 2) 0 Ac.
1.2 Area of Riparian Forest Buffer Protection (see WS 2) 0 Ac.
3.1 Area of Minimum Disturbance/Reduced Grading (See Chapter 8, page 21 – SW BMP Manual)
0 Ac
TOTAL 0 Ac
Site Area Minus Protected
Area = Stormwater Management Area
17.274 - 0 = 17.274
This is the area that requires stormwater management
VOLUME CREDITS
3.1 Minimum Soil Compaction (See Chapter 8, page 22 – SW BMP Manual)
Lawn ft2 x 1/4" x 1/12 = ft3
Meadow ft2 x 1/3" x 1/12 = ft3
3.3 Protect Existing Trees (See Chapter 8, page 23 – SW BMP Manual)
For Trees within 100 feet of impervious area:
Tree Canopy ft2 x 1/2" x 1/12 = ft3
5.1 Disconnect Roof Leaders to Vegetated Areas (See Chapter 8 page 25 – SW BMP Manual)
For runoff directed to areas protected under 5.8.1 and 5.8.2
Roof Area ft2 x 1/3" x 1/12 = ft3
For all other disconnected roof areas
Roof Area ft2 x 1/4" x 1/12 = ft3
5.2 Disconnect Non-Roof impervious to Vegetated Areas (See Chapter 8, page 26 – SW BMP Manual)
For Runoff directed to areas protected under 5.8.1 and 5.8.2
Impervious Area ft2 x 1/3" x 1/12 = ft3
For all other disconnected roof areas
Impervious Area ft2 x 1/4" x 1/12 = ft3
TOTAL NON-STRUCTURAL VOLUME CREDIT* 0 ft *For use on Worksheet 5
125
DA #1

3150-PM-BWEW0035 Rev. 10/2015 Checklist
- 17 -
Worksheet 3. Nonstructural BMP Credits from PA Stormwater Best Management Practices Manual (SW BMP Manual)
PROTECTED AREA
1.1 Area of Protected Sensitive/Special Value Features (see WS 2) 0 Ac.
1.2 Area of Riparian Forest Buffer Protection (see WS 2) 0 Ac.
3.1 Area of Minimum Disturbance/Reduced Grading (See Chapter 8, page 21 – SW BMP Manual)
0 Ac
TOTAL 0 Ac
Site Area Minus
Protected Area = Stormwater Management Area
7.427 - 0 = 7.427
This is the area that requires stormwater management
VOLUME CREDITS
3.1 Minimum Soil Compaction (See Chapter 8, page 22 – SW BMP Manual)
Lawn ft2 x 1/4" x 1/12 = ft
3
Meadow ft2 x 1/3" x 1/12 = ft
3
3.3 Protect Existing Trees (See Chapter 8, page 23 – SW BMP Manual)
For Trees within 100 feet of impervious area:
Tree Canopy ft2 x 1/2" x 1/12 = ft
3
5.1 Disconnect Roof Leaders to Vegetated Areas (See Chapter 8 page 25 – SW BMP Manual)
For runoff directed to areas protected under 5.8.1 and 5.8.2
Roof Area ft2 x 1/3" x 1/12 = ft
3
For all other disconnected roof areas
Roof Area ft2 x 1/4" x 1/12 = ft
3
5.2 Disconnect Non-Roof impervious to Vegetated Areas (See Chapter 8, page 26 – SW BMP
Manual)
For Runoff directed to areas protected under 5.8.1 and 5.8.2
Impervious Area ft2 x 1/3" x 1/12 = ft
3
For all other disconnected roof areas
Impervious Area ft2 x 1/4" x 1/12 = ft
3
TOTAL NON-STRUCTURAL VOLUME CREDIT* 0 ft
*For use on Worksheet 5
126
DA #2

3150-PM-BWEW0035 Rev. 10/2015 Checklist
- 17 -
Worksheet 3. Nonstructural BMP Credits from PA Stormwater Best Management Practices Manual (SW BMP Manual)
PROTECTED AREA
1.1 Area of Protected Sensitive/Special Value Features (see WS 2) 0 Ac.
1.2 Area of Riparian Forest Buffer Protection (see WS 2) 0 Ac.
3.1 Area of Minimum Disturbance/Reduced Grading (See Chapter 8, page 21 – SW BMP Manual)
0 Ac
TOTAL 0 Ac
Site Area Minus
Protected Area = Stormwater Management Area
0.061 - 0 = 0.061
This is the area that requires stormwater management
VOLUME CREDITS
3.1 Minimum Soil Compaction (See Chapter 8, page 22 – SW BMP Manual)
Lawn ft2 x 1/4" x 1/12 = ft
3
Meadow ft2 x 1/3" x 1/12 = ft
3
3.3 Protect Existing Trees (See Chapter 8, page 23 – SW BMP Manual)
For Trees within 100 feet of impervious area:
Tree Canopy ft2 x 1/2" x 1/12 = ft
3
5.1 Disconnect Roof Leaders to Vegetated Areas (See Chapter 8 page 25 – SW BMP Manual)
For runoff directed to areas protected under 5.8.1 and 5.8.2
Roof Area ft2 x 1/3" x 1/12 = ft
3
For all other disconnected roof areas
Roof Area ft2 x 1/4" x 1/12 = ft
3
5.2 Disconnect Non-Roof impervious to Vegetated Areas (See Chapter 8, page 26 – SW BMP
Manual)
For Runoff directed to areas protected under 5.8.1 and 5.8.2
Impervious Area ft2 x 1/3" x 1/12 = ft
3
For all other disconnected roof areas
Impervious Area ft2 x 1/4" x 1/12 = ft
3
TOTAL NON-STRUCTURAL VOLUME CREDIT* 0 ft
*For use on Worksheet 5
127
DA #3

3150-PM-BWEW0035 Rev. 1/2013
Project: Gourmet's Delight
Drainage Area: DA #1
2- Yr. Rainfall: 3.2 inches
Total Site Area: 9.786
Protected Site Area: 0.000
Managed Area: 9.786
Existing Conditions:
Cover Type/Condition Soil Type
Area
(sf)
Acres
(ac) CN S
Ia
(0.2*S)
Q
Runoff1
(in.)
Runoff
Volume2
(ft3)
Meadow B 376881.12 8.652 58 7.241 1.448 0.341 10716Woods B 49397.04 1.134 55 8.182 1.636 0.251 1033
426278.16 9.786 11749
Developed Conditions:
Cover Type/Condition Soil Type
Area
(sf)
Acres
(ac) CN S
Ia
(0.2*S)
Q
Runoff1
(in.)
Runoff
Volume2
(ft3)
Impervious B 360066.96 8.266 98 0.204 0.041 2.967 89041
Meadow B 278522.64 6.394 58 7.241 1.448 0.341 7920Woods B 2439.36 0.056 55 8.182 1.636 0.251 51
641028.96 14.716 97012
*Difference in Existing vs. Developed acreages due to changes in topography.
2 - Year Volume Increase (ft3): 85263
2 - Year Volume Increase = Developed Conditions Runoff Volume - Existing Conditions Runoff Volume
1. Runoff (in) = Q = (P-0.2S)2/(P+0.8S) where
P = 2 Yr Rainfall (in)
S = (1000/CN) - 10
2. Runoff Volume (CF) = Q x Area x 1/12
Q = Runoff (in)
Area = Land Use Area (sf)
Note: Runoff Volume must be calculated for each land use type/condition and HSGI.
The use of a weighted CN value for volume calculations is not acceptable.
WORKSHEET 4: CHANGE IN RUNOFF VOLUME FOR 2-YR STORM EVENT
128

3150-PM-BWEW0035 Rev. 1/2013
Project: Gourmet's Delight
Drainage Area: DA #2
2- Yr. Rainfall: 3.2 inches
Total Site Area: 7.427
Protected Site Area: 0.000
Managed Area: 7.427
Existing Conditions:
Cover Type/Condition Soil Type
Area
(sf)
Acres
(ac) CN S
Ia
(0.2*S)
Q
Runoff1
(in.)
Runoff
Volume2
(ft3)
Meadow B 258093 5.925 58 7.241 1.448 0.341 7339Woods B 65427.12 1.502 55 8.182 1.636 0.251 1368
323520.12 7.427 8707
Developed Conditions:
Cover Type/Condition Soil Type
Area
(sf)
Acres
(ac) CN S
Ia
(0.2*S)
Q
Runoff1
(in.)
Runoff
Volume2
(ft3)
Impervious B 76534.92 1.757 98 0.204 0.041 2.967 18926Meadow B 32190.84 0.739 58 7.241 1.448 0.341 915
108725.76 2.496 19842
*Difference in Existing vs. Developed acreages due to changes in topography.
2 - Year Volume Increase (ft3): 11135
2 - Year Volume Increase = Developed Conditions Runoff Volume - Existing Conditions Runoff Volume
1. Runoff (in) = Q = (P-0.2S)2/(P+0.8S) where
P = 2 Yr Rainfall (in)
S = (1000/CN) - 10
2. Runoff Volume (CF) = Q x Area x 1/12
Q = Runoff (in)
Area = Land Use Area (sf)
Note: Runoff Volume must be calculated for each land use type/condition and HSGI.
The use of a weighted CN value for volume calculations is not acceptable.
WORKSHEET 4: CHANGE IN RUNOFF VOLUME FOR 2-YR STORM EVENT
129

3150-PM-BWEW0035 Rev. 1/2013
Project: Gourmet's Delight
Drainage Area: DA #3
2- Yr. Rainfall: 3.2 inches
Total Site Area: 0.061
Protected Site Area: 0.000
Managed Area: 0.061
Existing Conditions:
Cover Type/Condition Soil Type
Area
(sf)
Acres
(ac) CN S
Ia
(0.2*S)
Q
Runoff1
(in.)
Runoff
Volume2
(ft3)
Meadow B 2657.16 0.061 58 7.241 1.448 0.341 76
2657.16 0.061 76
Developed Conditions:
Cover Type/Condition Soil Type
Area
(sf)
Acres
(ac) CN S
Ia
(0.2*S)
Q
Runoff1
(in.)
Runoff
Volume2
(ft3)
Meadow B 522.72 0.012 58 7.241 1.448 0.341 15
522.72 0.012 15
2 - Year Volume Increase (ft3): -61
2 - Year Volume Increase = Developed Conditions Runoff Volume - Existing Conditions Runoff Volume
1. Runoff (in) = Q = (P-0.2S)2/(P+0.8S) where
P = 2 Yr Rainfall (in)
S = (1000/CN) - 10
2. Runoff Volume (CF) = Q x Area x 1/12
Q = Runoff (in)
Area = Land Use Area (sf)
Note: Runoff Volume must be calculated for each land use type/condition and HSGI.
The use of a weighted CN value for volume calculations is not acceptable.
WORKSHEET 4: CHANGE IN RUNOFF VOLUME FOR 2-YR STORM EVENT
130

3150-PM-BWEW0035 Rev. 10/2015 Checklist
- 19 -
Worksheet 5. Structural BMP Volume Credits
PROJECT: Gourmet's Delight Mushroom SUB-BASIN: DA #1
Required Control Volume (ft3) – from Worksheet 4: 85263
Non-structural Volume Credit (ft3) – from Worksheet 3: - 0
(maximum is 25% of required volume)
Structural Volume Reqmt (ft3) 85263
(Required Control Volume minus Non-structural Credit)
Proposed BMPs from PA Stormwater Best Management Practices Manual Chapter 6
Area (ft
2)
Volume Reduction Permanently
Removed (ft
3)
6.4.1 Porous Pavement
6.4.2 Infiltration Basin 34389 86187
6.4.3 Infiltration Bed
6.4.4 Infiltration Trench
6.4.5 Rain Garden/Bioretention
6.4.6 Dry Well / Seepage Pit
6.4.7 Constructed Filter
6.4.8 Vegetated Swale
6.4.9 Vegetated Filter Strip
6.4.10 Berm
6.5.1 Vegetated Roof
6.5.2 Capture and Re-use
6.6.1 Constructed Wetlands
6.6.2 Wet Pond / Retention Basin
6.7.1 Riparian Buffer/Riparian Forest Buffer Restoration
6.7.2 Landscape Restoration / Reforestation 5053 ----
6.7.3 Soil Amendment 34369 ----
6.8.1 Level Spreader
6.8.2 Special Storage Areas
Other Filter Area 12720 ----
Total Structural Volume (ft3): 86187
Structural Volume Requirement (ft3): 85263
DIFFERENCE -924
131

3150-PM-BWEW0035 Rev. 10/2015 Checklist
- 19 -
Worksheet 5. Structural BMP Volume Credits
PROJECT: Gourmet's Delight Mushroom SUB-BASIN: DA #2
Required Control Volume (ft3) – from Worksheet 4: 11135
Non-structural Volume Credit (ft3) – from Worksheet 3: - 0
(maximum is 25% of required volume)
Structural Volume Reqmt (ft3) 11135
(Required Control Volume minus Non-structural Credit)
Proposed BMPs from PA Stormwater Best Management Practices Manual Chapter 6
Area (ft
2)
Volume Reduction Permanently
Removed (ft
3)
6.4.1 Porous Pavement
6.4.2 Infiltration Basin
6.4.3 Infiltration Bed
6.4.4 Infiltration Trench
6.4.5 Rain Garden/Bioretention
6.4.6 Dry Well / Seepage Pit
6.4.7 Constructed Filter
6.4.8 Vegetated Swale
6.4.9 Vegetated Filter Strip
6.4.10 Berm
6.5.1 Vegetated Roof
6.5.2 Capture and Re-use 9852 17020
6.6.1 Constructed Wetlands
6.6.2 Wet Pond / Retention Basin
6.7.1 Riparian Buffer/Riparian Forest Buffer Restoration
6.7.2 Landscape Restoration / Reforestation
6.7.3 Soil Amendment
6.8.1 Level Spreader
6.8.2 Special Storage Areas
Other
Total Structural Volume (ft3): 17020
Structural Volume Requirement (ft3): 11135
DIFFERENCE -5885
132

Worksheet 5. Structural BMP Volume Credits
PROJECT: Gourmet's Delight Mushroom SUB-BASIN: DA #3
Required Control Volume (ft3) – from Worksheet 4: -61
Non-structural Volume Credit (ft3) – from Worksheet 3: - 0 (maximum is 25% of required volume)
Structural Volume Reqmt (ft3) -61
(Required Control Volume minus Non-structural Credit)
Proposed BMPs from PA Stormwater Best Management Practices Manual Chapter 6
Area (ft2)
Volume Reduction Permanently
Removed (ft3)
6.4.1 Porous Pavement 6.4.2 Infiltration Basin 6.4.3 Infiltration Bed 6.4.4 Infiltration Trench 6.4.5 Rain Garden/Bioretention 6.4.6 Dry Well / Seepage Pit 6.4.7 Constructed Filter 6.4.8 Vegetated Swale 6.4.9 Vegetated Filter Strip 6.4.10 Berm 6.5.1 Vegetated Roof 6.5.2 Capture and Re-use 6.6.1 Constructed Wetlands 6.6.2 Wet Pond / Retention Basin 6.7.1 Riparian Buffer/Riparian Forest Buffer Restoration 6.7.2 Landscape Restoration / Reforestation 6.7.3 Soil Amendment 6.8.1 Level Spreader 6.8.2 Special Storage Areas
Other
Total Structural Volume (ft3): 0 Structural Volume Requirement (ft3): -61
DIFFERENCE -61
133

Worksheet 10 – Water Quality Compliance for Nitrate
Does the site design incorporate the following BMPs to address nitrate pollution? A summary “yes” rating is achieved if at least 2 Primary BMPs for nitrate are provided across the site or 4 secondary BMPs for nitrate are provided across the site (or the equivalent) “provided across the site” is taken to mean the specifications for that BMP set forward in Sections 5 and 6 are satisfied.
Proposed BMPs from PA Stormwater Best Management Practices Manual Chapter 5 & 6
Yes No
Primary BMPs for Nitrate:
NS BMP 5.4.2 – Protect/Conserve/Enhance Riparian Buffers
NS BMP 5.5.4 – Cluster Uses at Each Site
NS BMP 5.6.1 – Minimize Total Disturbed Area
NS BMP 5.6.3 – Re-Vegetate/Re-Forest Disturbed Areas (Native Species)
NS BMP 5.9.1 – Street Sweeping/Vacuuming
Structural BMP 6.7.1 – Riparian Buffer Restoration
Structural BMP 6.7.2 – Landscape Restoration
Secondary BMPs for Nitrate:
NS BMP 5.4.1 – Protect Sensitive/Special Value Features
NS BMP 5.4.3 – Protect/Utilize Natural Drainage Features
NS BMP 5.6.2 – Minimize Soil Compaction
Structural BMP 6.4.5 – Rain Garden/Bioretention
Structural BMP 6.4.8 – Vegetated Swale
Structural BMP 6.4.9 – Vegetated Filter Strip
Structural BMP 6.6.1 – Constructed Wetland
Structural BMP 6.7.1 – Riparian Buffer Restoration
Structural BMP 6.7.2 – Landscape Restoration
Structural BMP 6.7.3 – Soils Amendment/Restoration
134

SOILS TABLE
135

This page intentionally left blank.
136

Ro
ad
Su
bg
rad
eR
oa
d F
ill
Re
se
vo
ir A
rea
Em
ba
nk
me
nt
GgB
Ge
B2
Gle
ne
lg C
ha
nn
ery
Silt
Lo
am
3-8
%5
+5
+B
0.6
3-2
.0G
oo
dF
air
Fa
ir t
o
Go
od
Fa
ir t
o
Go
od
----
--
Pe
rme
ab
le
Su
b-S
tra
tum
Pe
rme
ab
ility
----
--M
ulc
h o
r m
at
are
as o
f d
istu
rba
nce
GgC
Ge
C3
Gle
ne
lg C
ha
nn
ery
Silt
Lo
am
8-1
5%
5+
5+
B0
.63
-2.0
Fa
irF
air
Fa
ir
Fa
ir t
o
Go
od
Sh
allo
w
So
il
Pe
rme
ab
le
Su
b-S
tra
tum
Pe
rme
ab
ility
----
----
--M
ulc
h o
r m
at
are
as o
f d
istu
rba
nce
GgD
Ge
D2
Gle
ne
lg C
ha
nn
ery
Silt
Lo
am
3-8
%5
+5
+B
0.6
3-2
.0F
air
Fa
irF
air
Fa
ir t
o
Go
od
Sh
allo
w
So
il
Pe
rme
ab
le
Su
b-S
tra
tum
Pe
rme
ab
ility
----
----
--M
ulc
h o
r m
at
are
as o
f d
istu
rba
nce
Soil Mapping Unit
Depth to Bedrock
Hydrologic Soil Group
Depth to Seasonal High
Water Table
Suitability of
material for
Original Soil Mapping
Unit
Resolutions
Ch
ara
cte
ris
tic
s t
ha
t a
ffe
ct
Permeability
Slope
Building sites
Soil Series Description
Infiltration of waste
from septic tanks
PH
YS
ICA
L P
RO
PE
RT
IES
SU
ITA
BIL
ITY
CH
AR
AC
TE
RIS
TIC
S F
OR
EN
GIN
EE
RIN
G C
ON
ST
RU
CT
ION
Suitability to winter
grading
Resistance to frost
action
So
ils
Da
ta T
ab
le
Suitability for
ponds and
basins
137

This page intentionally left blank.
138

WORKSHEET #22 PLAN WRITER CREDENTIALS
139

This page intentionally left blank.
140

� � � � � � � � � � � � � � � � � � � � � � � � � � � � �141
Ronald Ragan, P.E.
Purdue University
Civil Engineering
1971 1976
1976
Fall 2012 Designers Workshop Stormwater BMP Workshop
BCCD BCCD
11 October 2012 12 April 2012
Ragan Engineering
(610) 255-3400
Roy F. Weston, Inc.
(610) 701-3000
Chatham Acres
Chester
London Grove Twp.
PAI01151128
CCCD/PADEP
Lighthouse Youth Center
Chester
Oxford Borough
PAI01151235
CCCD/PADEP
Hearne Hardwood
Chester
Lower Oxford Twp.
PAI01151238
CCCD/PADEP