Good Bye Processed Carbs, Hello Steady Exercise. Problem Definition Too many meals and snacks...
23
Good Bye Processed Carbs, Hello Steady Exercise
-
Upload
barbara-peart -
Category
Documents
-
view
221 -
download
1
Transcript of Good Bye Processed Carbs, Hello Steady Exercise. Problem Definition Too many meals and snacks...

Good Bye Processed Carbs,
Hello Steady Exercise
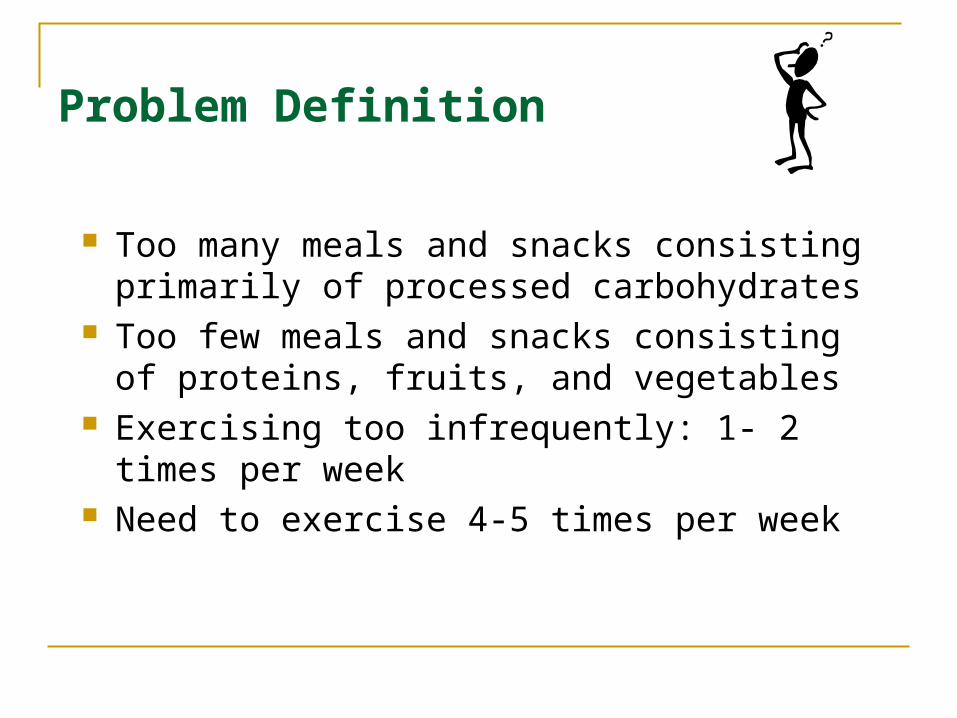
Problem Definition
Too many meals and snacks consisting primarily of processed carbohydrates
Too few meals and snacks consisting of proteins, fruits, and vegetables
Exercising too infrequently: 1- 2 times per week
Need to exercise 4-5 times per week

Problem Definition continued…...
Eating carbohydrate laden meals leads to weight gain especially when regular cardiovascular exercise is not incorporated into my routines.
Eating large carbohydrate meals leads to fatigue after eating.

What's So Junky About 'Junk' Food?
Many snacks, such as potato chips, fast-food cheeseburgers, and fries, have high levels of fat, sugar or salt.
Most of these are made using saturated fat, which comes from animal products, hydrogenated vegetable oils and tropical oils -- coconut and palm -- providing smaller amounts. Only animal fat provides cholesterol.

Why eating Large quantities of processed carbohydrates is unhealthy
Processed carbohydrates (sugars, most breads and pastas, snack foods, etc.) when consumed quickly elevate insulin levels and lead to the conversion of carbohydrates into fat.
Increasing incidence of diabetes may be related to the increased consumption of processed carbohydrates.

Problem Flow ChartWake up
Study
Hungry?
Eat Study
Eat What?
Healthy foodavailable
Only Carbohydratesavailable
Donesudying?
Exercise
Run Errands
Study
Go toGym?
Study
Play withchildren
yes No
No Yes
No

Problem Flow Chart continued…
Eat dinner
Go to school
Healthy foodavailable
Only Carbohydratesavailable
Late evening Snack?
Healthy foodavailable
Only Carbohydratesavailable

Problem Identification
“Healthy food” not easily available because it is not in the house or “good” foods are noteasily available
Cravings for junk food Studying, errands or children
sometimes a barrier to exercising Sometimes feel lazy and just won’t
exercise

Changes to the Environment / System to create change
When shopping, purchase large quantities of “healthy foods.”
Prepare large quantities of “healthy food” so it will always be available
Minimize the amount of junk food in house to a level where others in household will just be satisfied
Involve exercise in the faimily’s activities
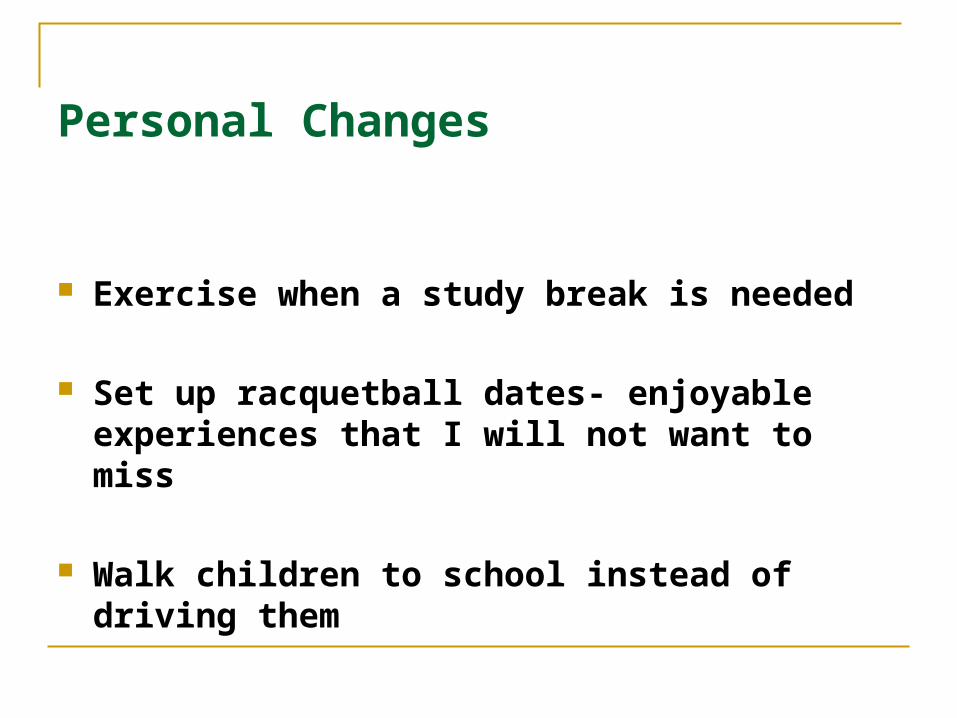
Personal Changes
Exercise when a study break is needed
Set up racquetball dates- enjoyable experiences that I will not want to miss
Walk children to school instead of driving them
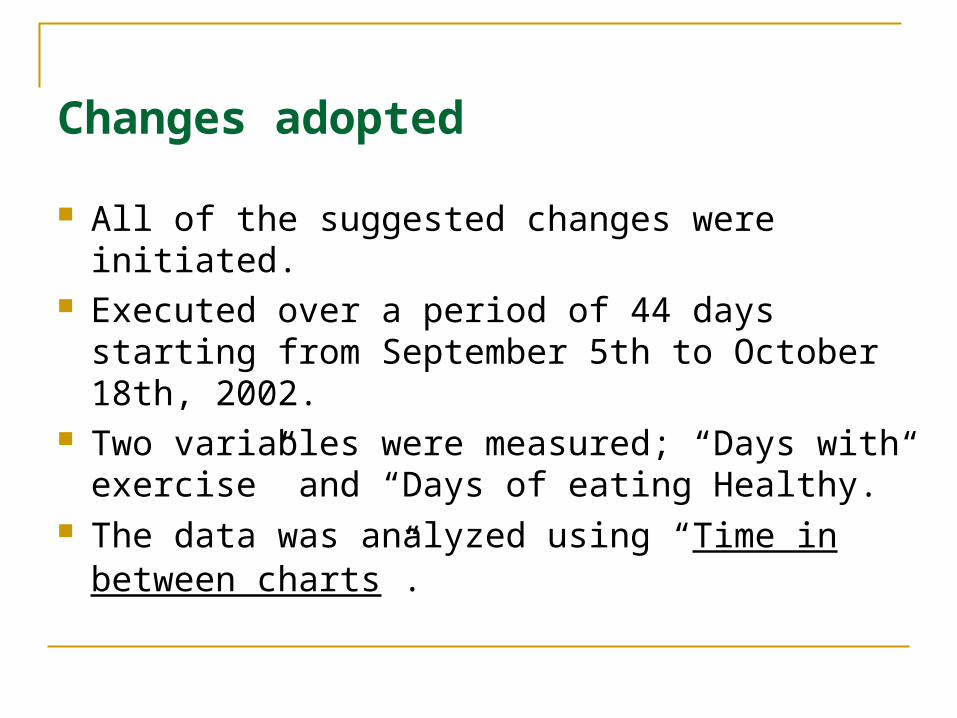
Changes adopted
All of the suggested changes were initiated. Executed over a period of 44 days starting from
September 5th to October 18th, 2002. Two variables were measured; “Days with
exercise” and “Days of eating Healthy.” The data was analyzed using “Time in between
charts”.

The DataDayDay EatEat
Well?Well?Days inDays inBetween successesBetween successes
UCLUCL DayDay EatEat Well?Well?
Days in Days in Between successesBetween successes
UCLUCL
11 YesYes 1.391.39 2323 NoNo 11 1.391.39
22 NoNo 11 1.391.39 2424 YesYes 00 1.391.39
33 NoNo 22 1.391.39 2525 YesYes 00 1.391.39
44 NoNo 33 1.391.39 2626 NoNo 11 1.391.39
55 YesYes 00 1.391.39 2727 YesYes 00 1.391.39
66 YesYes 00 1.391.39 2828 YesYes 00 1.391.39
77 YesYes 00 1.391.39 2929 YesYes 00 1.391.39
88 YesYes 00 1.391.39 3030 YesYes 00 1.391.39
99 YesYes 00 1.391.39 3131 NoNo 11 1.391.39
1010 YesYes 00 1.391.39 3232 YesYes 00 1.391.39
1111 YesYes 00 1.391.39 3333 YesYes 00 1.391.39
1212 YesYes 00 1.391.39 3434 YesYes 00 1.391.39
1313 NoNo 11 1.391.39 3535 YesYes 00 1.391.39
1414 YesYes 00 1.391.39 3636 YesYes 00 1.391.39
1515 YesYes 00 1.391.39 3737 YesYes 00 1.391.39
1616 YesYes 00 1.391.39 3838 YesYes 00 1.391.39
1717 YesYes 00 1.391.39 3939 NoNo 11 1.391.39
1818 YesYes 00 1.391.39 4040 YesYes 00 1.391.39
1919 NoNo 11 1.391.39 4141 YesYes 00 1.391.39
2020 YesYes 00 1.391.39 4242 YesYes 00 1.391.39
2121 YesYes 00 1.391.39 4343 YesYes 00 1.391.39
2222 YesYes 00 1.391.39 4444 YesYes 00 1.391.39
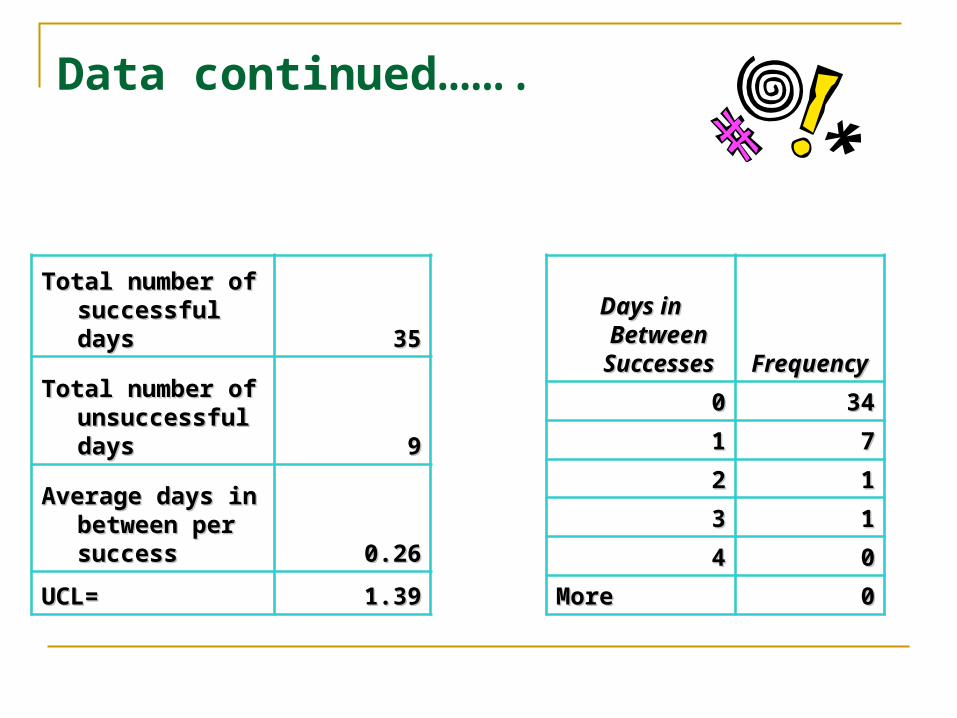
Data continued…….
Total number of Total number of successful dayssuccessful days 3535
Total number of Total number of unsuccessful unsuccessful daysdays 99
Average days in Average days in between per between per successsuccess 0.260.26
UCL=UCL= 1.391.39
Days in Days in Between Between
SuccessesSuccesses FrequencyFrequency
00 3434
11 77
22 11
33 11
44 00
MoreMore 00

Frequency Chart
Frequency ChartEating Well
0
10
20
30
40
0 1 2 3 4 More
Days in between successes
Fre
qu
en
cy
Frequency
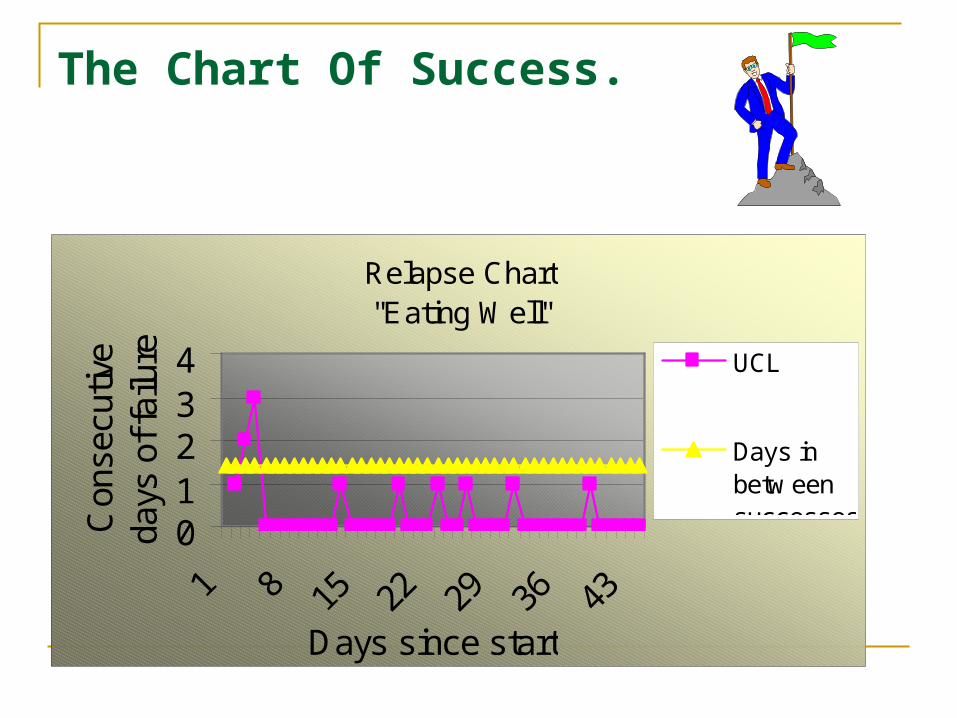
The Chart Of Success.
Relapse Chart"Eating Well"
01234
Days since start
Con
secu
tive
days
of f
ailu
re UCL
Days inbetw eensuccesses

The DataDayDay Exercise?Exercise?
Days in between Days in between successessuccesses UCLUCL DayDay Exercise?Exercise?
Days in between Days in between successessuccesses UCLUCL
11 NoNo 0.000.00 2323 NoNo 11 2.472.47
22 YesYes 00 2.472.47 2424 YesYes 00 2.472.47
33 NoNo 11 2.472.47 2525 NoNo 11 2.472.47
44 NoNo 22 2.472.47 2626 NoNo 22 2.472.47
55 YesYes 00 2.472.47 2727 YesYes 00 2.472.47
66 YesYes 00 2.472.47 2828 NoNo 11 2.472.47
77 YesYes 00 2.472.47 2929 YesYes 00 2.472.47
88 YesYes 00 2.472.47 3030 YesYes 00 2.472.47
99 YesYes 00 2.472.47 3131 YesYes 00 2.472.47
1010 YesYes 00 2.472.47 3232 NoNo 11 2.472.47
1111 NoNo 11 2.472.47 3333 YesYes 00 2.472.47
1212 YesYes 00 2.472.47 3434 YesYes 00 2.472.47
1313 YesYes 00 2.472.47 3535 YesYes 00 2.472.47
1414 YesYes 00 2.472.47 3636 NoNo 11 2.472.47
1515 NoNo 11 2.472.47 3737 YesYes 00 2.472.47
1616 YesYes 00 2.472.47 3838 NoNo 11 2.472.47
1717 NoNo 11 2.472.47 3939 NoNo 22 2.472.47
1818 YesYes 00 2.472.47 4040 YesYes 00 2.472.47
1919 YesYes 00 2.472.47 4141 YesYes 00 2.472.47
2020 YesYes 00 2.472.47 4242 NoNo 11 2.472.47
2121 YesYes 00 2.472.47 4343 YesYes 00 2.472.47
2222 NoNo 11 2.472.47 4444 YesYes 00 2.472.47

Data continued…….
Days in Between Days in Between SuccessesSuccesses FrequencyFrequency
00 2828
11 1111
22 44
33 00
44 00
MoreMore 00
Total number of Total number of successful successful daysdays 2828
Total number of Total number of unsuccessful unsuccessful daysdays 1616
Average days in Average days in between per between per successsuccess 0.570.57
UCL=UCL= 2.472.47

Frequency Chart
FrequencyChartExercising
0
10
20
30
0 1 2 3 4 More
Days in between successes
Freq
uenc
y
Frequency

The Chart Of Success.
Relapse Chart"Exercising"
0
1
2
3
1 5 9 13 17 21 25 29 33 37 41
Days since start
Co
nse
cutiv
e
da
ys o
f fa
ilure
Consecutive daysof failureUCL

Results
My Weight quickly dropped from 193 pounds to my 183 pounds where I hit a plateau. This may be due to my workouts getting shorter in duration than when I started taking measurements. Although I stopped daily monitoring of exercise and eating habits, my weight dropped to 178 by November 25.
My Weight
182
184
186
188
190
192
194
1-Sep 21-Sep 11-Oct 31-Oct
Date
Poun
ds Pounds

Analysis The one failure above the UCL on the “Eating
Well” control chart is statistically significant suggesting a return to poor habits.
The rest of the failures below the “Upper Control Limit” are statistically insignificant and only suggest relapses.

Analysis
Though initially there was not much of a success or break in the habit, in course of time the habit changed.
This project of personal improvement is a success both physically and statistically.
Future Course Of Action Maintain current eating program When target weight is obtained, begin to add
more carbohydrates to diet to maintain weight Maintain exercise routines, especially when
other parts of life change Find new ways to exercise with children- bike
riding, swimming, ping-pong.