GOME-2 observations of air quality in Chinese megacities€¦ · 1 GOME-2 observations of air...
21
1 GOME-2 observations of air quality in Chinese megacities PRESCRIBE EU ACCENT PLUS and ICACGP Workshop 15-16 May 2013, University of Bremen, Germany P. Valks, N. Hao, P. Hedelt, W. Zimmer, D. Loyola, e.a. German Aerospace Center (DLR), Remote Sensing Technology Institute
-
Upload
nguyenhanh -
Category
Documents
-
view
215 -
download
2
Transcript of GOME-2 observations of air quality in Chinese megacities€¦ · 1 GOME-2 observations of air...

1
GOME-2 observations of air quality in Chinese megacities
PRESCRIBE
EU ACCENT PLUS and ICACGP Workshop
15-16 May 2013, University of Bremen, Germany
P. Valks, N. Hao, P. Hedelt, W. Zimmer, D. Loyola, e.a.
German Aerospace Center (DLR), Remote Sensing Technology Institute

2
Outline
GOME-2 trace gas column products provided by O3M-SAF
Ten years trend in key air pollutants in China’s megacities
GOME-2 SO2, NO2 and HCHO
Air pollution events in East China in January 2013
ESA-MOST Dragon 3 project
Impact of East Asian Monsoon on air quality over China
Outlook for Sentinel-4 and -5

3
Ozone and Atmospheric Chemistry Monitoring SAF
Part of distributed EUMETSAT ground-segment
Operational NRT and Off-line products based on GOME-2 and IASI data
Consortium of ~10 National Meteorological Services and research institutes
Products and services
Ozone and minor trace gas columns
Ozone profiles
Aerosol properties (AAI, AOD, SSA)
UV products (clear-sky and with clouds/albedo)
Validation service for each product
IASI products (O3, SO2, CO, HNO3)
o3msaf.fmi.fi

4
GOME-2 trace gas column products
GOME-2 trace gas column
products
Near-Real-Time: O3, NO2, SO2
Off-line: O3, NO2, BrO, SO2, H2CO, H2O
In development: Trop. O3, OClO, Glyoxal,
Trop. BrO
ECMWF
National
Weather
Services
AUTH
BIRA
FMI
DMI
Raw => L1b processing
EPS G/S
UMARF
EPS Station
Spitzbergen
DLR
DIMS
UPAS
L1b => L2 processing
L1b NRT UV processing
L2 validation
L2 nrt L2 QL
L1&L2 archiving
Users
L2 search,
order
order
L2 ordering & delivery
L2
offline
Hot Bird Metop
GOME-2
L0 Data
L2 NRT
2:00 h.
5
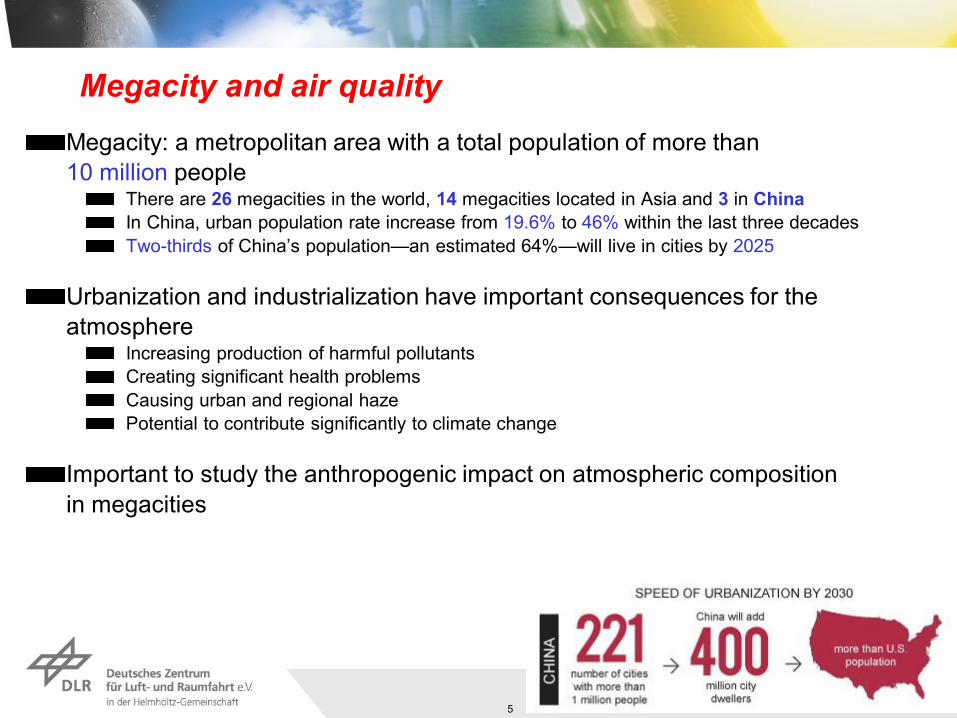
Megacity and air quality
Megacity: a metropolitan area with a total population of more than
10 million people There are 26 megacities in the world, 14 megacities located in Asia and 3 in China
In China, urban population rate increase from 19.6% to 46% within the last three decades
Two-thirds of China’s population—an estimated 64%—will live in cities by 2025
Urbanization and industrialization have important consequences for the
atmosphere Increasing production of harmful pollutants
Creating significant health problems
Causing urban and regional haze
Potential to contribute significantly to climate change
Important to study the anthropogenic impact on atmospheric composition
in megacities

Megacities are playing a leading role for regional air pollution problem
China’s Top 3 City Clusters
Territory 354969 (km2) 3.7(%)
Population 189.24 (million) 14.1 (%)
GDP 7825.9 (billion) 40.1 (%)
* Based on data in 2006
Beijing-Taijing-Bohai Bay
Yangtze River Delta
Pearl River Delta
Shanghai ( 23 million)
Guangzhou ( 12 million)
The numbers of cars (2010) compared to 2000
Beijing: 4.76 million ~200%
Shanghai: 2.85 million ~100%
Guangzhou: 2.12 million ~170%
Beijing Guangzhou Shanghai
More than half year were haze days in Shanghai

Ten years trend of SO2 concentrations
Beijing
Shanghai
Guangzhou
After 2007, SO2 showed a relative
clear decrease in Beijing, Shanghai
and Guangzhou.
SO2 data from EPA
From 2000 to 2005, SO2 showed a
clear increase in Shanghai and
Guangzhou, due to increase in
energy consumption (mainly from
coal burning).
PJ 2000 2005 Increase
Industry coal use 10,178 17,053 68%
Electricity coal use 12,203 24,028 97%
On road transport 1,946 3,424 76%
Off road transport 1,387 2,696 94%
Ref: National Bureau of Statistics of China. China Statistical Yearbook

2007 2008 2009
Satellite observation of SO2 over China
1
3
2 4
5
Beijing
Shanghai
Guangzhou
GOME-2

Comparison with in-situ SO2 measurement in Shanghai
Month
GO
ME
-2 S
O2 [
DU
]
SO
2 c
on
cen
tra
tio
n [
μm
/m3]
SO2 concentration [μg/m3]
GO
ME
-2
SO
2 [
DU
]
R=0.86
In-situ SO2 data from Shanghai EPB

Ten years trend of NO2 concentrations
Beijing
Shanghai
Guangzhou Olympic Games
Shanghai Expo 2010
WHO guideline
NO2 showed no evident annual trend in
Shanghai.
From 2004, NO2 showed a decreasing
trend in Guangzhou.
In 2008, NO2 showed a clear decrease in
Beijing, but increase again after 2008.

GOME-2 Tropospheric NO2 over China (2007-2012)
A significant increase of NO2 over China from 1994 to 2006 observed by
GOME and SCIAMACHY
Richter A, et al., Nature 2005;
Van der A et al., J. Geophys. Res., 2006
Date
GO
ME
-2 T
rop
.NO
2 (
10
15 m
ole
c/cm
2)
A 12-month moving average
economic recession
GO
ME
-2 T
rop
.NO
2 (
10
15 m
ole
c/cm
2)
East China (Lat: 21.5-41 N, Lon: 112-122E)
Hao et al, Environ. Res. Lett. 6, 2011

Monthly means MAX-DOAS and GOME-2 tropospheric NO2
over Shanghai and Wujiang
R=0.7
◊ GOME-2
□ MAXDOAS (30°)
GOME-2: mean values of
all the pixels within 50 km
around Wujiang and
Fudan University
R=0.75
Wujiang
Shanghai

GOME-2 Tropospheric HCHO over China (2007-2012)
GOME and SCIAMACHY HCHO for 1997-2009
Growth rate: 4 ± 1.4% per year
De Smedt et al., 2010
HCHO/NO2 column ratio:
Indicator of surface ozone-NOx-VOC
sensitivity
Beijing, Shanghai and Guangzhou:
VOC-limited

16
Air Pollution Events in East China in mid-January 2013
• 2013
• 2012
• 2011
Beijing Air Quality Index (AQI) One of the worst period of
air quality in Beijing and
other cities in China
Peak of AQI is 775 on
Jan. 12 – off the US.
Environmental Protection
Agency scale

17
MODIS Jan. 14, 2013
Beijing Olympic Stadium
Jan. 14, 2013
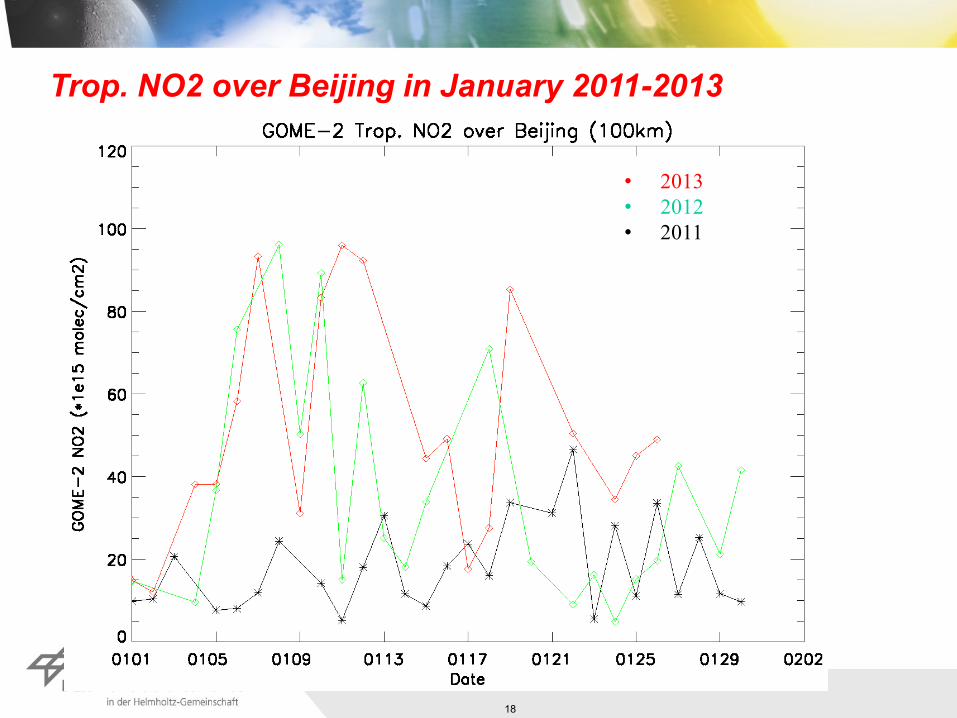
18
• 2013
• 2012
• 2011
Trop. NO2 over Beijing in January 2011-2013

Assessment of the impact of the East Asian Summer Monsoon
on the air quality over China
Dr 3 project Id. Number 10455
N. Hao1, A.J. Ding2, C. Clerbaux3, S. Safieddine3,
T. Wang4, T. Trautmann1, P. Valks1, K. Ding2

Monsoon climate controls air pollution transport in East Asia,
especially for “long-life” species like O3
2013/5/16 SORPES - Station for Observing Regional Processes of the Earth System 20
Provide a holistic view of the monsoon impact on tropospheric ozone and
related trace gases over China
Background and Objectives
Climatology of NO2 column (1996-2007)

Summary of Expected Results
• A comprehensive databank of ozone and related trace gases from various
platforms
• Improved understandings of the driving mechanisms of the
seasonal patterns and inter-annual variations of air pollution in
different regions of China.
• A general assessment on the uncertainties of satellite products and
improved retrieval algorithms of some species in the high-polluted
East Asian regions

24
DLR has a strong interest in S4-UVN and S5-UVNS product development and processing
Strong involvement in GOME/ERS-2, SCIAMACHY, GOME-2/MetOp and S5P
Processor development
Level-1 and Level-2 processors
Prototype and operational
Operational processing
Part of (distributed) ground-segment (ESA and EUMETSAT)
Sentinel-4/UVN
Level-1b prototype processor development ongoing
Level-2 prototype processors (ESA-ITT in 2013?)
Operational processors and processing
Central or distributed EUMETSAT ground-segment ???
Sentinel-5/UVNS
Prototype Level-1b and Level-2 processor development ???
Operational processors and processing ???
Outlook for Sentinel-4 and -5

25
Ten years trend in key air pollutants in Chinese megacities
SO2 emissions successfully controlled from 2007 to 2010, increase in Beijing after 2010
NO2 showed a decreasing trend in Guangzhou, but not in Beijing and Shanghai Particulate pollution especially PM2.5 is the major air pollution problem
MAXDOAS measurements in Shanghai from 2010 until now
Preliminary comparison results show good agreement between satellite and ground-based measurements
Satellite observations can be used to monitor air quality in mega-cities
Operational GOME-2 trace-gas products available at:
Conclusions
http://atmos.caf.dlr.de/gome2