Goldman Sachs Symposium - Fuchs Petrolub SE · FUCHS GROUP Setting Standards ... Roadshow...
61
FUCHS GROUP Setting Standards - Worldwide | Roadshow Presentation July 2016, Boston / New York | Stefan Fuchs, CEO | Reiner Schmidt, Member of the Group Management Committee
Transcript of Goldman Sachs Symposium - Fuchs Petrolub SE · FUCHS GROUP Setting Standards ... Roadshow...
FUCHS GROUP
Setting Standards - Worldwide
| Roadshow Presentation July 2016, Boston / New York
| Stefan Fuchs, CEO
| Reiner Schmidt, Member of the Group Management Committee
Agenda
| The Leading Independent Lubricants Company
01
| Unique Track Record 02
| Growth Initiative 03
| Q1 & Outlook 2016 04
| Shares 05
| Appendix 06
l 2

The Leading Independent Lubricants
Company
01
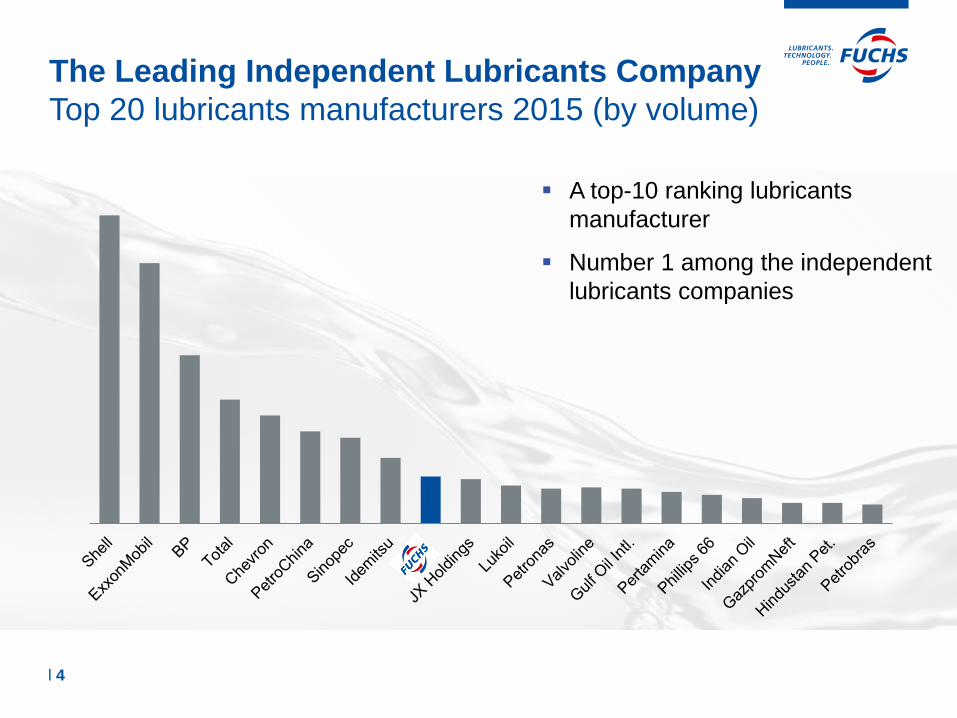
The Leading Independent Lubricants Company
Top 20 lubricants manufacturers 2015 (by volume)
l 4
A top-10 ranking lubricants
manufacturer
Number 1 among the independent
lubricants companies
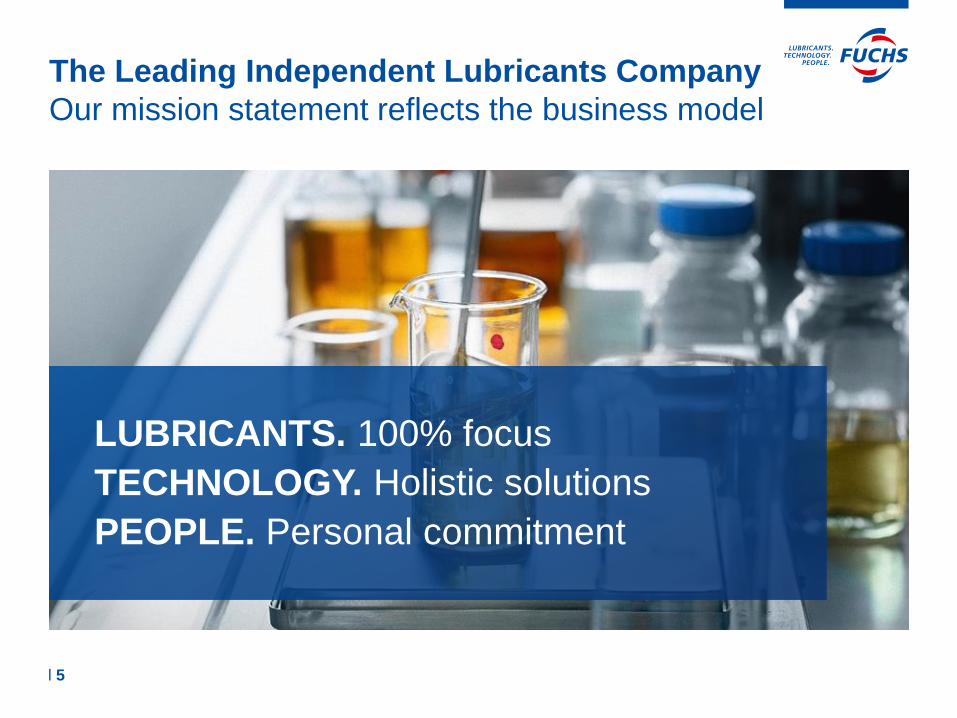
The Leading Independent Lubricants Company
Our mission statement reflects the business model
LUBRICANTS. 100% focus
TECHNOLOGY. Holistic solutions
PEOPLE. Personal commitment
l 5
The Leading Independent Lubricants Company
Our core values are the basis for our activities
Trust
Creating Value
Respect
Reliability
Integrity
l 6
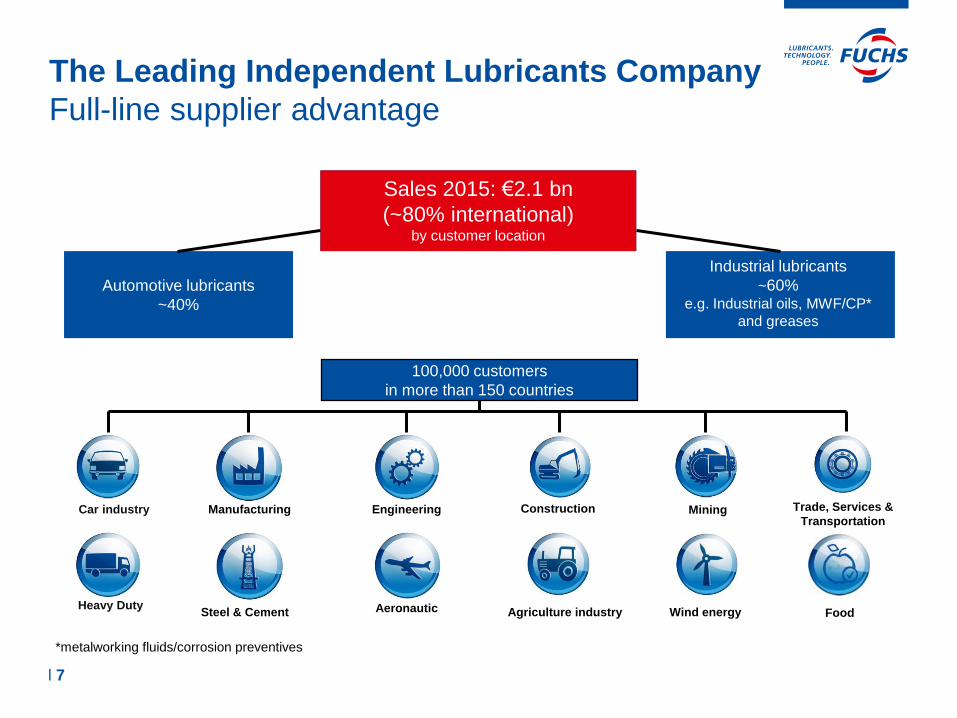
The Leading Independent Lubricants Company
Full-line supplier advantage
l 7
Sales 2015: €2.1 bn
(~80% international) by customer location
Industrial lubricants
~60% e.g. Industrial oils, MWF/CP*
and greases
Automotive lubricants
~40%
*metalworking fluids/corrosion preventives
100,000 customers
in more than 150 countries
Heavy Duty Steel & Cement Aeronautic Agriculture industry Wind energy Food
Mining Construction Engineering Manufacturing Car industry Trade, Services &
Transportation
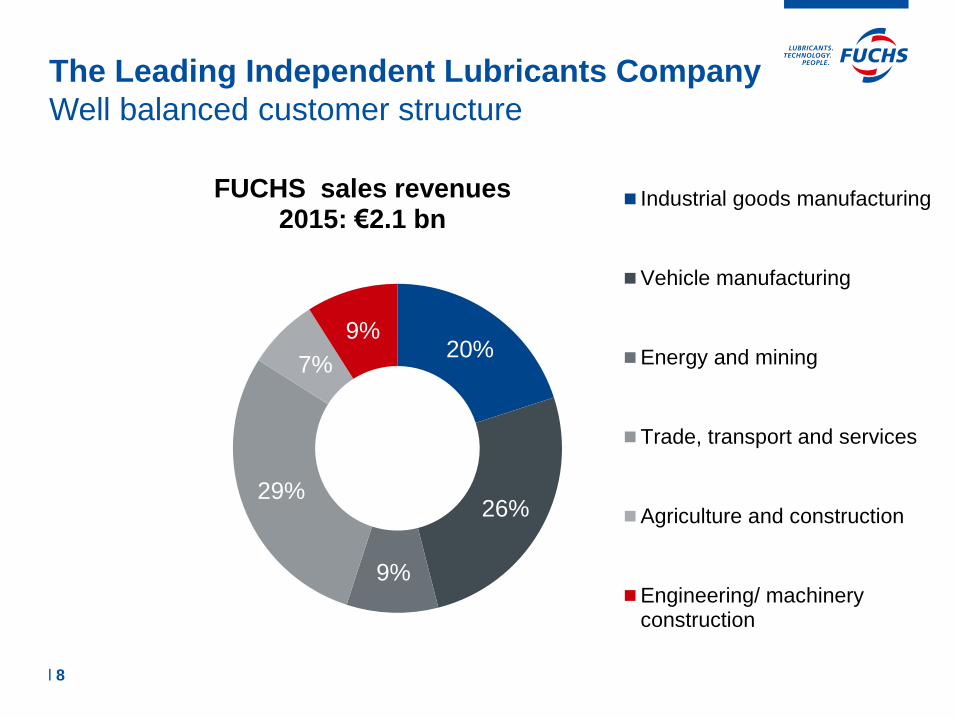
The Leading Independent Lubricants Company
Well balanced customer structure
l 8
20%
26%
9%
29%
7%
9%
FUCHS sales revenues 2015: €2.1 bn
Industrial goods manufacturing
Vehicle manufacturing
Energy and mining
Trade, transport and services
Agriculture and construction
Engineering/ machineryconstruction
Unique Track Record 02
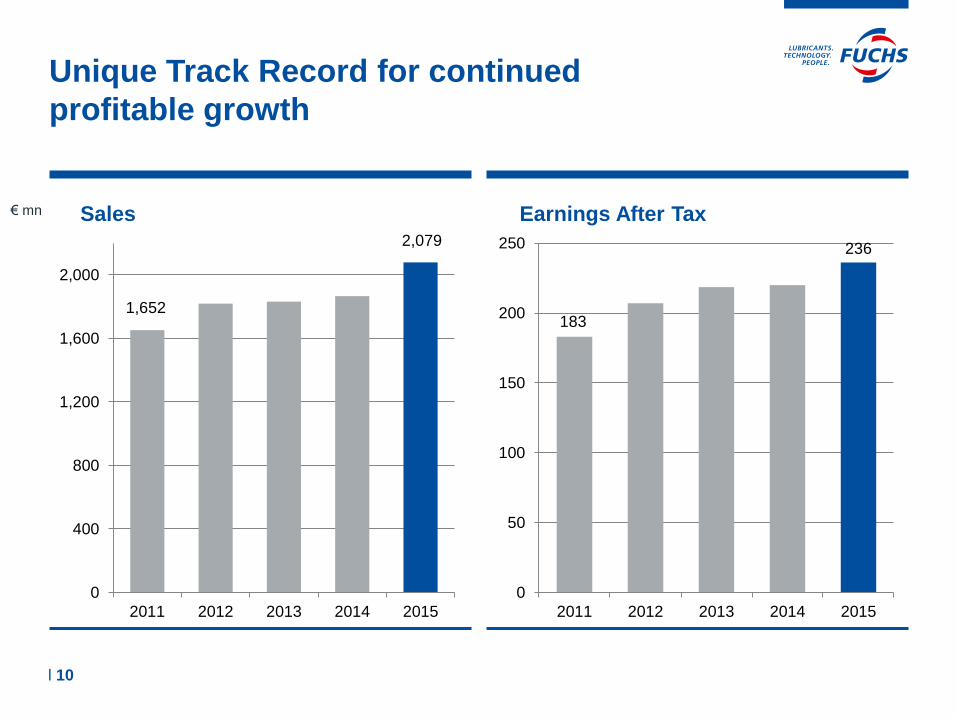
Unique Track Record for continued
profitable growth
l 10
1,652
2,079
0
400
800
1,200
1,600
2,000
2011 2012 2013 2014 2015
Sales
183
236
0
50
100
150
200
250
2011 2012 2013 2014 2015
Earnings After Tax € mn

Unique Track Record for continued
Profitability and Added Value
l 11
264
342
0
50
100
150
200
250
300
350
2011 2012 2013 2014 2015
EBIT
186
246
0
50
100
150
200
250
2011 2012 2013 2014 2015
FVA (FUCHS Value Added) € mn
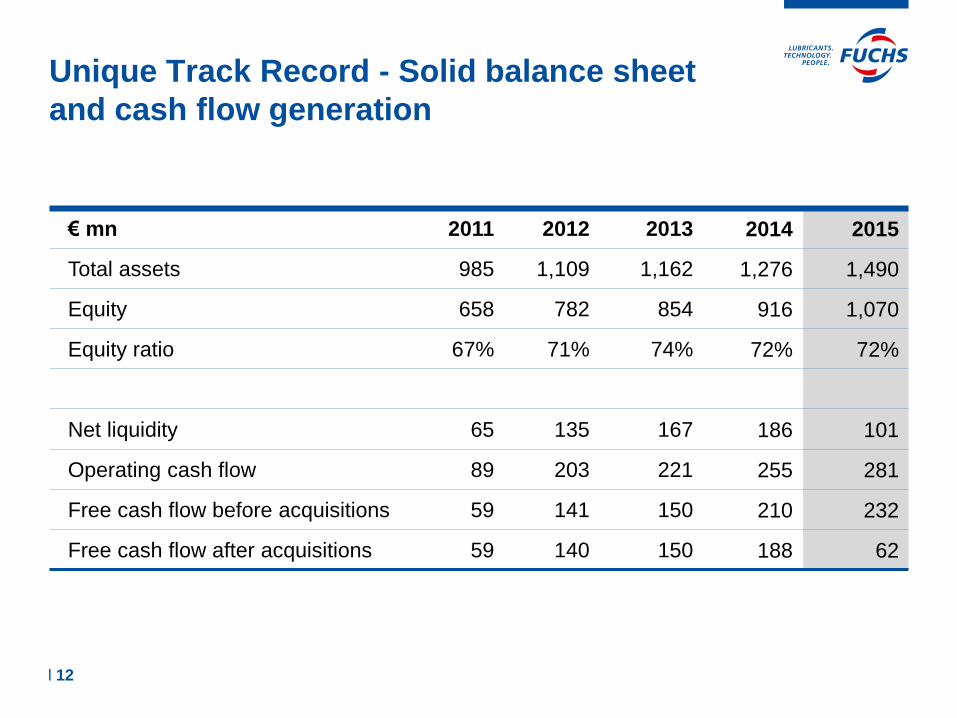
Unique Track Record - Solid balance sheet
and cash flow generation
€ mn 2011 2012 2013 2014 2015
Total assets 985 1,109 1,162 1,276 1,490
Equity 658 782 854 916 1,070
Equity ratio 67% 71% 74% 72% 72%
Net liquidity 65 135 167 186 101
Operating cash flow 89 203 221 255 281
Free cash flow before acquisitions 59 141 150 210 232
Free cash flow after acquisitions 59 140 150 188 62
l 12
Growth Initiative 03
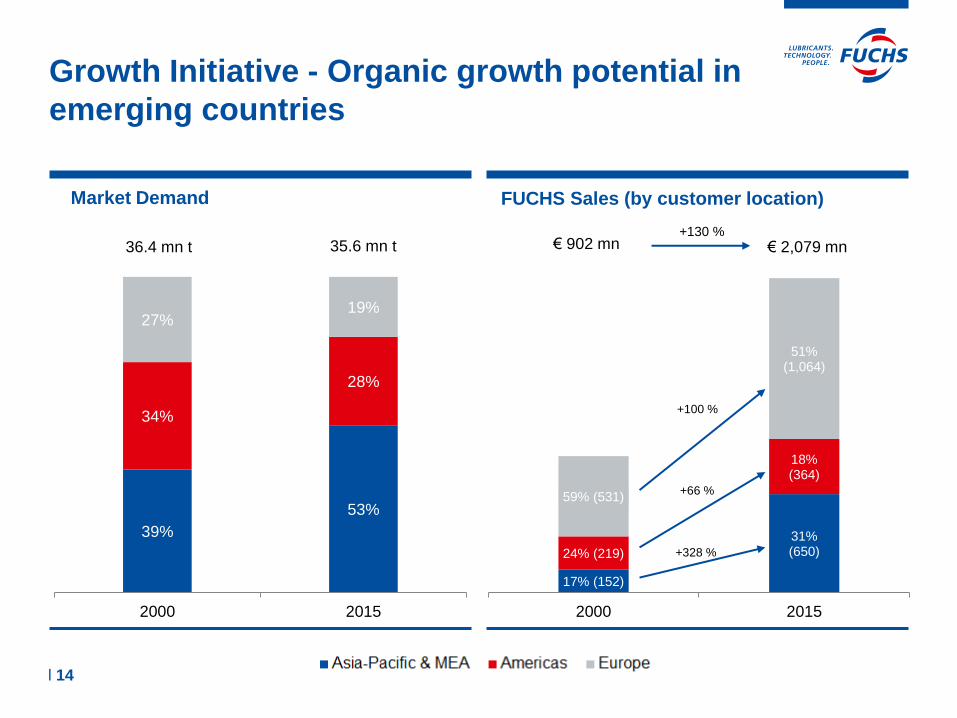
Growth Initiative - Organic growth potential in
emerging countries
39%
53%
34%
28%
27% 19%
2000 2015
Market Demand
35.6 mn t 36.4 mn t
l 14
17% (152)
31% (650) 24% (219)
18% (364)
59% (531)
51% (1,064)
2000 2015
FUCHS Sales (by customer location)
€ 2,079 mn € 902 mn
+100 %
+66 %
+328 %
+130 %
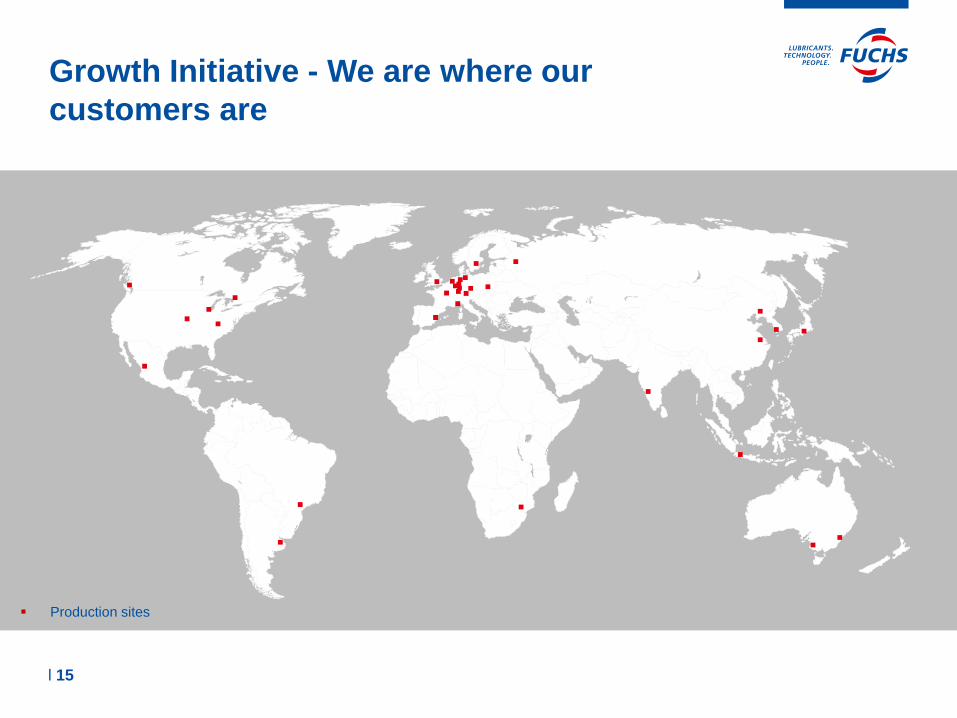
Growth Initiative - We are where our
customers are
l 15
Production sites
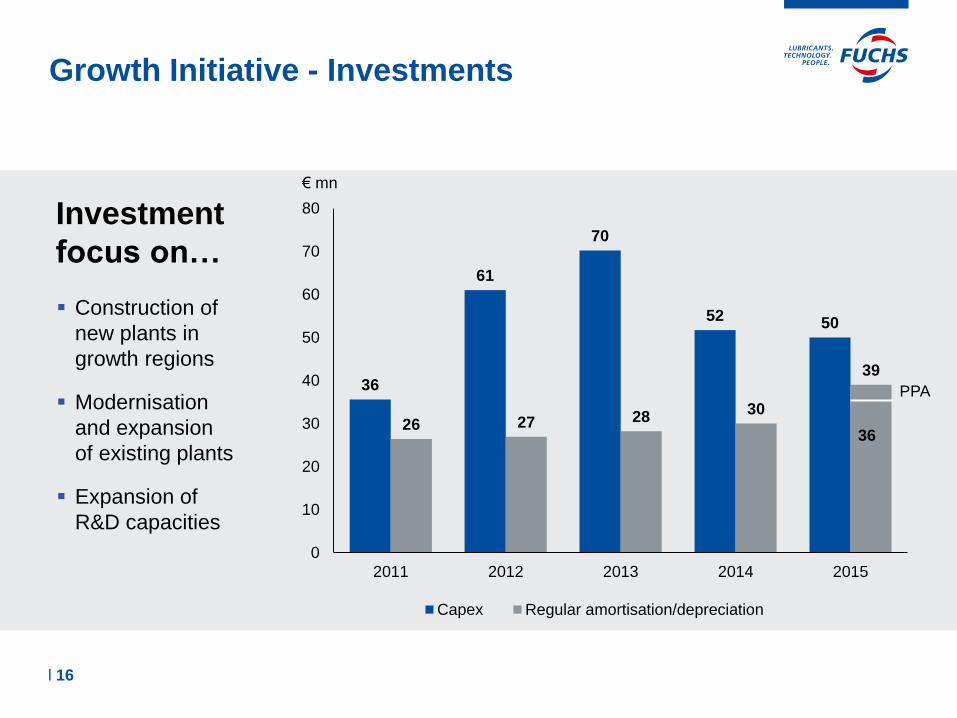
Investment
focus on…
Construction of
new plants in
growth regions
Modernisation
and expansion
of existing plants
Expansion of
R&D capacities
Growth Initiative - Investments
36
61
70
52 50
26 27 28 30
39
0
10
20
30
40
50
60
70
80
2011 2012 2013 2014 2015
Capex Regular amortisation/depreciation
€ mn
PPA
36
l 16
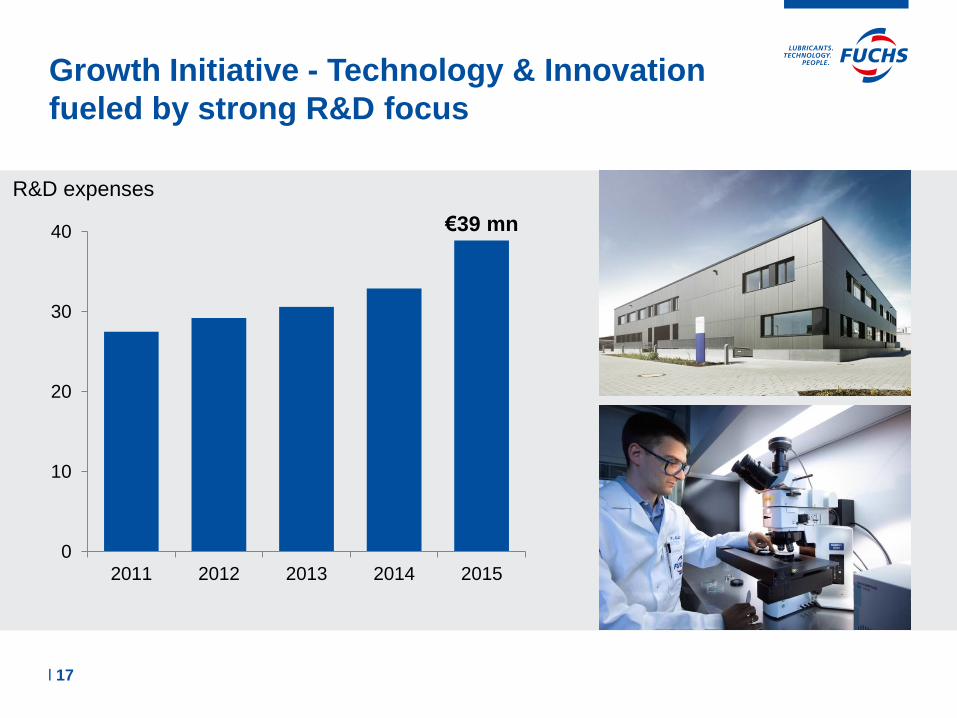
€39 mn
0
10
20
30
40
2011 2012 2013 2014 2015
Growth Initiative - Technology & Innovation
fueled by strong R&D focus
R&D expenses
l 17
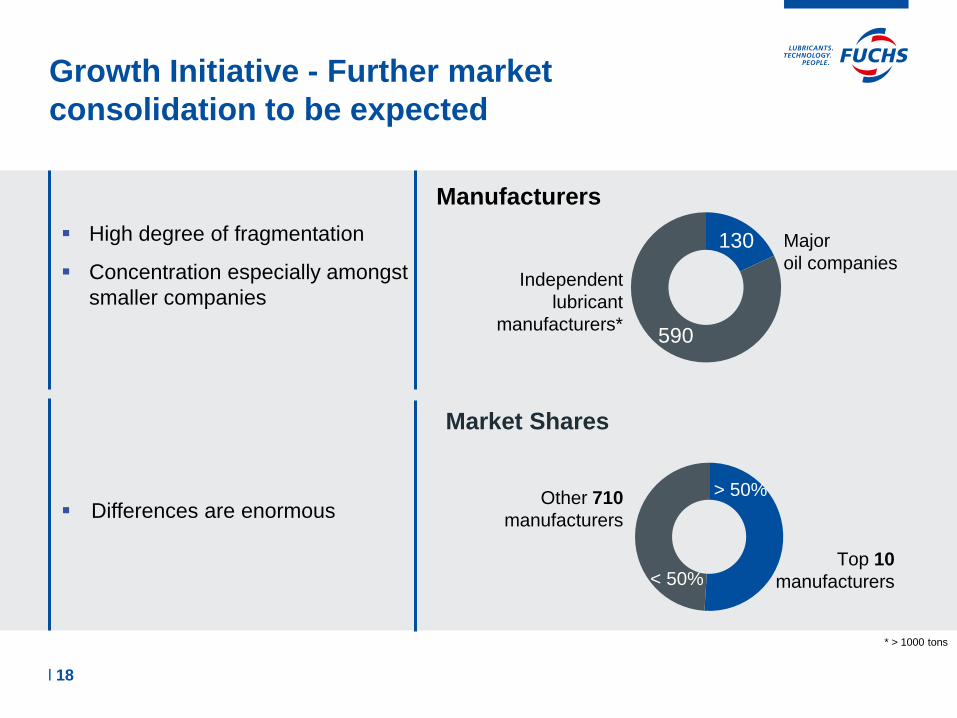
Growth Initiative - Further market
consolidation to be expected
High degree of fragmentation
Concentration especially amongst
smaller companies
Differences are enormous > 50%
< 50%
Market Shares
Other 710
manufacturers
130
590
Manufacturers
Major
oil companies Independent
lubricant
manufacturers*
Top 10
manufacturers
* > 1000 tons
l 18
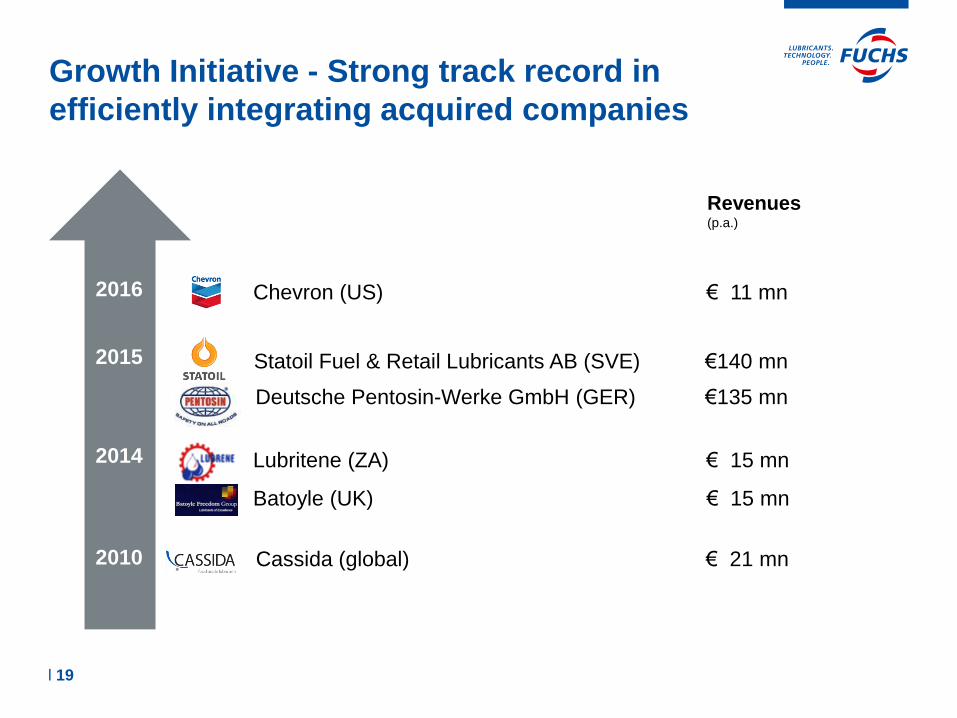
Statoil Fuel & Retail Lubricants AB (SVE) €140 mn
Deutsche Pentosin-Werke GmbH (GER) €135 mn
Growth Initiative - Strong track record in
efficiently integrating acquired companies
2015
2014
2010
Lubritene (ZA) € 15 mn
Batoyle (UK) € 15 mn
Cassida (global) € 21 mn
2016
l 19
Chevron (US) € 11 mn
Revenues (p.a.)
Q1 & Outlook 2016 06
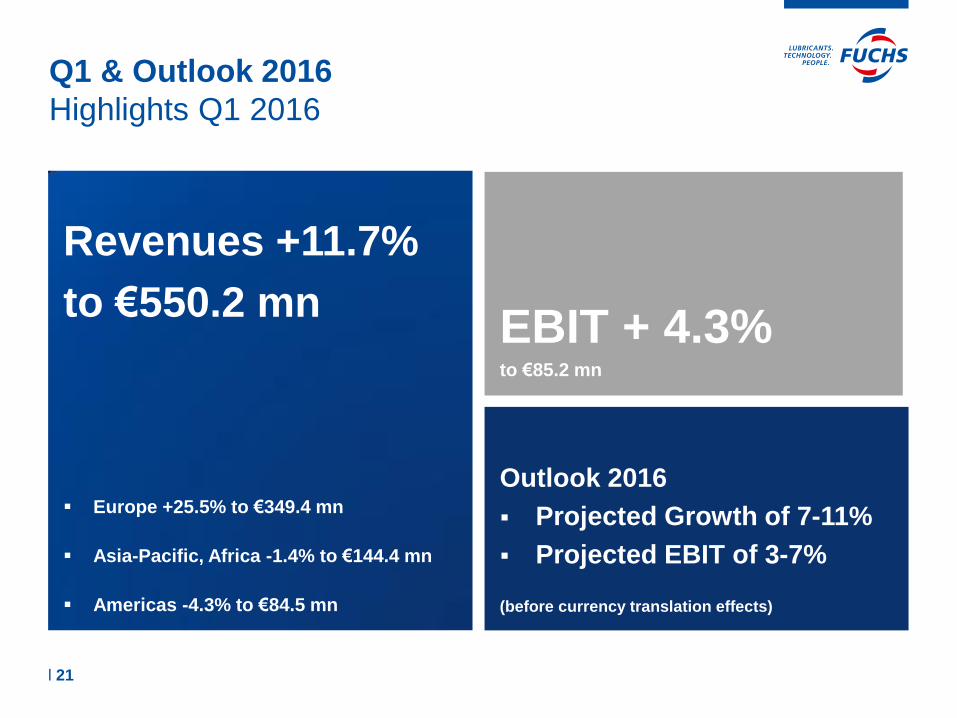
Revenues +11.7%
to €550.2 mn
Europe +25.5% to €349.4 mn
Asia-Pacific, Africa -1.4% to €144.4 mn
Americas -4.3% to €84.5 mn
Q1 & Outlook 2016
Highlights Q1 2016
Outlook 2016
Projected Growth of 7-11%
Projected EBIT of 3-7%
(before currency translation effects)
EBIT + 4.3% to €85.2 mn
l 21
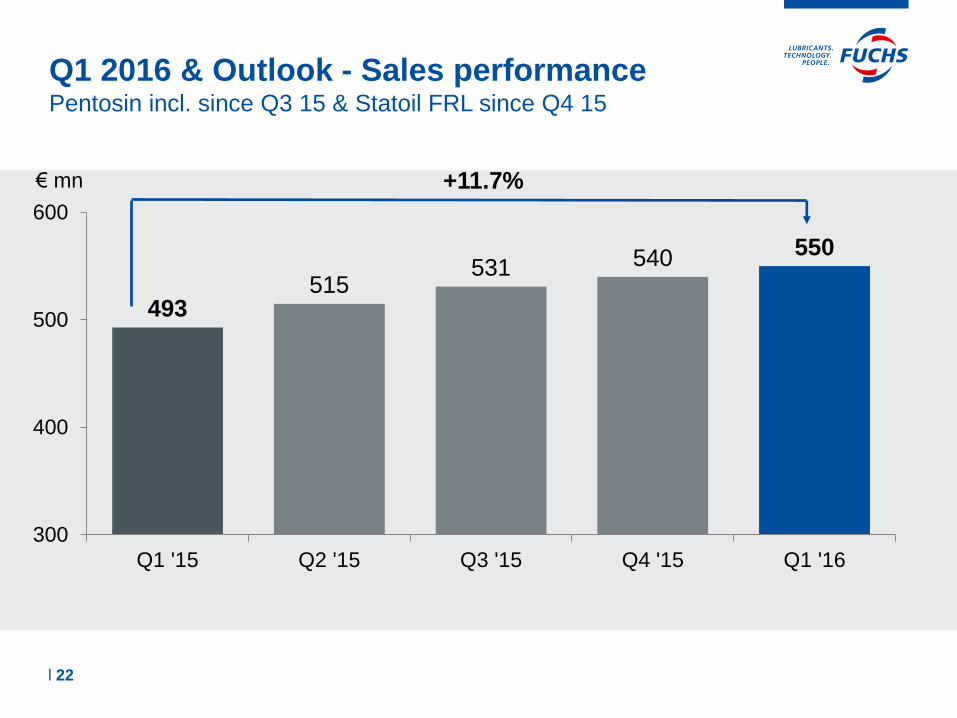
Q1 2016 & Outlook - Sales performance Pentosin incl. since Q3 15 & Statoil FRL since Q4 15
493 515
531 540 550
300
400
500
600
Q1 '15 Q2 '15 Q3 '15 Q4 '15 Q1 '16
€ mn +11.7%
l 22
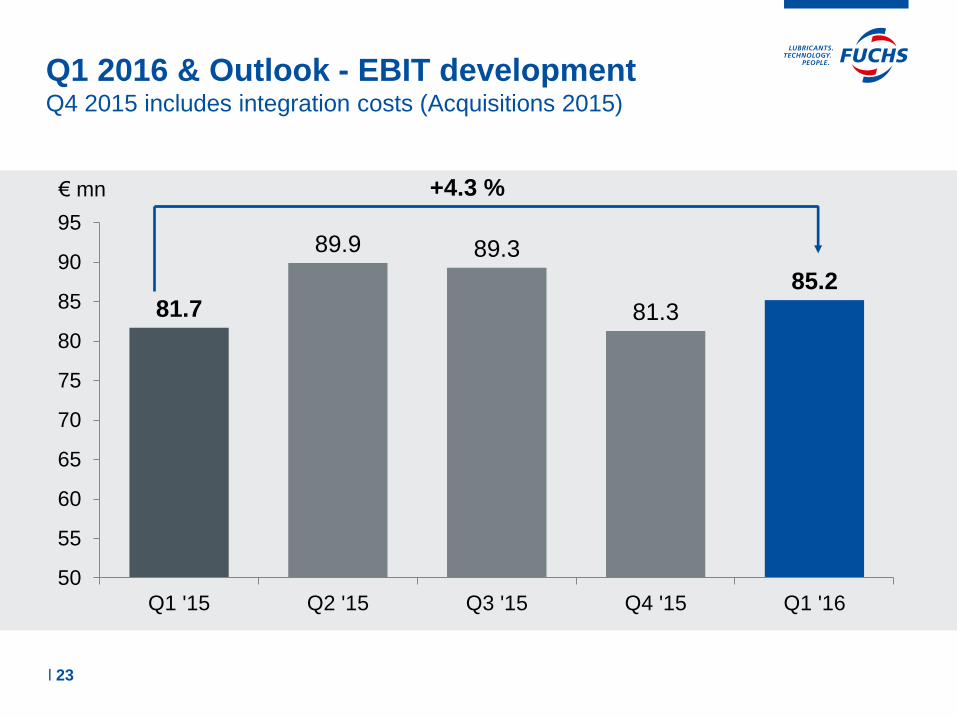
Q1 2016 & Outlook - EBIT development Q4 2015 includes integration costs (Acquisitions 2015)
€ mn
81.7
89.9 89.3
81.3
85.2
50
55
60
65
70
75
80
85
90
95
Q1 '15 Q2 '15 Q3 '15 Q4 '15 Q1 '16
+4.3 %
l 23
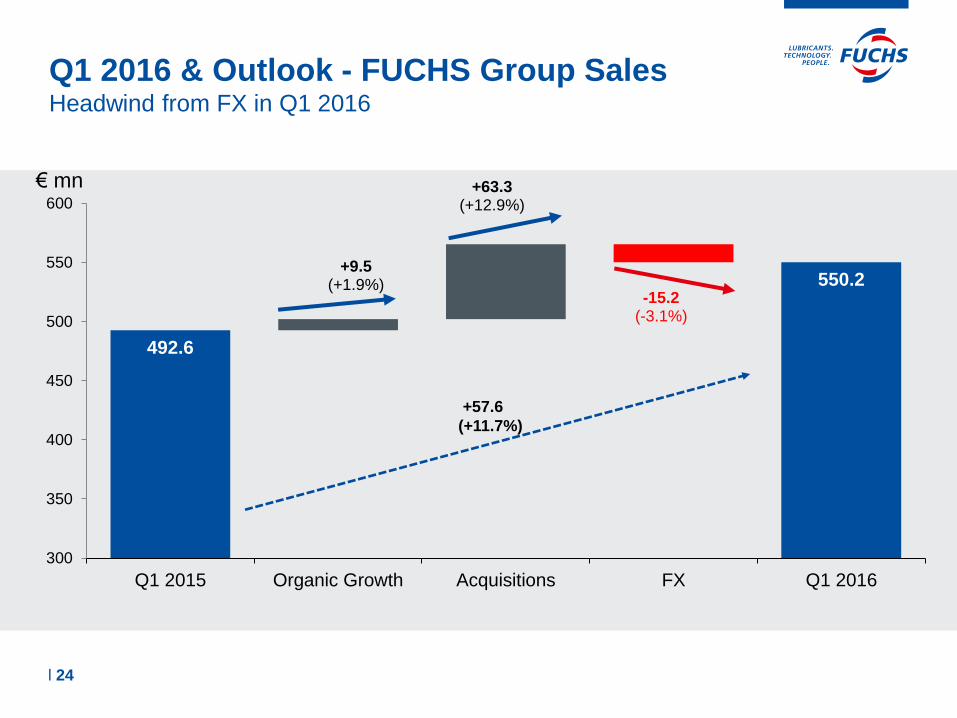
Q1 2016 & Outlook - FUCHS Group Sales Headwind from FX in Q1 2016
492.6
550.2 +9.5
(+1.9%)
+63.3 (+12.9%)
-15.2 (-3.1%)
300
350
400
450
500
550
600
Q1 2015 Organic Growth Acquisitions FX Q1 2016
+57.6
(+11.7%)
l 24
€ mn
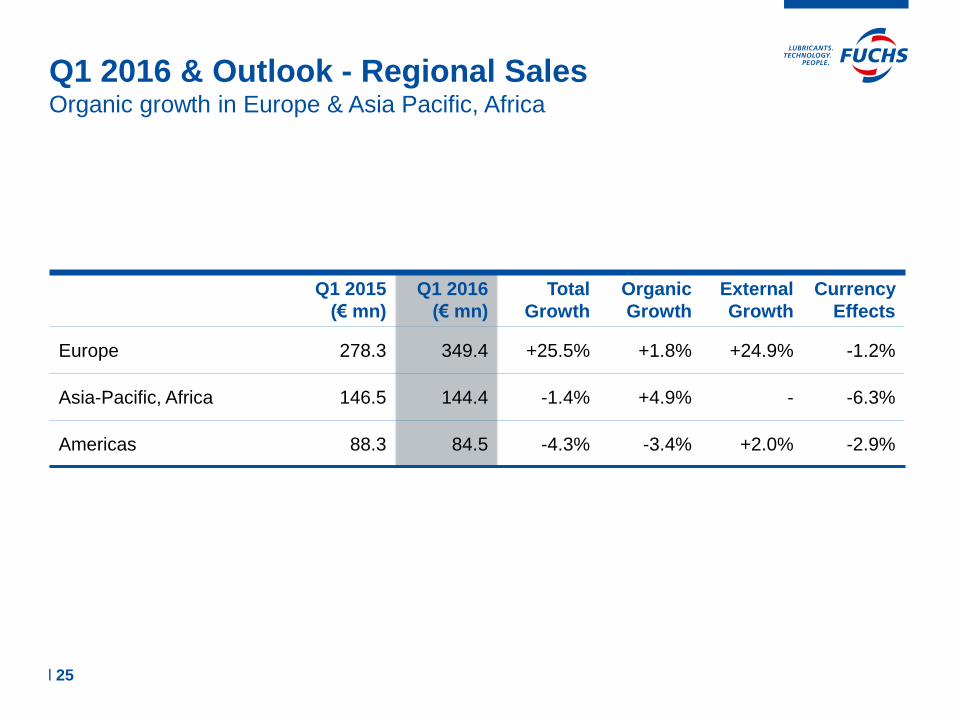
Q1 2016 & Outlook - Regional Sales Organic growth in Europe & Asia Pacific, Africa
l 25
Q1 2015
(€ mn)
Q1 2016
(€ mn)
Total
Growth
Organic
Growth
External
Growth
Currency
Effects
Europe 278.3 349.4 +25.5% +1.8% +24.9% -1.2%
Asia-Pacific, Africa 146.5 144.4 -1.4% +4.9% - -6.3%
Americas 88.3 84.5 -4.3% -3.4% +2.0% -2.9%

Q1 2016 & Outlook - Profit & Loss
€ mn Q1 2015 Q1 2016 Δ Mio. € Δ in %
Sales 492.6 550.2 57.6 11.7%
Gross Profit 187.9 205.8 17.9 9.5%
Margin 38.1% 37.4% -0.7% points
Selling, admin., R&D expenses, others 110.0 125.5 15.5 14.1%
EBIT before at Equity 77.9 80.3 2.4 3.1%
At Equity 3.8 4.9 1.1 28.9%
EBIT 81.7 85.2 3.5 4.3%
Earnings after tax 56.8 58.7 1.9 3.3%
l 26
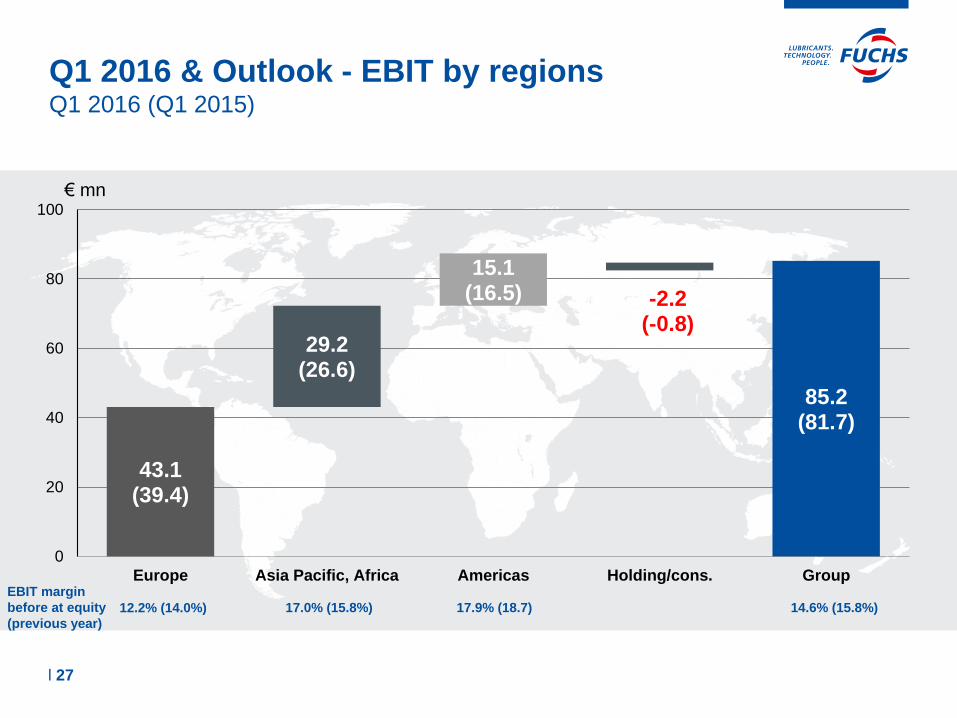
Q1 2016 & Outlook - EBIT by regions Q1 2016 (Q1 2015)
43.1 (39.4)
29.2 (26.6)
15.1 (16.5) -2.2
(-0.8)
85.2 (81.7)
0
20
40
60
80
100
Europe Asia Pacific, Africa Americas Holding/cons. Group
€ mn
l 27
EBIT margin
before at equity
(previous year)
17.0% (15.8%) 17.9% (18.7) 14.6% (15.8%) 12.2% (14.0%)
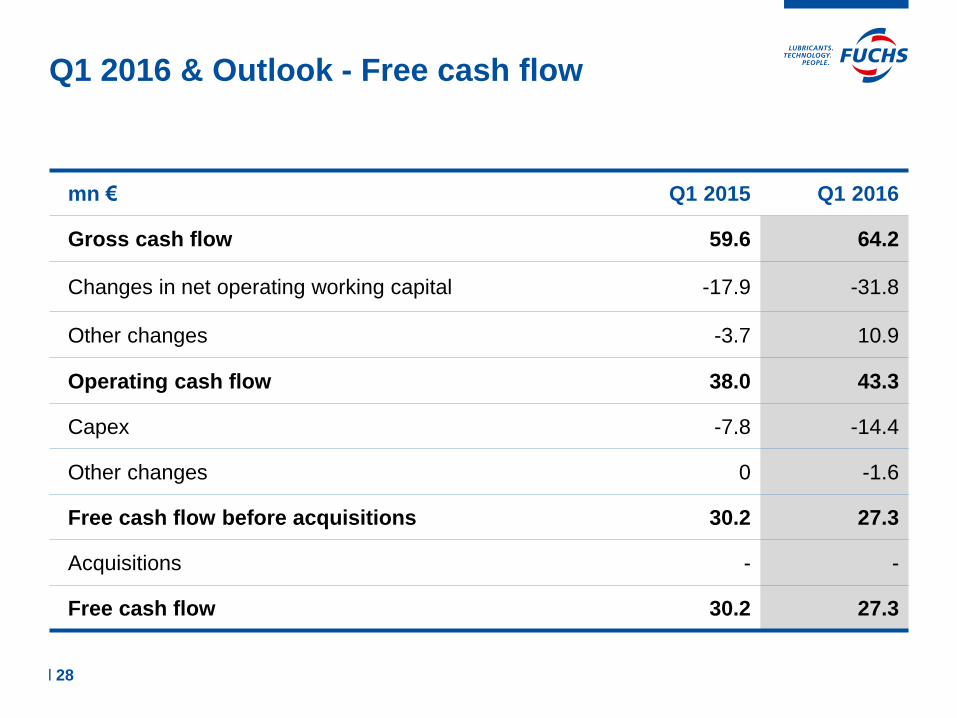
Q1 2016 & Outlook - Free cash flow
mn € Q1 2015 Q1 2016
Gross cash flow 59.6 64.2
Changes in net operating working capital -17.9 -31.8
Other changes -3.7 10.9
Operating cash flow 38.0 43.3
Capex -7.8 -14.4
Other changes 0 -1.6
Free cash flow before acquisitions 30.2 27.3
Acquisitions - -
Free cash flow 30.2 27.3
l 28
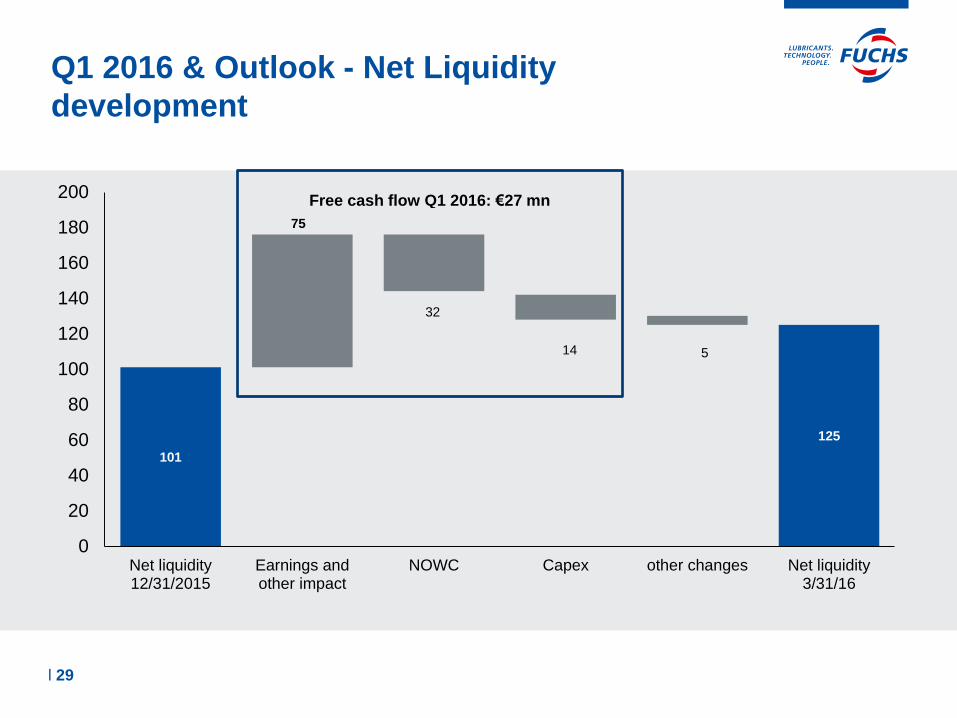
101
125
75
32
14 5
0
20
40
60
80
100
120
140
160
180
200
Net liquidity12/31/2015
Earnings andother impact
NOWC Capex other changes Net liquidity3/31/16
Free cash flow Q1 2016: €27 mn
Q1 2016 & Outlook - Net Liquidity
development
l 29
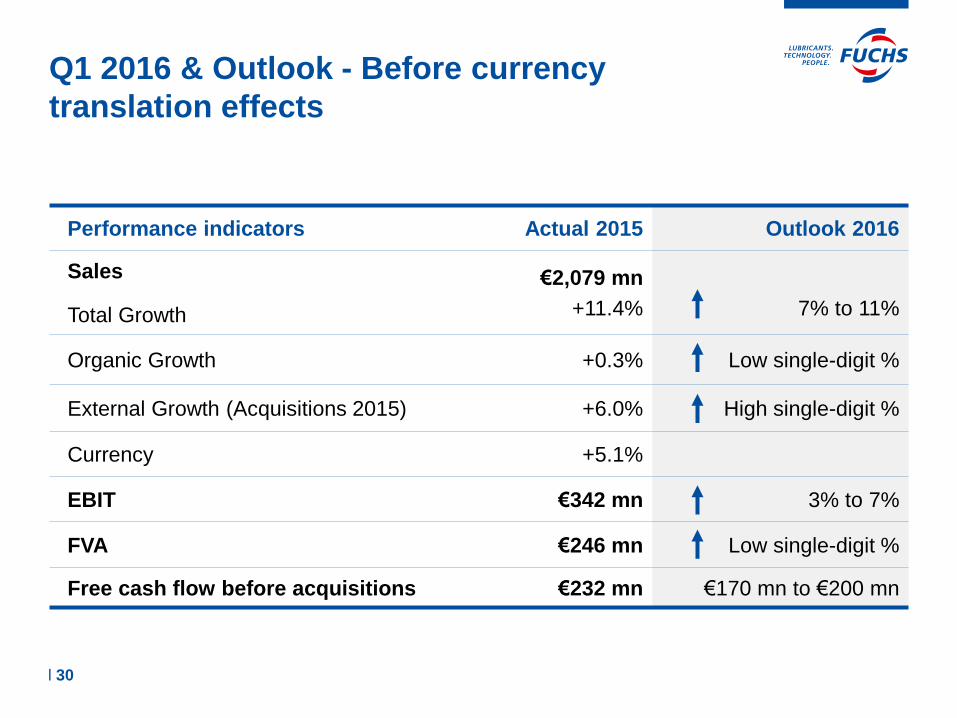
Q1 2016 & Outlook - Before currency
translation effects
Performance indicators Actual 2015 Outlook 2016
Sales
Total Growth
€2,079 mn
+11.4%
7% to 11%
Organic Growth +0.3% Low single-digit %
External Growth (Acquisitions 2015) +6.0% High single-digit %
Currency +5.1%
EBIT €342 mn 3% to 7%
FVA €246 mn Low single-digit %
Free cash flow before acquisitions €232 mn €170 mn to €200 mn
l 30
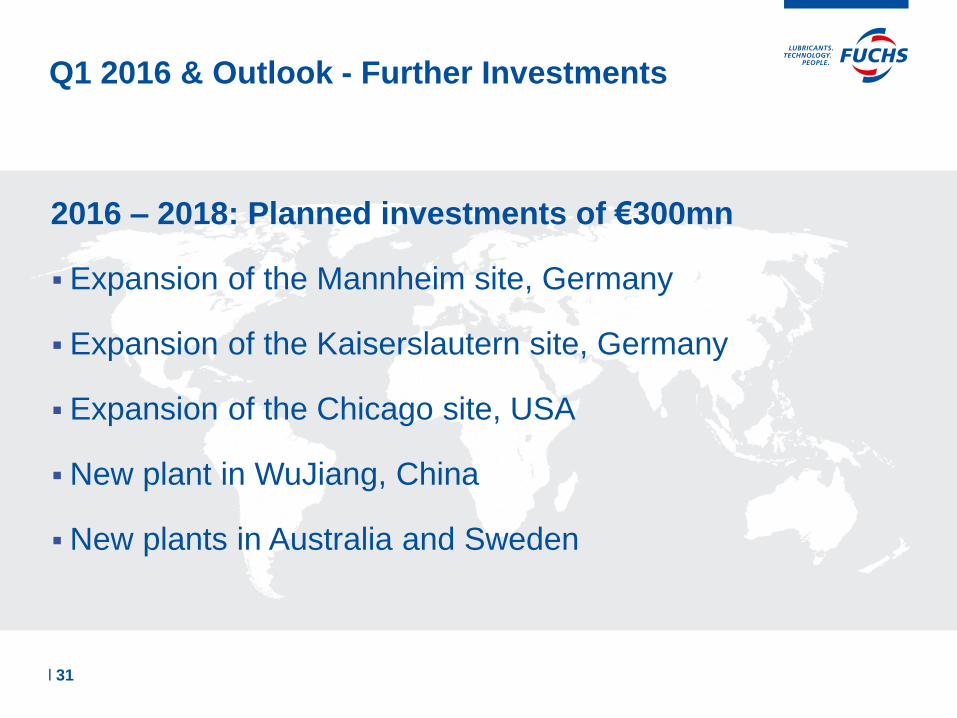
2016 – 2018: Planned investments of €300mn
Expansion of the Mannheim site, Germany
Expansion of the Kaiserslautern site, Germany
Expansion of the Chicago site, USA
New plant in WuJiang, China
New plants in Australia and Sweden
Q1 2016 & Outlook - Further Investments
l 31
Shares 05
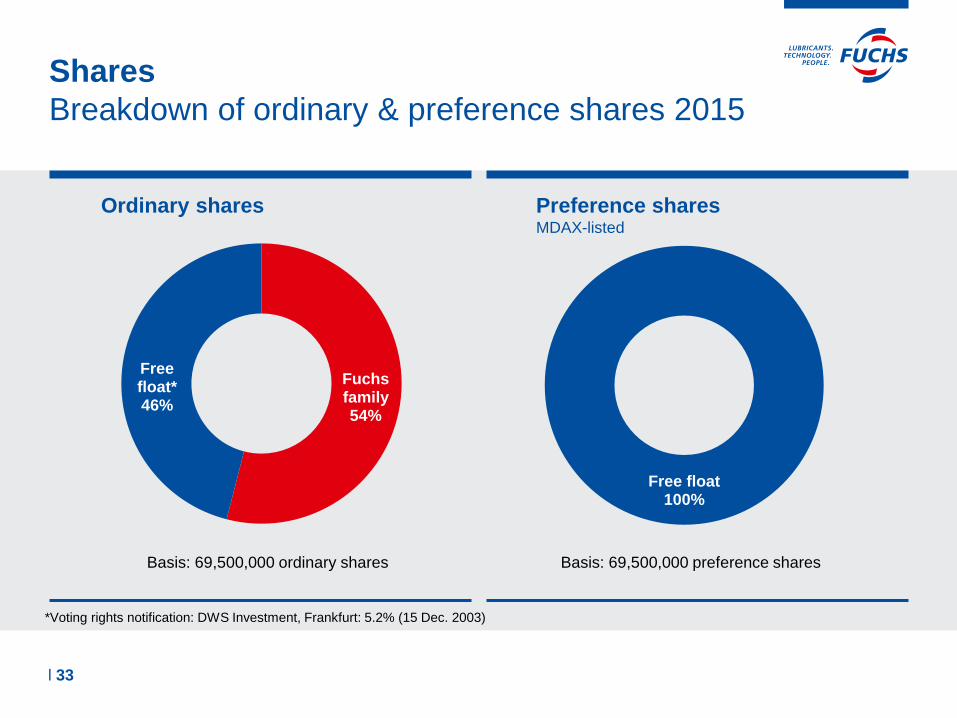
Free float 100%
Shares
Breakdown of ordinary & preference shares 2015
Fuchs family 54%
Free float* 46%
Basis: 69,500,000 ordinary shares
*Voting rights notification: DWS Investment, Frankfurt: 5.2% (15 Dec. 2003)
Ordinary shares Preference shares MDAX-listed
Basis: 69,500,000 preference shares
l 33
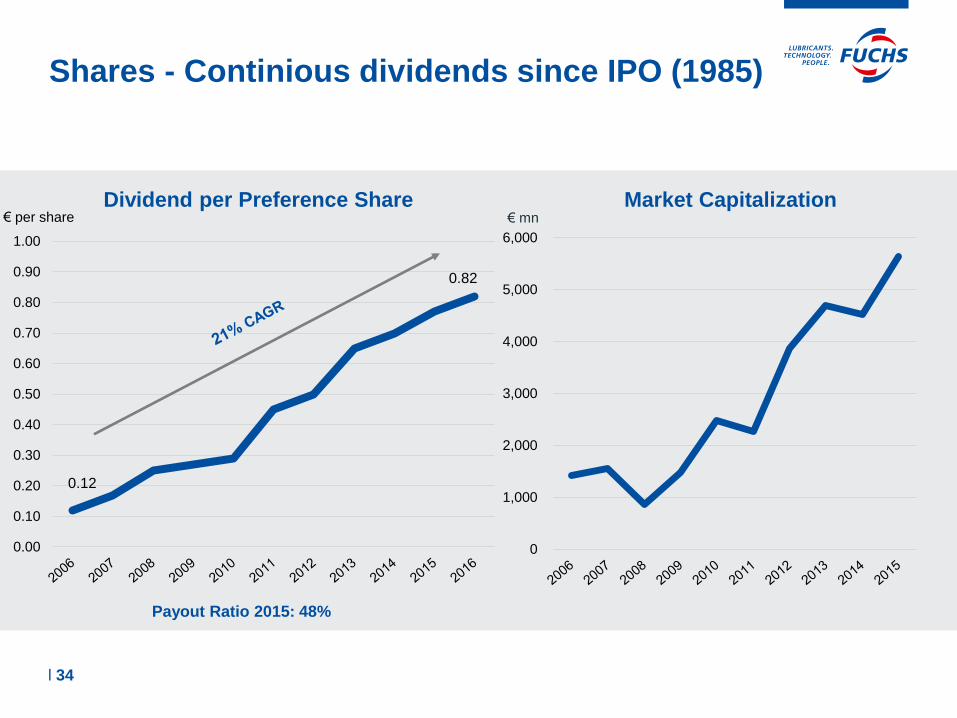
Shares - Continious dividends since IPO (1985)
0
1,000
2,000
3,000
4,000
5,000
6,000
€ mn
0.12
0.82
0.00
0.10
0.20
0.30
0.40
0.50
0.60
0.70
0.80
0.90
1.00
€ per share
l 34
Payout Ratio 2015: 48%
Dividend per Preference Share Market Capitalization

Disclaimer
This presentation contains statements about future development that are based
on assumptions and estimates by the management of FUCHS PETROLUB SE.
Even if the management is of the opinion that these assumptions and estimates
are accurate, future actual developments and future actual results may differ
significantly from these assumptions and estimates due to a variety of factors.
These factors can include changes in the overall economic climate, procurement
prices, changes to exchange rates and interest rates, and changes in the
lubricants industry. FUCHS PETROLUB SE provides no guarantee that future
developments and the results actually achieved in the future will match the
assumptions and estimates set out in this presentation and assumes no liability
for such.
l 35
Appendix 06
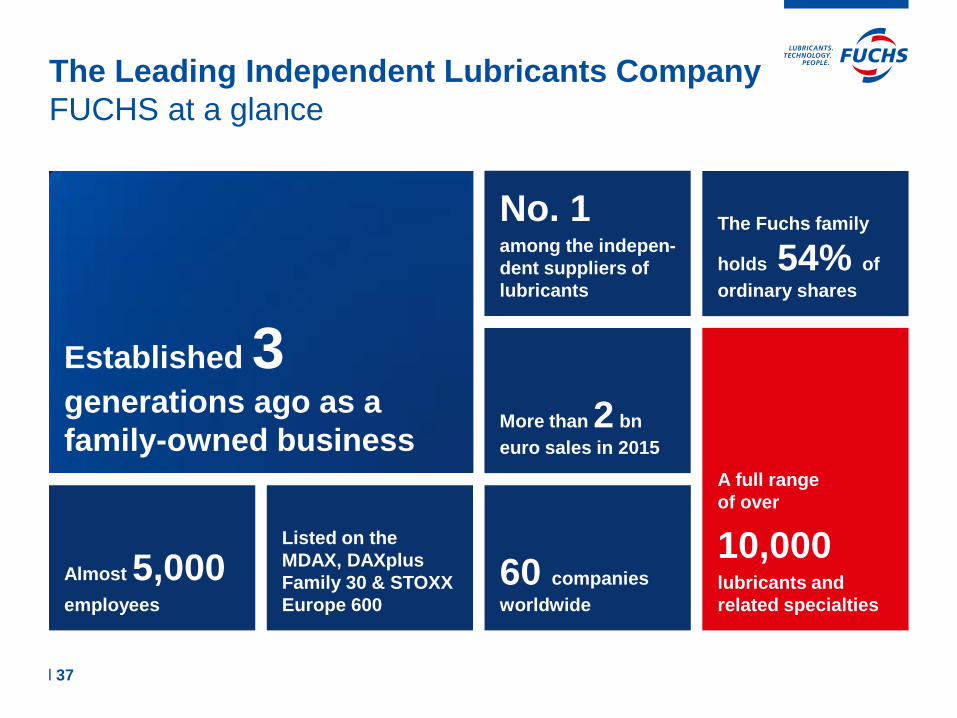
The Leading Independent Lubricants Company
FUCHS at a glance
l 37
Almost 5,000 employees
Listed on the
MDAX, DAXplus
Family 30 & STOXX
Europe 600
60 companies
worldwide
More than 2 bn
euro sales in 2015
No. 1 among the indepen-
dent suppliers of
lubricants
The Fuchs family
holds 54% of
ordinary shares
A full range
of over
10,000 lubricants and
related specialties
Established 3
generations ago as a
family-owned business
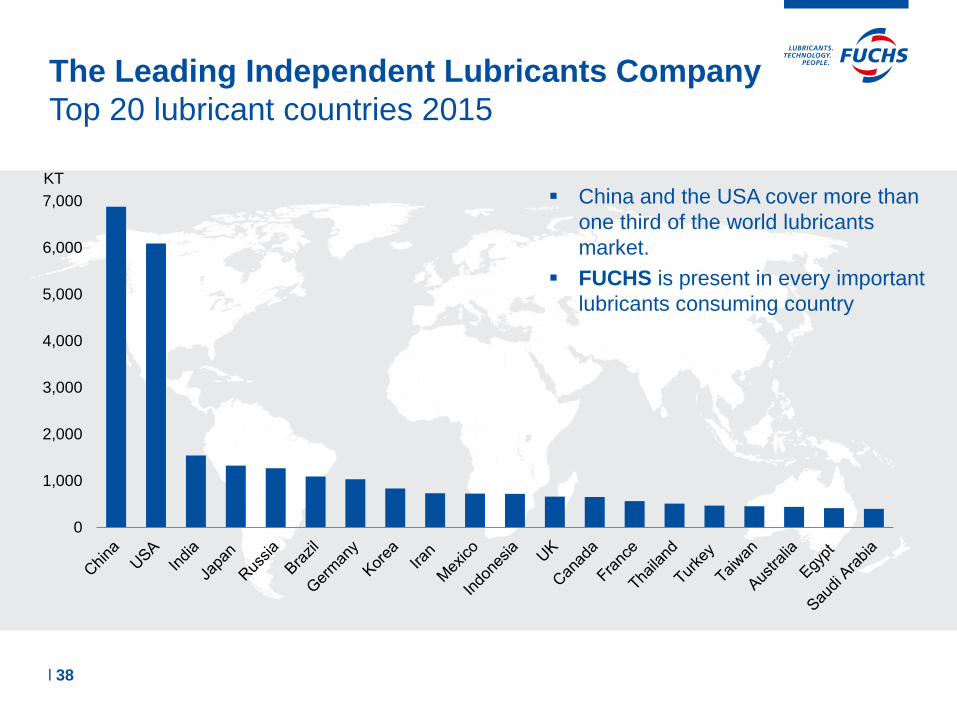
The Leading Independent Lubricants Company
Top 20 lubricant countries 2015
0
1,000
2,000
3,000
4,000
5,000
6,000
7,000
l 38
China and the USA cover more than
one third of the world lubricants
market.
FUCHS is present in every important
lubricants consuming country
KT
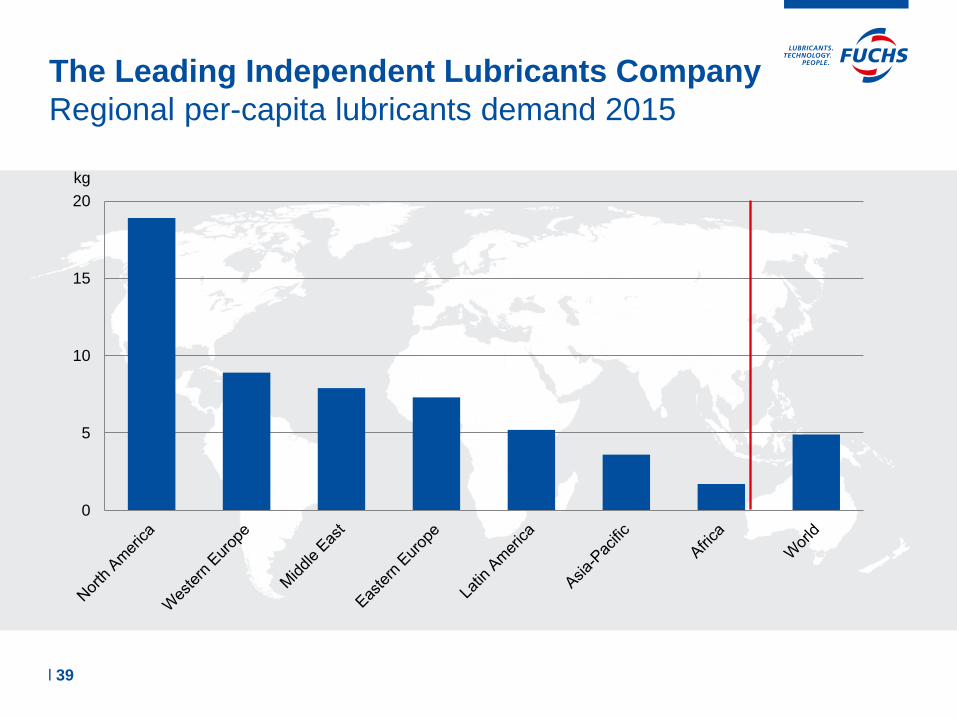
The Leading Independent Lubricants Company
Regional per-capita lubricants demand 2015
0
5
10
15
20
l 39
kg
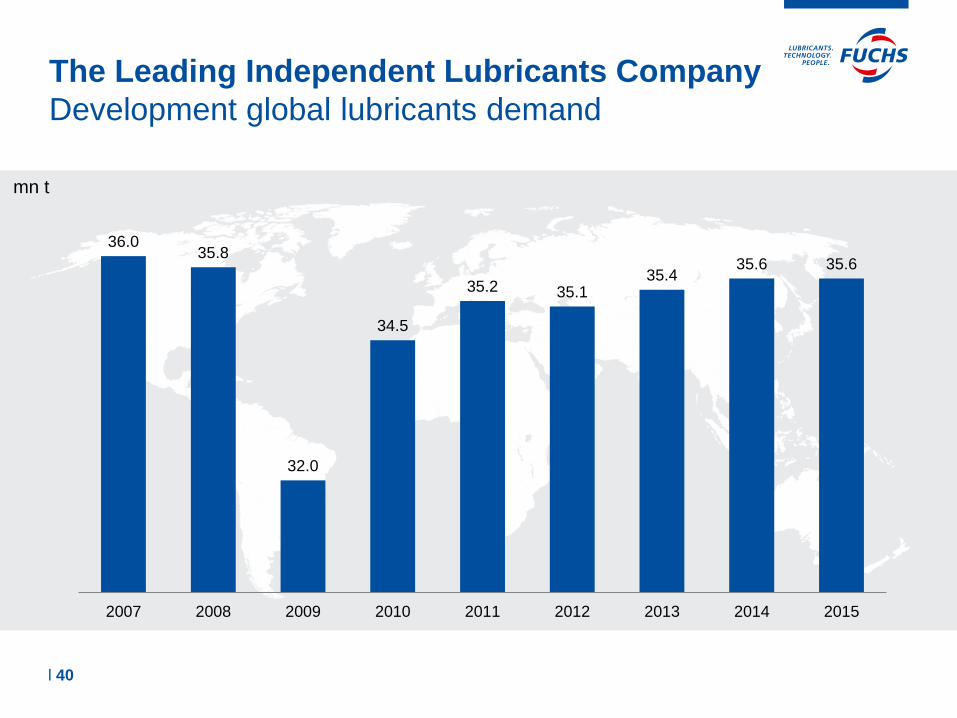
The Leading Independent Lubricants Company
Development global lubricants demand
36.0 35.8
32.0
34.5
35.2 35.1 35.4
35.6 35.6
2007 2008 2009 2010 2011 2012 2013 2014 2015
l 40
mn t
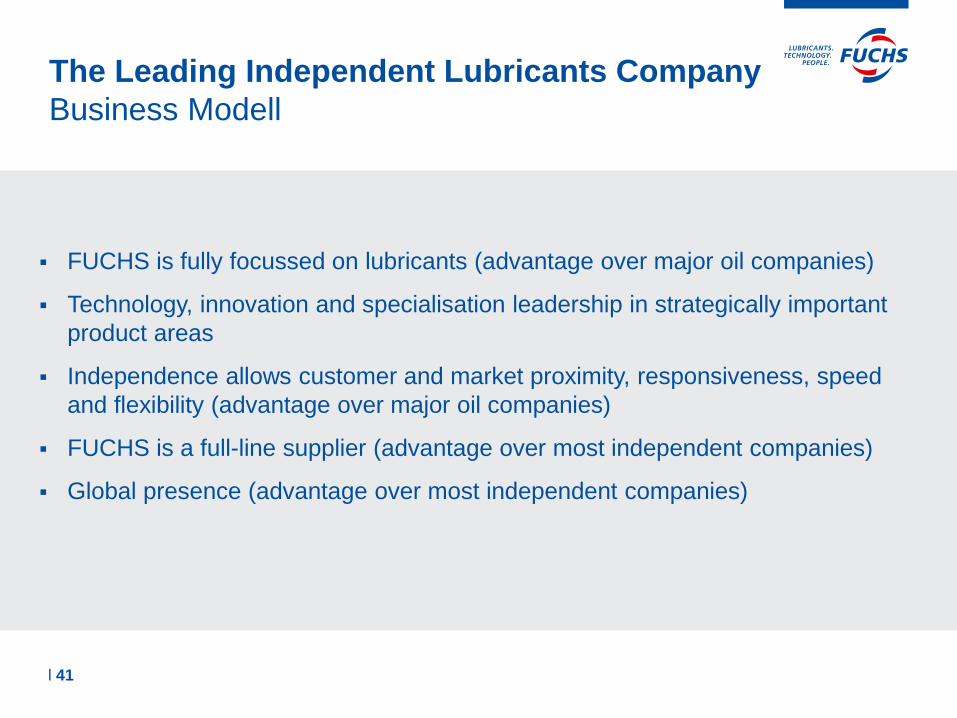
The Leading Independent Lubricants Company
Business Modell
FUCHS is fully focussed on lubricants (advantage over major oil companies)
Technology, innovation and specialisation leadership in strategically important
product areas
Independence allows customer and market proximity, responsiveness, speed
and flexibility (advantage over major oil companies)
FUCHS is a full-line supplier (advantage over most independent companies)
Global presence (advantage over most independent companies)
l 41
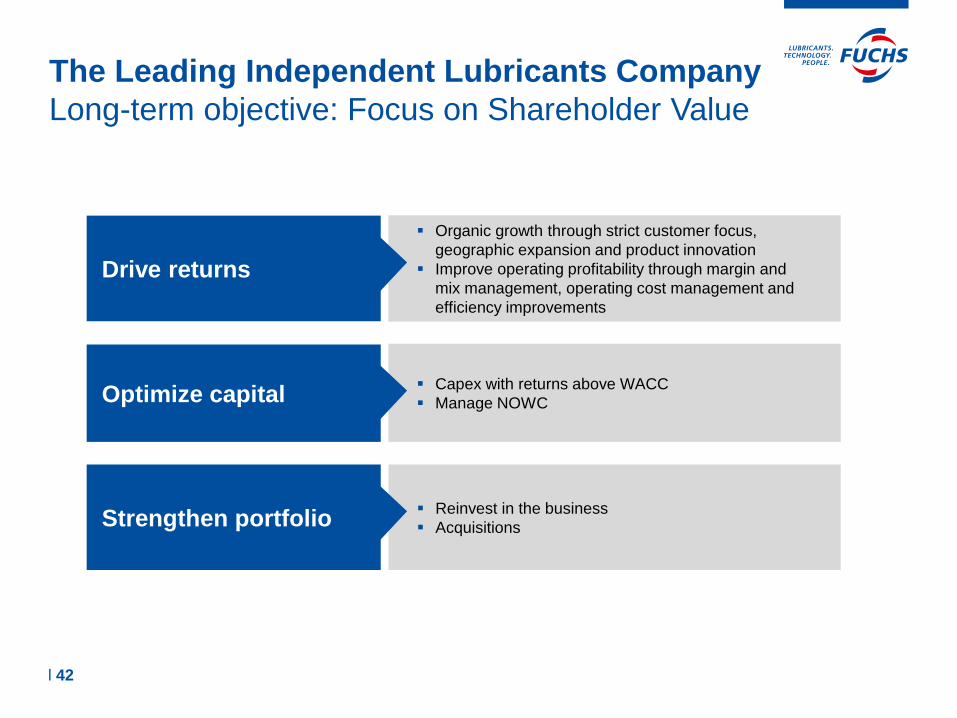
The Leading Independent Lubricants Company
Long-term objective: Focus on Shareholder Value
l 42
Drive returns
Optimize capital
Strengthen portfolio
Organic growth through strict customer focus,
geographic expansion and product innovation
Improve operating profitability through margin and
mix management, operating cost management and
efficiency improvements
Capex with returns above WACC
Manage NOWC
Reinvest in the business
Acquisitions

Revenues +11%
to over €2 bn
Europe up 10% to €1.23 bn
Asia-Pacific, Africa up 13% to €583 mn
Americas up 12% to €353 mn
Unique Track Record
Highlights FY 2015
2 acquisitions were completed:
Pentosin & Statoil
EBIT
+9% to €342 mn
+7% higher dividend
l 43
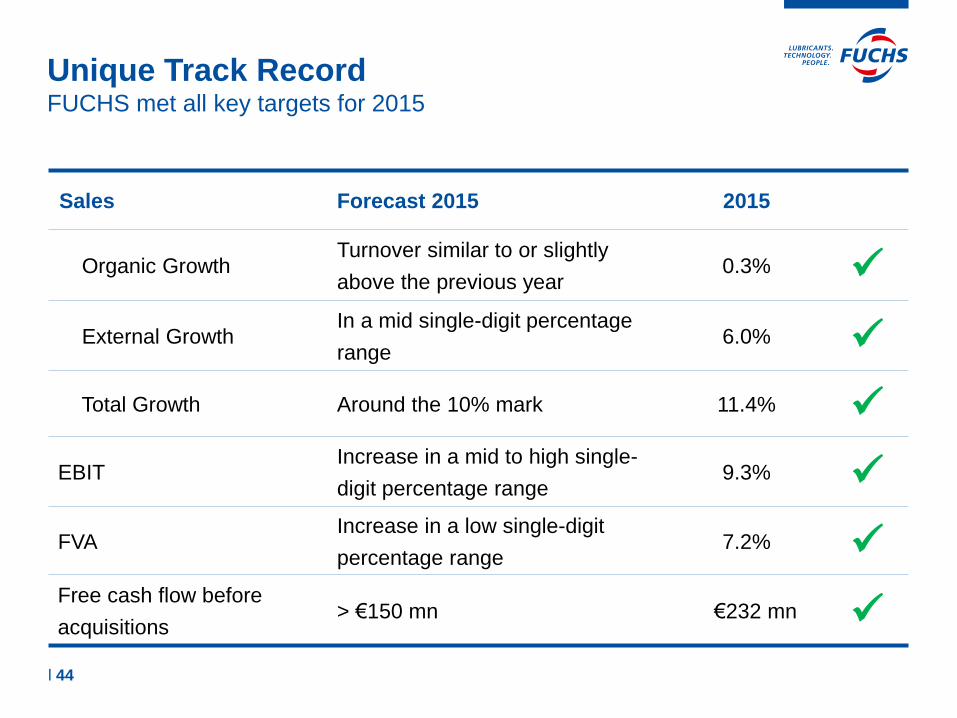
Unique Track Record FUCHS met all key targets for 2015
Sales Forecast 2015 2015
Organic Growth Turnover similar to or slightly
above the previous year 0.3%
External Growth In a mid single-digit percentage
range 6.0%
Total Growth Around the 10% mark 11.4%
EBIT Increase in a mid to high single-
digit percentage range 9.3%
FVA Increase in a low single-digit
percentage range 7.2%
Free cash flow before
acquisitions > €150 mn €232 mn
l 44
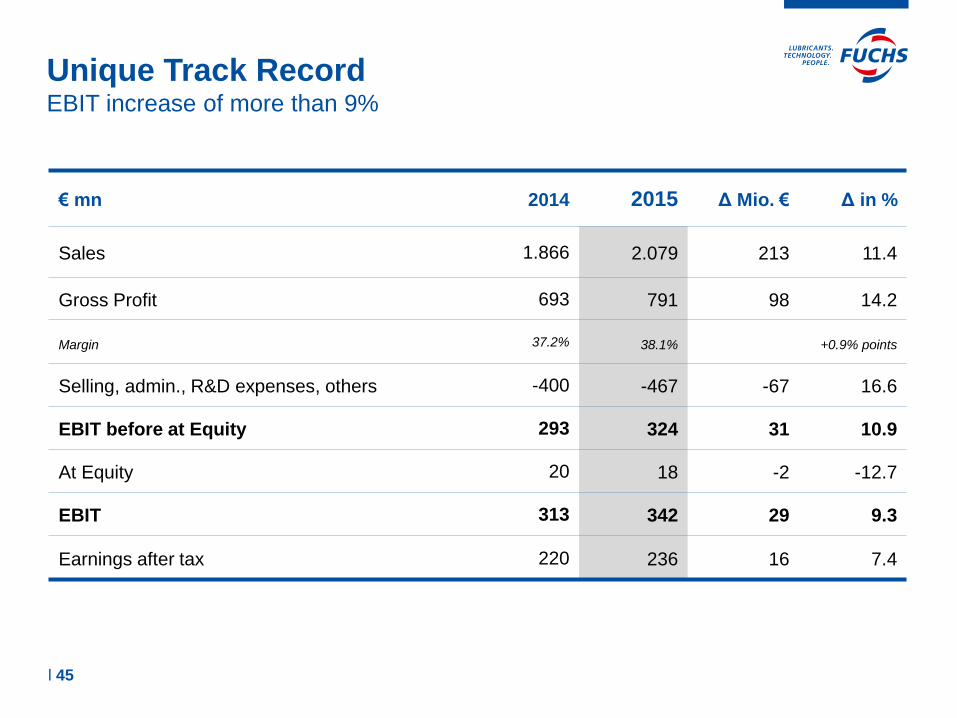
Unique Track Record EBIT increase of more than 9%
€ mn 2014 2015 Δ Mio. € Δ in %
Sales 1.866 2.079 213 11.4
Gross Profit 693 791 98 14.2
Margin 37.2% 38.1% +0.9% points
Selling, admin., R&D expenses, others -400 -467 -67 16.6
EBIT before at Equity 293 324 31 10.9
At Equity 20 18 -2 -12.7
EBIT 313 342 29 9.3
Earnings after tax 220 236 16 7.4
l 45
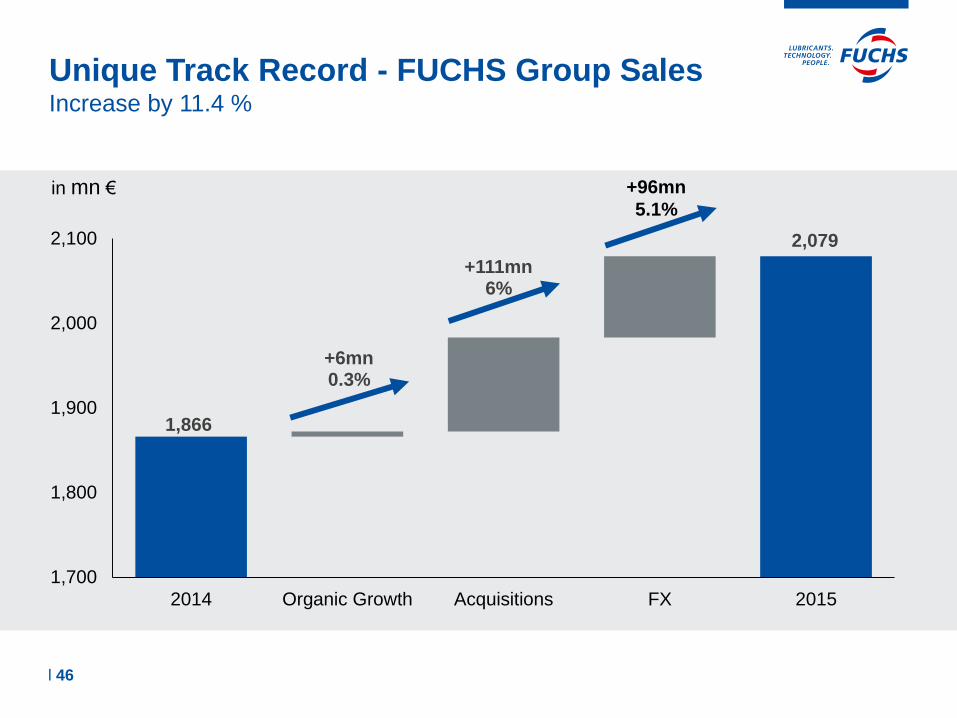
Unique Track Record - FUCHS Group Sales Increase by 11.4 %
1,866
+6mn 0.3%
+111mn 6%
2,079
1,700
1,800
1,900
2,000
2,100
2014 Organic Growth Acquisitions FX 2015
in mn € +96mn
5.1%
l 46
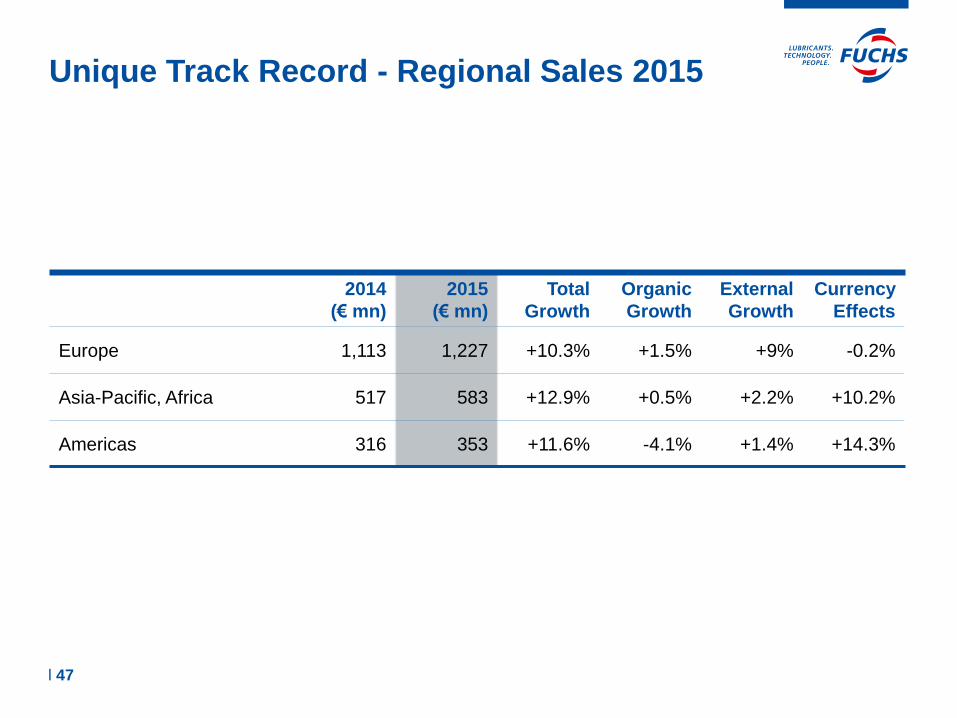
Unique Track Record - Regional Sales 2015
l 47
2014
(€ mn)
2015
(€ mn)
Total
Growth
Organic
Growth
External
Growth
Currency
Effects
Europe 1,113 1,227 +10.3% +1.5% +9% -0.2%
Asia-Pacific, Africa 517 583 +12.9% +0.5% +2.2% +10.2%
Americas 316 353 +11.6% -4.1% +1.4% +14.3%
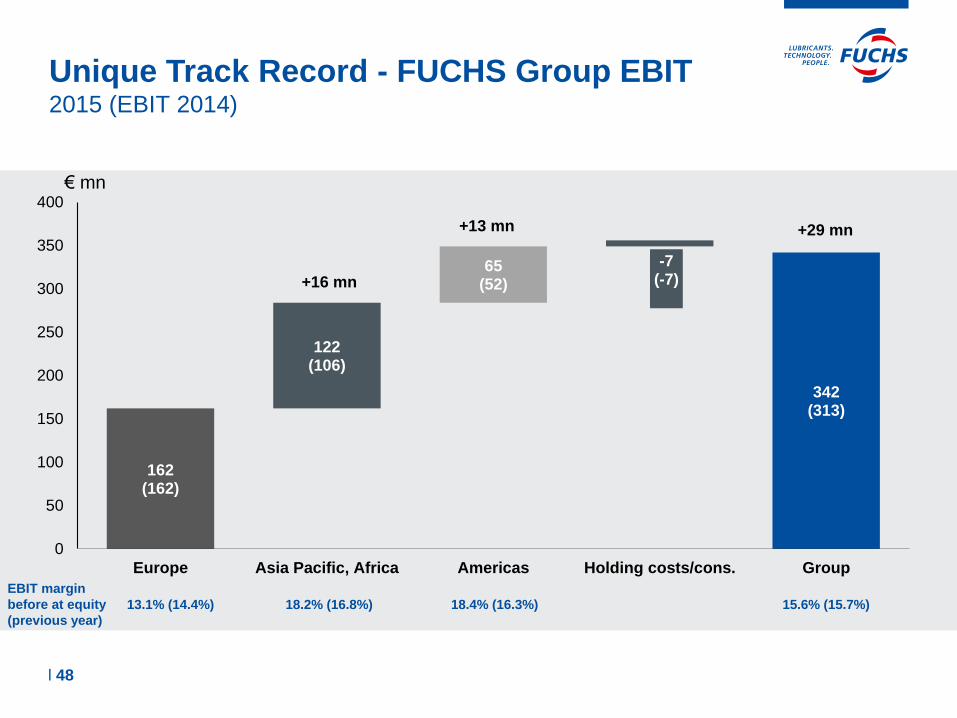
Unique Track Record - FUCHS Group EBIT 2015 (EBIT 2014)
162 (162)
122 (106)
65 (52)
-7 (-7)
342 (313)
0
50
100
150
200
250
300
350
400
Europe Asia Pacific, Africa Americas Holding costs/cons. Group
€ mn
+16 mn
+13 mn +29 mn
l 48
18.2% (16.8%) 18.4% (16.3%) 15.6% (15.7%) 13.1% (14.4%)
EBIT margin
before at equity
(previous year)
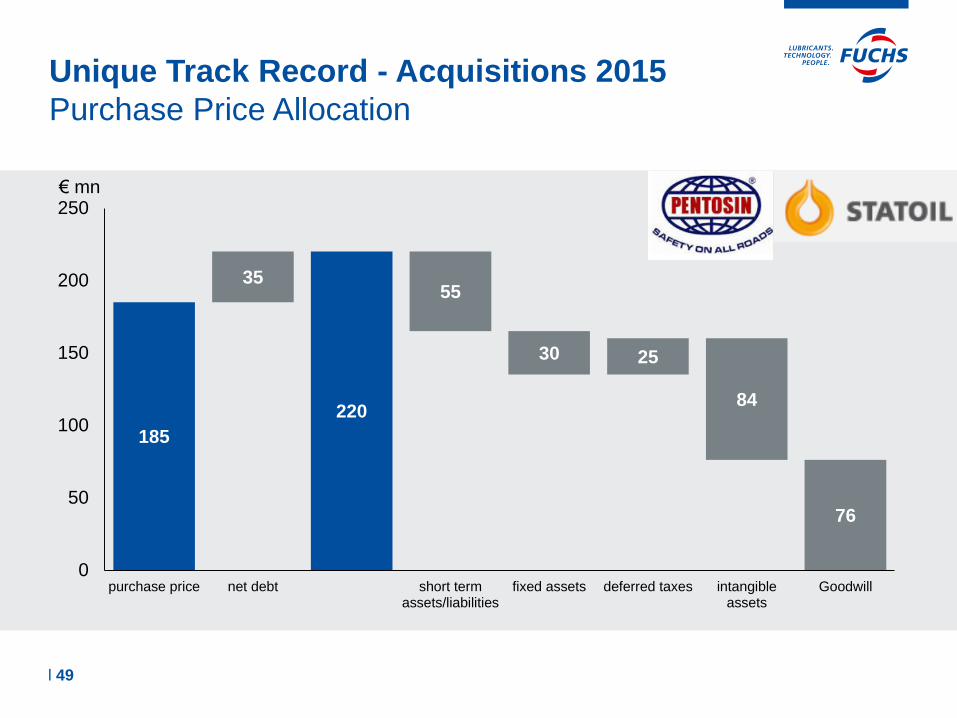
Unique Track Record - Acquisitions 2015
Purchase Price Allocation
185
220
35 55
30 25
84
76
0
50
100
150
200
250
purchase price net debt short termassets/liabilities
fixed assets deferred taxes intangibleassets
Goodwill
€ mn
l 49
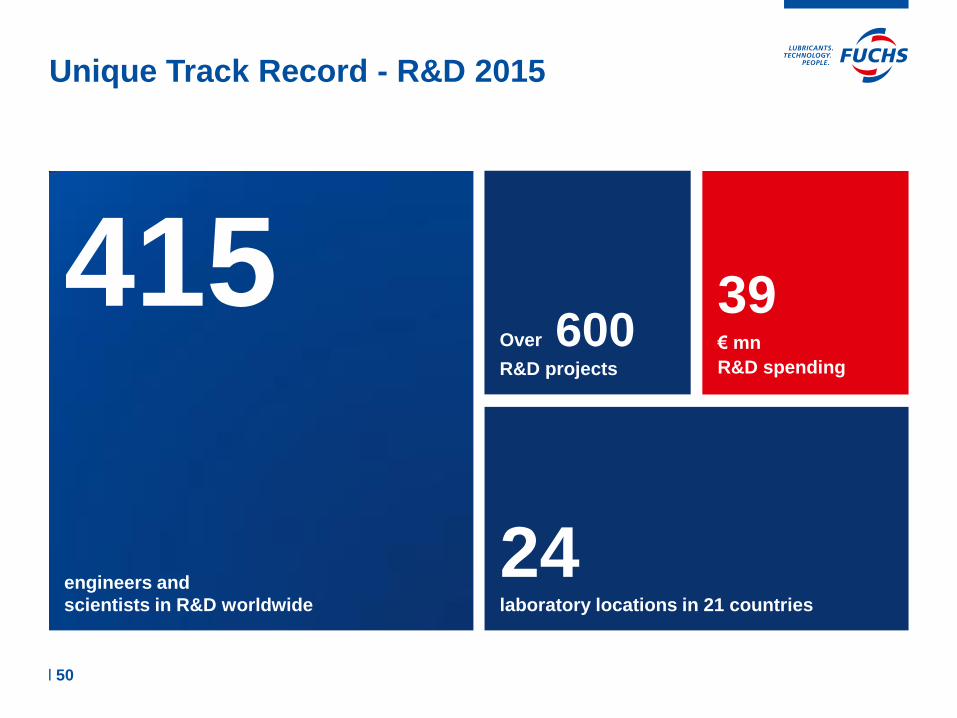
Unique Track Record - R&D 2015
24
laboratory locations in 21 countries
Over 600
R&D projects
39 € mn
R&D spending
415
engineers and
scientists in R&D worldwide
l 50

Unique Track Record - Workforce Structure 4.823 employees globally
l 51
Production 1,505 (31%)
R&D 441 (9%)
Admin 668
(14%)
Marketing & Sales 2,209 (46%)
Functional Workforce Structure
Other European Countries
1,809 (38%)
Americas 588
(12%)
Asia-Pacific, Africa 1,029 (21%)
Germany 1,397 (29%)
Regional Workforce Structure
2015 2015
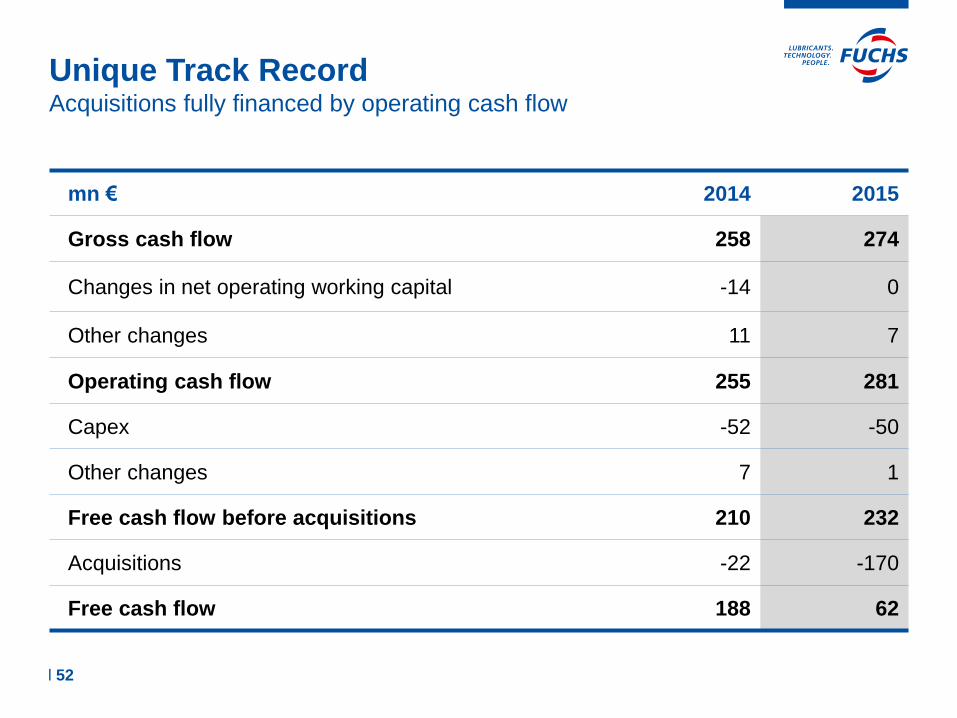
Unique Track Record Acquisitions fully financed by operating cash flow
mn € 2014 2015
Gross cash flow 258 274
Changes in net operating working capital -14 0
Other changes 11 7
Operating cash flow 255 281
Capex -52 -50
Other changes 7 1
Free cash flow before acquisitions 210 232
Acquisitions -22 -170
Free cash flow 188 62
l 52
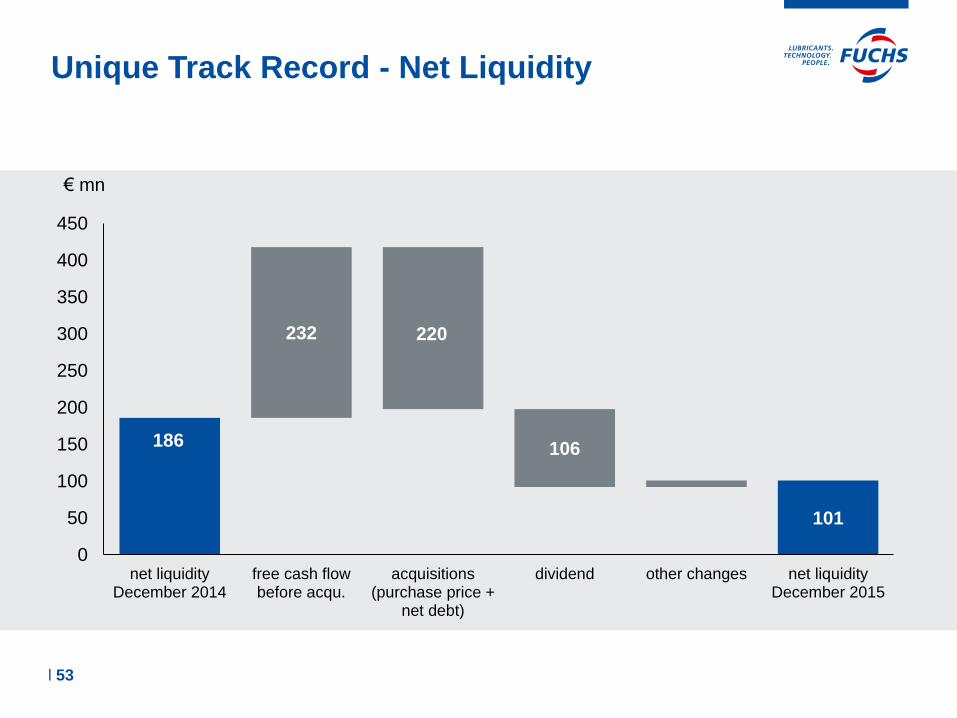
186
101
232 220
106
0
50
100
150
200
250
300
350
400
450
net liquidityDecember 2014
free cash flowbefore acqu.
acquisitions(purchase price +
net debt)
dividend other changes net liquidityDecember 2015
Unique Track Record - Net Liquidity
€ mn
l 53
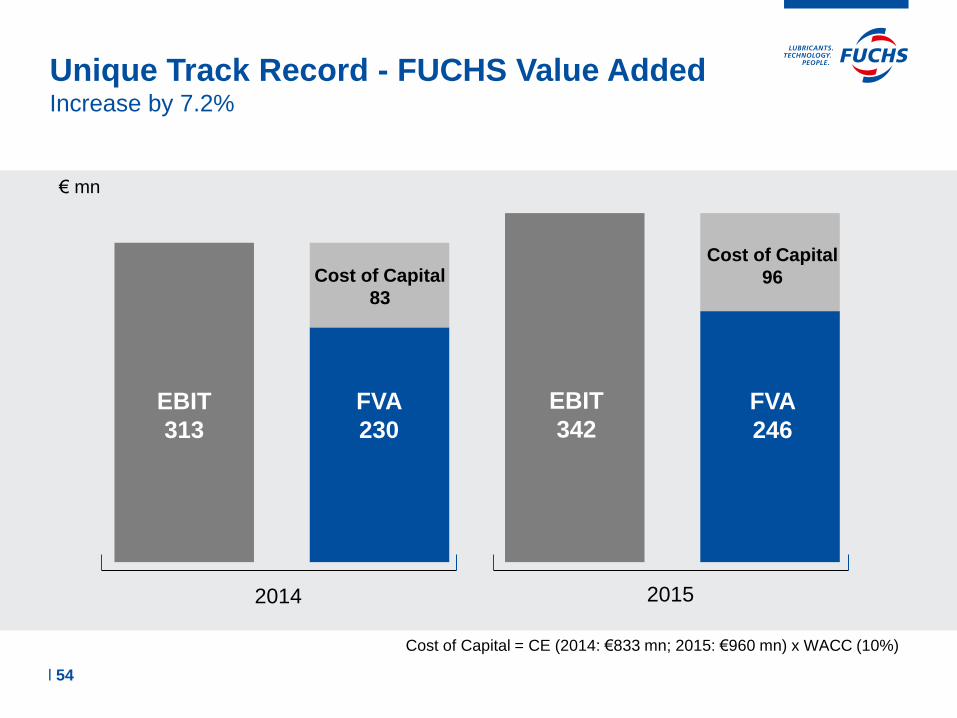
Unique Track Record - FUCHS Value Added Increase by 7.2%
2014 2015
EBIT
313
EBIT
342
€ mn
FVA
230
FVA
246
Cost of Capital
83
Cost of Capital
96
Cost of Capital = CE (2014: €833 mn; 2015: €960 mn) x WACC (10%)
l 54
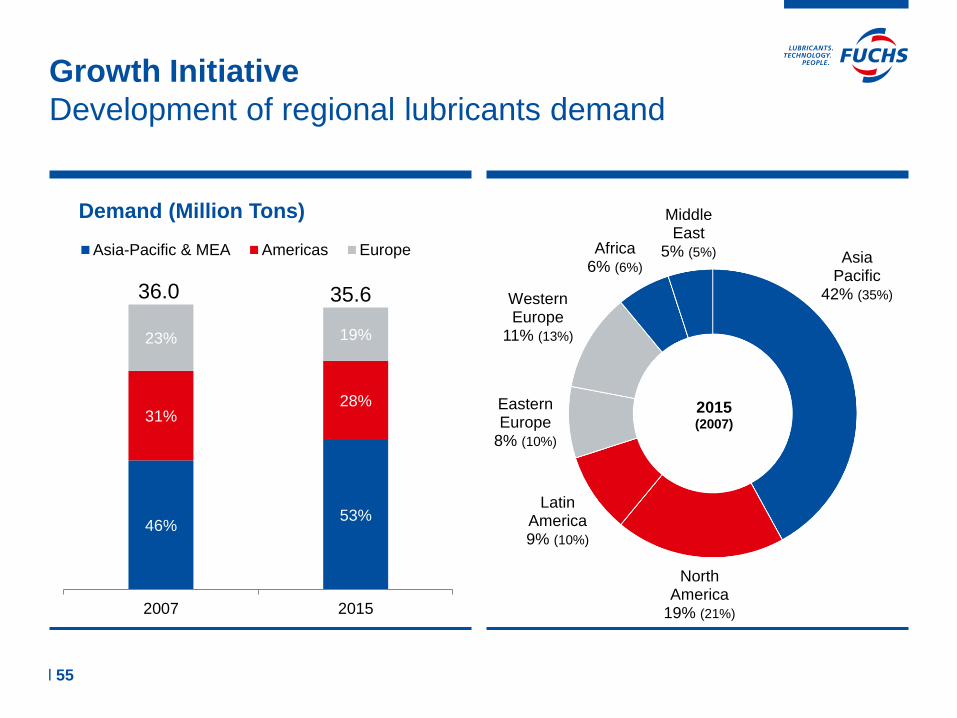
Asia Pacific
42% (35%)
North America
19% (21%)
Latin America 9% (10%)
Eastern Europe
8% (10%)
Western Europe
11% (13%)
Africa 6% (6%)
Middle East
5% (5%)
2015 (2007)
Growth Initiative
Development of regional lubricants demand
46% 53%
31% 28%
23% 19%
2007 2015
Demand (Million Tons)
Asia-Pacific & MEA Americas Europe
35.6 36.0
l 55
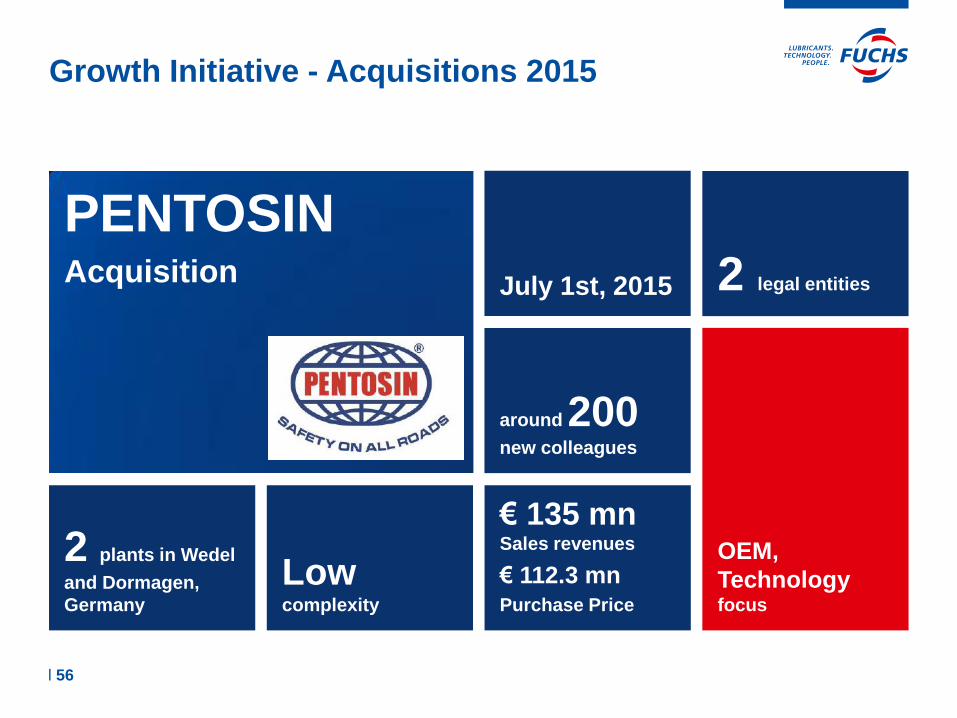
2 plants in Wedel
and Dormagen,
Germany
Low complexity
around 200 new colleagues
€ 135 mn
Sales revenues
€ 112.3 mn Purchase Price
July 1st, 2015 2 legal entities
OEM,
Technology focus
PENTOSIN
Acquisition
l 56
Growth Initiative - Acquisitions 2015
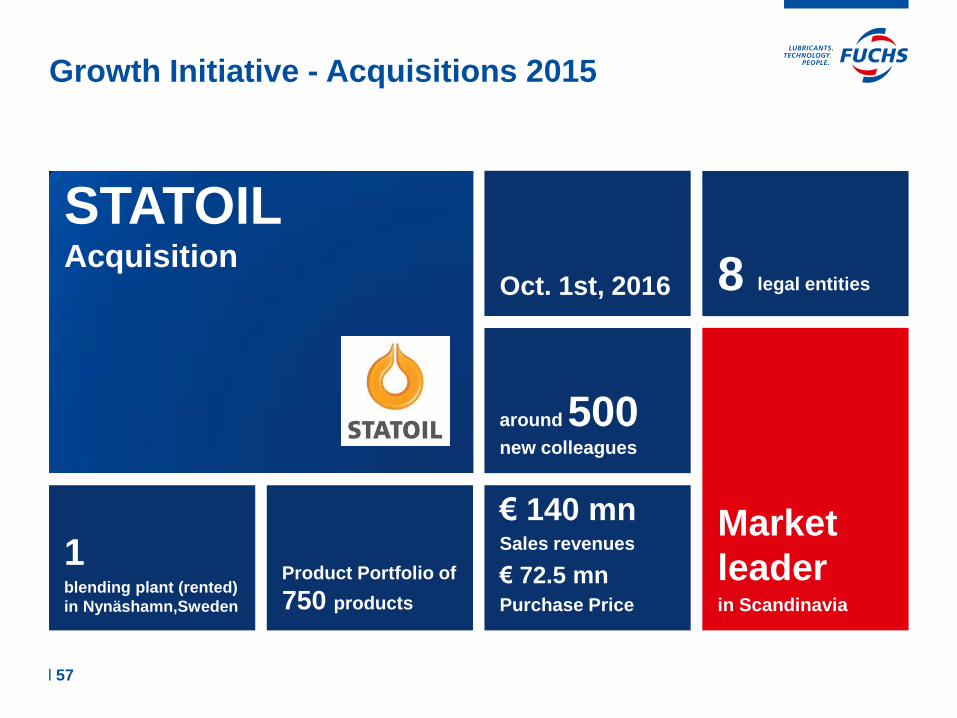
1 blending plant (rented)
in Nynäshamn,Sweden
Product Portfolio of
750 products
€ 140 mn Sales revenues
€ 72.5 mn
Purchase Price
around 500 new colleagues
Oct. 1st, 2016 8 legal entities
Market
leader
in Scandinavia
STATOIL Acquisition
l 57
Growth Initiative - Acquisitions 2015
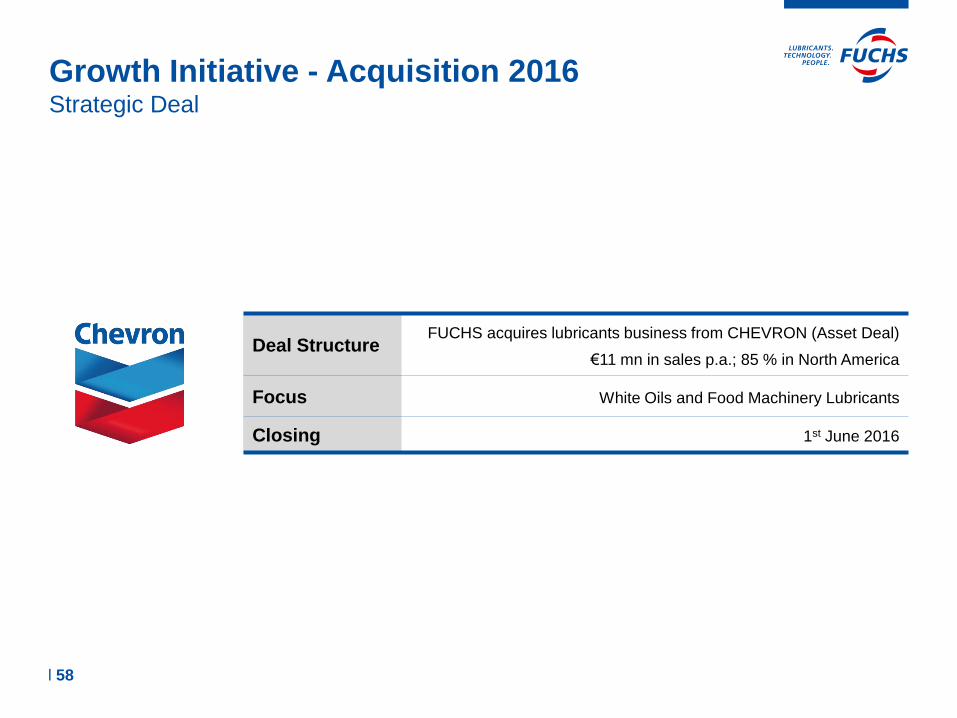
Growth Initiative - Acquisition 2016 Strategic Deal
Deal Structure FUCHS acquires lubricants business from CHEVRON (Asset Deal)
€11 mn in sales p.a.; 85 % in North America
Focus White Oils and Food Machinery Lubricants
Closing 1st June 2016
l 58
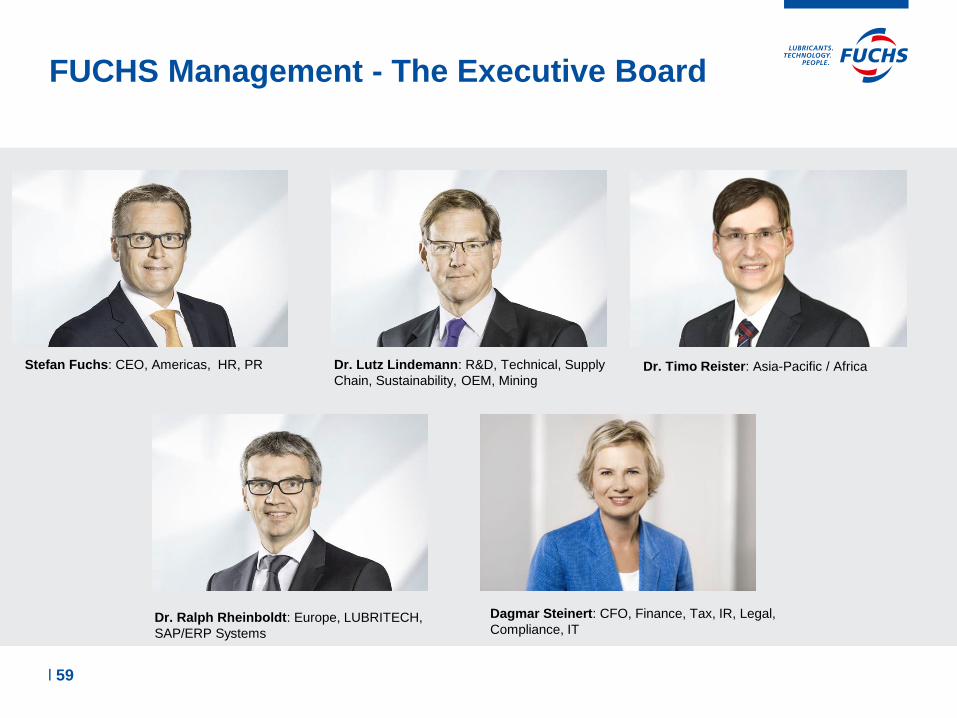
FUCHS Management - The Executive Board
Stefan Fuchs: CEO, Americas, HR, PR
Dagmar Steinert: CFO, Finance, Tax, IR, Legal,
Compliance, IT
Dr. Lutz Lindemann: R&D, Technical, Supply
Chain, Sustainability, OEM, Mining
Dr. Ralph Rheinboldt: Europe, LUBRITECH,
SAP/ERP Systems
Dr. Timo Reister: Asia-Pacific / Africa
l 59
Executive Compensation Changes as of 2015
25% of variable compensation
must be invested in FUCHS PETROLUB SE
preference shares with a 3 year lock-up
period
50% of variable compensation
must be invested in FUCHS PETROLUB
SE preference shares with a lock-up period
of 5 years. The vesting period is waived
when the member leaves the Supervisory
Board
Individual mandatory notices were published (Director‘s Dealings)
Executive Board Supervisory Board
l 60
FUCHS PETROLUB SE
Investor Relations
Investor Relations
Thomas Altmann
Friesenheimer Str. 17
68169 Mannheim, Germany
Tel. +49 (0) 621 3802 1201
February 19, 2016 Preliminary Numbers 2015
March 22, 2016 Full Year Results 2015
April 29, 2016 Q1 Results
May 4, 2016 Annual General Meeting
August 1, 2016 H1 Results
September 8, 2016 Capital Market Day
November 3, 2016 Q3 Results
Financial Calendar Contact
l 61