Goldman Sachs Funds II SICAV - FONDS professionell Goldman Sachs Funds II—GMS Europe Equity...
67
Goldman Sachs Funds II SICAV Annual Report Audited Financial Statements 11 12
Transcript of Goldman Sachs Funds II SICAV - FONDS professionell Goldman Sachs Funds II—GMS Europe Equity...
Goldman Sachs Funds IISICAVAnnual Report
Audited Financial Statements
1112
Directors and Other Information 1
Investment Advisor’s Report 2
Audit Report 4
Statement of Assets and Liabilities 6
Statement of Operations 7
Statement of Changes in Shareholders’ Equity 8
Statistical Information 9
Notes to the Financial Statements 10
Schedule of Investments 32
GOLDMAN SACHS FUNDS II—EQUITY PORTFOLIOS
Goldman Sachs Funds II—Global Manager Strategies Portfolios
Goldman Sachs Funds II—GMS Asia (ex-Japan) Equity Portfolio 32
Goldman Sachs Funds II—GMS Emerging Markets Equity Portfolio 35
Goldman Sachs Funds II—GMS Europe Equity Portfolio 38
Goldman Sachs Funds II—GMS Global Equity Portfolio 41
Goldman Sachs Funds II—GMS Japan Equity Portfolio 47
Goldman Sachs Funds II—GMS US Equity Portfolio 49
GOLDMAN SACHS FUNDS II—SPECIALIST PORTFOLIOS
Goldman Sachs Funds II—Dynamic Alternative Strategies Portfolio 52
GOLDMAN SACHS FUNDS II—DEDICATED PORTFOLIOS
Goldman Sachs Funds II—Tactical Tilt Portfolio 53
GOLDMAN SACHS FUNDS II—FIXED INCOME PORTFOLIOS
Goldman Sachs Funds II—Europe High Income Bond Portfolio 56
Appendix I—Advisory Fee Rates, Expense Caps and Total Net Expense Ratios 59
Appendix II—Portfolio and Share Class Launches, Closures and Mergers 60
Appendix III—Shareholder Concentration 61
Appendix IV—Disclosure of Transaction Costs 62
Appendix V—Calculation Method Used for Global Exposure 63
Additional Information 64
Goldman Sachs Funds II, SICAVTable of Contents
Page
________________________________________________________________________________________________________1 Independent Directors2 A related party to Goldman Sachs Funds II, SICAV.3 David Shubotham resigned as a member of the Board of Directors of Goldman Sachs Funds II, SICAV as of 14 September 2012 and has
not been replaced.4 Refer to Note 6 for non-affiliated Sub-Advisers.
1
Goldman Sachs Funds II, SICAVDirectors and Other Information
GOLDMAN SACHS FUNDS II, SICAVSociété d’Investissement à CapitalVariableAn undertaking for collective investmentorganised under the laws of the GrandDuchy of Luxembourg
Board of DirectorsFrank Ennis (Irish)1
Mark Heaney (UK/Irish)2
Eugene Regan (Irish)1
David Shubotham (Irish)1,3
Alan Shuch (US)2
Theodore Sotir (UK/US)2
Custodian, Domiciliary Agent,Administrator, Listing Agent andLuxembourg Paying AgentState Street Bank Luxembourg S.A.49, avenue J.F. KennedyL-1855 LuxembourgGrand Duchy of Luxembourg
DistributorGoldman Sachs International2
Peterborough Court133 Fleet StreetLondon EC4A 2BBUnited Kingdom
AuditorPricewaterhouseCoopers, Sociétécoopérative400, route d’EschL-1471 LuxembourgGrand Duchy of Luxembourg
Investment AdviserGoldman Sachs Asset ManagementInternational2
Peterborough Court133 Fleet StreetLondon, EC4A 2BBUnited Kingdom
Sub-Advisers4:Goldman Sachs Asset Management, L.P.2
200 West Street10282 New YorkUSA
Goldman Sachs (Singapore) Pte.2
50 Raffles Place#29-01 Shell TowerSingapore 048623
Goldman Sachs Asset Management Co., Ltd.2
Roppongi Hills Mori Tower10-1, Roppongi 6-chomeMinato-Ku, Tokyo 106-6144, Japan
Goldman Sachs Asset ManagementAustralia Pty Ltd.2
Level 17, 101 Collins StreetMelbourne VIC 3000, Australia
Goldman Sachs (Asia) L.L.C. – Hong Kong Branch2
68th Floor Cheung Kong Center,2 Queen’s RoadCentral, Hong Kong
Goldman Sachs Asset Management Brasil LTDA2
Av. Presidente Juscelino Kubitschek510 – 7 anderSao Paulo, SPBrazil 04543-000
Goldman Sachs International2
Peterborough Court133 Fleet StreetLondon EC4A 2BBUnited Kingdom
Goldman Sachs Hedge Fund Strategies LLC2
One New York Plaza10004 New YorkUSA
Legal Advisers to the Fund andthe Investment AdviserArendt & Medernach14, rue ErasmeL-2082 LuxembourgGrand Duchy of Luxembourg
Registered Officec/o State Street Bank Luxembourg S.A.49, avenue J.F. KennedyL-1855 LuxembourgR.C.S. Luxembourg B 133 806Grand Duchy of Luxembourg
Registrar and Transfer AgentRBC Investor Services Bank S.A.14, Rue Porte de FranceL-4360 Esch-sur AlzetteGrand Duchy of Luxembourg
Shareholder Services AgentEuropean Shareholder ServicesGoldman Sachs International2
Peterborough Court133 Fleet StreetLondon, EC4A 2BBUnited Kingdom
Paying and Information Agent in AustriaRaiffeisen Bank International AGAm Stadtpark 91030 Vienna, Austria
Paying and Information Agent inBelgiumRBC Investor ServicesPlace Rogier II1210 Brussels, Belgium
Paying and Information Agent in FranceRBC Investor Services Bank France S.A.105, rue Réaumur75002 Paris, France
Paying and Information Agent inGermanyState Street Bank GmbHBrienner Strasse 5980333 Munich, Germany
Paying Agent in ItalySociété Générale Securities Services S.p.A.Maciachini Center MAC 2Via Benigno Crespi, 19/A20159 Milan, Italy
Paying Agent in SwedenGlobal Transaction ServicesSEB Merchant BankingSergels Torg 2SE-10640 Stockholm, Sweden
Paying Agent in SwitzerlandGoldman Sachs Bank AG2
Münsterhof 48001 Zurich, Switzerland
Representative in SwitzerlandFirst Independent Fund Services AGKlausstrasse 338008 Zurich, Switzerland
The Fund’s Prospectus with itsSupplements, Key Investor InformationDocuments, Articles of Incorporation,Annual Report, Semi-Annual Report and thelist of all transactions carried out by theInvestment Adviser during the year areavailable free of charge at the offices of thelocal Paying and Information Agents and theSwiss Representative.
2
Goldman Sachs Funds II, SICAVInvestment Advisor’s Report
Dear Shareholders:
Enclosed is the report for the year ended 30 November 2012.
A. Market ReviewGlobal economic growth was mixed during the 12 months ended 30 November 2012. After a strong start tothe fiscal year, the U.S. economy decelerated in the first and second quarters of 2012, before appearing togain some traction in the third quarter of the year. Looking back, gross domestic product (“GDP”) growth inthe U.S. was 4.1% during the fourth quarter of 2011. The U.S. Commerce Department then reported that firstand second quarter 2012 GDP growth was 2.0% and 1.3%, respectively, and then moved to 3.1% in the thirdquarter. Growth in many other developed countries was less robust and, in some cases, fell back intorecession. In October, the International Monetary Fund (“IMF”) stated that “risks for a serious global slowdownare alarmingly high.” Against this backdrop, the IMF projected that global growth would moderate from 3.8%in 2011 to 3.3% in 2012. From a regional perspective, the IMF anticipates 2012 growth in the Eurozone willcontract 0.4%. While growth in emerging market countries is expected to remain higher than in theirdeveloped country counterparts, the IMF projects that emerging market growth will fall from 6.2% in 2011 to5.3% in 2012.
Despite a host of macro issues that negatively impacted investor sentiment at times, the global equity marketsproduced strong results during the reporting period. The U.S. stock market (as measured by the S&P 500Index) rose during 9 of the 12 months covered by this report. Supporting U.S. equities was generally solidcorporate profits and overall solid demand. All told, the U.S. stock market gained 15.36% during the 12months ended 30 November 2012. International developed equities also generated impressive results,especially in light of the ongoing European sovereign debt crisis and signs of slowing global growth. Duringthe period, the MSCI EAFE Index returned 12.61%. Emerging market equities produced less robust returnsgiven concerns over China's ability to orchestrate a soft landing for its economy. Nevertheless, the MSCIEmerging Markets Index returned 11.35% during the reporting period.
Past performance is not indicative of future results, which may vary.
3
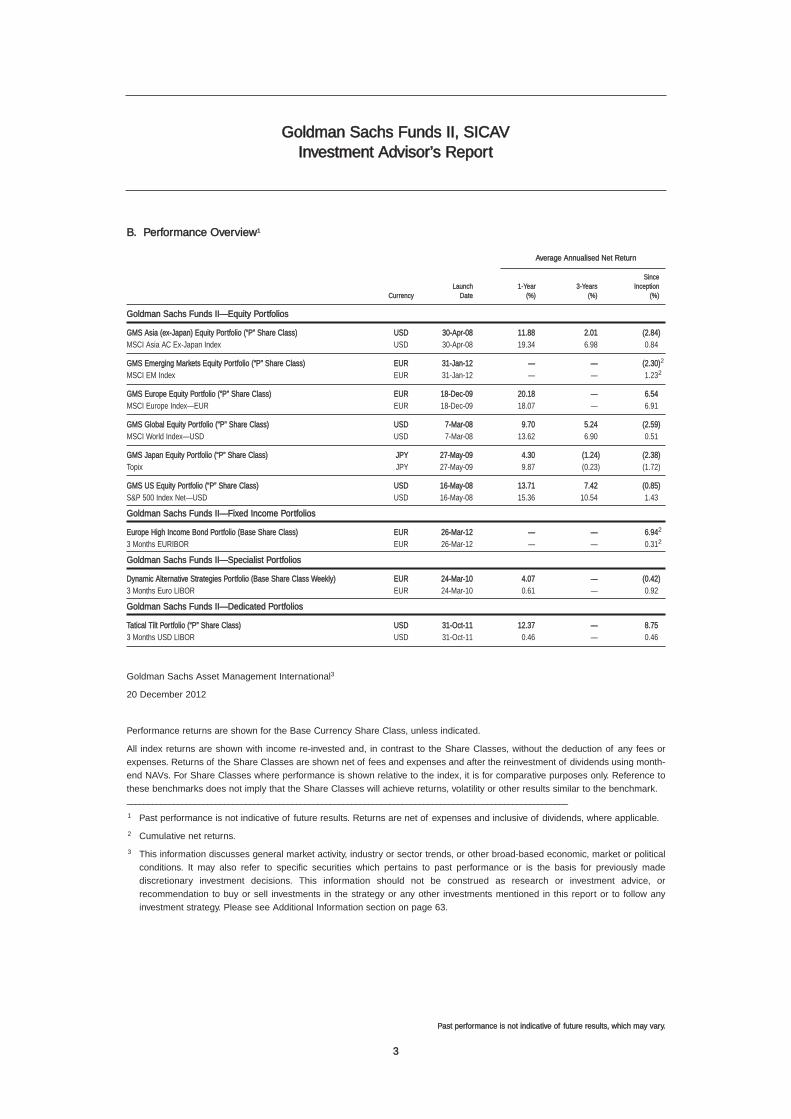
B. Performance Overview1
Average Annualised Net Return
SinceLaunch 1-Year 3-Years Inception
Currency Date (%) (%) (%)
Goldman Sachs Funds II—Equity Portfolios
GMS Asia (ex-Japan) Equity Portfolio (“P” Share Class) USD 30-Apr-08 11.88 2.01 (2.84)MSCI Asia AC Ex-Japan Index USD 30-Apr-08 19.34 6.98 0.84
GMS Emerging Markets Equity Portfolio (“P” Share Class) EUR 31-Jan-12 — — (2.30)2
MSCI EM Index EUR 31-Jan-12 — — 1.232
GMS Europe Equity Portfolio (“P” Share Class) EUR 18-Dec-09 20.18 — 6.54MSCI Europe Index—EUR EUR 18-Dec-09 18.07 — 6.91
GMS Global Equity Portfolio (“P” Share Class) USD 7-Mar-08 9.70 5.24 (2.59)MSCI World Index—USD USD 7-Mar-08 13.62 6.90 0.51
GMS Japan Equity Portfolio (“P” Share Class) JPY 27-May-09 4.30 (1.24) (2.38)Topix JPY 27-May-09 9.87 (0.23) (1.72)
GMS US Equity Portfolio (“P” Share Class) USD 16-May-08 13.71 7.42 (0.85)S&P 500 Index Net—USD USD 16-May-08 15.36 10.54 1.43
Goldman Sachs Funds II—Fixed Income Portfolios
Europe High Income Bond Portfolio (Base Share Class) EUR 26-Mar-12 — — 6.942
3 Months EURIBOR EUR 26-Mar-12 — — 0.312
Goldman Sachs Funds II—Specialist Portfolios
Dynamic Alternative Strategies Portfolio (Base Share Class Weekly) EUR 24-Mar-10 4.07 — (0.42)3 Months Euro LIBOR EUR 24-Mar-10 0.61 — 0.92
Goldman Sachs Funds II—Dedicated Portfolios
Tatical Tilt Portfolio (“P” Share Class) USD 31-Oct-11 12.37 — 8.753 Months USD LIBOR USD 31-Oct-11 0.46 — 0.46
Goldman Sachs Asset Management International3
20 December 2012
Performance returns are shown for the Base Currency Share Class, unless indicated.
All index returns are shown with income re-invested and, in contrast to the Share Classes, without the deduction of any fees or
expenses. Returns of the Share Classes are shown net of fees and expenses and after the reinvestment of dividends using month-
end NAVs. For Share Classes where performance is shown relative to the index, it is for comparative purposes only. Reference to
these benchmarks does not imply that the Share Classes will achieve returns, volatility or other results similar to the benchmark.________________________________________________________________________________________________________
1 Past performance is not indicative of future results. Returns are net of expenses and inclusive of dividends, where applicable.
2 Cumulative net returns.
3 This information discusses general market activity, industry or sector trends, or other broad-based economic, market or political
conditions. It may also refer to specific securities which pertains to past performance or is the basis for previously made
discretionary investment decisions. This information should not be construed as research or investment advice, or
recommendation to buy or sell investments in the strategy or any other investments mentioned in this report or to follow any
investment strategy. Please see Additional Information section on page 63.
Goldman Sachs Funds II, SICAVInvestment Advisor’s Report
Past performance is not indicative of future results, which may vary.
PricewaterhouseCoopers, Société coopérative, 400 Route d’Esch, B.P. 1443, L-1014 Luxembourg T: +352 494848 1, F: +352 494848 2900, www.pwc.lu
Cabinet de révision agréé. Expert-comptable (autorisation gouvernementale n°10028256) R.C.S. Luxembourg B 65 477 - TVA LU25482518
Audit report To the Shareholders of Goldman Sachs Funds II
We have audited the accompanying financial statements of Goldman Sachs Funds II (the “SICAV”) and of each of its sub-funds, which comprise the Statement of Assets and Liabilities and the Schedule of Investments as of 30 November 2012 and the Statement of Operations and the Statement of Changes in Shareholders’ Equity for the year then ended and a summary of significant accounting policies and other explanatory notes to the financial statements. Responsibility of the Board of Directors of the SICAV for the financial statements The Board of Directors of the SICAV is responsible for the preparation and fair presentation of these financial statements in accordance with Luxembourg legal and regulatory requirements relating to the preparation of the financial statements and for such internal control as the Board of Directors of the SICAV determines is necessary to enable the preparation of financial statements that are free from material misstatement, whether due to fraud or error. Responsibility of the “Réviseur d’entreprises agréé” Our responsibility is to express an opinion on these financial statements based on our audit. We conducted our audit in accordance with International Standards on Auditing as adopted for Luxembourg by the “Commission de Surveillance du Secteur Financier”. Those standards require that we comply with ethical requirements and plan and perform the audit to obtain reasonable assurance about whether the financial statements are free from material misstatement. An audit involves performing procedures to obtain audit evidence about the amounts and disclosures in the financial statements. The procedures selected depend on the judgment of the “Réviseur d’entreprises agréé”, including the assessment of the risks of material misstatement of the financial statements, whether due to fraud or error. In making those risk assessments, the “Réviseur d’entreprises agréé” considers internal control relevant to the entity’s preparation and fair presentation of the financial statements in order to design audit procedures that are appropriate in the circumstances, but not for the purpose of expressing an opinion on the effectiveness of the entity’s internal control. An audit also includes evaluating the appropriateness of accounting policies used and the reasonableness of accounting estimates made by the Board of Directors of the SICAV, as well as evaluating the overall presentation of the financial statements. We believe that the audit evidence we have obtained is sufficient and appropriate to provide a basis for our audit opinion.
nbersipont001
Text Box
4
Opinion In our opinion, the financial statements give a true and fair view of the financial position of Goldman Sachs Funds II and of each of its sub-funds as of 30 November 2012, and of the results of their
operations and changes in their net assets for the year then ended in accordance with Luxembourg legal and regulatory requirements relating to the preparation of the financial statements. Other matters
Supplementary information included in the annual report has been reviewed in the context of our mandate but has not been subject to specific audit procedures carried out in accordance with the standards described above. Consequently, we express no opinion on such information. However, we have no observation to make concerning such information in the context of the financial statements taken as a whole. Supplementary report under generally accepted auditing standards in the United States of America
In addition, we have performed an audit of the financial statements of Goldman Sachs Funds II and of each of its sub-funds in accordance with generally accepted auditing standards in the United States of America and we hereby report in accordance with such standards. In our opinion, the financial statements present fairly, in all material respects, the financial position of Goldman Sachs Funds II and of each of its sub-funds as of 30 November 2012, and of the results of their operations and changes in their net assets for the year then ended in conformity with Luxembourg legal and regulatory requirements relating to the preparation of the financial statements. PricewaterhouseCoopers, Société coopérative Luxembourg, 12 March 2013 Represented by
John Parkhouse
nbersipont001
Text Box
5
6
The accompanying notes are an integral part of these financial statements.
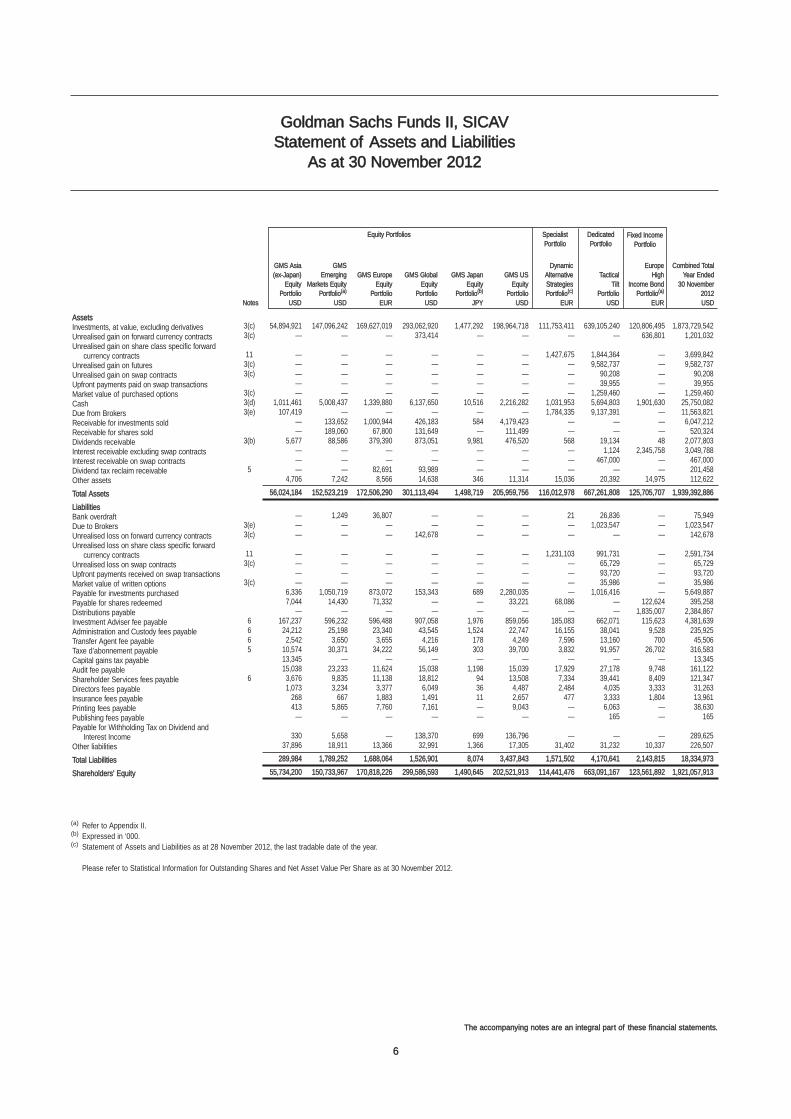
Goldman Sachs Funds II, SICAVStatement of Assets and Liabilities
As at 30 November 2012
AssetsInvestments, at value, excluding derivativesUnrealised gain on forward currency contractsUnrealised gain on share class specific forward
currency contractsUnrealised gain on futuresUnrealised gain on swap contractsUpfront payments paid on swap transactionsMarket value of purchased optionsCashDue from BrokersReceivable for investments soldReceivable for shares soldDividends receivableInterest receivable excluding swap contractsInterest receivable on swap contractsDividend tax reclaim receivableOther assets
Total Assets
LiabilitiesBank overdraftDue to BrokersUnrealised loss on forward currency contractsUnrealised loss on share class specific forward
currency contractsUnrealised loss on swap contractsUpfront payments received on swap transactionsMarket value of written optionsPayable for investments purchasedPayable for shares redeemedDistributions payableInvestment Adviser fee payableAdministration and Custody fees payableTransfer Agent fee payableTaxe d’abonnement payableCapital gains tax payableAudit fee payableShareholder Services fees payableDirectors fees payableInsurance fees payablePrinting fees payablePublishing fees payablePayable for Withholding Tax on Dividend and
Interest IncomeOther liabilities
Total Liabilities
Shareholders’ Equity
3(c) 54,894,921 147,096,242 169,627,019 293,062,920 1,477,292 198,964,718 111,753,411 639,105,240 120,806,495 1,873,729,5423(c) — — — 373,414 — — — — 636,801 1,201,032
11 — — — — — — 1,427,675 1,844,364 — 3,699,8423(c) — — — — — — — 9,582,737 — 9,582,7373(c) — — — — — — — 90,208 — 90,208
— — — — — — — 39,955 — 39,9553(c) — — — — — — — 1,259,460 — 1,259,4603(d) 1,011,461 5,008,437 1,339,880 6,137,650 10,516 2,216,282 1,031,953 5,694,803 1,901,630 25,750,0823(e) 107,419 — — — — — 1,784,335 9,137,391 — 11,563,821
— 133,652 1,000,944 426,183 584 4,179,423 — — — 6,047,212— 189,060 67,800 131,649 — 111,499 — — — 520,324
3(b) 5,677 88,586 379,390 873,051 9,981 476,520 568 19,134 48 2,077,803— — — — — — — 1,124 2,345,758 3,049,788— — — — — — — 467,000 — 467,000
5 — — 82,691 93,989 — — — — — 201,4584,706 7,242 8,566 14,638 346 11,314 15,036 20,392 14,975 112,622
56,024,184 152,523,219 172,506,290 301,113,494 1,498,719 205,959,756 116,012,978 667,261,808 125,705,707 1,939,392,886
— 1,249 36,807 — — — 21 26,836 — 75,9493(e) — — — — — — — 1,023,547 — 1,023,5473(c) — — — 142,678 — — — — — 142,678
11 — — — — — — 1,231,103 991,731 — 2,591,7343(c) — — — — — — — 65,729 — 65,729
— — — — — — — 93,720 — 93,7203(c) — — — — — — — 35,986 — 35,986
6,336 1,050,719 873,072 153,343 689 2,280,035 — 1,016,416 — 5,649,8877,044 14,430 71,332 — — 33,221 68,086 — 122,624 395,258
— — — — — — — — 1,835,007 2,384,8676 167,237 596,232 596,488 907,058 1,976 859,056 185,083 662,071 115,623 4,381,6396 24,212 25,198 23,340 43,545 1,524 22,747 16,155 38,041 9,528 235,9256 2,542 3,650 3,655 4,216 178 4,249 7,596 13,160 700 45,5065 10,574 30,371 34,222 56,149 303 39,700 3,832 91,957 26,702 316,583
13,345 — — — — — — — — 13,34515,038 23,233 11,624 15,038 1,198 15,039 17,929 27,178 9,748 161,122
6 3,676 9,835 11,138 18,812 94 13,508 7,334 39,441 8,409 121,3471,073 3,234 3,377 6,049 36 4,487 2,484 4,035 3,333 31,263
268 667 1,883 1,491 11 2,657 477 3,333 1,804 13,961413 5,865 7,760 7,161 — 9,043 — 6,063 — 38,630
— — — — — — — 165 — 165
330 5,658 — 138,370 699 136,796 — — — 289,62537,896 18,911 13,366 32,991 1,366 17,305 31,402 31,232 10,337 226,507
289,984 1,789,252 1,688,064 1,526,901 8,074 3,437,843 1,571,502 4,170,641 2,143,815 18,334,973
55,734,200 150,733,967 170,818,226 299,586,593 1,490,645 202,521,913 114,441,476 663,091,167 123,561,892 1,921,057,913
(a) Refer to Appendix II.(b) Expressed in ‘000.(c) Statement of Assets and Liabilities as at 28 November 2012, the last tradable date of the year.
Please refer to Statistical Information for Outstanding Shares and Net Asset Value Per Share as at 30 November 2012.
GMS Asia GMS Dynamic Europe Combined Total(ex-Japan) Emerging GMS Europe GMS Global GMS Japan GMS US Alternative Tactical High Year Ended
Equity Markets Equity Equity Equity Equity Equity Strategies Tilt Income Bond 30 NovemberPortfolio Portfolio(a) Portfolio Portfolio Portfolio(b) Portfolio Portfolio(c) Portfolio Portfolio(a) 2012
Notes USD USD EUR USD JPY USD EUR USD EUR USD
Equity Portfolios SpecialistPortfolio
DedicatedPortfolio
Fixed IncomePortfolio
The accompanying notes are an integral part of these financial statements.
7
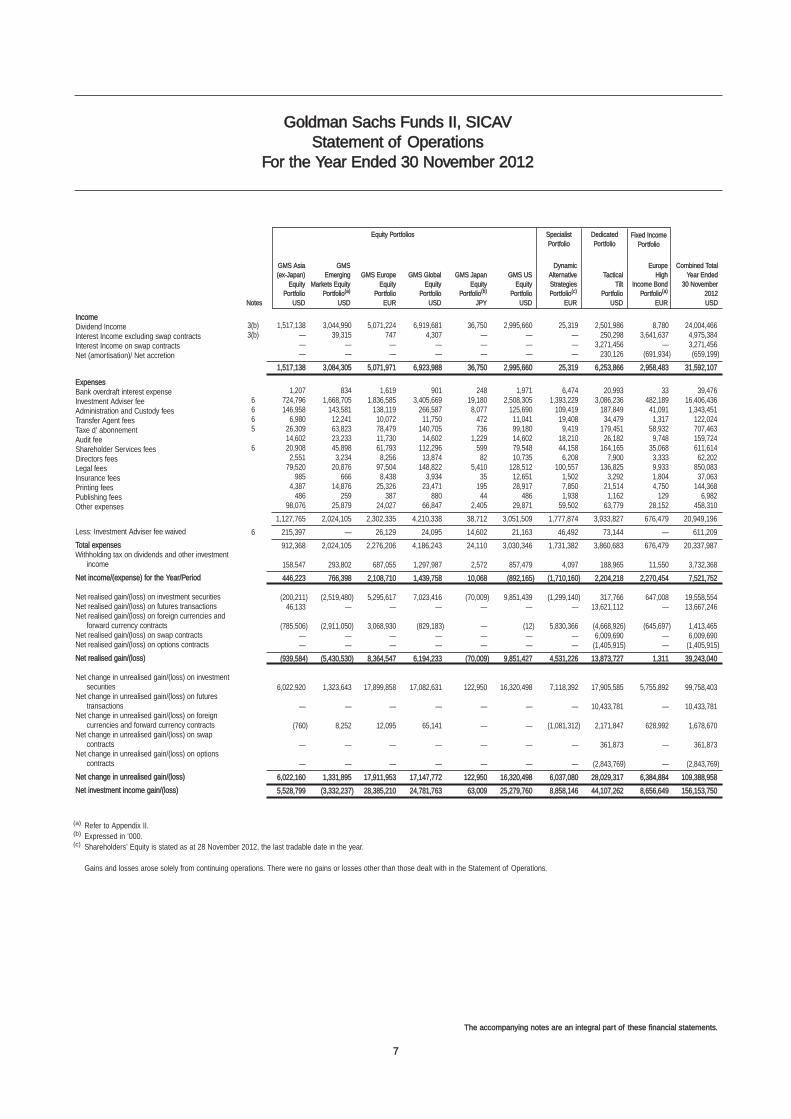
Goldman Sachs Funds II, SICAVStatement of Operations
For the Year Ended 30 November 2012
IncomeDividend IncomeInterest Income excluding swap contractsInterest Income on swap contractsNet (amortisation)/ Net accretion
ExpensesBank overdraft interest expenseInvestment Adviser feeAdministration and Custody feesTransfer Agent feesTaxe d’ abonnementAudit feeShareholder Services feesDirectors feesLegal feesInsurance feesPrinting feesPublishing feesOther expenses
Less: Investment Adviser fee waived
Total expensesWithholding tax on dividends and other investment
income
Net income/(expense) for the Year/Period
Net realised gain/(loss) on investment securitiesNet realised gain/(loss) on futures transactionsNet realised gain/(loss) on foreign currencies and
forward currency contractsNet realised gain/(loss) on swap contractsNet realised gain/(loss) on options contracts
Net realised gain/(loss)
Net change in unrealised gain/(loss) on investmentsecurities
Net change in unrealised gain/(loss) on futurestransactions
Net change in unrealised gain/(loss) on foreigncurrencies and forward currency contracts
Net change in unrealised gain/(loss) on swapcontracts
Net change in unrealised gain/(loss) on optionscontracts
Net change in unrealised gain/(loss)
Net investment income gain/(loss)
3(b) 1,517,138 3,044,990 5,071,224 6,919,681 36,750 2,995,660 25,319 2,501,986 8,780 24,004,4663(b) — 39,315 747 4,307 — — — 250,298 3,641,637 4,975,384
— — — — — — — 3,271,456 — 3,271,456— — — — — — — 230,126 (691,934) (659,199)
1,517,138 3,084,305 5,071,971 6,923,988 36,750 2,995,660 25,319 6,253,866 2,958,483 31,592,107
1,207 834 1,619 901 248 1,971 6,474 20,993 33 39,4766 724,796 1,668,705 1,836,585 3,405,669 19,180 2,508,305 1,393,229 3,086,236 482,189 16,406,4366 146,958 143,581 138,119 266,587 8,077 125,690 109,419 187,849 41,091 1,343,4516 6,980 12,241 10,072 11,750 472 11,041 19,408 34,479 1,317 122,0245 26,309 63,823 78,479 140,705 736 99,180 9,419 179,451 58,932 707,463
14,602 23,233 11,730 14,602 1,229 14,602 18,210 26,182 9,748 159,7246 20,908 45,898 61,793 112,296 599 79,548 44,158 164,165 35,068 611,614
2,551 3,234 8,256 13,874 82 10,735 6,208 7,900 3,333 62,20279,520 20,876 97,504 148,822 5,410 128,512 100,557 136,825 9,933 850,083
985 666 8,438 3,934 35 12,651 1,502 3,292 1,804 37,0634,387 14,876 25,326 23,471 195 28,917 7,850 21,514 4,750 144,368
486 259 387 880 44 486 1,938 1,162 129 6,98298,076 25,879 24,027 66,847 2,405 29,871 59,502 63,779 28,152 458,310
1,127,765 2,024,105 2,302,335 4,210,338 38,712 3,051,509 1,777,874 3,933,827 676,479 20,949,196
6 215,397 — 26,129 24,095 14,602 21,163 46,492 73,144 — 611,209
912,368 2,024,105 2,276,206 4,186,243 24,110 3,030,346 1,731,382 3,860,683 676,479 20,337,987
158,547 293,802 687,055 1,297,987 2,572 857,479 4,097 188,965 11,550 3,732,368
446,223 766,398 2,108,710 1,439,758 10,068 (892,165) (1,710,160) 2,204,218 2,270,454 7,521,752
(200,211) (2,519,480) 5,295,617 7,023,416 (70,009) 9,851,439 (1,299,140) 317,766 647,008 19,558,55446,133 — — — — — — 13,621,112 — 13,667,246
(785,506) (2,911,050) 3,068,930 (829,183) — (12) 5,830,366 (4,668,926) (645,697) 1,413,465— — — — — — — 6,009,690 — 6,009,690— — — — — — — (1,405,915) — (1,405,915)
(939,584) (5,430,530) 8,364,547 6,194,233 (70,009) 9,851,427 4,531,226 13,873,727 1,311 39,243,040
6,022,920 1,323,643 17,899,858 17,082,631 122,950 16,320,498 7,118,392 17,905,585 5,755,892 99,758,403
— — — — — — — 10,433,781 — 10,433,781
(760) 8,252 12,095 65,141 — — (1,081,312) 2,171,847 628,992 1,678,670
— — — — — — — 361,873 — 361,873
— — — — — — — (2,843,769) — (2,843,769)
6,022,160 1,331,895 17,911,953 17,147,772 122,950 16,320,498 6,037,080 28,029,317 6,384,884 109,388,958
5,528,799 (3,332,237) 28,385,210 24,781,763 63,009 25,279,760 8,858,146 44,107,262 8,656,649 156,153,750
(a) Refer to Appendix II.(b) Expressed in ‘000.(c) Shareholders’ Equity is stated as at 28 November 2012, the last tradable date in the year.
Gains and losses arose solely from continuing operations. There were no gains or losses other than those dealt with in the Statement of Operations.
GMS Asia GMS Dynamic Europe Combined Total(ex-Japan) Emerging GMS Europe GMS Global GMS Japan GMS US Alternative Tactical High Year Ended
Equity Markets Equity Equity Equity Equity Equity Strategies Tilt Income Bond 30 NovemberPortfolio Portfolio(a) Portfolio Portfolio Portfolio(b) Portfolio Portfolio(c) Portfolio Portfolio(a) 2012
Notes USD USD EUR USD JPY USD EUR USD EUR USD
Equity Portfolios SpecialistPortfolio
DedicatedPortfolio
Fixed IncomePortfolio
8
The accompanying notes are an integral part of these financial statements.
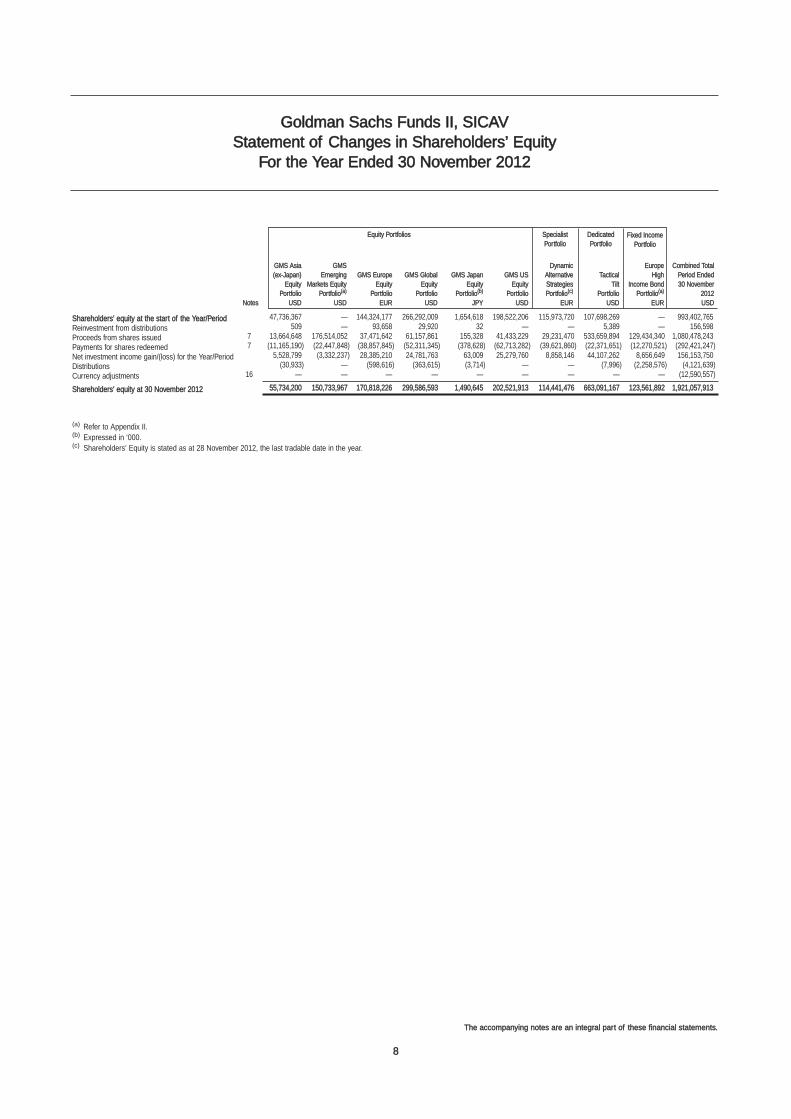
Goldman Sachs Funds II, SICAVStatement of Changes in Shareholders’ Equity
For the Year Ended 30 November 2012
Shareholders’ equity at the start of the Year/PeriodReinvestment from distributionsProceeds from shares issuedPayments for shares redeemedNet investment income gain/(loss) for the Year/PeriodDistributionsCurrency adjustments
Shareholders’ equity at 30 November 2012
(a) Refer to Appendix II.(b) Expressed in ‘000.(c) Shareholders’ Equity is stated as at 28 November 2012, the last tradable date in the year.
47,736,367 — 144,324,177 266,292,009 1,654,618 198,522,206 115,973,720 107,698,269 — 993,402,765509 — 93,658 29,920 32 — — 5,389 — 156,598
7 13,664,648 176,514,052 37,471,642 61,157,861 155,328 41,433,229 29,231,470 533,659,894 129,434,340 1,080,478,2437 (11,165,190) (22,447,848) (38,857,845) (52,311,345) (378,628) (62,713,282) (39,621,860) (22,371,651) (12,270,521) (292,421,247)
5,528,799 (3,332,237) 28,385,210 24,781,763 63,009 25,279,760 8,858,146 44,107,262 8,656,649 156,153,750(30,933) — (598,616) (363,615) (3,714) — — (7,996) (2,258,576) (4,121,639)
16 — — — — — — — — — (12,590,557)
55,734,200 150,733,967 170,818,226 299,586,593 1,490,645 202,521,913 114,441,476 663,091,167 123,561,892 1,921,057,913
GMS Asia GMS Dynamic Europe Combined Total(ex-Japan) Emerging GMS Europe GMS Global GMS Japan GMS US Alternative Tactical High Period Ended
Equity Markets Equity Equity Equity Equity Equity Strategies Tilt Income Bond 30 NovemberPortfolio Portfolio(a) Portfolio Portfolio Portfolio(b) Portfolio Portfolio(c) Portfolio Portfolio(a) 2012
Notes USD USD EUR USD JPY USD EUR USD EUR USD
Equity Portfolios SpecialistPortfolio
DedicatedPortfolio
Fixed IncomePortfolio
9
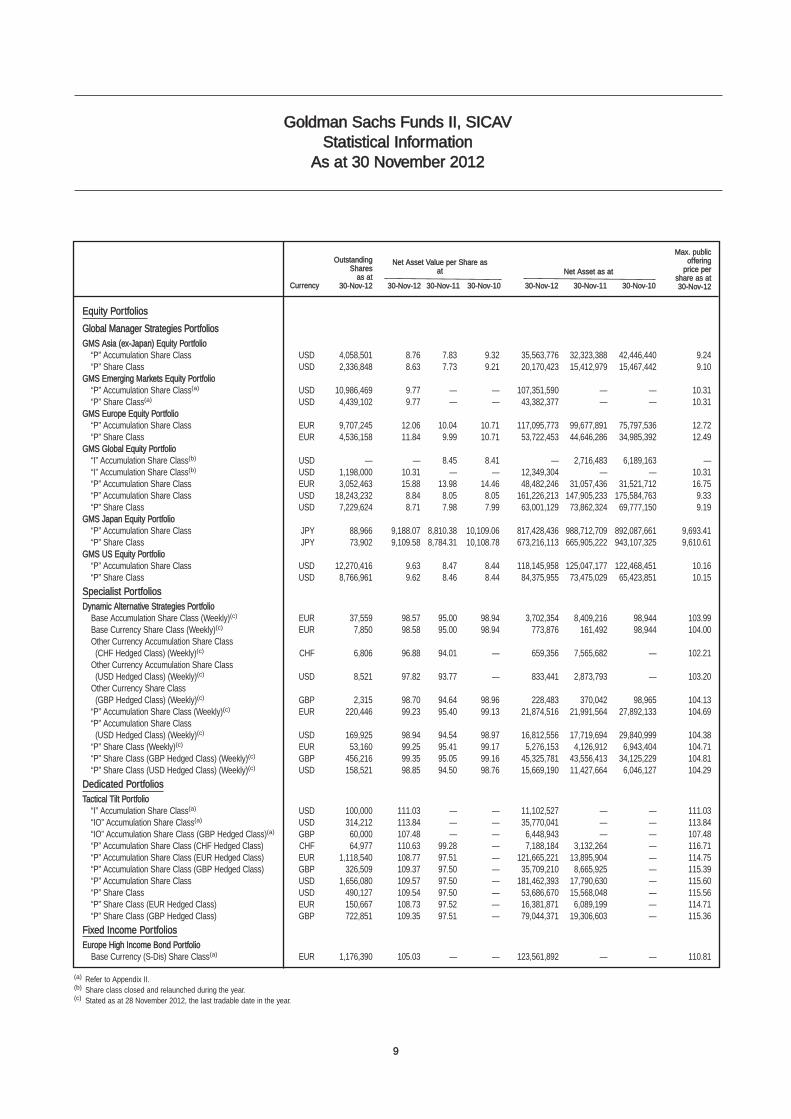
Goldman Sachs Funds II, SICAVStatistical Information
As at 30 November 2012
Equity Portfolios
Global Manager Strategies PortfoliosGMS Asia (ex-Japan) Equity Portfolio
“P” Accumulation Share Class USD 4,058,501 8.76 7.83 9.32 35,563,776 32,323,388 42,446,440 9.24“P” Share Class USD 2,336,848 8.63 7.73 9.21 20,170,423 15,412,979 15,467,442 9.10
GMS Emerging Markets Equity Portfolio“P” Accumulation Share Class(a) USD 10,986,469 9.77 — — 107,351,590 — — 10.31“P” Share Class(a) USD 4,439,102 9.77 — — 43,382,377 — — 10.31
GMS Europe Equity Portfolio“P” Accumulation Share Class EUR 9,707,245 12.06 10.04 10.71 117,095,773 99,677,891 75,797,536 12.72“P” Share Class EUR 4,536,158 11.84 9.99 10.71 53,722,453 44,646,286 34,985,392 12.49
GMS Global Equity Portfolio“I” Accumulation Share Class(b) USD — — 8.45 8.41 — 2,716,483 6,189,163 —“I” Accumulation Share Class(b) USD 1,198,000 10.31 — — 12,349,304 — — 10.31“P” Accumulation Share Class EUR 3,052,463 15.88 13.98 14.46 48,482,246 31,057,436 31,521,712 16.75“P” Accumulation Share Class USD 18,243,232 8.84 8.05 8.05 161,226,213 147,905,233 175,584,763 9.33“P” Share Class USD 7,229,624 8.71 7.98 7.99 63,001,129 73,862,324 69,777,150 9.19
GMS Japan Equity Portfolio“P” Accumulation Share Class JPY 88,966 9,188.07 8,810.38 10,109.06 817,428,436 988,712,709 892,087,661 9,693.41“P” Share Class JPY 73,902 9,109.58 8,784.31 10,108.78 673,216,113 665,905,222 943,107,325 9,610.61
GMS US Equity Portfolio“P” Accumulation Share Class USD 12,270,416 9.63 8.47 8.44 118,145,958 125,047,177 122,468,451 10.16“P” Share Class USD 8,766,961 9.62 8.46 8.44 84,375,955 73,475,029 65,423,851 10.15
Specialist PortfoliosDynamic Alternative Strategies Portfolio
Base Accumulation Share Class (Weekly)(c) EUR 37,559 98.57 95.00 98.94 3,702,354 8,409,216 98,944 103.99Base Currency Share Class (Weekly)(c) EUR 7,850 98.58 95.00 98.94 773,876 161,492 98,944 104.00Other Currency Accumulation Share Class
(CHF Hedged Class) (Weekly)(c) CHF 6,806 96.88 94.01 — 659,356 7,565,682 — 102.21Other Currency Accumulation Share Class
(USD Hedged Class) (Weekly)(c) USD 8,521 97.82 93.77 — 833,441 2,873,793 — 103.20Other Currency Share Class
(GBP Hedged Class) (Weekly)(c) GBP 2,315 98.70 94.64 98.96 228,483 370,042 98,965 104.13“P” Accumulation Share Class (Weekly)(c) EUR 220,446 99.23 95.40 99.13 21,874,516 21,991,564 27,892,133 104.69“P” Accumulation Share Class
(USD Hedged Class) (Weekly)(c) USD 169,925 98.94 94.54 98.97 16,812,556 17,719,694 29,840,999 104.38“P” Share Class (Weekly)(c) EUR 53,160 99.25 95.41 99.17 5,276,153 4,126,912 6,943,404 104.71“P” Share Class (GBP Hedged Class) (Weekly)(c) GBP 456,216 99.35 95.05 99.16 45,325,781 43,556,413 34,125,229 104.81“P” Share Class (USD Hedged Class) (Weekly)(c) USD 158,521 98.85 94.50 98.76 15,669,190 11,427,664 6,046,127 104.29
Dedicated PortfoliosTactical Tilt Portfolio
“I” Accumulation Share Class(a) USD 100,000 111.03 — — 11,102,527 — — 111.03“IO” Accumulation Share Class(a) USD 314,212 113.84 — — 35,770,041 — — 113.84“IO” Accumulation Share Class (GBP Hedged Class)(a) GBP 60,000 107.48 — — 6,448,943 — — 107.48“P” Accumulation Share Class (CHF Hedged Class) CHF 64,977 110.63 99.28 — 7,188,184 3,132,264 — 116.71“P” Accumulation Share Class (EUR Hedged Class) EUR 1,118,540 108.77 97.51 — 121,665,221 13,895,904 — 114.75“P” Accumulation Share Class (GBP Hedged Class) GBP 326,509 109.37 97.50 — 35,709,210 8,665,925 — 115.39“P” Accumulation Share Class USD 1,656,080 109.57 97.50 — 181,462,393 17,790,630 — 115.60“P” Share Class USD 490,127 109.54 97.50 — 53,686,670 15,568,048 — 115.56“P” Share Class (EUR Hedged Class) EUR 150,667 108.73 97.52 — 16,381,871 6,089,199 — 114.71“P” Share Class (GBP Hedged Class) GBP 722,851 109.35 97.51 — 79,044,371 19,306,603 — 115.36
Fixed Income PortfoliosEurope High Income Bond Portfolio
Base Currency (S-Dis) Share Class(a) EUR 1,176,390 105.03 — — 123,561,892 — — 110.81
(a) Refer to Appendix II.(b) Share class closed and relaunched during the year.(c) Stated as at 28 November 2012, the last tradable date in the year.
Currency
Outstanding Shares
as at 30-Nov-12 30-Nov-12 30-Nov-11 30-Nov-10
Net Asset Value per Share asat Net Asset as at
Max. publicoffering
price per share as at30-Nov-1230-Nov-11 30-Nov-1230-Nov-10
10
1 Organisa t ion
Goldman Sachs Funds II (“the Fund”) was incorporated on 20 November 2007 under the laws of the GrandDuchy of Luxembourg as a “Société d’Investissement à Capital Variable” (“SICAV”), for an unlimited period oftime. The Fund is registered and qualifies as a self-managed company in accordance with the Law of 17December 2010. As at 30 November 2012, the Fund is comprised of nine different portfolios (“the Portfolios”).
As at 30 November 2012, the Fund offered shares in the Portfolios as detailed in Appendix I.
Please refer to Appendix II for Portfolios and Share Classes that were launched during the year.
2 Investment Object ive
The primary investment objective of each Equity Portfolio is long-term capital appreciation derived from investingin any Permitted Investments.
The investment objective for the Specialist Portfolio is customised for each Specialist Portfolio: DynamicAlternative Strategies Portfolio seeks to achieve attractive long-term risk-adjusted returns primarily throughallocating assets to a broad range of alternative investment strategies which may include one or more of thefollowing four sectors either directly or through investments in Permitted Funds: tactical trading, equity long/short, relative value, event driven.
The primary investment objective of each Dedicated Portfolio is to seek to achieve long-term capital appreciationfrom a portfolio of Permitted Investments including Transferable Securities, financial derivative instruments andPermitted Funds.
The primary objective of the Fixed Income Portfolio is a high level of total return consisting of income and capitalappreciation through investment in Permitted Investments.
3 Signi f icant Account ing Pol ic ies
(a) Basis o f Prepara t ion of F inancia l Sta tements
The financial statements of the individual Portfolios are presented in their base currency while the CombinedTotal of all the Portfolios are presented in United States Dollars. The financial statements have been preparedin accordance with the Luxembourg law on Undertakings for Collective Investment. The preparation of financialstatements requires the Board to make estimates and assumptions that may affect the amounts reported in thefinancial statements and accompanying notes. Refer to Note 4 for instances where the Board was required tomake certain estimates and assumptions. Actual results may differ from those estimates.
(b) Investment Transact ions and Rela ted Investment Income
The Fund records its investment transactions on a trade date basis plus one accounting day. Realised gains andlosses are based on the weighted average cost method. Dividend income and dividend expense are recordedon the ex-dividend date and interest income and interest expense are accrued over the life of the investment.Interest income includes accretion of market discount, original issue discounts and amortisation of premiumsand is recorded into income over the life of the underlying investment. Interest income and dividend income arerecognised on a gross basis before withholding tax, if any.
Operating expenses are recognised on an accrual basis.
Transaction costs, when incurred, are recognised in the Statement of Operations.
Goldman Sachs Funds II, SICAVNotes to the Financial Statements
For the Year Ended 30 November 2012
11
3 Signi f icant Account ing Pol ic ies (cont inued)
(c) F inancia l Investment in Secur i t ies and Valua t ion
i. Recognition and Derecognition
The Portfolios recognise financial assets and financial liabilities on the date they become a party to thecontractual provisions of the investment. Purchases and sales of financial assets and financial liabilities arerecognised using trade date plus one accounting. From trade date plus one, any gains and losses arising fromchanges in value of the financial assets or financial liabilities are recorded in the Statement of Operations.
Financial assets are derecognised when the rights to receive cash flows from the investments have expired orthe Portfolio has transferred substantially all risks and rewards of ownership.
ii. Value Measurement Principles
The value of all securities and derivatives is determined according to procedures developed by a personappointed by the Board of Directors (the “Competent Person”), including securities where there is either noquotation or a quotation that is believed by the Competent Person to be materially inaccurate.
Such a Competent Person may be the Investment Adviser itself, independent pricing agents or others, subjectto applicable law. The Competent Person during the year ended 30 November 2012 was Goldman SachsValuation Oversight Group (“VOG”).
Refer to note 4 for securities where the Competent Person was used to determine value.
(ii.1) Debt Securities
Debt securities, comprising Corporate Bonds and Non-Agencies Asset Backed Obligations are valued on thebasis of dealer supplied quotations or by using a third party pricing service selected by the Competent Person.When quoted market prices are not available, valuation techniques are used to estimate the value of the debtsecurity. Valuation methods include the use of recent market transactions, reference to the current fair value ofanother investment that is substantially the same, discounted cash flow analyses or any other techniques thatprovides a reliable estimate of prices obtained in actual market transactions.
(ii.2) Exchange Listed Assets and Liabilities
The value of exchange traded financial investments, including transferable securities admitted to an officialexchange listing or dealt in on any other regulated market that operates regularly which comprise CommonStocks and Preferred Stocks, is based upon quoted market prices at the period end date without any deductionfor estimated future transaction costs.
(ii.3) Certificates of Deposit and Money Market Investments
Certificates of Deposit, comprising Time Deposits, and Money Market Investments are valued at amortised cost,which approximates market value.
(ii.4) Shares in Collective Investment Schemes
The value of investments in open-ended investment funds, comprising Mutual Funds, is based upon the netasset value per share, in accordance with the valuation policy of the applicable fund as outlined in itsprospectus.
(ii.5) Derivatives
A derivative is an instrument whose value is derived from an underlying instrument, index reference rate or acombination of these factors. Derivative instruments may be privately negotiated contracts which are oftenreferred to as over the counter (“OTC”) derivatives or they may be listed and traded on an exchange. Derivativecontracts may involve future commitments to purchase or sell financial instruments or commodities at specifiedterms on a specified date, or to exchange interest payment streams or currencies based on a notional orcontractual amount.
Goldman Sachs Funds II, SICAVNotes to the Financial Statements
For the Year Ended 30 November 2012 (Continued)
12
3 Signi f icant Account ing Pol ic ies (cont inued)
(c) F inancia l Investment in Secur i t ies and Valua t ion (cont inued)
(ii.5) Derivatives (continued)
Derivative contracts are stated at market value and recognised as assets and liabilities in the Statement ofAssets and Liabilities. Gains and losses resulting from the change in the market value are reflected in theStatement of Operations as a component of change in unrealised gain/(loss). Realised gains or losses arerecorded on termination or from periodic cash flow payments.
(ii.5) (a) Option Contracts
The Portfolios enter into exchange traded and OTC option contracts with various counterparties. When thePortfolio purchases an option, an amount equal to value which is based on the premium paid is recorded as anasset, the value of which is marked-to-market daily. When the Portfolio writes an option, an amount equal tovalue which is based on the premium received by the Portfolio is recorded as a liability and is adjusted to themarket value of the option written on each valuation date.
When options are closed, the difference between the premium and the amount paid or received, net ofbrokerage commissions, or the full amount of the premium if the option expires worthless, is treated as realisedgain or loss. The exercise of an option written by the Portfolio could result in the Portfolio buying or selling afinancial instrument at a price different from the current market value. The market value of an OTC contract isdetermined by applying an option valuation model or by reference to the price quoted by the counterparty to therelevant option agreement. The market value of an exchange traded option is based on exchange settlementprices or independent market quotes provided by a pricing service or counterparty.
(ii.5) (b) Futures Contracts
Futures contracts are contracts to buy or sell a standardised quantity of a specified commodity and valuedbased on exchange settlement prices or independent market quotes. Initial margin deposits, in either cash orsecurities, are required to trade in the futures market. Unrealised gains or losses on futures contracts arerecognised to reflect the market value of the contracts and are included as a component of the unrealised gainsor losses on the Portfolio’s Statement of Operations. Variation margin is received or paid, depending on whetherunrealised gains or losses are incurred. When the contract is terminated, the Portfolio will recognise a realisedgain or loss equal to the difference between the value of the contract at the time it was entered into and the timeit was closed.
(ii.5) (c) Swap Contracts
Swaps, comprising Credit Default Swaps and Total Return Swaps, can be linked to any number of underlyinginvestments and indexes, and swap terms can vary greatly. Cash flows are exchanged based on the underlying.Upfront payments, which represent a risk premium, are amortised straight-line over the contract term. Swapagreements are carried at market value and the value of the swap agreement is based on a counterpartyprovided third party pricing service or valuation model. The model considers various inputs including the marketvalue of the underlying, the risks associated with the underlying and the specific terms of the contract.
(ii.5) (d) Forward Foreign Currency Contracts
In a forward foreign currency contract, the Portfolio agrees to receive or deliver a fixed quantity of one currencyfor another, at a pre-determined price at a future date. Purchases and sales of forward foreign currencycontracts having the same notional value, settlement date and counterparty and right to settle net are generallyoffset (which result in a net foreign currency position of zero with the counterparty) and any realised gains orlosses are recognised on trade date plus one.
Goldman Sachs Funds II, SICAVNotes to the Financial Statements
For the Year Ended 30 November 2012 (Continued)
13
3 Signi f icant Account ing Pol ic ies (cont inued)
(c) F inancia l Investment in Secur i t ies and Valua t ion (cont inued)
(ii.5) (d) Forward Foreign Currency Contracts (continued)
The value of forward foreign currency contracts is based on the price at which a new forward foreign currencycontract of the same notional value, currency and maturity could be effected at the close of business in theprincipal currency markets in which these currencies are traded.
(ii.6) All Securities and Derivatives
If a quoted market price is not available from a third party pricing service or a dealer, the market value of theinvestment is determined by using valuation techniques. Such securities shall be valued at their probablerealisation value as determined by the Competent Person.
The investments have been valued in accordance with generally accepted accounting principles that require theuse of certain estimates and assumptions. Although these estimates and assumptions are based on the bestavailable information, actual results could be materially different from these estimates.
(d) Cash
Cash is valued at cost, which approximates market value.
(e) Due f rom/Due to Brokers
Due from brokers consists primarily of cash receivable from the Fund’s clearing brokers and variouscounterparties. Due to brokers consists primarily of cash payable to the Fund’s clearing brokers and variouscounterparties.
( f ) Fore ign Cur rency Trans la t ion
The books and records of all Portfolios are maintained in their base currency. Please refer to Appendix I for thebase currency of each Portfolio. Transactions in foreign currencies are translated at the foreign currencyexchange rate in effect at the date of the transaction. Assets and liabilities denominated in foreign currenciesare translated into the base currency at the foreign currency closing exchange rate in effect at the year-end date.Foreign currency exchange differences arising on translation and realised gains and losses on disposals orsettlements of assets and liabilities are recognised in the Statement of Operations. Foreign currency exchangegains or losses relating to investments, derivative financial investments, and all other foreign currency exchangegains or losses relating to monetary items, including cash and cash equivalents, are reflected in the net realisedgain/(loss) or net change in unrealised gain/(loss) in the Statement of Operations.
(g) Expenses
Expenses incurred by the Fund that do not specifically relate to an individual Portfolio or Share Class of aPortfolio are charged to the Portfolios based on an allocation basis depending upon the nature of the charges.Expenses directly attributable to a Portfolio or Share Class are charged to that Portfolio or Share Class.
Goldman Sachs Funds II, SICAVNotes to the Financial Statements
For the Year Ended 30 November 2012 (Continued)
14
Goldman Sachs Funds II, SICAVNotes to the Financial Statements
For the Year Ended 30 November 2012 (Continued)
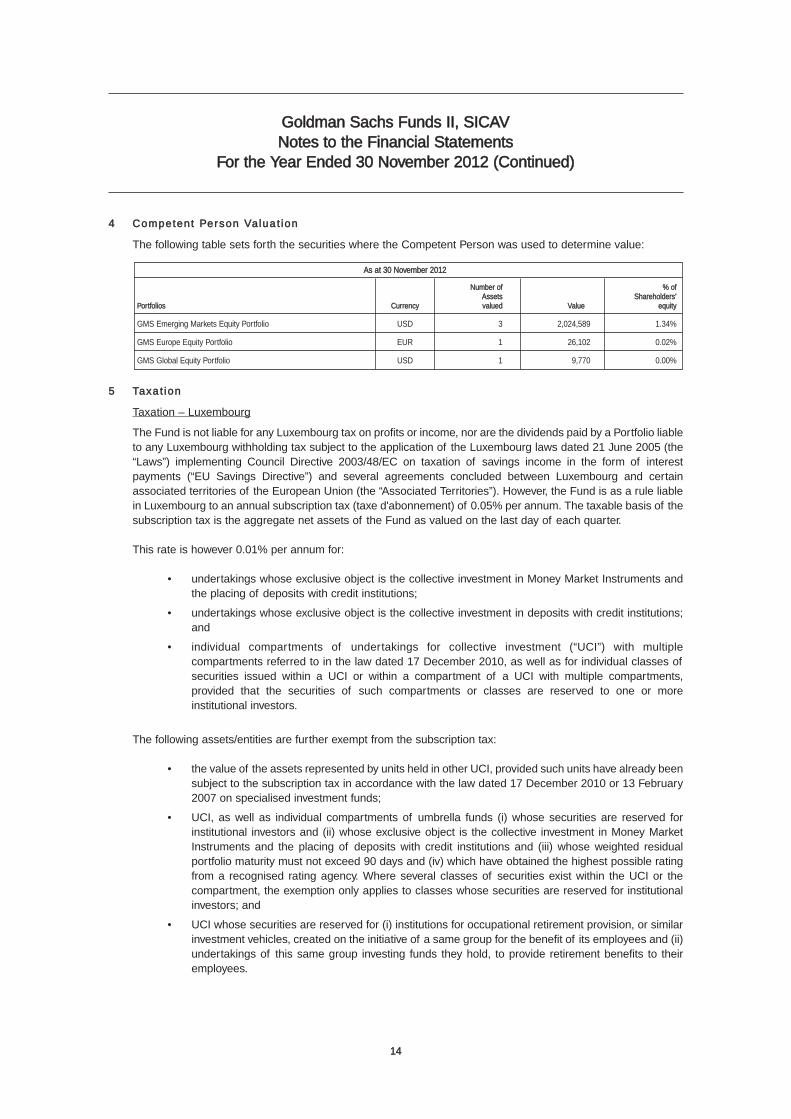
4 Competent Person Valua t ion
The following table sets forth the securities where the Competent Person was used to determine value:
5 Taxa t ion
Taxation – Luxembourg
The Fund is not liable for any Luxembourg tax on profits or income, nor are the dividends paid by a Portfolio liableto any Luxembourg withholding tax subject to the application of the Luxembourg laws dated 21 June 2005 (the“Laws”) implementing Council Directive 2003/48/EC on taxation of savings income in the form of interestpayments (“EU Savings Directive”) and several agreements concluded between Luxembourg and certainassociated territories of the European Union (the “Associated Territories”). However, the Fund is as a rule liablein Luxembourg to an annual subscription tax (taxe d'abonnement) of 0.05% per annum. The taxable basis of thesubscription tax is the aggregate net assets of the Fund as valued on the last day of each quarter.
This rate is however 0.01% per annum for:
• undertakings whose exclusive object is the collective investment in Money Market Instruments andthe placing of deposits with credit institutions;
• undertakings whose exclusive object is the collective investment in deposits with credit institutions;and
• individual compartments of undertakings for collective investment (“UCI”) with multiplecompartments referred to in the law dated 17 December 2010, as well as for individual classes ofsecurities issued within a UCI or within a compartment of a UCI with multiple compartments,provided that the securities of such compartments or classes are reserved to one or moreinstitutional investors.
The following assets/entities are further exempt from the subscription tax:
• the value of the assets represented by units held in other UCI, provided such units have already beensubject to the subscription tax in accordance with the law dated 17 December 2010 or 13 February2007 on specialised investment funds;
• UCI, as well as individual compartments of umbrella funds (i) whose securities are reserved forinstitutional investors and (ii) whose exclusive object is the collective investment in Money MarketInstruments and the placing of deposits with credit institutions and (iii) whose weighted residualportfolio maturity must not exceed 90 days and (iv) which have obtained the highest possible ratingfrom a recognised rating agency. Where several classes of securities exist within the UCI or thecompartment, the exemption only applies to classes whose securities are reserved for institutionalinvestors; and
• UCI whose securities are reserved for (i) institutions for occupational retirement provision, or similarinvestment vehicles, created on the initiative of a same group for the benefit of its employees and (ii)undertakings of this same group investing funds they hold, to provide retirement benefits to theiremployees.
As at 30 November 2012
Number of % ofAssets Shareholders’
Portfolios Currency valued Value equity
GMS Emerging Markets Equity Portfolio USD 3 2,024,589 1.34%
GMS Europe Equity Portfolio EUR 1 26,102 0.02%
GMS Global Equity Portfolio USD 1 9,770 0.00%
15
Goldman Sachs Funds II, SICAVNotes to the Financial Statements
For the Year Ended 30 November 2012 (Continued)
5 Taxa t ion (cont inued)
Taxation – UK
The Fund made an application to the HM Revenue & Customs (“HMRC”) in the United Kingdom in respect ofdistributing share classes and a number of other share classes as reporting share classes with effect fromperiods beginning on or after 1 December 2010. In addition, an application for reporting share class status wasmade and accepted for the period ended 30 November 2010 in respect of distributing share classes for DynamicAlternative Strategies Portfolio only. Reporting share classes are not required to make distributions, but arerequired to provide HMRC with full details of reportable income each year and publish those figures to thoseinvestors. Income will be reported to investors within six months of the year end. Investors will be able to accessthe reportable income figure at www.gs.com/gsam.
Taxation – Belgium
The Fund may incur a liability to subscription tax at the rate of 0.08% in respect of subscriptions made throughintermediaries situated in Belgium to the extent that net shares are outstanding as of 31 December of theprevious year.
Taxation – General
Each Portfolio may be subject to taxation on capital gains, interest and dividends in certain jurisdictions in whicheach Portfolio invests. It is the policy of each Portfolio to accrue for any such taxes on dividends and interestwhen the dividend is declared or interest is earned. At each valuation date, taxation on realised and unrealisedappreciation of securities may be accrued for at statutory rates.
Prospective investors should consult their own taxation advisers regarding the tax implications of investing in thefund in relation to their own individual circumstances as they may differ from the general statements that appearabove.
6 Signi f icant Agreements
Investment Adviser and Sub-Investment Adviser
Goldman Sachs Asset Management International (“GSAMI”), an affiliate of Goldman, Sachs & Co. (“GoldmanSachs”), acts as each Portfolio’s investment adviser pursuant to an Investment Advisory Agreement dated20 November 2007. Under the Investment Advisory Agreement, GSAMI, subject to the general supervision ofthe Fund’s Board of Directors, manages the Fund’s Portfolios.
GSAMI may rely upon Goldman Sachs Asset Management L.P., the U.S. sub-adviser, in connection with theselection of securities of U.S. issuers and issuers in many emerging market countries; upon the assetmanagement division of Goldman Sachs (Singapore) PTE and Goldman Sachs (Asia) LLC. - Hong KongBranch, the Asian sub-advisers, in connection with the selection of securities of Asian issuers; upon GoldmanSachs Asset Management Co., Ltd, the Japanese sub-adviser, in connection with the selection of securities ofJapanese issuers; upon Goldman Sachs Asset Management Australia Pty Ltd., in connection with the selectionof securities of Australasian issuers; upon Goldman Sachs Asset Management Brasil LTDA, in connection withthe selection of securities of South American issuers; and upon Goldman Sachs Hedge Fund Strategies LLC,in connection with selection of investments in Dynamic Alternative Strategies Portfolio. All these entities areaffiliates of Goldman Sachs.
16
Goldman Sachs Funds II, SICAVNotes to the Financial Statements
For the Year Ended 30 November 2012 (Continued)
6 Signi f icant Agreements (cont inued)
Investment Adviser and Sub-Investment Adviser (continued)
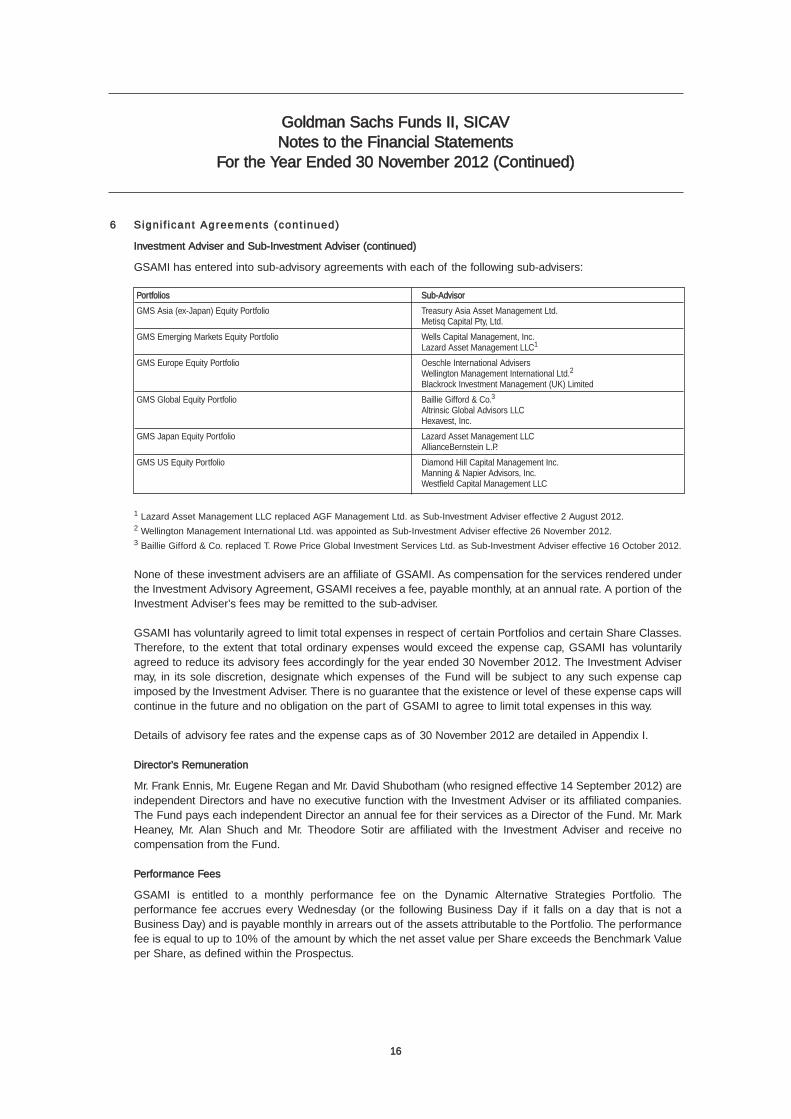
GSAMI has entered into sub-advisory agreements with each of the following sub-advisers:
1 Lazard Asset Management LLC replaced AGF Management Ltd. as Sub-Investment Adviser effective 2 August 2012.2 Wellington Management International Ltd. was appointed as Sub-Investment Adviser effective 26 November 2012.3 Baillie Gifford & Co. replaced T. Rowe Price Global Investment Services Ltd. as Sub-Investment Adviser effective 16 October 2012.
None of these investment advisers are an affiliate of GSAMI. As compensation for the services rendered underthe Investment Advisory Agreement, GSAMI receives a fee, payable monthly, at an annual rate. A portion of theInvestment Adviser’s fees may be remitted to the sub-adviser.
GSAMI has voluntarily agreed to limit total expenses in respect of certain Portfolios and certain Share Classes.Therefore, to the extent that total ordinary expenses would exceed the expense cap, GSAMI has voluntarilyagreed to reduce its advisory fees accordingly for the year ended 30 November 2012. The Investment Advisermay, in its sole discretion, designate which expenses of the Fund will be subject to any such expense capimposed by the Investment Adviser. There is no guarantee that the existence or level of these expense caps willcontinue in the future and no obligation on the part of GSAMI to agree to limit total expenses in this way.
Details of advisory fee rates and the expense caps as of 30 November 2012 are detailed in Appendix I.
Director’s Remuneration
Mr. Frank Ennis, Mr. Eugene Regan and Mr. David Shubotham (who resigned effective 14 September 2012) areindependent Directors and have no executive function with the Investment Adviser or its affiliated companies.The Fund pays each independent Director an annual fee for their services as a Director of the Fund. Mr. MarkHeaney, Mr. Alan Shuch and Mr. Theodore Sotir are affiliated with the Investment Adviser and receive nocompensation from the Fund.
Performance Fees
GSAMI is entitled to a monthly performance fee on the Dynamic Alternative Strategies Portfolio. Theperformance fee accrues every Wednesday (or the following Business Day if it falls on a day that is not aBusiness Day) and is payable monthly in arrears out of the assets attributable to the Portfolio. The performancefee is equal to up to 10% of the amount by which the net asset value per Share exceeds the Benchmark Valueper Share, as defined within the Prospectus.
Portfolios Sub-Advisor
GMS Asia (ex-Japan) Equity Portfolio Treasury Asia Asset Management Ltd. Metisq Capital Pty, Ltd.
GMS Emerging Markets Equity Portfolio Wells Capital Management, Inc.Lazard Asset Management LLC1
GMS Europe Equity Portfolio Oeschle International AdvisersWellington Management International Ltd.2
Blackrock Investment Management (UK) Limited
GMS Global Equity Portfolio Baillie Gifford & Co.3
Altrinsic Global Advisors LLCHexavest, Inc.
GMS Japan Equity Portfolio Lazard Asset Management LLC AllianceBernstein L.P.
GMS US Equity Portfolio Diamond Hill Capital Management Inc. Manning & Napier Advisors, Inc. Westfield Capital Management LLC
17
Goldman Sachs Funds II, SICAVNotes to the Financial Statements
For the Year Ended 30 November 2012 (Continued)
6 Signi f icant Agreements (cont inued)
Fees Earned on Other Goldman Sachs Funds
To the extent permitted by applicable law and the terms of the Prospectus, any Portfolio may invest all or someof its short term cash investments in any money market fund advised or managed by Goldman Sachs and mayinvest in other investment funds advised or managed by Goldman Sachs (together “Goldman Sachs Funds”).Subject to applicable law and the terms of the Prospectus, the Fund may be required to bear its proportionateshare of any fees (including investment advisory and management fees) applicable to its investment in suchinvestment funds.
The Portfolios may invest in Goldman Sachs US$ Liquid Reserves Fund, Goldman Sachs Sterling LiquidReserves Fund, Goldman Sachs Euro Liquid Reserves Fund and Goldman Sachs Yen Liquid Reserves Fund(“the Liquid Reserves Funds”), sub-funds of Goldman Sachs Funds, plc. This is a collective investment schemepromoted by the Investment Adviser which is authorised by the Financial Regulator in Ireland as an Undertakingfor Collective Investments in Transferable Securities under the European Communities (Undertaking forCollective Investments in Transferable Securities) Regulations 2011.
For the year ended 30 November 2012, there were no Investment Advisory fees earned on each Portfolio’sinvestment in Goldman Sachs Funds. The Portfolios are invested in the non-Investment Advisory fee bearingshare classes of the Goldman Sachs Funds.
Commissions
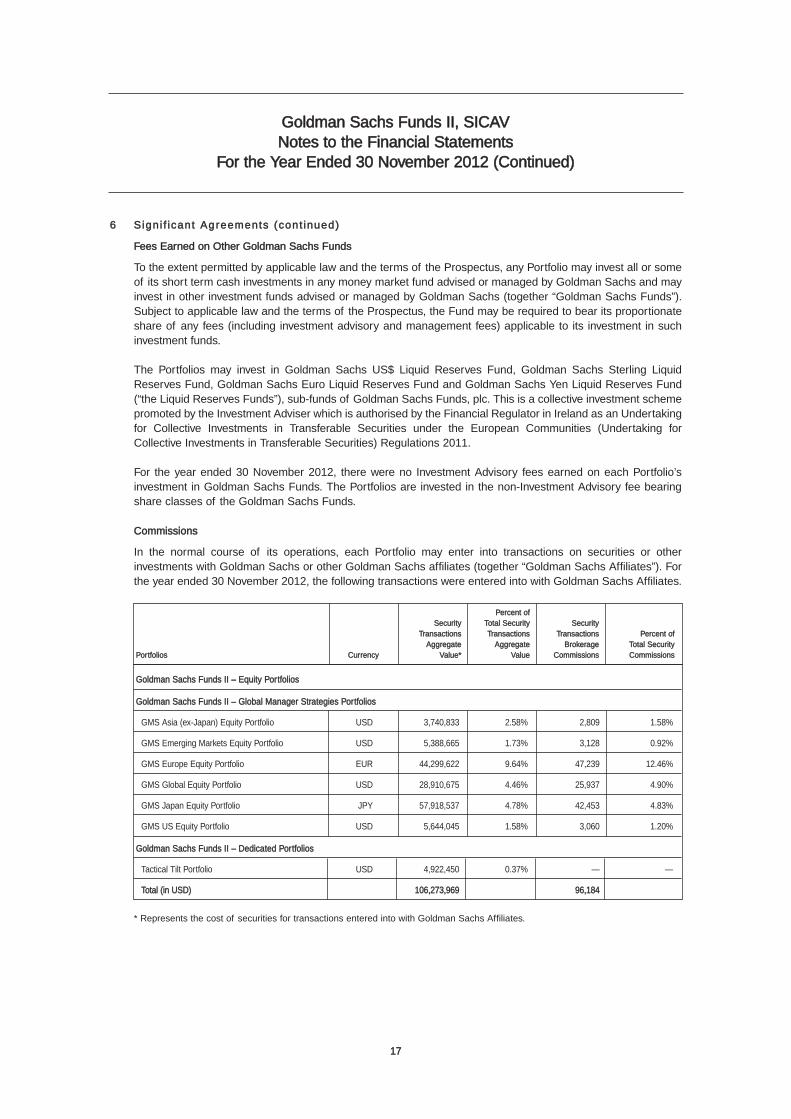
In the normal course of its operations, each Portfolio may enter into transactions on securities or otherinvestments with Goldman Sachs or other Goldman Sachs affiliates (together “Goldman Sachs Affiliates”). Forthe year ended 30 November 2012, the following transactions were entered into with Goldman Sachs Affiliates.
* Represents the cost of securities for transactions entered into with Goldman Sachs Affiliates.
Percent ofSecurity Total Security Security
Transactions Transactions Transactions Percent ofAggregate Aggregate Brokerage Total Security
Portfolios Currency Value* Value Commissions Commissions
Goldman Sachs Funds II – Equity Portfolios
Goldman Sachs Funds II – Global Manager Strategies Portfolios
GMS Asia (ex-Japan) Equity Portfolio USD 3,740,833 2.58% 2,809 1.58%
GMS Emerging Markets Equity Portfolio USD 5,388,665 1.73% 3,128 0.92%
GMS Europe Equity Portfolio EUR 44,299,622 9.64% 47,239 12.46%
GMS Global Equity Portfolio USD 28,910,675 4.46% 25,937 4.90%
GMS Japan Equity Portfolio JPY 57,918,537 4.78% 42,453 4.83%
GMS US Equity Portfolio USD 5,644,045 1.58% 3,060 1.20%
Goldman Sachs Funds II – Dedicated Portfolios
Tactical Tilt Portfolio USD 4,922,450 0.37% — —
Total (in USD) 106,273,969 96,184
18
Goldman Sachs Funds II, SICAVNotes to the Financial Statements
For the Year Ended 30 November 2012 (Continued)
6 Signi f icant Agreements (cont inued)
Commissions (continued)
There were no transactions with affiliates for the Dynamic Alternative Strategies Portfolio and Europe HighIncome Bond Portfolio.
A number of Portfolios invest into other Goldman Sachs Funds, as indicated in the Schedules of Investments.All such transactions with Goldman Sachs Affiliates were entered into in the ordinary course of business andon normal commercial terms.
Administrator, Custodian, Domiciliary Agent and Listing Agent
The Fund has appointed State Street Bank Luxembourg S.A. as Administrator, Custodian, Domiciliary Agent andListing Agent.
For its services as Administrator, Domiciliary Agent and Listing Agent, State Street Bank Luxembourg S.A.receives a fee payable monthly and calculated on the Monthly Average Net Assets of each Portfolio.
For its services as Custodian, State Street Bank Luxembourg S.A. charges a fee which is a combination of basispoint charge on assets and transactions dependent on the country of such transaction.
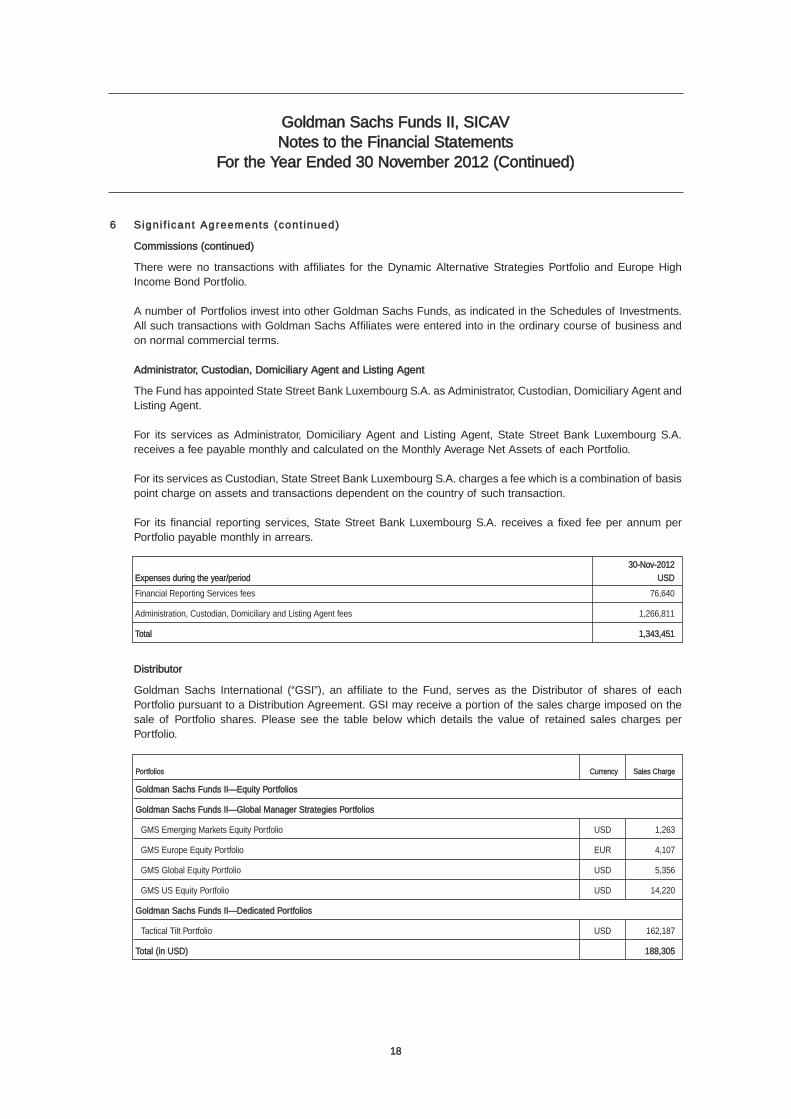
For its financial reporting services, State Street Bank Luxembourg S.A. receives a fixed fee per annum perPortfolio payable monthly in arrears.
Distributor
Goldman Sachs International (“GSI”), an affiliate to the Fund, serves as the Distributor of shares of eachPortfolio pursuant to a Distribution Agreement. GSI may receive a portion of the sales charge imposed on thesale of Portfolio shares. Please see the table below which details the value of retained sales charges perPortfolio.
30-Nov-2012
Expenses during the year/period USD
Financial Reporting Services fees 76,640
Administration, Custodian, Domiciliary and Listing Agent fees 1,266,811
Total 1,343,451
Portfolios Currency Sales Charge
Goldman Sachs Funds II—Equity Portfolios
Goldman Sachs Funds II—Global Manager Strategies Portfolios
GMS Emerging Markets Equity Portfolio USD 1,263
GMS Europe Equity Portfolio EUR 4,107
GMS Global Equity Portfolio USD 5,356
GMS US Equity Portfolio USD 14,220
Goldman Sachs Funds II—Dedicated Portfolios
Tactical Tilt Portfolio USD 162,187
Total (in USD) 188,305
19
Goldman Sachs Funds II, SICAVNotes to the Financial Statements
For the Year Ended 30 November 2012 (Continued)
6 Signi f icant Agreements (cont inued)
Distributor (continued)
For the year ended 30 November 2012, there were no retained sales charges for GMS Asia (ex-Japan) EquityPortfolio, GMS Japan Equity Portfolio, Dynamic Alternatives Strategies Portfolio and Europe High Income BondPortfolio.
Out of its fees, the Distributor is responsible for remunerating third party sub-distributors.
Transfer Agent
The Fund has appointed RBC Investor Services Bank S.A. as Registrar and Transfer Agent (“the TransferAgent”) for the Fund pursuant to the Registrar and Transfer Agent Agreement between the Fund and the TransferAgent. The day-to-day services provided to the Fund by the Transfer Agent include receiving and processingsubscription and redemption orders, allotting and issuing shares and maintaining the shareholder register for theshares. The Transfer Agent is paid a fee quarterly in arrears out of the net assets of the Portfolio. The TransferAgent’s fee consists of both a fixed and variable fee.
The fixed portion consists of an annual charge for maintenance and shareholder account charges. Variablecosts are determined by the level of transactions in each Portfolio.
For the year ended 30 November 2012, the Transfer Agent fees charged to the Fund were USD 122,024.
Shareholder Services
GSI, through its European Shareholder Services Group, also receives a fee from the Portfolios. This is in respectof investor services provided to shareholders in the Portfolios and is payable monthly in arrears. Investorsshould note that this fee is in addition to the fee payable to GSI in its capacity as Distributor.
For the year ended 30 November 2012, the Shareholder Services fees charged to the Fund were USD 611,614.
Competent Person
The Directors have appointed Goldman Sachs VOG to act as the Competent Person during the year ended30 November 2012.
7 Share Capi ta l
With the exception of Dynamic Alternative Strategies Portfolio and Tactical Tilt Portfolio, Shares of each Portfoliomay be purchased through the Distributor and any sub-distribution agent daily, at the net asset value per shareof the relevant Share Class of the Portfolio on such date, plus any applicable sales charge. For “P” Shares thesales charge will not exceed 5.5% of the purchase price of these Shares. There is no sales charge in respectof the “I” Share Class.
For the Dynamic Alternative Strategies Portfolio Shares may be purchased through the Distributor and any sub-distribution agent weekly, at the net asset value per share of the relevant Share Class of the Portfolio on suchdate, plus any applicable sales charge. For “P” Shares, Base Shares and Other Currency Shares the salescharge will not exceed 5.5% of the purchase price of these Shares.
For the Tactical Tilt Portfolio Shares may be purchased through the Distributor and any sub-distribution agent bi-monthly, at the net asset value per share of the relevant Share Class of the Portfolio on such date, plus anyapplicable sales charge. For “P” Shares, the sales charge will not exceed 5.5% of the purchase price of theseShares. There is no sales charge in respect of the “I” and “IO” Share class.
20
Goldman Sachs Funds II, SICAVNotes to the Financial Statements
For the Year Ended 30 November 2012 (Continued)
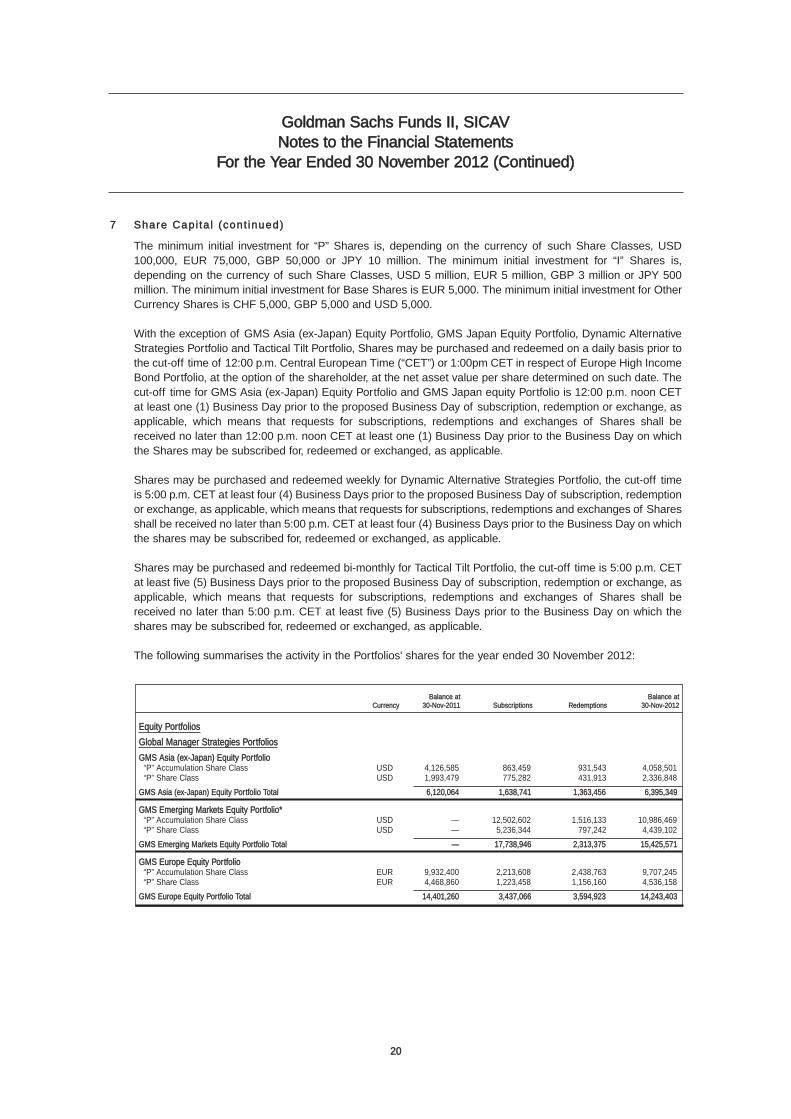
7 Share Capi ta l (cont inued)
The minimum initial investment for “P” Shares is, depending on the currency of such Share Classes, USD100,000, EUR 75,000, GBP 50,000 or JPY 10 million. The minimum initial investment for “I” Shares is,depending on the currency of such Share Classes, USD 5 million, EUR 5 million, GBP 3 million or JPY 500million. The minimum initial investment for Base Shares is EUR 5,000. The minimum initial investment for OtherCurrency Shares is CHF 5,000, GBP 5,000 and USD 5,000.
With the exception of GMS Asia (ex-Japan) Equity Portfolio, GMS Japan Equity Portfolio, Dynamic AlternativeStrategies Portfolio and Tactical Tilt Portfolio, Shares may be purchased and redeemed on a daily basis prior tothe cut-off time of 12:00 p.m. Central European Time (“CET”) or 1:00pm CET in respect of Europe High IncomeBond Portfolio, at the option of the shareholder, at the net asset value per share determined on such date. Thecut-off time for GMS Asia (ex-Japan) Equity Portfolio and GMS Japan equity Portfolio is 12:00 p.m. noon CETat least one (1) Business Day prior to the proposed Business Day of subscription, redemption or exchange, asapplicable, which means that requests for subscriptions, redemptions and exchanges of Shares shall bereceived no later than 12:00 p.m. noon CET at least one (1) Business Day prior to the Business Day on whichthe Shares may be subscribed for, redeemed or exchanged, as applicable.
Shares may be purchased and redeemed weekly for Dynamic Alternative Strategies Portfolio, the cut-off timeis 5:00 p.m. CET at least four (4) Business Days prior to the proposed Business Day of subscription, redemptionor exchange, as applicable, which means that requests for subscriptions, redemptions and exchanges of Sharesshall be received no later than 5:00 p.m. CET at least four (4) Business Days prior to the Business Day on whichthe shares may be subscribed for, redeemed or exchanged, as applicable.
Shares may be purchased and redeemed bi-monthly for Tactical Tilt Portfolio, the cut-off time is 5:00 p.m. CETat least five (5) Business Days prior to the proposed Business Day of subscription, redemption or exchange, asapplicable, which means that requests for subscriptions, redemptions and exchanges of Shares shall bereceived no later than 5:00 p.m. CET at least five (5) Business Days prior to the Business Day on which theshares may be subscribed for, redeemed or exchanged, as applicable.
The following summarises the activity in the Portfolios' shares for the year ended 30 November 2012:
Balance at Balance at Currency 30-Nov-2011 Subscriptions Redemptions 30-Nov-2012
Equity Portfolios
Global Manager Strategies Portfolios
GMS Asia (ex-Japan) Equity Portfolio“P” Accumulation Share Class USD 4,126,585 863,459 931,543 4,058,501“P” Share Class USD 1,993,479 775,282 431,913 2,336,848
GMS Asia (ex-Japan) Equity Portfolio Total 6,120,064 1,638,741 1,363,456 6,395,349
GMS Emerging Markets Equity Portfolio*“P” Accumulation Share Class USD — 12,502,602 1,516,133 10,986,469“P” Share Class USD — 5,236,344 797,242 4,439,102
GMS Emerging Markets Equity Portfolio Total — 17,738,946 2,313,375 15,425,571
GMS Europe Equity Portfolio“P” Accumulation Share Class EUR 9,932,400 2,213,608 2,438,763 9,707,245“P” Share Class EUR 4,468,860 1,223,458 1,156,160 4,536,158
GMS Europe Equity Portfolio Total 14,401,260 3,437,066 3,594,923 14,243,403
21
Goldman Sachs Funds II, SICAVNotes to the Financial Statements
For the Year Ended 30 November 2012 (Continued)
Balance at Balance at Currency 30-Nov-2011 Subscriptions Redemptions 30-Nov-2012
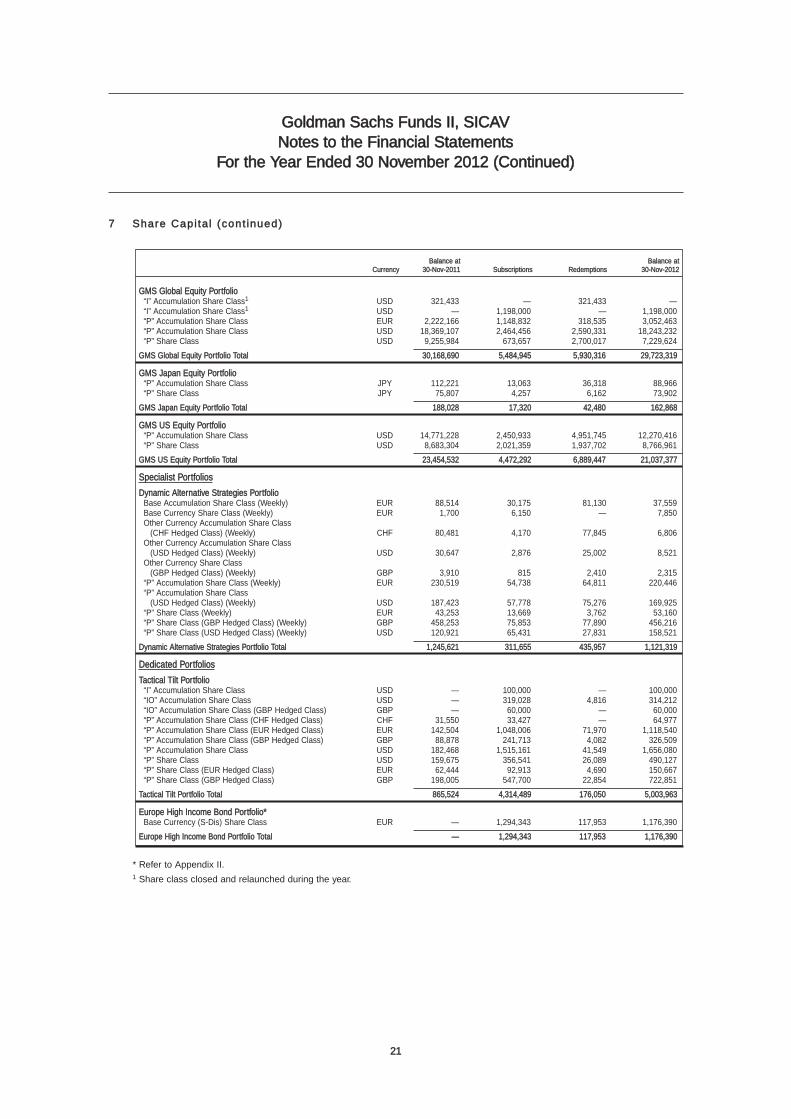
GMS Global Equity Portfolio“I” Accumulation Share Class1 USD 321,433 — 321,433 —“I” Accumulation Share Class1 USD — 1,198,000 — 1,198,000“P” Accumulation Share Class EUR 2,222,166 1,148,832 318,535 3,052,463“P” Accumulation Share Class USD 18,369,107 2,464,456 2,590,331 18,243,232“P” Share Class USD 9,255,984 673,657 2,700,017 7,229,624
GMS Global Equity Portfolio Total 30,168,690 5,484,945 5,930,316 29,723,319
GMS Japan Equity Portfolio“P” Accumulation Share Class JPY 112,221 13,063 36,318 88,966“P” Share Class JPY 75,807 4,257 6,162 73,902
GMS Japan Equity Portfolio Total 188,028 17,320 42,480 162,868
GMS US Equity Portfolio“P” Accumulation Share Class USD 14,771,228 2,450,933 4,951,745 12,270,416“P” Share Class USD 8,683,304 2,021,359 1,937,702 8,766,961
GMS US Equity Portfolio Total 23,454,532 4,472,292 6,889,447 21,037,377
Specialist Portfolios
Dynamic Alternative Strategies PortfolioBase Accumulation Share Class (Weekly) EUR 88,514 30,175 81,130 37,559Base Currency Share Class (Weekly) EUR 1,700 6,150 — 7,850Other Currency Accumulation Share Class
(CHF Hedged Class) (Weekly) CHF 80,481 4,170 77,845 6,806Other Currency Accumulation Share Class
(USD Hedged Class) (Weekly) USD 30,647 2,876 25,002 8,521Other Currency Share Class
(GBP Hedged Class) (Weekly) GBP 3,910 815 2,410 2,315“P” Accumulation Share Class (Weekly) EUR 230,519 54,738 64,811 220,446“P” Accumulation Share Class
(USD Hedged Class) (Weekly) USD 187,423 57,778 75,276 169,925“P” Share Class (Weekly) EUR 43,253 13,669 3,762 53,160“P” Share Class (GBP Hedged Class) (Weekly) GBP 458,253 75,853 77,890 456,216“P” Share Class (USD Hedged Class) (Weekly) USD 120,921 65,431 27,831 158,521
Dynamic Alternative Strategies Portfolio Total 1,245,621 311,655 435,957 1,121,319
Dedicated Portfolios
Tactical Tilt Portfolio“I” Accumulation Share Class USD — 100,000 — 100,000“IO” Accumulation Share Class USD — 319,028 4,816 314,212“IO” Accumulation Share Class (GBP Hedged Class) GBP — 60,000 — 60,000“P” Accumulation Share Class (CHF Hedged Class) CHF 31,550 33,427 — 64,977“P” Accumulation Share Class (EUR Hedged Class) EUR 142,504 1,048,006 71,970 1,118,540“P” Accumulation Share Class (GBP Hedged Class) GBP 88,878 241,713 4,082 326,509“P” Accumulation Share Class USD 182,468 1,515,161 41,549 1,656,080“P” Share Class USD 159,675 356,541 26,089 490,127“P” Share Class (EUR Hedged Class) EUR 62,444 92,913 4,690 150,667“P” Share Class (GBP Hedged Class) GBP 198,005 547,700 22,854 722,851
Tactical Tilt Portfolio Total 865,524 4,314,489 176,050 5,003,963
Europe High Income Bond Portfolio*Base Currency (S-Dis) Share Class EUR — 1,294,343 117,953 1,176,390
Europe High Income Bond Portfolio Total — 1,294,343 117,953 1,176,390
7 Share Capi ta l (cont inued)
* Refer to Appendix II.1 Share class closed and relaunched during the year.
22
Goldman Sachs Funds II, SICAVNotes to the Financial Statements
For the Year Ended 30 November 2012 (Continued)
8 Financia l Investments and Associa ted Risks
The Fund’s investing activities expose it to various types of risks that are associated with the financialinvestments and markets in which it and its underlying Portfolios invest (the “Investment Risks”). These may beboth derivative and non-derivative financial investments. The Fund’s underlying Portfolios’ investments arecomprised of equity investments, investments in other funds, forward foreign currency contracts, options andswap contracts at the year end. The Board has appointed the Investment Adviser to manage the investment risksof the Fund. The significant types of financial risks which the Fund is exposed to are market risk, liquidity riskand credit risk. The prospectus provides details of these and other types of risk some of which are additionalto that information provided in these financial statements.
Asset allocation is determined by the Fund’s Investment Adviser who manages the allocation of assets toachieve the investment objectives as detailed in Note 2. Achievement of the investment objectives involvestaking risks. The Investment Adviser exercises judgment based on analysis, research and risk managementtechniques when making investment decisions. Divergence from the benchmark and/or the target assetallocations and the composition of the portfolio is monitored by the Fund’s Investment Adviser.
The risk management policies employed by the Investment Adviser are detailed below:
(a) Market Risk
The potential for changes in the market value of the Fund’s underlying Portfolios’ investments is referred to asmarket risk. Commonly used categories of market risk include currency risk and other price risk.
(i) Currency risks may result from exposures to changes in spot prices, forward prices and volatilitiesof currency rates.
(ii) Interest rate risks may result from exposures to changes in the level, slope and curvature of thevarious yield curves, the volatility of interest rates, mortgage prepayment speeds and credit spreads.
(iii) Other price risks are the risk that the value of an investment will fluctuate as a result of changes inmarket prices other than those arising from currency risk and may result from exposures to changesin the prices and volatilities of individual equities, equity baskets, equity indices, and commodities.
The Fund’s market risk strategy is driven by the Fund’s underlying Portfolios’ investment risk and returnobjectives.
The Investment Adviser and Sub-Advisers manage market risk through the application of risk budgetingprinciples.
(i) Currency Risk
The Fund may invest in financial investments and enter into transactions denominated in currencies other thanits Portfolios’ base currencies. Consequently, a Portfolio may be exposed to the risk that the exchange rate ofits base currency relative to other foreign currencies may change in a manner that has an adverse effect on thevalue of that portion of a Portfolio’s assets or liabilities denominated in currencies other than the base currency.
When an investor invests into a Share Class which is in a different currency to the base currency of the Portfolioin which it invests, the currency risk of the investor will be different to the currency risk of the Portfolio.
(ii) Interest Rate Risk
The Portfolios may invest in fixed income securities and interest rate swaps contracts. Any change to relevantinterest rates for particular securities may result in the Investment Adviser being unable to secure similar returnsupon the expiry of contracts or the sale of securities. In addition, changes to prevailing interest rates or changesin expectations of future rates may result in an increase or decrease in the value of the securities held. Ingeneral, if interest rates rise, the value of fixed income securities will decline. A decline in interest rates will ingeneral, have the opposite effect. All fixed income securities and floating rate securities, together with their
23
Goldman Sachs Funds II, SICAVNotes to the Financial Statements
For the Year Ended 30 November 2012 (Continued)
coupon and maturity date are disclosed in the Schedule of Investments. The Portfolios may invest in instrumentsin desired currencies at fixed, floating and zero rates of interest.
(iii) Other Price Risk
Other price risk is the risk that the value of a financial investment will fluctuate as a result of changes in marketprices, other than those arising from currency risk whether caused by factors specific to an individual investment,its issuer or any factor affecting financial investments traded in the market. The Funds’ financial investments arecarried at Market Value with market value changes recognised in the Statement of Operations, all changes inmarket conditions will directly affect Shareholders’ equity.
The Funds’ investments in mutual funds are based upon the net asset value as supplied by the funds, inaccordance with the valuation policy of the applicable fund as outlined in its prospectus. While it is expected thatthe assets of the mutual funds will generally be valued by an independent third party administrator or otherservice provider, there may be circumstances in which certain securities or other assets of a mutual fund maynot have a readily ascertainable market price. In such circumstances, the manager of the relevant mutual fundmay be required to value such securities or instruments.
(b) L iqu id i ty Risk
Liquidity risk is the risk that the Fund will encounter difficulty in meeting obligations associated with financialliabilities that are settled by delivering cash or another financial asset. Among other things liquidity could beimpaired by an inability to access secured and /or unsecured sources of financing, an inability to sell assets orunforeseen outflows of cash or collateral. This situation may arise due to circumstances outside of the Fund’scontrol, such as a general market disruption or an operational problem affecting the Fund or third parties. Also,the ability to sell assets may be impaired if other market participants are seeking to sell similar assets at thesame time.
The Fund’s investments include mutual funds, which may impose greater restrictions on redemptions than thoseimposed by the Fund. This may include offering less frequent redemption dates than are offered by the Fund toits shareholders.
The Fund’s financial investments include investments in derivative contracts traded over the counter, which arenot traded in an organised public market and which may be illiquid and in investments which may represent asignificant percentage of issue size. As a result, the Fund may not be able to liquidate quickly some of theseinvestments at an amount close to its market value in order to meet requirements, or to respond to specificevents such as deterioration in the creditworthiness of any particular issuer. The forced liquidation of investmentpositions may cause financial losses.
The Fund provides for the subscription and redemption of shares and it is therefore exposed to the liquidity riskassociated with shareholder redemptions in accordance with the terms in the prospectus. The Portfolios aremanaged to include liquid investments which the Investment Adviser believes are sufficient to meet normalliquidity needs although substantial redemptions of shares in the Portfolios could require the Portfolios toliquidate their investments more rapidly than otherwise desirable in order to raise cash for the redemptions andchanges in the liquidity of the Portfolios’ underlying investments once acquired can adversely impact its positionin this respect.
These factors could adversely affect the value of the shares redeemed and the valuation of the shares thatremain outstanding and the liquidity of the Portfolios’ remaining assets if more liquid assets have to be sold tomeet redemptions.
8 Financia l Investments and Associa ted Risks (cont inued)
(a) Market Risk (cont inued)
(ii) Interest Rate Risk (continued)
24
Goldman Sachs Funds II, SICAVNotes to the Financial Statements
For the Year Ended 30 November 2012 (Continued)
8 Financia l Investments and Associa ted Risks (cont inued)
(b) L iqu id i ty Risk (cont inued)
The Fund’s prospectus provides for the daily/weekly/bi-monthly subscription of shares and the daily/weeklyredemption of shares. The Fund is therefore exposed to the liquidity risk of meeting shareholder redemptions.
Please refer to Appendix III for details of Shareholders with holdings greater than 10% of the Portfolios’ netassets as at 30 November 2012.
Expiration or termination of available financing for leveraged positions, and the requirements to post collateralin respect of changes in the market value of leveraged exposures or changes in advance rates or other termsand conditions of the Fund’s financing arrangements, can result in adverse effects to the Fund’s access toliquidity and ability to maintain leveraged positions, and may cause the Fund to incur material losses.
However, there is no guarantee that any such arrangements for obtaining leverage will be available, or, ifavailable, will be available on terms and conditions acceptable to the Fund. Unfavourable economic conditionsalso could increase funding costs, limit access to the capital markets or result in a decision by lenders not toextend credit to the Fund.
The use of leverage also increases risk as it magnifies the effect of any volatility in market values on the Fund’sequity.
A decline in the market value of the Fund’s assets may have particular adverse consequences in instanceswhere they have borrowed money on the market value of those assets. A decrease in the market value of thoseassets may result in the lender (including derivative counterparties) requiring the Fund to post additionalcollateral or otherwise sell assets at time when it may not be in the Fund’s best interest to do so.
(c) Credi t R isk
Credit risk is the risk that one party to a financial investment will cause a financial loss for the other party byfailing to discharge an obligation.
The Investment Adviser has adopted procedures to reduce credit risk related to its dealings with counterparties.Before transacting with any counterparty, the Investment Adviser or its affiliates evaluate both credit-worthinessand reputation by conducting a credit analysis of the party, their business and reputation. The credit risk ofapproved counterparties is then monitored on an ongoing basis, including periodic reviews of financialstatements and interim financial reports as needed.
In order to reduce exposure to credit losses, some over-the-counter derivative agreements entered into by thePortfolios permit netting of transactions arising under such agreements, excluding those with counterpartiesexecuting only spot foreign exchange contracts. These netting rights provide for the reduction of credit risk onfavourable over-the-counter transactions with a single counterparty to the extent of the value of unfavourableover-the-counter transactions with the same counterparty upon the occurrence of an event of default ortermination event as all over-the-counter transactions with the counterparty under such agreement areterminated and amounts owed from and amounts payable to the counterparty are settled on a net basis.
Debt securities are subject to the risk of an issuer’s or a guarantor’s inability to meet principal and interestpayments on its obligations and are subject to price volatility due to factors such as interest rate sensitivity,market perception of the creditworthiness of the issuer, and general market liquidity.
25
Goldman Sachs Funds II, SICAVNotes to the Financial Statements
For the Year Ended 30 November 2012 (Continued)
8 Financia l Investments and Associa ted Risks (cont inued)
(c) Credi t R isk (cont inued)
The Fund is subject to a number of risks relating to the insolvency, administration, liquidation or other formalprotection from creditors (“Insolvency”) of the Custodian or any Sub-Custodian. These risks include withoutlimitation:
1. The loss of all cash held with the Custodian or Sub-Custodian which is not being treated as client moneyboth at the level of the Custodian and any Sub-Custodians (“client money”).
2. The loss of all cash which the Custodian or Sub-Custodian has failed to treat as client money in accordancewith procedures (if any) agreed with the Fund.
3. The loss of some or all of any securities held on trust which have not been properly segregated and soidentified both at the level of the Custodian and any sub-custodians (“trust assets”) or client money held byor with the Custodian or Sub-Custodian.
4. The loss of some or all assets due to the incorrect operation of accounts by the Custodian or Sub-Custodian or due to the process of identifying and transferring the relevant Trust Assets and/or client moneyincluding any deduction to meet the administrative costs of an insolvency.
5. Losses caused by prolonged delays in receiving transfers of balances and regaining control over therelevant assets.
An insolvency could cause severe disruption to the Fund’s investment activity. In some circumstances, this couldcause the Directors to temporarily suspend the calculation of the Net Asset Value and dealings in Shares.
(d) Addi t ional Risks
(i) Concentration Risk
The Portfolios may invest in a limited number of investments and investment themes. A consequence of a limitednumber of investments is that performance may be more favourably or unfavourably affected by the performanceof an individual investment.
(ii) Operational Risk
Operational risk is the potential for loss caused by a deficiency in information, communications, transactionprocessing and settlement, and accounting systems. The Fund’s service providers, including sub-custodians andas shown on page 1, maintain controls and procedures for the purpose of helping to manage operational risk.Reviews of the service levels of service providers are performed on a regular basis by the Investment Adviser.No assurance is given that these measures will be 100% effective.
(iii) Legal, Tax and Regulatory Risks
Legal, tax and regulatory changes could occur during the duration of the Fund which may adversely affect theFund.
With respect to tax, the Fund may be subject to taxation on capital gains, interest and dividends in certainjurisdictions where the Fund invests.
The interpretation and applicability of the tax law and regulations by tax authorities at times may not be clear orconsistent. Tax obligations where probable and estimable are recorded as liabilities. However, some taxobligations are subject to uncertainty and may result in additional tax liabilities, interest and penalties based onfuture actions, interpretations or judgments of these authorities covering current and past tax positions.Accounting standards may also change, creating or removing an obligation for the Fund to accrue for a potentialtax liability. Consequently, it is possible that certain potential tax obligations which currently are not probable maybecome so which may result in additional tax liabilities for the Fund in the future and these additional liabilitiesmay be material. Because of the foregoing uncertainties, the NAV may not reflect the tax liabilities ultimatelyborne by the Fund, including at the time of any subscriptions, redemptions or exchanges of interests in the Fund,which could have an adverse impact on investors at that time.
Goldman Sachs Funds II, SICAVNotes to the Financial Statements
For the Year Ended 30 November 2012 (Continued)
26
(iv) Non-Developed Markets Risk
The Fund may invest a portion of its capital in securities of companies based in non-developed or emergingmarkets or issued by governments of such countries. Investing in the securities of such companies and countriesinvolves certain considerations not usually associated with investing in securities of developed marketcompanies or countries, including, without limitation, less liquidity, greater price and foreign currency volatility,and greater legal, tax and regulatory risks.
(v) Small Capitalisation Companies Risk
The Fund may invest a portion of its capital in securities of companies with smaller capitalisation. Smallercapitalisation companies are generally not as well known to the investing public and have less investor followingthan larger capitalisation companies. Investing in the securities of such companies may involve certainconsiderations, including, without limitation, less liquidity, greater price volatility, and risks associated with limitedoperating histories and/or the availability of information pertaining to the Fund and its operations.
Additional details of risks not disclosed in these Financial Statements can be found in the Prospectus.
9 Dis t r ibut ions
The Fund intends that substantially all the net investment income, if any, of each Portfolio will be declared as adividend and paid at least annually to the Shareholders of the Distribution Share Class of the Portfolio. Netcapital and currency gains realised on each Portfolio’s investments are expected to be retained by each Portfolio.
Dividends distributed by each Portfolio may be paid in cash or reinvested in additional Shares of the Portfolio atthe net asset value of the Shares as of the date on which such dividends are declared. When Shareholdersmake use of this reinvestment facility, each dividend due to the Shareholder will be paid by the Portfolio to StateStreet Bank Luxembourg S.A. at its Luxembourg office to the account of the relevant Shareholder, and additionalShares will be issued to the Shareholder. State Street Bank Luxembourg S.A. will, as paying agent for theShareholders, credit such monies to the Portfolio for subscription in further Shares.
No distributions will be paid in respect of the Accumulation Share Class.
10 Sta tement o f Changes in each Por t fo l io
A Statement of Changes in each Portfolio is available, free of charge, upon request from the registered office.
11 Share Class Speci f ic Forward Cur rency Contracts
Certain Portfolios of the Fund engage in forward currency contracts for the purpose of hedging the currencyexposure of certain Share Classes.
Gains and losses on these forward currency transactions are allocated to the respective Share Classes. Detailsof these transactions are found in their respective Schedule of Investments.
8 Financia l Investments and Associa ted Risks (cont inued)
(d) Addi t ional Risks (cont inued)
Goldman Sachs Funds II, SICAVNotes to the Financial Statements
For the Year Ended 30 November 2012 (Continued)
27
Currency 30-Nov-2012
Australian Dollar 0.959877
Brazilian Real 2.108700
British Pound Sterling 0.625059
Canadian Dollar 0.994050
Chilean Peso 480.650000
Danish Krone 5.739900
Egyptian Pound 6.111000
Euro 0.769438
Hong Kong Dollar 7.750050
Hungarian Forint 216.081250
Indian Rupee 54.395000
Indonesian Rupiah 9,593.500000
Israeli Shekel 3.818250
Japanese Yen 82.515000
Malaysian Ringgit 3.039750
Mexican Peso 12.918700
Norwegian Kroner 5.675800
Philippines Peso 40.890000
Singapore Dollar 1.220700
South African Rand 8.847000
South Korean Won 1,082.850000
Swedish Krona 6.659050
Swiss Franc 0.927400
Taiwan Dollar 29.054000
Thailand Baht 30.690000
Turkish Lira 1.787000
Currency 30-Nov-2012
British Pound Sterling 0.812358
Danish Krona 7.459860
Norwegian Kroner 7.376553
Swedish Krona 8.654433
Swiss Franc 1.205295
U.S. Dollars 1.299650
12 Exchange Ra tes
The following exchange rates (against USD) as at 3:00 p.m. Central European Time were used to convert theinvestments and other assets and liabilities denominated in currencies other than USD:
The following exchange rates (against EUR) as at 3:00 p.m. Central European Time were used to convert theinvestments and other assets and liabilities denominated in currencies other than EUR:
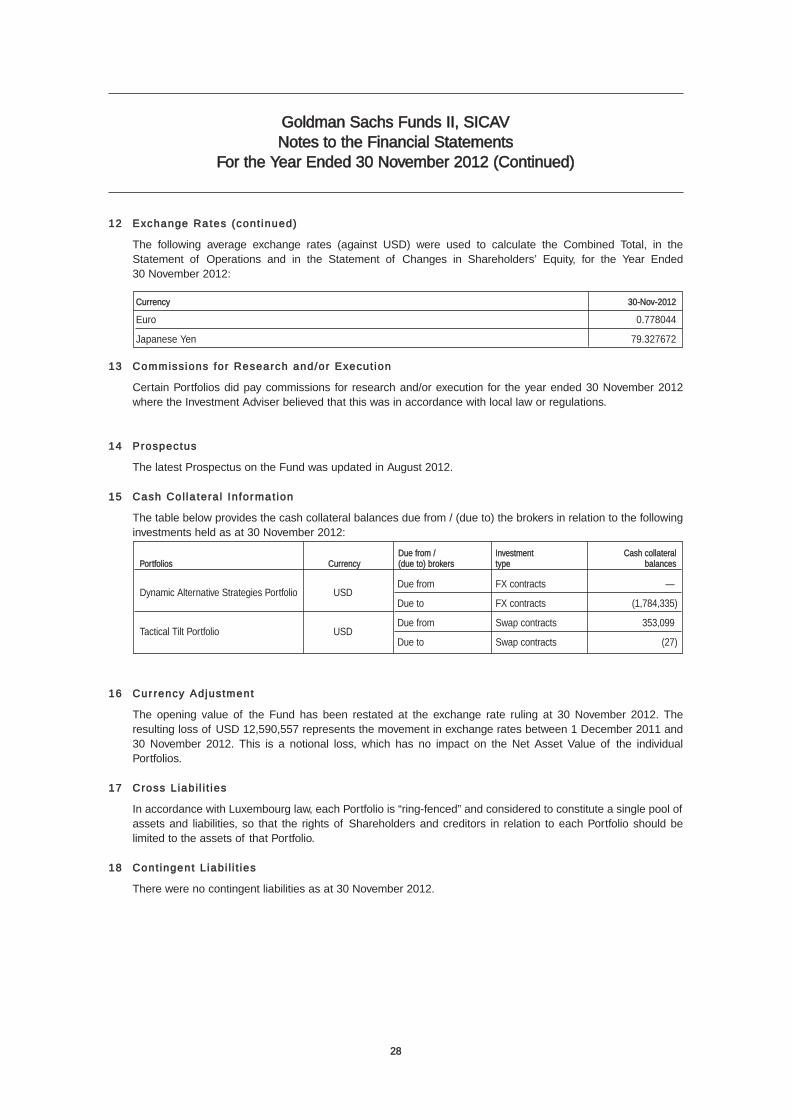
Goldman Sachs Funds II, SICAVNotes to the Financial Statements
For the Year Ended 30 November 2012 (Continued)
28
12 Exchange Ra tes (cont inued)
The following average exchange rates (against USD) were used to calculate the Combined Total, in theStatement of Operations and in the Statement of Changes in Shareholders’ Equity, for the Year Ended30 November 2012:
13 Commiss ions for Research and/or Execut ion
Certain Portfolios did pay commissions for research and/or execution for the year ended 30 November 2012where the Investment Adviser believed that this was in accordance with local law or regulations.
14 Prospectus
The latest Prospectus on the Fund was updated in August 2012.
15 Cash Col la tera l In for mat ion
The table below provides the cash collateral balances due from / (due to) the brokers in relation to the followinginvestments held as at 30 November 2012:
16 Cur rency Adjustment
The opening value of the Fund has been restated at the exchange rate ruling at 30 November 2012. Theresulting loss of USD 12,590,557 represents the movement in exchange rates between 1 December 2011 and30 November 2012. This is a notional loss, which has no impact on the Net Asset Value of the individualPortfolios.
17 Cross L iab i l i t ies
In accordance with Luxembourg law, each Portfolio is “ring-fenced” and considered to constitute a single pool ofassets and liabilities, so that the rights of Shareholders and creditors in relation to each Portfolio should belimited to the assets of that Portfolio.
18 Cont ingent L iab i l i t ies
There were no contingent liabilities as at 30 November 2012.
Currency 30-Nov-2012
Euro 0.778044
Japanese Yen 79.327672
Due from / Investment Cash collateralPortfolios Currency (due to) brokers type balances
Dynamic Alternative Strategies Portfolio USD
Tactical Tilt Portfolio USD
Due from FX contracts —
Due to FX contracts (1,784,335)
Due from Swap contracts 353,099
Due to Swap contracts (27)
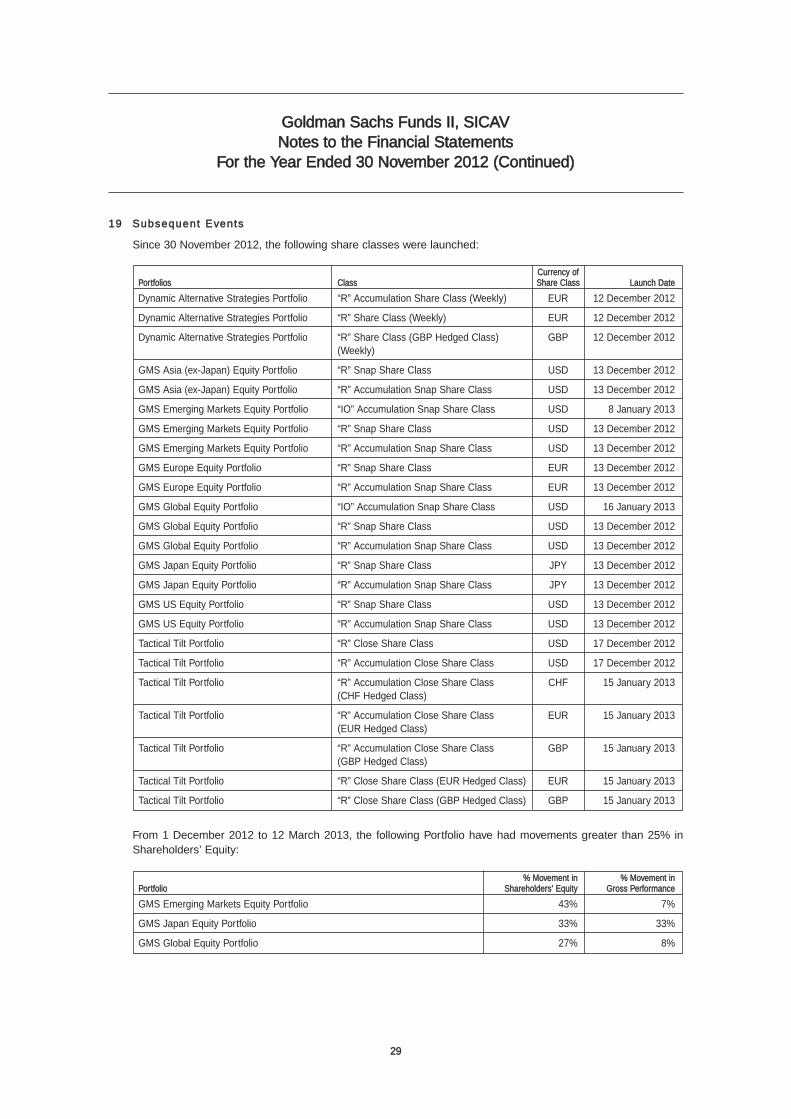
Goldman Sachs Funds II, SICAVNotes to the Financial Statements
For the Year Ended 30 November 2012 (Continued)
29
Currency of Portfolios Class Share Class Launch Date
Dynamic Alternative Strategies Portfolio “R” Accumulation Share Class (Weekly) EUR 12 December 2012
Dynamic Alternative Strategies Portfolio “R” Share Class (Weekly) EUR 12 December 2012
Dynamic Alternative Strategies Portfolio “R” Share Class (GBP Hedged Class) GBP 12 December 2012(Weekly)
GMS Asia (ex-Japan) Equity Portfolio “R” Snap Share Class USD 13 December 2012
GMS Asia (ex-Japan) Equity Portfolio “R” Accumulation Snap Share Class USD 13 December 2012
GMS Emerging Markets Equity Portfolio “IO” Accumulation Snap Share Class USD 8 January 2013
GMS Emerging Markets Equity Portfolio “R” Snap Share Class USD 13 December 2012
GMS Emerging Markets Equity Portfolio “R” Accumulation Snap Share Class USD 13 December 2012
GMS Europe Equity Portfolio “R” Snap Share Class EUR 13 December 2012
GMS Europe Equity Portfolio “R” Accumulation Snap Share Class EUR 13 December 2012
GMS Global Equity Portfolio “IO” Accumulation Snap Share Class USD 16 January 2013
GMS Global Equity Portfolio “R” Snap Share Class USD 13 December 2012
GMS Global Equity Portfolio “R” Accumulation Snap Share Class USD 13 December 2012
GMS Japan Equity Portfolio “R” Snap Share Class JPY 13 December 2012
GMS Japan Equity Portfolio “R” Accumulation Snap Share Class JPY 13 December 2012
GMS US Equity Portfolio “R” Snap Share Class USD 13 December 2012
GMS US Equity Portfolio “R” Accumulation Snap Share Class USD 13 December 2012
Tactical Tilt Portfolio “R” Close Share Class USD 17 December 2012
Tactical Tilt Portfolio “R” Accumulation Close Share Class USD 17 December 2012
Tactical Tilt Portfolio “R” Accumulation Close Share Class CHF 15 January 2013(CHF Hedged Class)
Tactical Tilt Portfolio “R” Accumulation Close Share Class EUR 15 January 2013(EUR Hedged Class)
Tactical Tilt Portfolio “R” Accumulation Close Share Class GBP 15 January 2013(GBP Hedged Class)
Tactical Tilt Portfolio “R” Close Share Class (EUR Hedged Class) EUR 15 January 2013
Tactical Tilt Portfolio “R” Close Share Class (GBP Hedged Class) GBP 15 January 2013
% Movement in % Movement inPortfolio Shareholders’ Equity Gross Performance
GMS Emerging Markets Equity Portfolio 43% 7%
GMS Japan Equity Portfolio 33% 33%
GMS Global Equity Portfolio 27% 8%
19 Subsequent Events
Since 30 November 2012, the following share classes were launched:
From 1 December 2012 to 12 March 2013, the following Portfolio have had movements greater than 25% inShareholders’ Equity:
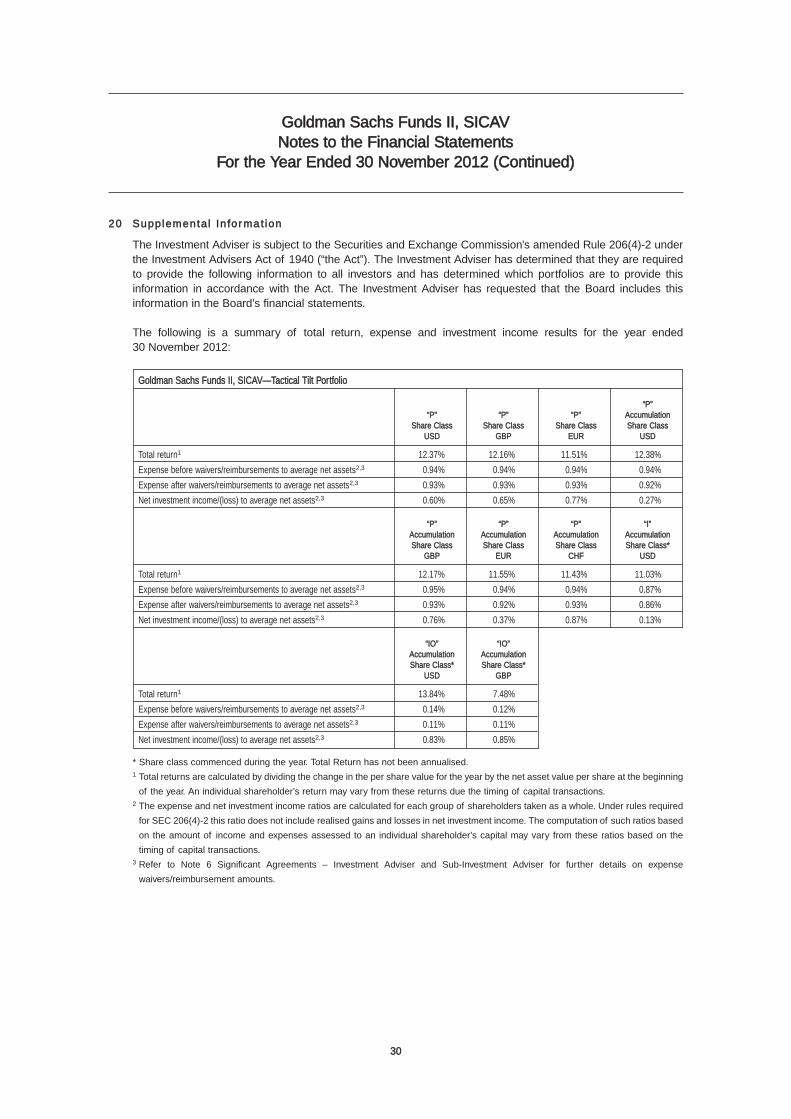
30
Goldman Sachs Funds II, SICAVNotes to the Financial Statements
For the Year Ended 30 November 2012 (Continued)
20 Supplementa l In for mat ion
The Investment Adviser is subject to the Securities and Exchange Commission’s amended Rule 206(4)-2 underthe Investment Advisers Act of 1940 (“the Act”). The Investment Adviser has determined that they are requiredto provide the following information to all investors and has determined which portfolios are to provide thisinformation in accordance with the Act. The Investment Adviser has requested that the Board includes thisinformation in the Board’s financial statements.
The following is a summary of total return, expense and investment income results for the year ended30 November 2012:
Goldman Sachs Funds II, SICAV—Tactical Tilt Portfolio
Total return1 12.37% 12.16% 11.51% 12.38%
Expense before waivers/reimbursements to average net assets2,3 0.94% 0.94% 0.94% 0.94%
Expense after waivers/reimbursements to average net assets2,3 0.93% 0.93% 0.93% 0.92%
Net investment income/(loss) to average net assets2,3 0.60% 0.65% 0.77% 0.27%
Total return1 12.17% 11.55% 11.43% 11.03%
Expense before waivers/reimbursements to average net assets2,3 0.95% 0.94% 0.94% 0.87%
Expense after waivers/reimbursements to average net assets2,3 0.93% 0.92% 0.93% 0.86%
Net investment income/(loss) to average net assets2,3 0.76% 0.37% 0.87% 0.13%
Total return1 13.84% 7.48%
Expense before waivers/reimbursements to average net assets2,3 0.14% 0.12%
Expense after waivers/reimbursements to average net assets2,3 0.11% 0.11%
Net investment income/(loss) to average net assets2,3 0.83% 0.85%
“P” Share Class
USD
“P” Share Class
GBP
“P” Share Class
EUR
“P” Accumulation Share Class
USD
“P” AccumulationShare Class
GBP
“P” AccumulationShare Class
EUR
“P” AccumulationShare Class
CHF
“I” AccumulationShare Class*
USD
“IO” AccumulationShare Class*
USD
“IO” AccumulationShare Class*
GBP
* Share class commenced during the year. Total Return has not been annualised.1 Total returns are calculated by dividing the change in the per share value for the year by the net asset value per share at the beginning
of the year. An individual shareholder’s return may vary from these returns due the timing of capital transactions.2 The expense and net investment income ratios are calculated for each group of shareholders taken as a whole. Under rules required
for SEC 206(4)-2 this ratio does not include realised gains and losses in net investment income. The computation of such ratios based
on the amount of income and expenses assessed to an individual shareholder’s capital may vary from these ratios based on the
timing of capital transactions.3 Refer to Note 6 Significant Agreements – Investment Adviser and Sub-Investment Adviser for further details on expense
waivers/reimbursement amounts.
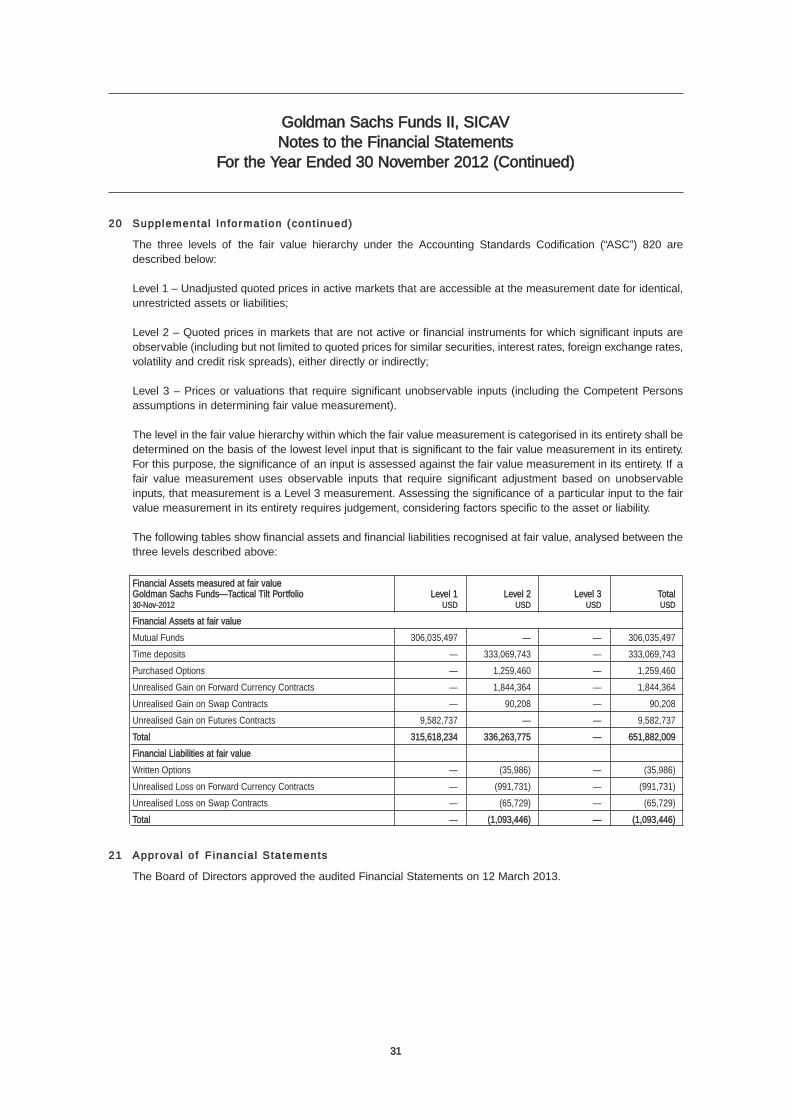
31
Goldman Sachs Funds II, SICAVNotes to the Financial Statements
For the Year Ended 30 November 2012 (Continued)
20 Supplementa l In for mat ion (cont inued)
The three levels of the fair value hierarchy under the Accounting Standards Codification (“ASC”) 820 aredescribed below:
Level 1 – Unadjusted quoted prices in active markets that are accessible at the measurement date for identical,unrestricted assets or liabilities;
Level 2 – Quoted prices in markets that are not active or financial instruments for which significant inputs areobservable (including but not limited to quoted prices for similar securities, interest rates, foreign exchange rates,volatility and credit risk spreads), either directly or indirectly;
Level 3 – Prices or valuations that require significant unobservable inputs (including the Competent Personsassumptions in determining fair value measurement).
The level in the fair value hierarchy within which the fair value measurement is categorised in its entirety shall bedetermined on the basis of the lowest level input that is significant to the fair value measurement in its entirety.For this purpose, the significance of an input is assessed against the fair value measurement in its entirety. If afair value measurement uses observable inputs that require significant adjustment based on unobservableinputs, that measurement is a Level 3 measurement. Assessing the significance of a particular input to the fairvalue measurement in its entirety requires judgement, considering factors specific to the asset or liability.
The following tables show financial assets and financial liabilities recognised at fair value, analysed between thethree levels described above:
Financial Assets measured at fair valueGoldman Sachs Funds—Tactical Tilt Portfolio Level 1 Level 2 Level 3 Total30-Nov-2012 USD USD USD USD
Financial Assets at fair value
Mutual Funds 306,035,497 — — 306,035,497
Time deposits — 333,069,743 — 333,069,743
Purchased Options — 1,259,460 — 1,259,460
Unrealised Gain on Forward Currency Contracts — 1,844,364 — 1,844,364
Unrealised Gain on Swap Contracts — 90,208 — 90,208
Unrealised Gain on Futures Contracts 9,582,737 — — 9,582,737
Total 315,618,234 336,263,775 — 651,882,009
Financial Liabilities at fair value
Written Options — (35,986) — (35,986)
Unrealised Loss on Forward Currency Contracts — (991,731) — (991,731)
Unrealised Loss on Swap Contracts — (65,729) — (65,729)
Total — (1,093,446) — (1,093,446)
21 Approval o f F inancia l Sta tements
The Board of Directors approved the audited Financial Statements on 12 March 2013.
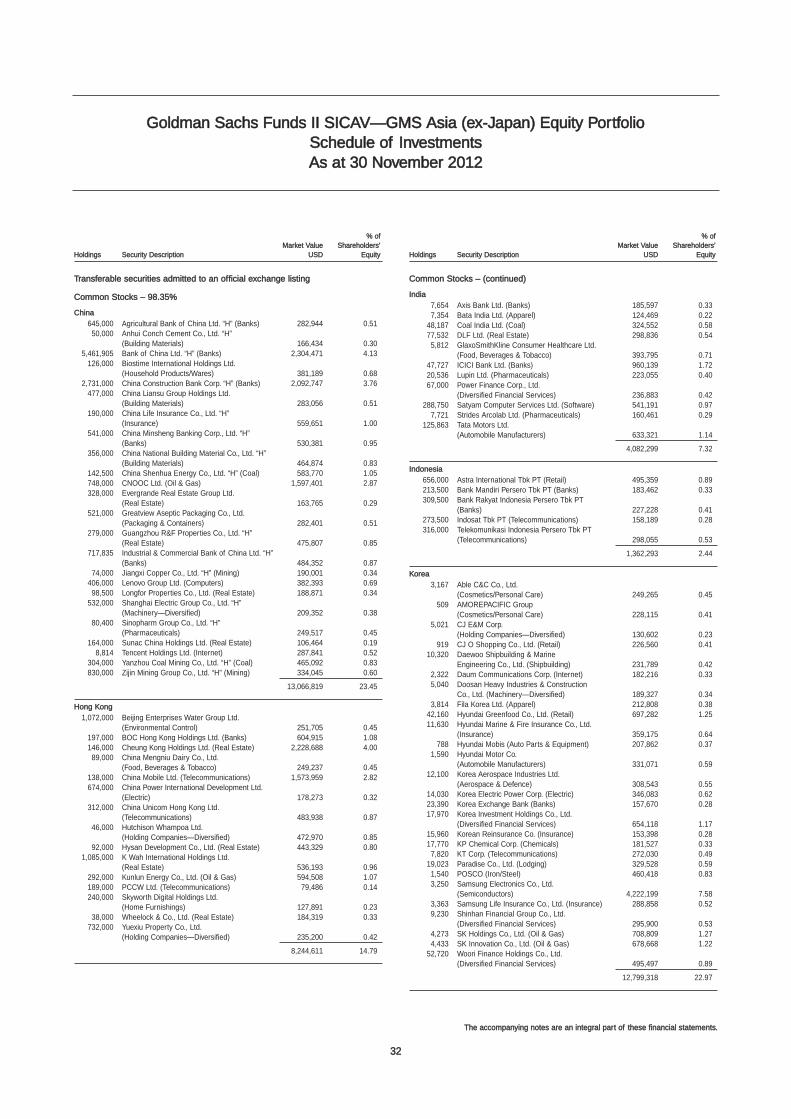
32
The accompanying notes are an integral part of these financial statements.
Schedule of InvestmentsAs at 30 November 2012
Common Stocks – (continued)
India
7,654 Axis Bank Ltd. (Banks) 185,597 0.337,354 Bata India Ltd. (Apparel) 124,469 0.22
48,187 Coal India Ltd. (Coal) 324,552 0.5877,532 DLF Ltd. (Real Estate) 298,836 0.545,812 GlaxoSmithKline Consumer Healthcare Ltd.
(Food, Beverages & Tobacco) 393,795 0.7147,727 ICICI Bank Ltd. (Banks) 960,139 1.7220,536 Lupin Ltd. (Pharmaceuticals) 223,055 0.4067,000 Power Finance Corp., Ltd.
(Diversified Financial Services) 236,883 0.42288,750 Satyam Computer Services Ltd. (Software) 541,191 0.97
7,721 Strides Arcolab Ltd. (Pharmaceuticals) 160,461 0.29125,863 Tata Motors Ltd.
(Automobile Manufacturers) 633,321 1.14
4,082,299 7.32
Indonesia
656,000 Astra International Tbk PT (Retail) 495,359 0.89213,500 Bank Mandiri Persero Tbk PT (Banks) 183,462 0.33309,500 Bank Rakyat Indonesia Persero Tbk PT
(Banks) 227,228 0.41273,500 Indosat Tbk PT (Telecommunications) 158,189 0.28316,000 Telekomunikasi Indonesia Persero Tbk PT
(Telecommunications) 298,055 0.53
1,362,293 2.44
Korea
3,167 Able C&C Co., Ltd. (Cosmetics/Personal Care) 249,265 0.45
509 AMOREPACIFIC Group (Cosmetics/Personal Care) 228,115 0.41
5,021 CJ E&M Corp. (Holding Companies—Diversified) 130,602 0.23
919 CJ O Shopping Co., Ltd. (Retail) 226,560 0.4110,320 Daewoo Shipbuilding & Marine
Engineering Co., Ltd. (Shipbuilding) 231,789 0.422,322 Daum Communications Corp. (Internet) 182,216 0.335,040 Doosan Heavy Industries & Construction
Co., Ltd. (Machinery—Diversified) 189,327 0.343,814 Fila Korea Ltd. (Apparel) 212,808 0.38
42,160 Hyundai Greenfood Co., Ltd. (Retail) 697,282 1.2511,630 Hyundai Marine & Fire Insurance Co., Ltd.
(Insurance) 359,175 0.64788 Hyundai Mobis (Auto Parts & Equipment) 207,862 0.37
1,590 Hyundai Motor Co. (Automobile Manufacturers) 331,071 0.59
12,100 Korea Aerospace Industries Ltd. (Aerospace & Defence) 308,543 0.55
14,030 Korea Electric Power Corp. (Electric) 346,083 0.6223,390 Korea Exchange Bank (Banks) 157,670 0.2817,970 Korea Investment Holdings Co., Ltd.
(Diversified Financial Services) 654,118 1.1715,960 Korean Reinsurance Co. (Insurance) 153,398 0.2817,770 KP Chemical Corp. (Chemicals) 181,527 0.337,820 KT Corp. (Telecommunications) 272,030 0.49
19,023 Paradise Co., Ltd. (Lodging) 329,528 0.591,540 POSCO (Iron/Steel) 460,418 0.833,250 Samsung Electronics Co., Ltd.
(Semiconductors) 4,222,199 7.583,363 Samsung Life Insurance Co., Ltd. (Insurance) 288,858 0.529,230 Shinhan Financial Group Co., Ltd.
(Diversified Financial Services) 295,900 0.534,273 SK Holdings Co., Ltd. (Oil & Gas) 708,809 1.274,433 SK Innovation Co., Ltd. (Oil & Gas) 678,668 1.22
52,720 Woori Finance Holdings Co., Ltd. (Diversified Financial Services) 495,497 0.89
12,799,318 22.97
Goldman Sachs Funds II SICAV—GMS Asia (ex-Japan) Equity Portfolio
Transferable securities admitted to an official exchange listing
Common Stocks – 98.35%
China
645,000 Agricultural Bank of China Ltd. “H” (Banks) 282,944 0.5150,000 Anhui Conch Cement Co., Ltd. “H”
(Building Materials) 166,434 0.305,461,905 Bank of China Ltd. “H” (Banks) 2,304,471 4.13
126,000 Biostime International Holdings Ltd. (Household Products/Wares) 381,189 0.68
2,731,000 China Construction Bank Corp. “H” (Banks) 2,092,747 3.76477,000 China Liansu Group Holdings Ltd.
(Building Materials) 283,056 0.51190,000 China Life Insurance Co., Ltd. “H”
(Insurance) 559,651 1.00541,000 China Minsheng Banking Corp., Ltd. “H”
(Banks) 530,381 0.95356,000 China National Building Material Co., Ltd. “H”
(Building Materials) 464,874 0.83142,500 China Shenhua Energy Co., Ltd. “H” (Coal) 583,770 1.05748,000 CNOOC Ltd. (Oil & Gas) 1,597,401 2.87328,000 Evergrande Real Estate Group Ltd.
(Real Estate) 163,765 0.29521,000 Greatview Aseptic Packaging Co., Ltd.
(Packaging & Containers) 282,401 0.51279,000 Guangzhou R&F Properties Co., Ltd. “H”
(Real Estate) 475,807 0.85717,835 Industrial & Commercial Bank of China Ltd. “H”
(Banks) 484,352 0.8774,000 Jiangxi Copper Co., Ltd. “H” (Mining) 190,001 0.34
406,000 Lenovo Group Ltd. (Computers) 382,393 0.6998,500 Longfor Properties Co., Ltd. (Real Estate) 188,871 0.34
532,000 Shanghai Electric Group Co., Ltd. “H” (Machinery—Diversified) 209,352 0.38
80,400 Sinopharm Group Co., Ltd. “H” (Pharmaceuticals) 249,517 0.45
164,000 Sunac China Holdings Ltd. (Real Estate) 106,464 0.198,814 Tencent Holdings Ltd. (Internet) 287,841 0.52
304,000 Yanzhou Coal Mining Co., Ltd. “H” (Coal) 465,092 0.83830,000 Zijin Mining Group Co., Ltd. “H” (Mining) 334,045 0.60
13,066,819 23.45
Hong Kong
1,072,000 Beijing Enterprises Water Group Ltd. (Environmental Control) 251,705 0.45
197,000 BOC Hong Kong Holdings Ltd. (Banks) 604,915 1.08146,000 Cheung Kong Holdings Ltd. (Real Estate) 2,228,688 4.0089,000 China Mengniu Dairy Co., Ltd.
(Food, Beverages & Tobacco) 249,237 0.45138,000 China Mobile Ltd. (Telecommunications) 1,573,959 2.82674,000 China Power International Development Ltd.
(Electric) 178,273 0.32312,000 China Unicom Hong Kong Ltd.
(Telecommunications) 483,938 0.8746,000 Hutchison Whampoa Ltd.
(Holding Companies—Diversified) 472,970 0.8592,000 Hysan Development Co., Ltd. (Real Estate) 443,329 0.80
1,085,000 K Wah International Holdings Ltd. (Real Estate) 536,193 0.96
292,000 Kunlun Energy Co., Ltd. (Oil & Gas) 594,508 1.07189,000 PCCW Ltd. (Telecommunications) 79,486 0.14240,000 Skyworth Digital Holdings Ltd.
(Home Furnishings) 127,891 0.2338,000 Wheelock & Co., Ltd. (Real Estate) 184,319 0.33
732,000 Yuexiu Property Co., Ltd. (Holding Companies—Diversified) 235,200 0.42
8,244,611 14.79
% ofMarket Value Shareholders’
Holdings Security Description USD Equity
% ofMarket Value Shareholders’
Holdings Security Description USD Equity
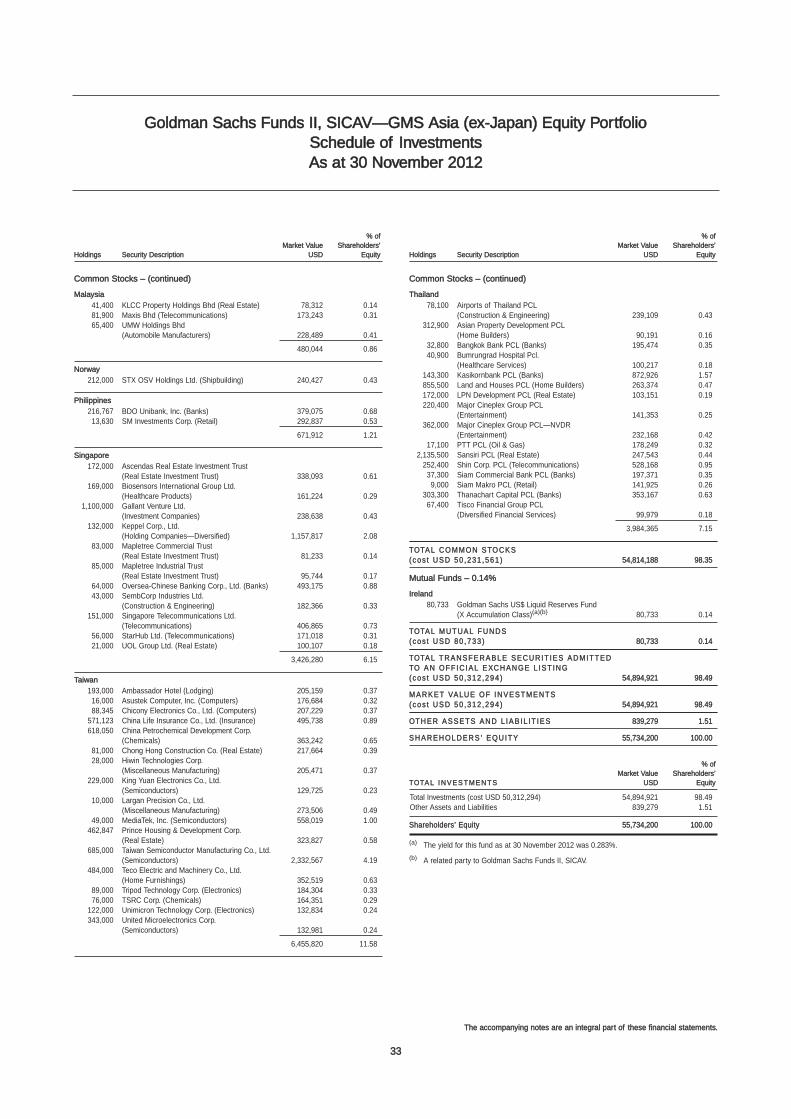
33
The accompanying notes are an integral part of these financial statements.
Schedule of InvestmentsAs at 30 November 2012
Goldman Sachs Funds II, SICAV—GMS Asia (ex-Japan) Equity Portfolio
Common Stocks – (continued)
Malaysia
41,400 KLCC Property Holdings Bhd (Real Estate) 78,312 0.1481,900 Maxis Bhd (Telecommunications) 173,243 0.3165,400 UMW Holdings Bhd
(Automobile Manufacturers) 228,489 0.41
480,044 0.86
Norway
212,000 STX OSV Holdings Ltd. (Shipbuilding) 240,427 0.43
Philippines
216,767 BDO Unibank, Inc. (Banks) 379,075 0.6813,630 SM Investments Corp. (Retail) 292,837 0.53
671,912 1.21
Singapore
172,000 Ascendas Real Estate Investment Trust (Real Estate Investment Trust) 338,093 0.61
169,000 Biosensors International Group Ltd. (Healthcare Products) 161,224 0.29
1,100,000 Gallant Venture Ltd. (Investment Companies) 238,638 0.43
132,000 Keppel Corp., Ltd. (Holding Companies—Diversified) 1,157,817 2.08
83,000 Mapletree Commercial Trust (Real Estate Investment Trust) 81,233 0.14
85,000 Mapletree Industrial Trust (Real Estate Investment Trust) 95,744 0.17
64,000 Oversea-Chinese Banking Corp., Ltd. (Banks) 493,175 0.8843,000 SembCorp Industries Ltd.
(Construction & Engineering) 182,366 0.33151,000 Singapore Telecommunications Ltd.
(Telecommunications) 406,865 0.7356,000 StarHub Ltd. (Telecommunications) 171,018 0.3121,000 UOL Group Ltd. (Real Estate) 100,107 0.18
3,426,280 6.15
Taiwan
193,000 Ambassador Hotel (Lodging) 205,159 0.3716,000 Asustek Computer, Inc. (Computers) 176,684 0.3288,345 Chicony Electronics Co., Ltd. (Computers) 207,229 0.37
571,123 China Life Insurance Co., Ltd. (Insurance) 495,738 0.89618,050 China Petrochemical Development Corp.
(Chemicals) 363,242 0.6581,000 Chong Hong Construction Co. (Real Estate) 217,664 0.3928,000 Hiwin Technologies Corp.
(Miscellaneous Manufacturing) 205,471 0.37229,000 King Yuan Electronics Co., Ltd.
(Semiconductors) 129,725 0.2310,000 Largan Precision Co., Ltd.
(Miscellaneous Manufacturing) 273,506 0.4949,000 MediaTek, Inc. (Semiconductors) 558,019 1.00
462,847 Prince Housing & Development Corp. (Real Estate) 323,827 0.58
685,000 Taiwan Semiconductor Manufacturing Co., Ltd. (Semiconductors) 2,332,567 4.19
484,000 Teco Electric and Machinery Co., Ltd. (Home Furnishings) 352,519 0.63
89,000 Tripod Technology Corp. (Electronics) 184,304 0.3376,000 TSRC Corp. (Chemicals) 164,351 0.29
122,000 Unimicron Technology Corp. (Electronics) 132,834 0.24343,000 United Microelectronics Corp.
(Semiconductors) 132,981 0.24
6,455,820 11.58
Common Stocks – (continued)
Thailand
78,100 Airports of Thailand PCL (Construction & Engineering) 239,109 0.43
312,900 Asian Property Development PCL (Home Builders) 90,191 0.16
32,800 Bangkok Bank PCL (Banks) 195,474 0.3540,900 Bumrungrad Hospital Pcl.
(Healthcare Services) 100,217 0.18143,300 Kasikornbank PCL (Banks) 872,926 1.57855,500 Land and Houses PCL (Home Builders) 263,374 0.47172,000 LPN Development PCL (Real Estate) 103,151 0.19220,400 Major Cineplex Group PCL
(Entertainment) 141,353 0.25362,000 Major Cineplex Group PCL—NVDR
(Entertainment) 232,168 0.4217,100 PTT PCL (Oil & Gas) 178,249 0.32
2,135,500 Sansiri PCL (Real Estate) 247,543 0.44252,400 Shin Corp. PCL (Telecommunications) 528,168 0.9537,300 Siam Commercial Bank PCL (Banks) 197,371 0.359,000 Siam Makro PCL (Retail) 141,925 0.26
303,300 Thanachart Capital PCL (Banks) 353,167 0.6367,400 Tisco Financial Group PCL
(Diversified Financial Services) 99,979 0.18
3,984,365 7.15
TOTAL COMMON STOCKS(cos t USD 50 ,231 ,561 ) 54,814,188 98.35
Mutual Funds – 0.14%
Ireland
80,733 Goldman Sachs US$ Liquid Reserves Fund (X Accumulation Class)(a)(b) 80,733 0.14
TOTAL MUTUAL FUNDS(cos t USD 80 ,733 ) 80,733 0.14
TOTAL TRANSFERA BLE SECURIT IES ADMITTED TO AN OFF IC IAL EXCHANGE L IST ING(cos t USD 50 ,312 ,294 ) 54,894,921 98.49
MARKET VALUE OF INVESTMENTS(cos t USD 50 ,312 ,294 ) 54,894,921 98.49
OTHER ASSETS AND L IA B IL IT IES 839,279 1.51
SHAREHOLDERS ’ EQUITY 55,734,200 100.00
% ofMarket Value Shareholders’
TOTAL INVESTMENTS USD Equity
Total Investments (cost USD 50,312,294) 54,894,921 98.49Other Assets and Liabilities 839,279 1.51
Shareholders’ Equity 55,734,200 100.00
(a) The yield for this fund as at 30 November 2012 was 0.283%.
(b) A related party to Goldman Sachs Funds II, SICAV.
% ofMarket Value Shareholders’
Holdings Security Description USD Equity
% ofMarket Value Shareholders’
Holdings Security Description USD Equity
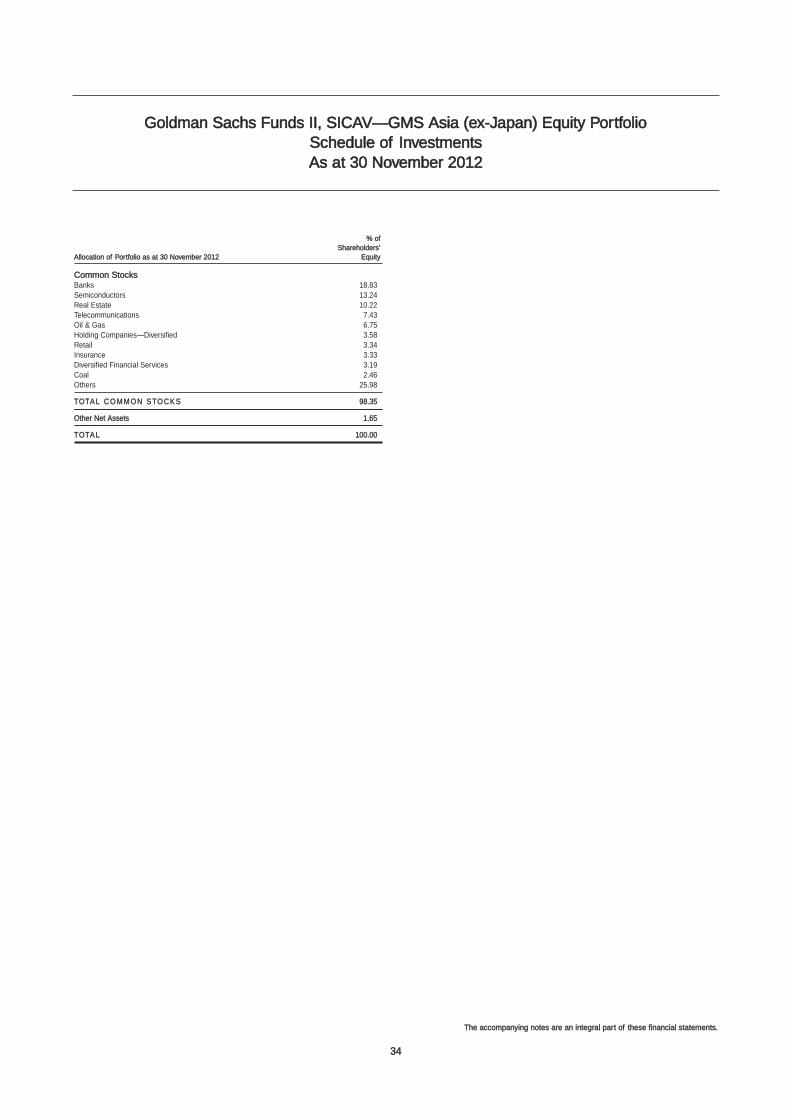
34
The accompanying notes are an integral part of these financial statements.
Schedule of InvestmentsAs at 30 November 2012
Goldman Sachs Funds II, SICAV—GMS Asia (ex-Japan) Equity Portfolio
% ofShareholders’
Allocation of Portfolio as at 30 November 2012 Equity
Common StocksBanks 18.83Semiconductors 13.24Real Estate 10.22Telecommunications 7.43Oil & Gas 6.75Holding Companies—Diversified 3.58Retail 3.34Insurance 3.33Diversified Financial Services 3.19Coal 2.46Others 25.98
TOTAL COMMON STOCKS 98.35
Other Net Assets 1.65
TOTAL 100.00
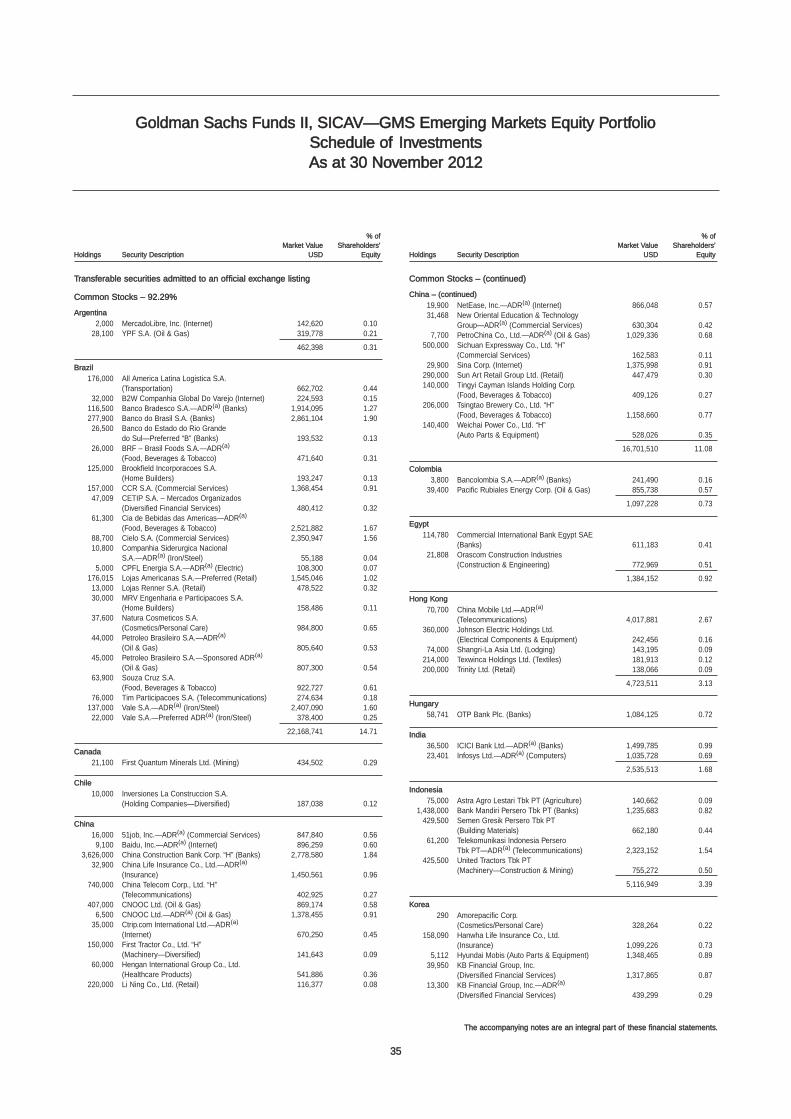
35
The accompanying notes are an integral part of these financial statements.
Schedule of InvestmentsAs at 30 November 2012
Goldman Sachs Funds II, SICAV—GMS Emerging Markets Equity Portfolio
Transferable securities admitted to an official exchange listing
Common Stocks – 92.29%
Argentina
2,000 MercadoLibre, Inc. (Internet) 142,620 0.1028,100 YPF S.A. (Oil & Gas) 319,778 0.21
462,398 0.31
Brazil
176,000 All America Latina Logistica S.A. (Transportation) 662,702 0.44
32,000 B2W Companhia Global Do Varejo (Internet) 224,593 0.15116,500 Banco Bradesco S.A.—ADR(a) (Banks) 1,914,095 1.27277,900 Banco do Brasil S.A. (Banks) 2,861,104 1.9026,500 Banco do Estado do Rio Grande
do Sul—Preferred “B” (Banks) 193,532 0.1326,000 BRF – Brasil Foods S.A.—ADR(a)
(Food, Beverages & Tobacco) 471,640 0.31125,000 Brookfield Incorporacoes S.A.
(Home Builders) 193,247 0.13157,000 CCR S.A. (Commercial Services) 1,368,454 0.9147,009 CETIP S.A. – Mercados Organizados
(Diversified Financial Services) 480,412 0.3261,300 Cia de Bebidas das Americas—ADR(a)
(Food, Beverages & Tobacco) 2,521,882 1.6788,700 Cielo S.A. (Commercial Services) 2,350,947 1.5610,800 Companhia Siderurgica Nacional
S.A.—ADR(a) (Iron/Steel) 55,188 0.045,000 CPFL Energia S.A.—ADR(a) (Electric) 108,300 0.07
176,015 Lojas Americanas S.A.—Preferred (Retail) 1,545,046 1.0213,000 Lojas Renner S.A. (Retail) 478,522 0.3230,000 MRV Engenharia e Participacoes S.A.
(Home Builders) 158,486 0.1137,600 Natura Cosmeticos S.A.
(Cosmetics/Personal Care) 984,800 0.6544,000 Petroleo Brasileiro S.A.—ADR(a)
(Oil & Gas) 805,640 0.5345,000 Petroleo Brasileiro S.A.—Sponsored ADR(a)
(Oil & Gas) 807,300 0.5463,900 Souza Cruz S.A.
(Food, Beverages & Tobacco) 922,727 0.6176,000 Tim Participacoes S.A. (Telecommunications) 274,634 0.18
137,000 Vale S.A.—ADR(a) (Iron/Steel) 2,407,090 1.6022,000 Vale S.A.—Preferred ADR(a) (Iron/Steel) 378,400 0.25
22,168,741 14.71
Canada
21,100 First Quantum Minerals Ltd. (Mining) 434,502 0.29
Chile
10,000 Inversiones La Construccion S.A. (Holding Companies—Diversified) 187,038 0.12
China
16,000 51job, Inc.—ADR(a) (Commercial Services) 847,840 0.569,100 Baidu, Inc.—ADR(a) (Internet) 896,259 0.60
3,626,000 China Construction Bank Corp. “H” (Banks) 2,778,580 1.8432,900 China Life Insurance Co., Ltd.—ADR(a)
(Insurance) 1,450,561 0.96740,000 China Telecom Corp., Ltd. “H”
(Telecommunications) 402,925 0.27407,000 CNOOC Ltd. (Oil & Gas) 869,174 0.58
6,500 CNOOC Ltd.—ADR(a) (Oil & Gas) 1,378,455 0.9135,000 Ctrip.com International Ltd.—ADR(a)
(Internet) 670,250 0.45150,000 First Tractor Co., Ltd. “H”
(Machinery—Diversified) 141,643 0.0960,000 Hengan International Group Co., Ltd.
(Healthcare Products) 541,886 0.36220,000 Li Ning Co., Ltd. (Retail) 116,377 0.08
Common Stocks – (continued)
China – (continued)
19,900 NetEase, Inc.—ADR(a) (Internet) 866,048 0.5731,468 New Oriental Education & Technology
Group—ADR(a) (Commercial Services) 630,304 0.427,700 PetroChina Co., Ltd.—ADR(a) (Oil & Gas) 1,029,336 0.68
500,000 Sichuan Expressway Co., Ltd. “H” (Commercial Services) 162,583 0.11
29,900 Sina Corp. (Internet) 1,375,998 0.91290,000 Sun Art Retail Group Ltd. (Retail) 447,479 0.30140,000 Tingyi Cayman Islands Holding Corp.
(Food, Beverages & Tobacco) 409,126 0.27206,000 Tsingtao Brewery Co., Ltd. “H”
(Food, Beverages & Tobacco) 1,158,660 0.77140,400 Weichai Power Co., Ltd. “H”
(Auto Parts & Equipment) 528,026 0.35
16,701,510 11.08
Colombia
3,800 Bancolombia S.A.—ADR(a) (Banks) 241,490 0.1639,400 Pacific Rubiales Energy Corp. (Oil & Gas) 855,738 0.57
1,097,228 0.73
Egypt
114,780 Commercial International Bank Egypt SAE (Banks) 611,183 0.41
21,808 Orascom Construction Industries (Construction & Engineering) 772,969 0.51
1,384,152 0.92
Hong Kong
70,700 China Mobile Ltd.—ADR(a)
(Telecommunications) 4,017,881 2.67360,000 Johnson Electric Holdings Ltd.
(Electrical Components & Equipment) 242,456 0.1674,000 Shangri-La Asia Ltd. (Lodging) 143,195 0.09
214,000 Texwinca Holdings Ltd. (Textiles) 181,913 0.12200,000 Trinity Ltd. (Retail) 138,066 0.09
4,723,511 3.13
Hungary
58,741 OTP Bank Plc. (Banks) 1,084,125 0.72
India
36,500 ICICI Bank Ltd.—ADR(a) (Banks) 1,499,785 0.9923,401 Infosys Ltd.—ADR(a) (Computers) 1,035,728 0.69
2,535,513 1.68
Indonesia
75,000 Astra Agro Lestari Tbk PT (Agriculture) 140,662 0.091,438,000 Bank Mandiri Persero Tbk PT (Banks) 1,235,683 0.82
429,500 Semen Gresik Persero Tbk PT (Building Materials) 662,180 0.44
61,200 Telekomunikasi Indonesia Persero Tbk PT—ADR(a) (Telecommunications) 2,323,152 1.54
425,500 United Tractors Tbk PT (Machinery—Construction & Mining) 755,272 0.50
5,116,949 3.39
Korea
290 Amorepacific Corp. (Cosmetics/Personal Care) 328,264 0.22
158,090 Hanwha Life Insurance Co., Ltd. (Insurance) 1,099,226 0.73
5,112 Hyundai Mobis (Auto Parts & Equipment) 1,348,465 0.8939,950 KB Financial Group, Inc.
(Diversified Financial Services) 1,317,865 0.8713,300 KB Financial Group, Inc.—ADR(a)
(Diversified Financial Services) 439,299 0.29
% ofMarket Value Shareholders’
Holdings Security Description USD Equity
% ofMarket Value Shareholders’
Holdings Security Description USD Equity
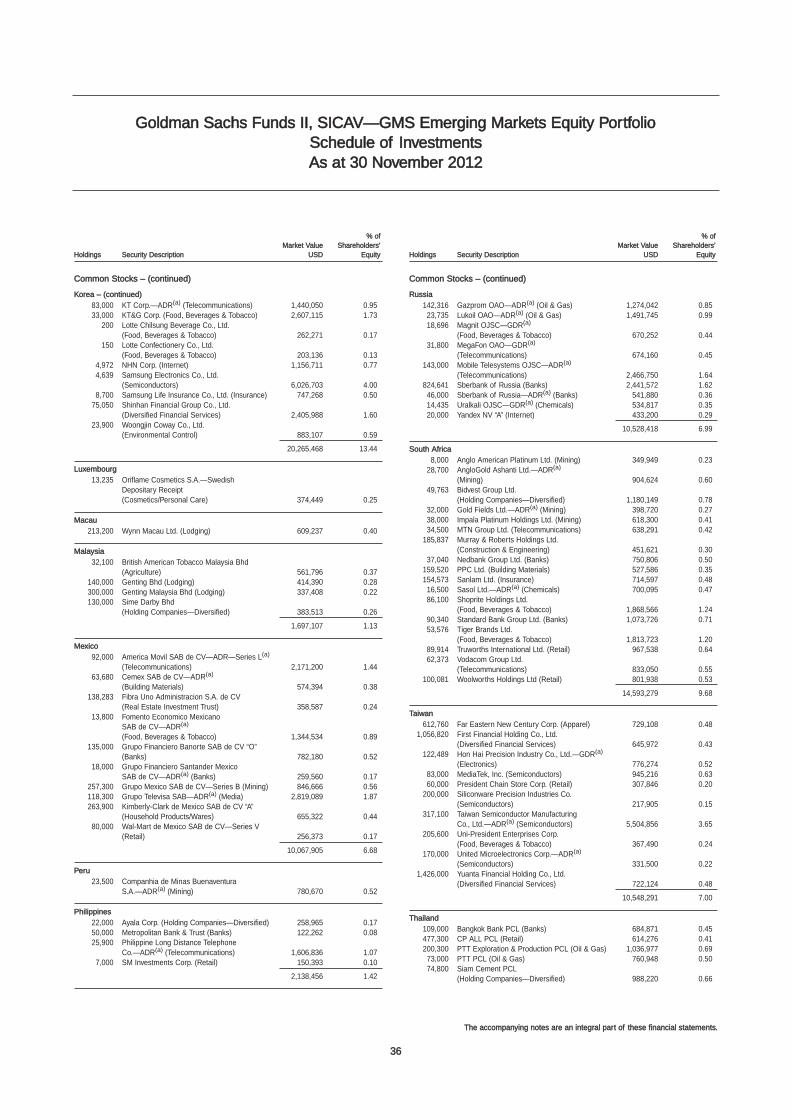
36
The accompanying notes are an integral part of these financial statements.
Schedule of InvestmentsAs at 30 November 2012
Goldman Sachs Funds II, SICAV—GMS Emerging Markets Equity Portfolio
Common Stocks – (continued)
Korea – (continued)
83,000 KT Corp.—ADR(a) (Telecommunications) 1,440,050 0.9533,000 KT&G Corp. (Food, Beverages & Tobacco) 2,607,115 1.73
200 Lotte Chilsung Beverage Co., Ltd. (Food, Beverages & Tobacco) 262,271 0.17
150 Lotte Confectionery Co., Ltd. (Food, Beverages & Tobacco) 203,136 0.13
4,972 NHN Corp. (Internet) 1,156,711 0.774,639 Samsung Electronics Co., Ltd.
(Semiconductors) 6,026,703 4.008,700 Samsung Life Insurance Co., Ltd. (Insurance) 747,268 0.50
75,050 Shinhan Financial Group Co., Ltd. (Diversified Financial Services) 2,405,988 1.60
23,900 Woongjin Coway Co., Ltd. (Environmental Control) 883,107 0.59
20,265,468 13.44
Luxembourg
13,235 Oriflame Cosmetics S.A.—Swedish Depositary Receipt (Cosmetics/Personal Care) 374,449 0.25
Macau
213,200 Wynn Macau Ltd. (Lodging) 609,237 0.40
Malaysia
32,100 British American Tobacco Malaysia Bhd (Agriculture) 561,796 0.37
140,000 Genting Bhd (Lodging) 414,390 0.28300,000 Genting Malaysia Bhd (Lodging) 337,408 0.22130,000 Sime Darby Bhd
(Holding Companies—Diversified) 383,513 0.26
1,697,107 1.13
Mexico
92,000 America Movil SAB de CV—ADR—Series L(a)
(Telecommunications) 2,171,200 1.4463,680 Cemex SAB de CV—ADR(a)
(Building Materials) 574,394 0.38138,283 Fibra Uno Administracion S.A. de CV
(Real Estate Investment Trust) 358,587 0.2413,800 Fomento Economico Mexicano
SAB de CV—ADR(a)
(Food, Beverages & Tobacco) 1,344,534 0.89135,000 Grupo Financiero Banorte SAB de CV “O”
(Banks) 782,180 0.5218,000 Grupo Financiero Santander Mexico
SAB de CV—ADR(a) (Banks) 259,560 0.17257,300 Grupo Mexico SAB de CV—Series B (Mining) 846,666 0.56118,300 Grupo Televisa SAB—ADR(a) (Media) 2,819,089 1.87263,900 Kimberly-Clark de Mexico SAB de CV “A”
(Household Products/Wares) 655,322 0.4480,000 Wal-Mart de Mexico SAB de CV—Series V
(Retail) 256,373 0.17
10,067,905 6.68
Peru
23,500 Companhia de Minas Buenaventura S.A.—ADR(a) (Mining) 780,670 0.52
Philippines
22,000 Ayala Corp. (Holding Companies—Diversified) 258,965 0.1750,000 Metropolitan Bank & Trust (Banks) 122,262 0.0825,900 Philippine Long Distance Telephone
Co.—ADR(a) (Telecommunications) 1,606,836 1.077,000 SM Investments Corp. (Retail) 150,393 0.10
2,138,456 1.42
Common Stocks – (continued)
Russia
142,316 Gazprom OAO—ADR(a) (Oil & Gas) 1,274,042 0.8523,735 Lukoil OAO—ADR(a) (Oil & Gas) 1,491,745 0.9918,696 Magnit OJSC—GDR(a)
(Food, Beverages & Tobacco) 670,252 0.4431,800 MegaFon OAO—GDR(a)
(Telecommunications) 674,160 0.45143,000 Mobile Telesystems OJSC—ADR(a)
(Telecommunications) 2,466,750 1.64824,641 Sberbank of Russia (Banks) 2,441,572 1.6246,000 Sberbank of Russia—ADR(a) (Banks) 541,880 0.3614,435 Uralkali OJSC—GDR(a) (Chemicals) 534,817 0.3520,000 Yandex NV “A” (Internet) 433,200 0.29
10,528,418 6.99
South Africa
8,000 Anglo American Platinum Ltd. (Mining) 349,949 0.2328,700 AngloGold Ashanti Ltd.—ADR(a)
(Mining) 904,624 0.6049,763 Bidvest Group Ltd.
(Holding Companies—Diversified) 1,180,149 0.7832,000 Gold Fields Ltd.—ADR(a) (Mining) 398,720 0.2738,000 Impala Platinum Holdings Ltd. (Mining) 618,300 0.4134,500 MTN Group Ltd. (Telecommunications) 638,291 0.42
185,837 Murray & Roberts Holdings Ltd. (Construction & Engineering) 451,621 0.30
37,040 Nedbank Group Ltd. (Banks) 750,806 0.50159,520 PPC Ltd. (Building Materials) 527,586 0.35154,573 Sanlam Ltd. (Insurance) 714,597 0.4816,500 Sasol Ltd.—ADR(a) (Chemicals) 700,095 0.4786,100 Shoprite Holdings Ltd.
(Food, Beverages & Tobacco) 1,868,566 1.2490,340 Standard Bank Group Ltd. (Banks) 1,073,726 0.7153,576 Tiger Brands Ltd.
(Food, Beverages & Tobacco) 1,813,723 1.2089,914 Truworths International Ltd. (Retail) 967,538 0.6462,373 Vodacom Group Ltd.
(Telecommunications) 833,050 0.55100,081 Woolworths Holdings Ltd (Retail) 801,938 0.53
14,593,279 9.68
Taiwan
612,760 Far Eastern New Century Corp. (Apparel) 729,108 0.481,056,820 First Financial Holding Co., Ltd.
(Diversified Financial Services) 645,972 0.43122,489 Hon Hai Precision Industry Co., Ltd.—GDR(a)
(Electronics) 776,274 0.5283,000 MediaTek, Inc. (Semiconductors) 945,216 0.6360,000 President Chain Store Corp. (Retail) 307,846 0.20
200,000 Siliconware Precision Industries Co. (Semiconductors) 217,905 0.15
317,100 Taiwan Semiconductor Manufacturing Co., Ltd.—ADR(a) (Semiconductors) 5,504,856 3.65
205,600 Uni-President Enterprises Corp. (Food, Beverages & Tobacco) 367,490 0.24
170,000 United Microelectronics Corp.—ADR(a)
(Semiconductors) 331,500 0.221,426,000 Yuanta Financial Holding Co., Ltd.
(Diversified Financial Services) 722,124 0.48
10,548,291 7.00
Thailand
109,000 Bangkok Bank PCL (Banks) 684,871 0.45477,300 CP ALL PCL (Retail) 614,276 0.41200,300 PTT Exploration & Production PCL (Oil & Gas) 1,036,977 0.6973,000 PTT PCL (Oil & Gas) 760,948 0.5074,800 Siam Cement PCL
(Holding Companies—Diversified) 988,220 0.66
% ofMarket Value Shareholders’
Holdings Security Description USD Equity
% ofMarket Value Shareholders’
Holdings Security Description USD Equity
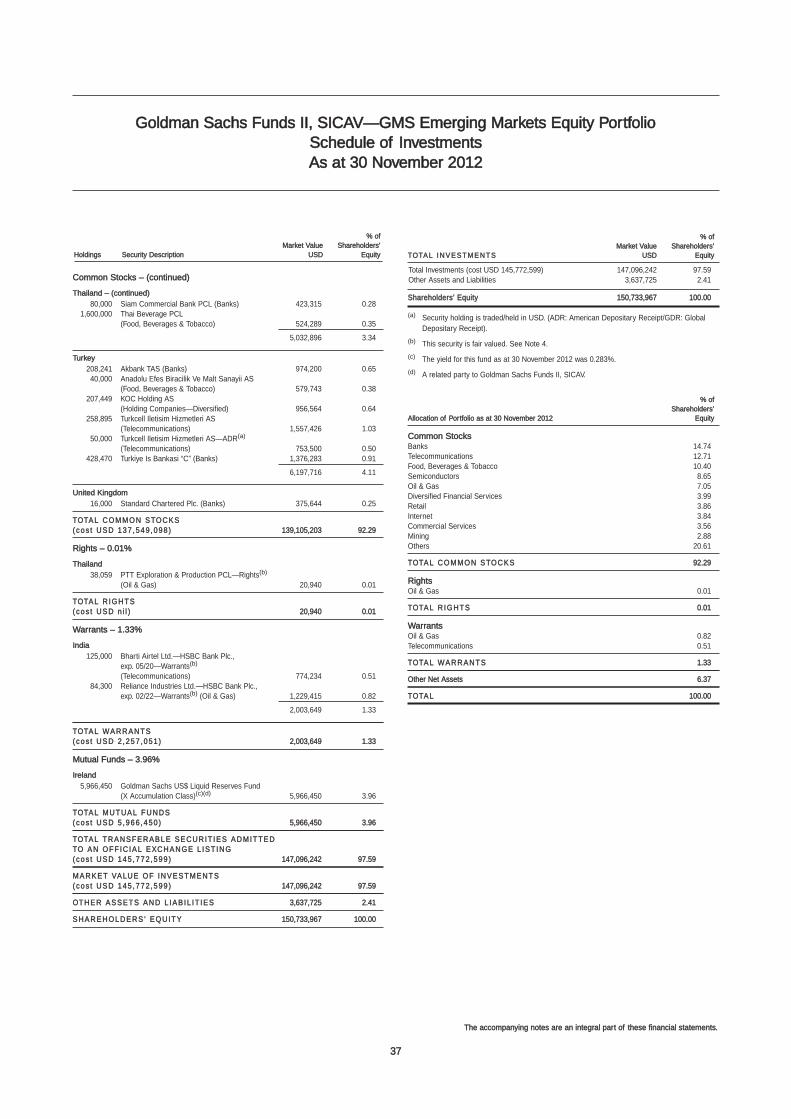
37
The accompanying notes are an integral part of these financial statements.
Schedule of InvestmentsAs at 30 November 2012
Goldman Sachs Funds II, SICAV—GMS Emerging Markets Equity Portfolio
Common Stocks – (continued)
Thailand – (continued)
80,000 Siam Commercial Bank PCL (Banks) 423,315 0.281,600,000 Thai Beverage PCL
(Food, Beverages & Tobacco) 524,289 0.35
5,032,896 3.34
Turkey
208,241 Akbank TAS (Banks) 974,200 0.6540,000 Anadolu Efes Biracilik Ve Malt Sanayii AS
(Food, Beverages & Tobacco) 579,743 0.38207,449 KOC Holding AS
(Holding Companies—Diversified) 956,564 0.64258,895 Turkcell Iletisim Hizmetleri AS
(Telecommunications) 1,557,426 1.0350,000 Turkcell Iletisim Hizmetleri AS—ADR(a)
(Telecommunications) 753,500 0.50428,470 Turkiye Is Bankasi “C” (Banks) 1,376,283 0.91
6,197,716 4.11
United Kingdom
16,000 Standard Chartered Plc. (Banks) 375,644 0.25
TOTAL COMMON STOCKS(cos t USD 137 ,549 ,098 ) 139,105,203 92.29
Rights – 0.01%
Thailand
38,059 PTT Exploration & Production PCL—Rights(b)
(Oil & Gas) 20,940 0.01
TOTAL R IGHTS(cos t USD n i l ) 20,940 0.01
Warrants – 1.33%
India
125,000 Bharti Airtel Ltd.—HSBC Bank Plc., exp. 05/20—Warrants(b)
(Telecommunications) 774,234 0.5184,300 Reliance Industries Ltd.—HSBC Bank Plc.,
exp. 02/22—Warrants(b) (Oil & Gas) 1,229,415 0.82
2,003,649 1.33
TOTAL WARRANTS(cos t USD 2 ,257 ,051 ) 2,003,649 1.33
Mutual Funds – 3.96%
Ireland
5,966,450 Goldman Sachs US$ Liquid Reserves Fund (X Accumulation Class)(c)(d) 5,966,450 3.96
TOTAL MUTUAL FUNDS(cos t USD 5 ,966 ,450 ) 5,966,450 3.96
TOTAL TRANSFERA BLE SECURIT IES ADMITTED TO AN OFF IC IAL EXCHANGE L IST ING(cos t USD 145 ,772 ,599 ) 147,096,242 97.59
MARKET VALUE OF INVESTMENTS(cos t USD 145 ,772 ,599 ) 147,096,242 97.59
OTHER ASSETS AND L IA B IL IT IES 3,637,725 2.41
SHAREHOLDERS ’ EQUITY 150,733,967 100.00
% ofMarket Value Shareholders’
TOTAL INVESTMENTS USD Equity
Total Investments (cost USD 145,772,599) 147,096,242 97.59Other Assets and Liabilities 3,637,725 2.41
Shareholders’ Equity 150,733,967 100.00
(a) Security holding is traded/held in USD. (ADR: American Depositary Receipt/GDR: GlobalDepositary Receipt).
(b) This security is fair valued. See Note 4.
(c) The yield for this fund as at 30 November 2012 was 0.283%.
(d) A related party to Goldman Sachs Funds II, SICAV.
% ofShareholders’
Allocation of Portfolio as at 30 November 2012 Equity
Common StocksBanks 14.74Telecommunications 12.71Food, Beverages & Tobacco 10.40Semiconductors 8.65Oil & Gas 7.05Diversified Financial Services 3.99Retail 3.86Internet 3.84Commercial Services 3.56Mining 2.88Others 20.61
TOTAL COMMON STOCKS 92.29
RightsOil & Gas 0.01
TOTAL R IGHTS 0.01
WarrantsOil & Gas 0.82Telecommunications 0.51
TOTAL WARRANTS 1.33
Other Net Assets 6.37
TOTAL 100.00
% ofMarket Value Shareholders’
Holdings Security Description USD Equity
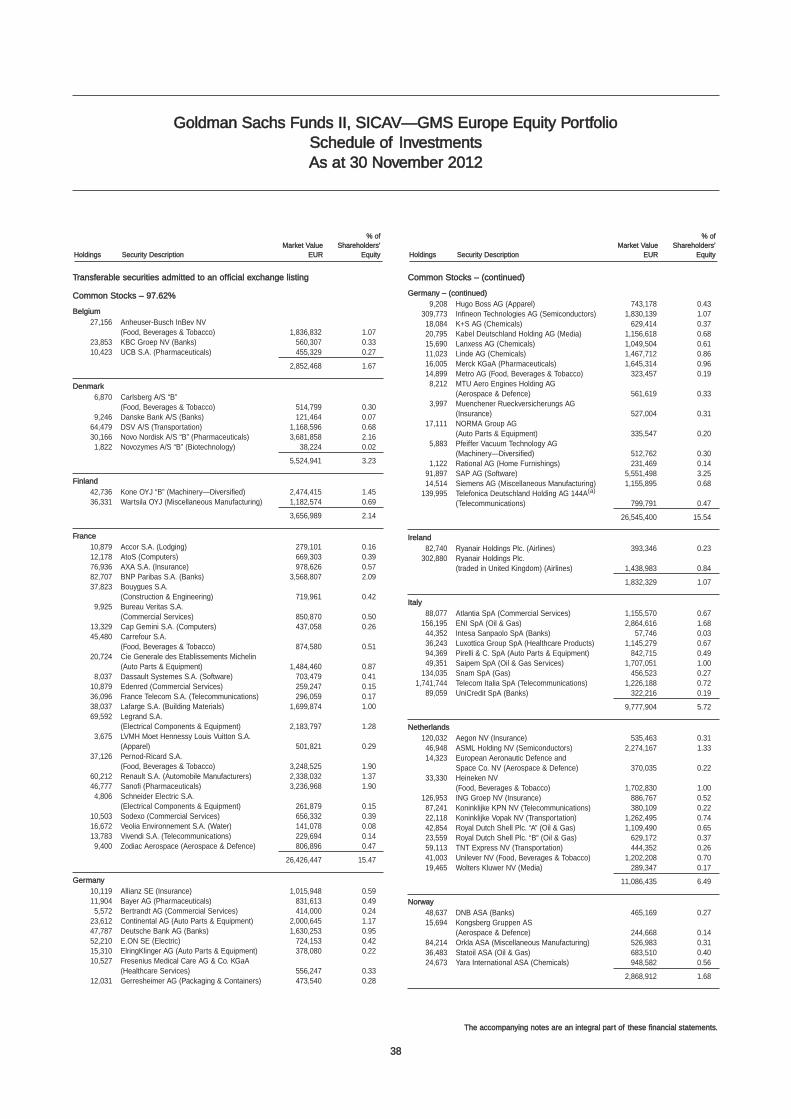
38
The accompanying notes are an integral part of these financial statements.
Schedule of InvestmentsAs at 30 November 2012
Goldman Sachs Funds II, SICAV—GMS Europe Equity Portfolio
Transferable securities admitted to an official exchange listing
Common Stocks – 97.62%
Belgium
27,156 Anheuser-Busch InBev NV (Food, Beverages & Tobacco) 1,836,832 1.07
23,853 KBC Groep NV (Banks) 560,307 0.3310,423 UCB S.A. (Pharmaceuticals) 455,329 0.27
2,852,468 1.67
Denmark
6,870 Carlsberg A/S “B” (Food, Beverages & Tobacco) 514,799 0.30
9,246 Danske Bank A/S (Banks) 121,464 0.0764,479 DSV A/S (Transportation) 1,168,596 0.6830,166 Novo Nordisk A/S “B” (Pharmaceuticals) 3,681,858 2.161,822 Novozymes A/S “B” (Biotechnology) 38,224 0.02
5,524,941 3.23
Finland
42,736 Kone OYJ “B” (Machinery—Diversified) 2,474,415 1.4536,331 Wartsila OYJ (Miscellaneous Manufacturing) 1,182,574 0.69
3,656,989 2.14
France
10,879 Accor S.A. (Lodging) 279,101 0.1612,178 AtoS (Computers) 669,303 0.3976,936 AXA S.A. (Insurance) 978,626 0.5782,707 BNP Paribas S.A. (Banks) 3,568,807 2.0937,823 Bouygues S.A.
(Construction & Engineering) 719,961 0.429,925 Bureau Veritas S.A.
(Commercial Services) 850,870 0.5013,329 Cap Gemini S.A. (Computers) 437,058 0.2645,480 Carrefour S.A.
(Food, Beverages & Tobacco) 874,580 0.5120,724 Cie Generale des Etablissements Michelin
(Auto Parts & Equipment) 1,484,460 0.878,037 Dassault Systemes S.A. (Software) 703,479 0.41
10,879 Edenred (Commercial Services) 259,247 0.1536,096 France Telecom S.A. (Telecommunications) 296,059 0.1738,037 Lafarge S.A. (Building Materials) 1,699,874 1.0069,592 Legrand S.A.
(Electrical Components & Equipment) 2,183,797 1.283,675 LVMH Moet Hennessy Louis Vuitton S.A.
(Apparel) 501,821 0.2937,126 Pernod-Ricard S.A.
(Food, Beverages & Tobacco) 3,248,525 1.9060,212 Renault S.A. (Automobile Manufacturers) 2,338,032 1.3746,777 Sanofi (Pharmaceuticals) 3,236,968 1.904,806 Schneider Electric S.A.
(Electrical Components & Equipment) 261,879 0.1510,503 Sodexo (Commercial Services) 656,332 0.3916,672 Veolia Environnement S.A. (Water) 141,078 0.0813,783 Vivendi S.A. (Telecommunications) 229,694 0.149,400 Zodiac Aerospace (Aerospace & Defence) 806,896 0.47
26,426,447 15.47
Germany
10,119 Allianz SE (Insurance) 1,015,948 0.5911,904 Bayer AG (Pharmaceuticals) 831,613 0.495,572 Bertrandt AG (Commercial Services) 414,000 0.24
23,612 Continental AG (Auto Parts & Equipment) 2,000,645 1.1747,787 Deutsche Bank AG (Banks) 1,630,253 0.9552,210 E.ON SE (Electric) 724,153 0.4215,310 ElringKlinger AG (Auto Parts & Equipment) 378,080 0.2210,527 Fresenius Medical Care AG & Co. KGaA
(Healthcare Services) 556,247 0.3312,031 Gerresheimer AG (Packaging & Containers) 473,540 0.28
Common Stocks – (continued)
Germany – (continued)
9,208 Hugo Boss AG (Apparel) 743,178 0.43309,773 Infineon Technologies AG (Semiconductors) 1,830,139 1.0718,084 K+S AG (Chemicals) 629,414 0.3720,795 Kabel Deutschland Holding AG (Media) 1,156,618 0.6815,690 Lanxess AG (Chemicals) 1,049,504 0.6111,023 Linde AG (Chemicals) 1,467,712 0.8616,005 Merck KGaA (Pharmaceuticals) 1,645,314 0.9614,899 Metro AG (Food, Beverages & Tobacco) 323,457 0.198,212 MTU Aero Engines Holding AG
(Aerospace & Defence) 561,619 0.333,997 Muenchener Rueckversicherungs AG
(Insurance) 527,004 0.3117,111 NORMA Group AG
(Auto Parts & Equipment) 335,547 0.205,883 Pfeiffer Vacuum Technology AG
(Machinery—Diversified) 512,762 0.301,122 Rational AG (Home Furnishings) 231,469 0.14
91,897 SAP AG (Software) 5,551,498 3.2514,514 Siemens AG (Miscellaneous Manufacturing) 1,155,895 0.68
139,995 Telefonica Deutschland Holding AG 144A(a)
(Telecommunications) 799,791 0.47
26,545,400 15.54
Ireland
82,740 Ryanair Holdings Plc. (Airlines) 393,346 0.23302,880 Ryanair Holdings Plc.
(traded in United Kingdom) (Airlines) 1,438,983 0.84
1,832,329 1.07
Italy
88,077 Atlantia SpA (Commercial Services) 1,155,570 0.67156,195 ENI SpA (Oil & Gas) 2,864,616 1.6844,352 Intesa Sanpaolo SpA (Banks) 57,746 0.0336,243 Luxottica Group SpA (Healthcare Products) 1,145,279 0.6794,369 Pirelli & C. SpA (Auto Parts & Equipment) 842,715 0.4949,351 Saipem SpA (Oil & Gas Services) 1,707,051 1.00
134,035 Snam SpA (Gas) 456,523 0.271,741,744 Telecom Italia SpA (Telecommunications) 1,226,188 0.72
89,059 UniCredit SpA (Banks) 322,216 0.19
9,777,904 5.72
Netherlands
120,032 Aegon NV (Insurance) 535,463 0.3146,948 ASML Holding NV (Semiconductors) 2,274,167 1.3314,323 European Aeronautic Defence and
Space Co. NV (Aerospace & Defence) 370,035 0.2233,330 Heineken NV
(Food, Beverages & Tobacco) 1,702,830 1.00126,953 ING Groep NV (Insurance) 886,767 0.5287,241 Koninklijke KPN NV (Telecommunications) 380,109 0.2222,118 Koninklijke Vopak NV (Transportation) 1,262,495 0.7442,854 Royal Dutch Shell Plc. “A” (Oil & Gas) 1,109,490 0.6523,559 Royal Dutch Shell Plc. “B” (Oil & Gas) 629,172 0.3759,113 TNT Express NV (Transportation) 444,352 0.2641,003 Unilever NV (Food, Beverages & Tobacco) 1,202,208 0.7019,465 Wolters Kluwer NV (Media) 289,347 0.17
11,086,435 6.49
Norway
48,637 DNB ASA (Banks) 465,169 0.2715,694 Kongsberg Gruppen AS
(Aerospace & Defence) 244,668 0.1484,214 Orkla ASA (Miscellaneous Manufacturing) 526,983 0.3136,483 Statoil ASA (Oil & Gas) 683,510 0.4024,673 Yara International ASA (Chemicals) 948,582 0.56
2,868,912 1.68
% ofMarket Value Shareholders’
Holdings Security Description EUR Equity
% ofMarket Value Shareholders’
Holdings Security Description EUR Equity
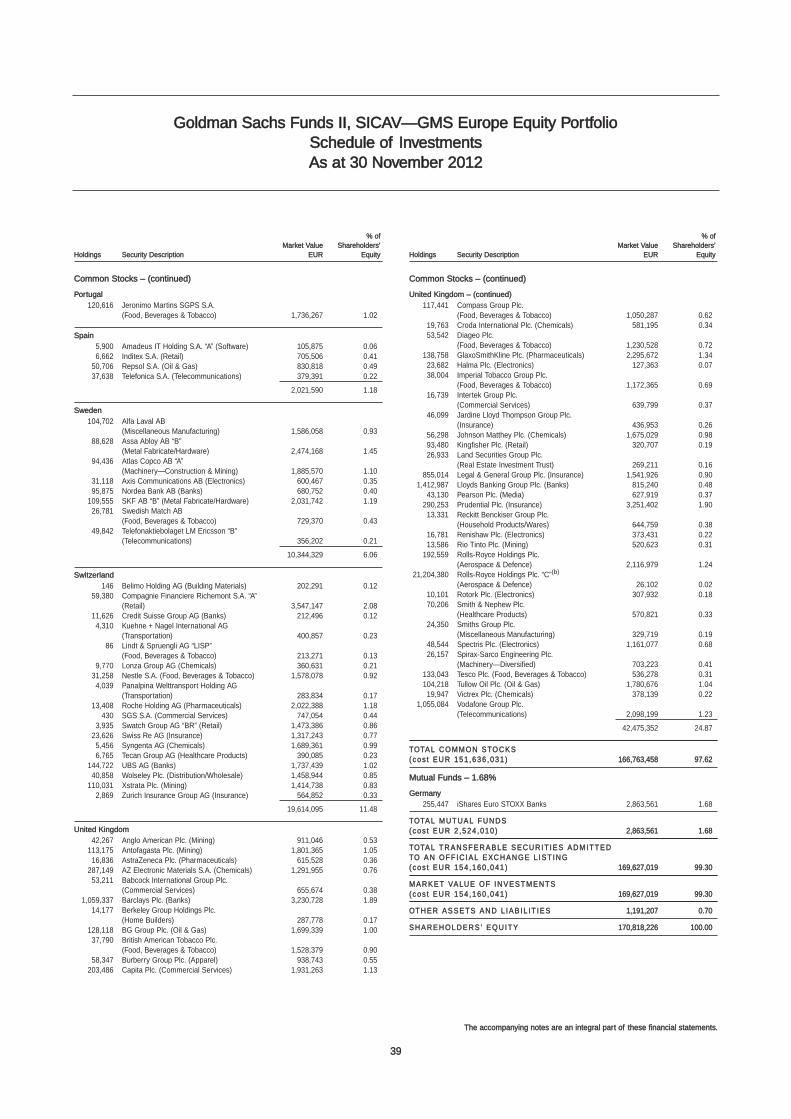
39
The accompanying notes are an integral part of these financial statements.
Schedule of InvestmentsAs at 30 November 2012
Goldman Sachs Funds II, SICAV—GMS Europe Equity Portfolio
Common Stocks – (continued)
Portugal
120,616 Jeronimo Martins SGPS S.A. (Food, Beverages & Tobacco) 1,736,267 1.02
Spain
5,900 Amadeus IT Holding S.A. “A” (Software) 105,875 0.066,662 Inditex S.A. (Retail) 705,506 0.41
50,706 Repsol S.A. (Oil & Gas) 830,818 0.4937,638 Telefonica S.A. (Telecommunications) 379,391 0.22
2,021,590 1.18
Sweden
104,702 Alfa Laval AB (Miscellaneous Manufacturing) 1,586,058 0.93
88,628 Assa Abloy AB “B” (Metal Fabricate/Hardware) 2,474,168 1.45
94,436 Atlas Copco AB “A” (Machinery—Construction & Mining) 1,885,570 1.10
31,118 Axis Communications AB (Electronics) 600,467 0.3595,875 Nordea Bank AB (Banks) 680,752 0.40
109,555 SKF AB “B” (Metal Fabricate/Hardware) 2,031,742 1.1926,781 Swedish Match AB
(Food, Beverages & Tobacco) 729,370 0.4349,842 Telefonaktiebolaget LM Ericsson “B”
(Telecommunications) 356,202 0.21
10,344,329 6.06
Switzerland
146 Belimo Holding AG (Building Materials) 202,291 0.1259,380 Compagnie Financiere Richemont S.A. “A”
(Retail) 3,547,147 2.0811,626 Credit Suisse Group AG (Banks) 212,496 0.124,310 Kuehne + Nagel International AG
(Transportation) 400,857 0.2386 Lindt & Spruengli AG “LISP”
(Food, Beverages & Tobacco) 213,271 0.139,770 Lonza Group AG (Chemicals) 360,631 0.21
31,258 Nestle S.A. (Food, Beverages & Tobacco) 1,578,078 0.924,039 Panalpina Welttransport Holding AG
(Transportation) 283,834 0.1713,408 Roche Holding AG (Pharmaceuticals) 2,022,388 1.18
430 SGS S.A. (Commercial Services) 747,054 0.443,935 Swatch Group AG “BR” (Retail) 1,473,386 0.86
23,626 Swiss Re AG (Insurance) 1,317,243 0.775,456 Syngenta AG (Chemicals) 1,689,361 0.996,765 Tecan Group AG (Healthcare Products) 390,085 0.23
144,722 UBS AG (Banks) 1,737,439 1.0240,858 Wolseley Plc. (Distribution/Wholesale) 1,458,944 0.85
110,031 Xstrata Plc. (Mining) 1,414,738 0.832,869 Zurich Insurance Group AG (Insurance) 564,852 0.33
19,614,095 11.48
United Kingdom
42,267 Anglo American Plc. (Mining) 911,046 0.53113,175 Antofagasta Plc. (Mining) 1,801,365 1.0516,836 AstraZeneca Plc. (Pharmaceuticals) 615,528 0.36
287,149 AZ Electronic Materials S.A. (Chemicals) 1,291,955 0.7653,211 Babcock International Group Plc.
(Commercial Services) 655,674 0.381,059,337 Barclays Plc. (Banks) 3,230,728 1.89
14,177 Berkeley Group Holdings Plc. (Home Builders) 287,778 0.17
128,118 BG Group Plc. (Oil & Gas) 1,699,339 1.0037,790 British American Tobacco Plc.
(Food, Beverages & Tobacco) 1,528,379 0.9058,347 Burberry Group Plc. (Apparel) 938,743 0.55
203,486 Capita Plc. (Commercial Services) 1,931,263 1.13
Common Stocks – (continued)
United Kingdom – (continued)
117,441 Compass Group Plc. (Food, Beverages & Tobacco) 1,050,287 0.62
19,763 Croda International Plc. (Chemicals) 581,195 0.3453,542 Diageo Plc.
(Food, Beverages & Tobacco) 1,230,528 0.72138,758 GlaxoSmithKline Plc. (Pharmaceuticals) 2,295,672 1.3423,682 Halma Plc. (Electronics) 127,363 0.0738,004 Imperial Tobacco Group Plc.
(Food, Beverages & Tobacco) 1,172,365 0.6916,739 Intertek Group Plc.
(Commercial Services) 639,799 0.3746,099 Jardine Lloyd Thompson Group Plc.
(Insurance) 436,953 0.2656,298 Johnson Matthey Plc. (Chemicals) 1,675,029 0.9893,480 Kingfisher Plc. (Retail) 320,707 0.1926,933 Land Securities Group Plc.
(Real Estate Investment Trust) 269,211 0.16855,014 Legal & General Group Plc. (Insurance) 1,541,926 0.90
1,412,987 Lloyds Banking Group Plc. (Banks) 815,240 0.4843,130 Pearson Plc. (Media) 627,919 0.37
290,253 Prudential Plc. (Insurance) 3,251,402 1.9013,331 Reckitt Benckiser Group Plc.
(Household Products/Wares) 644,759 0.3816,781 Renishaw Plc. (Electronics) 373,431 0.2213,586 Rio Tinto Plc. (Mining) 520,623 0.31
192,559 Rolls-Royce Holdings Plc. (Aerospace & Defence) 2,116,979 1.24
21,204,380 Rolls-Royce Holdings Plc. “C”(b)
(Aerospace & Defence) 26,102 0.0210,101 Rotork Plc. (Electronics) 307,932 0.1870,206 Smith & Nephew Plc.
(Healthcare Products) 570,821 0.3324,350 Smiths Group Plc.
(Miscellaneous Manufacturing) 329,719 0.1948,544 Spectris Plc. (Electronics) 1,161,077 0.6826,157 Spirax-Sarco Engineering Plc.
(Machinery—Diversified) 703,223 0.41133,043 Tesco Plc. (Food, Beverages & Tobacco) 536,278 0.31104,218 Tullow Oil Plc. (Oil & Gas) 1,780,676 1.0419,947 Victrex Plc. (Chemicals) 378,139 0.22
1,055,084 Vodafone Group Plc. (Telecommunications) 2,098,199 1.23
42,475,352 24.87
TOTAL COMMON STOCKS(cos t EUR 151 ,636 ,031 ) 166,763,458 97.62
Mutual Funds – 1.68%
Germany
255,447 iShares Euro STOXX Banks 2,863,561 1.68
TOTAL MUTUAL FUNDS(cos t EUR 2 ,524 ,010 ) 2,863,561 1.68
TOTAL TRANSFERA BLE SECURIT IES ADMITTED TO AN OFF IC IAL EXCHANGE L IST ING(cos t EUR 154 ,160 ,041 ) 169,627,019 99.30
MARKET VALUE OF INVESTMENTS(cos t EUR 154 ,160 ,041 ) 169,627,019 99.30
OTHER ASSETS AND L IA B IL IT IES 1,191,207 0.70
SHAREHOLDERS ’ EQUITY 170,818,226 100.00
% ofMarket Value Shareholders’
Holdings Security Description EUR Equity
% ofMarket Value Shareholders’
Holdings Security Description EUR Equity
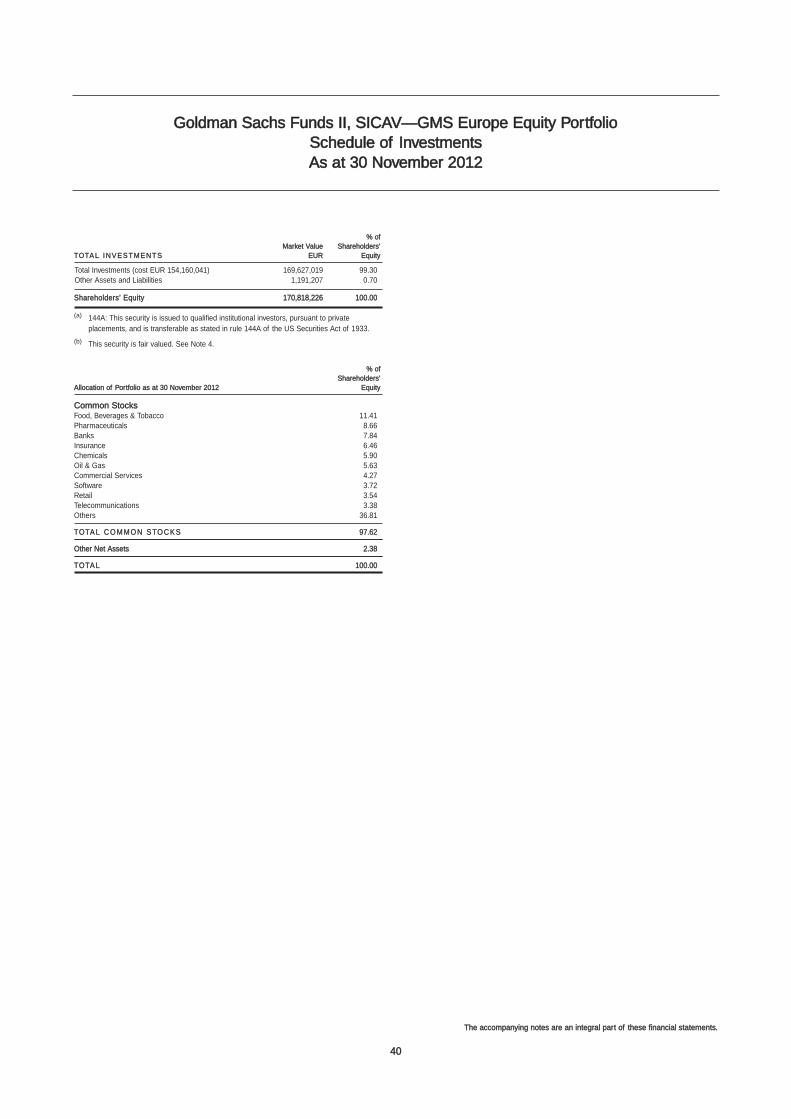
40
The accompanying notes are an integral part of these financial statements.
Schedule of InvestmentsAs at 30 November 2012
% ofMarket Value Shareholders’
TOTAL INVESTMENTS EUR Equity
Total Investments (cost EUR 154,160,041) 169,627,019 99.30Other Assets and Liabilities 1,191,207 0.70
Shareholders’ Equity 170,818,226 100.00
(a) 144A: This security is issued to qualified institutional investors, pursuant to privateplacements, and is transferable as stated in rule 144A of the US Securities Act of 1933.
(b) This security is fair valued. See Note 4.
% ofShareholders’
Allocation of Portfolio as at 30 November 2012 Equity
Common StocksFood, Beverages & Tobacco 11.41Pharmaceuticals 8.66Banks 7.84Insurance 6.46Chemicals 5.90Oil & Gas 5.63Commercial Services 4.27Software 3.72Retail 3.54Telecommunications 3.38Others 36.81
TOTAL COMMON STOCKS 97.62
Other Net Assets 2.38
TOTAL 100.00
Goldman Sachs Funds II, SICAV—GMS Europe Equity Portfolio
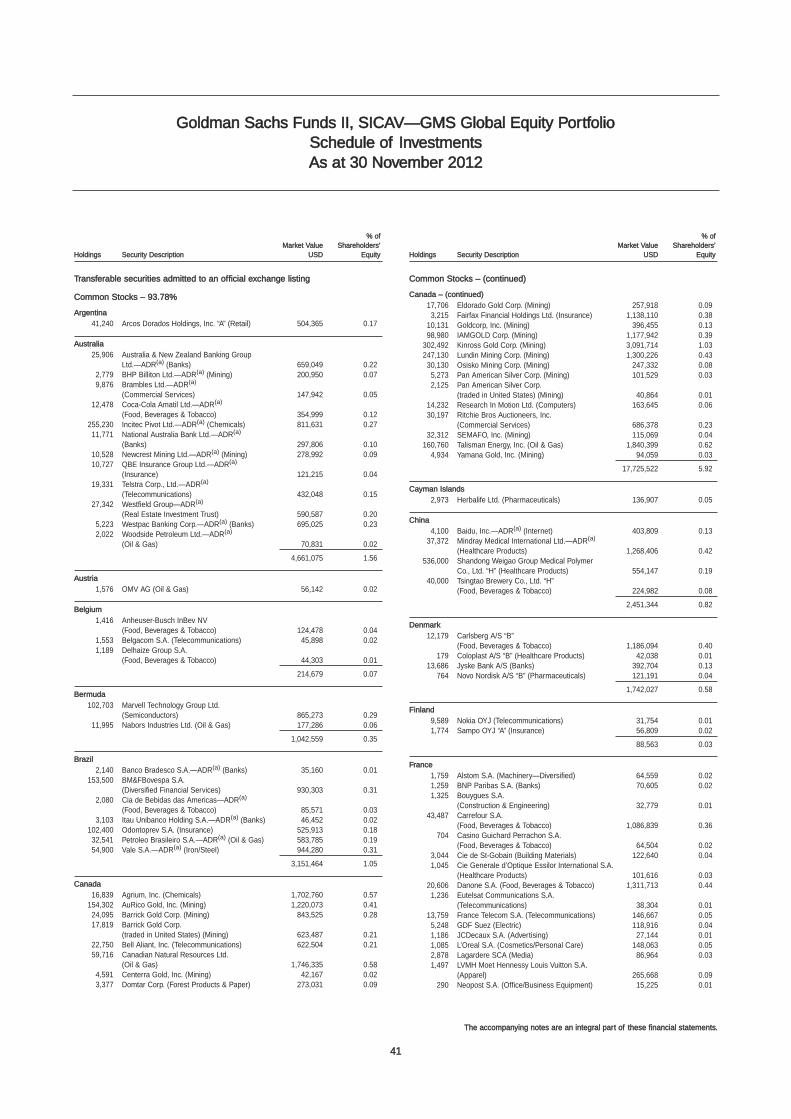
41
The accompanying notes are an integral part of these financial statements.
Schedule of InvestmentsAs at 30 November 2012
Transferable securities admitted to an official exchange listing
Common Stocks – 93.78%
Argentina
41,240 Arcos Dorados Holdings, Inc. “A” (Retail) 504,365 0.17
Australia
25,906 Australia & New Zealand Banking Group Ltd.—ADR(a) (Banks) 659,049 0.22
2,779 BHP Billiton Ltd.—ADR(a) (Mining) 200,950 0.079,876 Brambles Ltd.—ADR(a)
(Commercial Services) 147,942 0.0512,478 Coca-Cola Amatil Ltd.—ADR(a)
(Food, Beverages & Tobacco) 354,999 0.12255,230 Incitec Pivot Ltd.—ADR(a) (Chemicals) 811,631 0.2711,771 National Australia Bank Ltd.—ADR(a)
(Banks) 297,806 0.1010,528 Newcrest Mining Ltd.—ADR(a) (Mining) 278,992 0.0910,727 QBE Insurance Group Ltd.—ADR(a)
(Insurance) 121,215 0.0419,331 Telstra Corp., Ltd.—ADR(a)
(Telecommunications) 432,048 0.1527,342 Westfield Group—ADR(a)
(Real Estate Investment Trust) 590,587 0.205,223 Westpac Banking Corp.—ADR(a) (Banks) 695,025 0.232,022 Woodside Petroleum Ltd.—ADR(a)
(Oil & Gas) 70,831 0.02
4,661,075 1.56
Austria
1,576 OMV AG (Oil & Gas) 56,142 0.02
Belgium
1,416 Anheuser-Busch InBev NV (Food, Beverages & Tobacco) 124,478 0.04
1,553 Belgacom S.A. (Telecommunications) 45,898 0.021,189 Delhaize Group S.A.
(Food, Beverages & Tobacco) 44,303 0.01
214,679 0.07
Bermuda
102,703 Marvell Technology Group Ltd. (Semiconductors) 865,273 0.29
11,995 Nabors Industries Ltd. (Oil & Gas) 177,286 0.06
1,042,559 0.35
Brazil
2,140 Banco Bradesco S.A.—ADR(a) (Banks) 35,160 0.01153,500 BM&FBovespa S.A.
(Diversified Financial Services) 930,303 0.312,080 Cia de Bebidas das Americas—ADR(a)
(Food, Beverages & Tobacco) 85,571 0.033,103 Itau Unibanco Holding S.A.—ADR(a) (Banks) 46,452 0.02
102,400 Odontoprev S.A. (Insurance) 525,913 0.1832,541 Petroleo Brasileiro S.A.—ADR(a) (Oil & Gas) 583,785 0.1954,900 Vale S.A.—ADR(a) (Iron/Steel) 944,280 0.31
3,151,464 1.05
Canada
16,839 Agrium, Inc. (Chemicals) 1,702,760 0.57154,302 AuRico Gold, Inc. (Mining) 1,220,073 0.4124,095 Barrick Gold Corp. (Mining) 843,525 0.2817,819 Barrick Gold Corp.
(traded in United States) (Mining) 623,487 0.2122,750 Bell Aliant, Inc. (Telecommunications) 622,504 0.2159,716 Canadian Natural Resources Ltd.
(Oil & Gas) 1,746,335 0.584,591 Centerra Gold, Inc. (Mining) 42,167 0.023,377 Domtar Corp. (Forest Products & Paper) 273,031 0.09
Common Stocks – (continued)
Canada – (continued)
17,706 Eldorado Gold Corp. (Mining) 257,918 0.093,215 Fairfax Financial Holdings Ltd. (Insurance) 1,138,110 0.38
10,131 Goldcorp, Inc. (Mining) 396,455 0.1398,980 IAMGOLD Corp. (Mining) 1,177,942 0.39
302,492 Kinross Gold Corp. (Mining) 3,091,714 1.03247,130 Lundin Mining Corp. (Mining) 1,300,226 0.4330,130 Osisko Mining Corp. (Mining) 247,332 0.085,273 Pan American Silver Corp. (Mining) 101,529 0.032,125 Pan American Silver Corp.
(traded in United States) (Mining) 40,864 0.0114,232 Research In Motion Ltd. (Computers) 163,645 0.0630,197 Ritchie Bros Auctioneers, Inc.
(Commercial Services) 686,378 0.2332,312 SEMAFO, Inc. (Mining) 115,069 0.04
160,760 Talisman Energy, Inc. (Oil & Gas) 1,840,399 0.624,934 Yamana Gold, Inc. (Mining) 94,059 0.03
17,725,522 5.92
Cayman Islands
2,973 Herbalife Ltd. (Pharmaceuticals) 136,907 0.05
China
4,100 Baidu, Inc.—ADR(a) (Internet) 403,809 0.1337,372 Mindray Medical International Ltd.—ADR(a)
(Healthcare Products) 1,268,406 0.42536,000 Shandong Weigao Group Medical Polymer
Co., Ltd. “H” (Healthcare Products) 554,147 0.1940,000 Tsingtao Brewery Co., Ltd. “H”
(Food, Beverages & Tobacco) 224,982 0.08
2,451,344 0.82
Denmark
12,179 Carlsberg A/S “B” (Food, Beverages & Tobacco) 1,186,094 0.40
179 Coloplast A/S “B” (Healthcare Products) 42,038 0.0113,686 Jyske Bank A/S (Banks) 392,704 0.13
764 Novo Nordisk A/S “B” (Pharmaceuticals) 121,191 0.04
1,742,027 0.58
Finland
9,589 Nokia OYJ (Telecommunications) 31,754 0.011,774 Sampo OYJ “A” (Insurance) 56,809 0.02
88,563 0.03
France
1,759 Alstom S.A. (Machinery—Diversified) 64,559 0.021,259 BNP Paribas S.A. (Banks) 70,605 0.021,325 Bouygues S.A.
(Construction & Engineering) 32,779 0.0143,487 Carrefour S.A.
(Food, Beverages & Tobacco) 1,086,839 0.36704 Casino Guichard Perrachon S.A.
(Food, Beverages & Tobacco) 64,504 0.023,044 Cie de St-Gobain (Building Materials) 122,640 0.041,045 Cie Generale d’Optique Essilor International S.A.
(Healthcare Products) 101,616 0.0320,606 Danone S.A. (Food, Beverages & Tobacco) 1,311,713 0.441,236 Eutelsat Communications S.A.
(Telecommunications) 38,304 0.0113,759 France Telecom S.A. (Telecommunications) 146,667 0.055,248 GDF Suez (Electric) 118,916 0.041,186 JCDecaux S.A. (Advertising) 27,144 0.011,085 L’Oreal S.A. (Cosmetics/Personal Care) 148,063 0.052,878 Lagardere SCA (Media) 86,964 0.031,497 LVMH Moet Hennessy Louis Vuitton S.A.
(Apparel) 265,668 0.09290 Neopost S.A. (Office/Business Equipment) 15,225 0.01
Goldman Sachs Funds II, SICAV—GMS Global Equity Portfolio
% ofMarket Value Shareholders’
Holdings Security Description USD Equity
% ofMarket Value Shareholders’
Holdings Security Description USD Equity
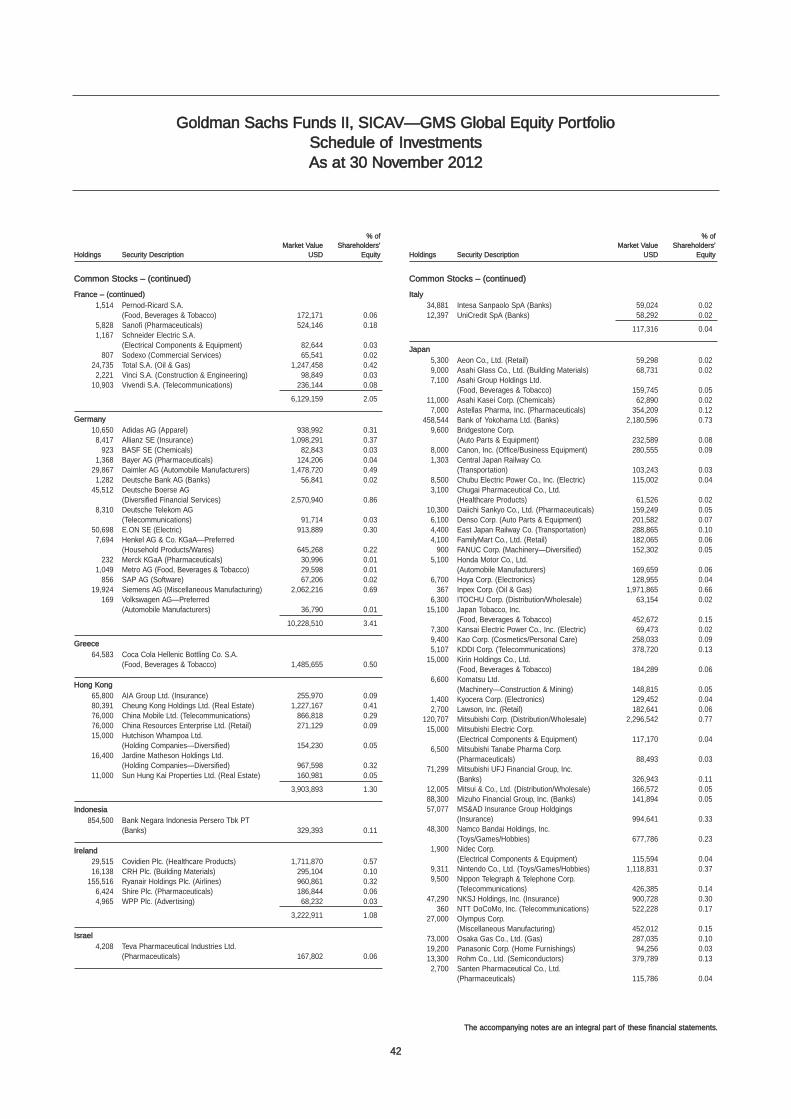
42
The accompanying notes are an integral part of these financial statements.
Schedule of InvestmentsAs at 30 November 2012
Common Stocks – (continued)
France – (continued)
1,514 Pernod-Ricard S.A. (Food, Beverages & Tobacco) 172,171 0.06
5,828 Sanofi (Pharmaceuticals) 524,146 0.181,167 Schneider Electric S.A.
(Electrical Components & Equipment) 82,644 0.03807 Sodexo (Commercial Services) 65,541 0.02
24,735 Total S.A. (Oil & Gas) 1,247,458 0.422,221 Vinci S.A. (Construction & Engineering) 98,849 0.03
10,903 Vivendi S.A. (Telecommunications) 236,144 0.08
6,129,159 2.05
Germany
10,650 Adidas AG (Apparel) 938,992 0.318,417 Allianz SE (Insurance) 1,098,291 0.37
923 BASF SE (Chemicals) 82,843 0.031,368 Bayer AG (Pharmaceuticals) 124,206 0.04
29,867 Daimler AG (Automobile Manufacturers) 1,478,720 0.491,282 Deutsche Bank AG (Banks) 56,841 0.02
45,512 Deutsche Boerse AG (Diversified Financial Services) 2,570,940 0.86
8,310 Deutsche Telekom AG (Telecommunications) 91,714 0.03
50,698 E.ON SE (Electric) 913,889 0.307,694 Henkel AG & Co. KGaA—Preferred
(Household Products/Wares) 645,268 0.22232 Merck KGaA (Pharmaceuticals) 30,996 0.01
1,049 Metro AG (Food, Beverages & Tobacco) 29,598 0.01856 SAP AG (Software) 67,206 0.02
19,924 Siemens AG (Miscellaneous Manufacturing) 2,062,216 0.69169 Volkswagen AG—Preferred
(Automobile Manufacturers) 36,790 0.01
10,228,510 3.41
Greece
64,583 Coca Cola Hellenic Bottling Co. S.A. (Food, Beverages & Tobacco) 1,485,655 0.50
Hong Kong
65,800 AIA Group Ltd. (Insurance) 255,970 0.0980,391 Cheung Kong Holdings Ltd. (Real Estate) 1,227,167 0.4176,000 China Mobile Ltd. (Telecommunications) 866,818 0.2976,000 China Resources Enterprise Ltd. (Retail) 271,129 0.0915,000 Hutchison Whampoa Ltd.
(Holding Companies—Diversified) 154,230 0.0516,400 Jardine Matheson Holdings Ltd.
(Holding Companies—Diversified) 967,598 0.3211,000 Sun Hung Kai Properties Ltd. (Real Estate) 160,981 0.05
3,903,893 1.30
Indonesia
854,500 Bank Negara Indonesia Persero Tbk PT (Banks) 329,393 0.11
Ireland
29,515 Covidien Plc. (Healthcare Products) 1,711,870 0.5716,138 CRH Plc. (Building Materials) 295,104 0.10
155,516 Ryanair Holdings Plc. (Airlines) 960,861 0.326,424 Shire Plc. (Pharmaceuticals) 186,844 0.064,965 WPP Plc. (Advertising) 68,232 0.03
3,222,911 1.08
Israel
4,208 Teva Pharmaceutical Industries Ltd. (Pharmaceuticals) 167,802 0.06
Common Stocks – (continued)
Italy
34,881 Intesa Sanpaolo SpA (Banks) 59,024 0.0212,397 UniCredit SpA (Banks) 58,292 0.02
117,316 0.04
Japan
5,300 Aeon Co., Ltd. (Retail) 59,298 0.029,000 Asahi Glass Co., Ltd. (Building Materials) 68,731 0.027,100 Asahi Group Holdings Ltd.
(Food, Beverages & Tobacco) 159,745 0.0511,000 Asahi Kasei Corp. (Chemicals) 62,890 0.027,000 Astellas Pharma, Inc. (Pharmaceuticals) 354,209 0.12
458,544 Bank of Yokohama Ltd. (Banks) 2,180,596 0.739,600 Bridgestone Corp.
(Auto Parts & Equipment) 232,589 0.088,000 Canon, Inc. (Office/Business Equipment) 280,555 0.091,303 Central Japan Railway Co.
(Transportation) 103,243 0.038,500 Chubu Electric Power Co., Inc. (Electric) 115,002 0.043,100 Chugai Pharmaceutical Co., Ltd.
(Healthcare Products) 61,526 0.0210,300 Daiichi Sankyo Co., Ltd. (Pharmaceuticals) 159,249 0.056,100 Denso Corp. (Auto Parts & Equipment) 201,582 0.074,400 East Japan Railway Co. (Transportation) 288,865 0.104,100 FamilyMart Co., Ltd. (Retail) 182,065 0.06
900 FANUC Corp. (Machinery—Diversified) 152,302 0.055,100 Honda Motor Co., Ltd.
(Automobile Manufacturers) 169,659 0.066,700 Hoya Corp. (Electronics) 128,955 0.04
367 Inpex Corp. (Oil & Gas) 1,971,865 0.666,300 ITOCHU Corp. (Distribution/Wholesale) 63,154 0.02
15,100 Japan Tobacco, Inc. (Food, Beverages & Tobacco) 452,672 0.15
7,300 Kansai Electric Power Co., Inc. (Electric) 69,473 0.029,400 Kao Corp. (Cosmetics/Personal Care) 258,033 0.095,107 KDDI Corp. (Telecommunications) 378,720 0.13
15,000 Kirin Holdings Co., Ltd. (Food, Beverages & Tobacco) 184,289 0.06
6,600 Komatsu Ltd. (Machinery—Construction & Mining) 148,815 0.05
1,400 Kyocera Corp. (Electronics) 129,452 0.042,700 Lawson, Inc. (Retail) 182,641 0.06
120,707 Mitsubishi Corp. (Distribution/Wholesale) 2,296,542 0.7715,000 Mitsubishi Electric Corp.
(Electrical Components & Equipment) 117,170 0.046,500 Mitsubishi Tanabe Pharma Corp.
(Pharmaceuticals) 88,493 0.0371,299 Mitsubishi UFJ Financial Group, Inc.
(Banks) 326,943 0.1112,005 Mitsui & Co., Ltd. (Distribution/Wholesale) 166,572 0.0588,300 Mizuho Financial Group, Inc. (Banks) 141,894 0.0557,077 MS&AD Insurance Group Holdgings
(Insurance) 994,641 0.3348,300 Namco Bandai Holdings, Inc.
(Toys/Games/Hobbies) 677,786 0.231,900 Nidec Corp.
(Electrical Components & Equipment) 115,594 0.049,311 Nintendo Co., Ltd. (Toys/Games/Hobbies) 1,118,831 0.379,500 Nippon Telegraph & Telephone Corp.
(Telecommunications) 426,385 0.1447,290 NKSJ Holdings, Inc. (Insurance) 900,728 0.30
360 NTT DoCoMo, Inc. (Telecommunications) 522,228 0.1727,000 Olympus Corp.
(Miscellaneous Manufacturing) 452,012 0.1573,000 Osaka Gas Co., Ltd. (Gas) 287,035 0.1019,200 Panasonic Corp. (Home Furnishings) 94,256 0.0313,300 Rohm Co., Ltd. (Semiconductors) 379,789 0.132,700 Santen Pharmaceutical Co., Ltd.
(Pharmaceuticals) 115,786 0.04
Goldman Sachs Funds II, SICAV—GMS Global Equity Portfolio
% ofMarket Value Shareholders’
Holdings Security Description USD Equity
% ofMarket Value Shareholders’
Holdings Security Description USD Equity
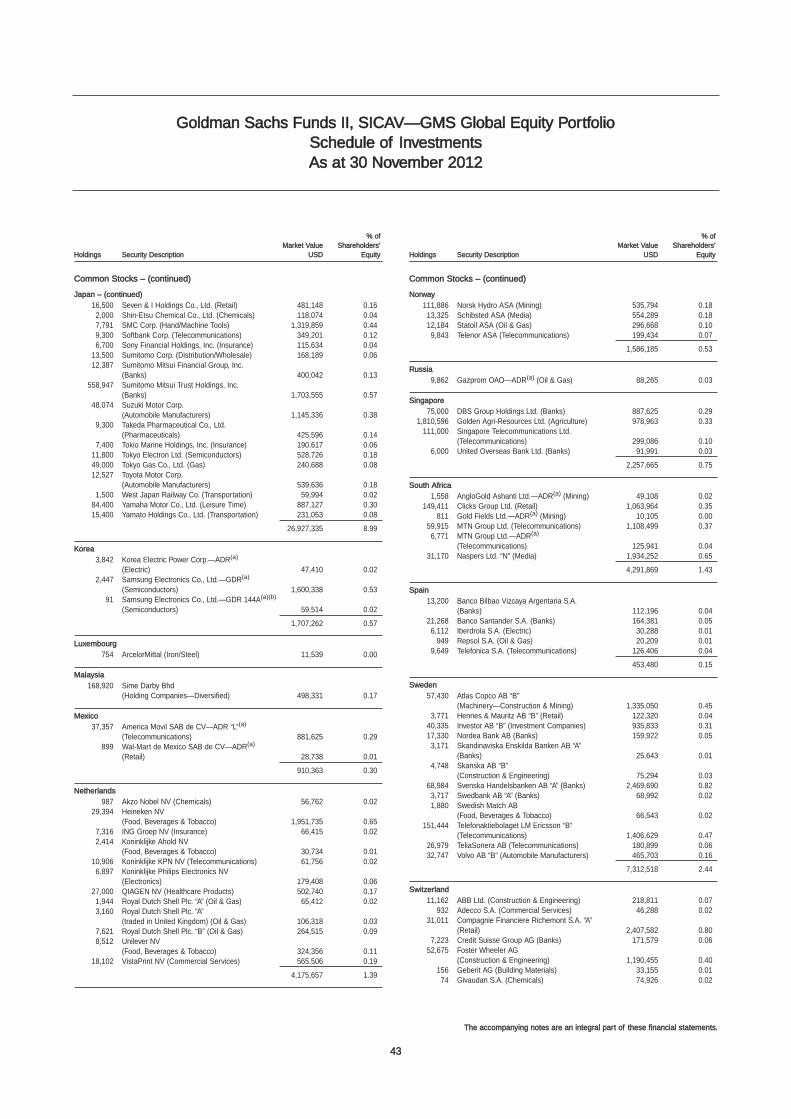
43
The accompanying notes are an integral part of these financial statements.
Schedule of InvestmentsAs at 30 November 2012
Common Stocks – (continued)
Japan – (continued)
16,500 Seven & I Holdings Co., Ltd. (Retail) 481,148 0.162,000 Shin-Etsu Chemical Co., Ltd. (Chemicals) 118,074 0.047,791 SMC Corp. (Hand/Machine Tools) 1,319,859 0.449,300 Softbank Corp. (Telecommunications) 349,201 0.126,700 Sony Financial Holdings, Inc. (Insurance) 115,634 0.04
13,500 Sumitomo Corp. (Distribution/Wholesale) 168,189 0.0612,387 Sumitomo Mitsui Financial Group, Inc.
(Banks) 400,042 0.13558,947 Sumitomo Mitsui Trust Holdings, Inc.
(Banks) 1,703,555 0.5748,074 Suzuki Motor Corp.
(Automobile Manufacturers) 1,145,336 0.389,300 Takeda Pharmaceutical Co., Ltd.
(Pharmaceuticals) 425,596 0.147,400 Tokio Marine Holdings, Inc. (Insurance) 190,617 0.06
11,800 Tokyo Electron Ltd. (Semiconductors) 528,726 0.1849,000 Tokyo Gas Co., Ltd. (Gas) 240,688 0.0812,527 Toyota Motor Corp.
(Automobile Manufacturers) 539,636 0.181,500 West Japan Railway Co. (Transportation) 59,994 0.02
84,400 Yamaha Motor Co., Ltd. (Leisure Time) 887,127 0.3015,400 Yamato Holdings Co., Ltd. (Transportation) 231,053 0.08
26,927,335 8.99
Korea
3,842 Korea Electric Power Corp.—ADR(a)
(Electric) 47,410 0.022,447 Samsung Electronics Co., Ltd.—GDR(a)
(Semiconductors) 1,600,338 0.5391 Samsung Electronics Co., Ltd.—GDR 144A(a)(b)
(Semiconductors) 59,514 0.02
1,707,262 0.57
Luxembourg
754 ArcelorMittal (Iron/Steel) 11,539 0.00
Malaysia
168,920 Sime Darby Bhd (Holding Companies—Diversified) 498,331 0.17
Mexico
37,357 America Movil SAB de CV—ADR “L”(a)
(Telecommunications) 881,625 0.29899 Wal-Mart de Mexico SAB de CV—ADR(a)
(Retail) 28,738 0.01
910,363 0.30
Netherlands
987 Akzo Nobel NV (Chemicals) 56,762 0.0229,394 Heineken NV
(Food, Beverages & Tobacco) 1,951,735 0.657,316 ING Groep NV (Insurance) 66,415 0.022,414 Koninklijke Ahold NV
(Food, Beverages & Tobacco) 30,734 0.0110,906 Koninklijke KPN NV (Telecommunications) 61,756 0.026,897 Koninklijke Philips Electronics NV
(Electronics) 179,408 0.0627,000 QIAGEN NV (Healthcare Products) 502,740 0.171,944 Royal Dutch Shell Plc. “A” (Oil & Gas) 65,412 0.023,160 Royal Dutch Shell Plc. “A”
(traded in United Kingdom) (Oil & Gas) 106,318 0.037,621 Royal Dutch Shell Plc. “B” (Oil & Gas) 264,515 0.098,512 Unilever NV
(Food, Beverages & Tobacco) 324,356 0.1118,102 VistaPrint NV (Commercial Services) 565,506 0.19
4,175,657 1.39
Common Stocks – (continued)
Norway
111,886 Norsk Hydro ASA (Mining) 535,794 0.1813,325 Schibsted ASA (Media) 554,289 0.1812,184 Statoil ASA (Oil & Gas) 296,668 0.109,843 Telenor ASA (Telecommunications) 199,434 0.07
1,586,185 0.53
Russia
9,862 Gazprom OAO—ADR(a) (Oil & Gas) 88,265 0.03
Singapore
75,000 DBS Group Holdings Ltd. (Banks) 887,625 0.291,810,596 Golden Agri-Resources Ltd. (Agriculture) 978,963 0.33
111,000 Singapore Telecommunications Ltd. (Telecommunications) 299,086 0.10
6,000 United Overseas Bank Ltd. (Banks) 91,991 0.03
2,257,665 0.75
South Africa
1,558 AngloGold Ashanti Ltd.—ADR(a) (Mining) 49,108 0.02149,411 Clicks Group Ltd. (Retail) 1,063,964 0.35
811 Gold Fields Ltd.—ADR(a) (Mining) 10,105 0.0059,915 MTN Group Ltd. (Telecommunications) 1,108,499 0.376,771 MTN Group Ltd.—ADR(a)
(Telecommunications) 125,941 0.0431,170 Naspers Ltd. “N” (Media) 1,934,252 0.65
4,291,869 1.43
Spain
13,200 Banco Bilbao Vizcaya Argentaria S.A. (Banks) 112,196 0.04
21,268 Banco Santander S.A. (Banks) 164,381 0.056,112 Iberdrola S.A. (Electric) 30,288 0.01
949 Repsol S.A. (Oil & Gas) 20,209 0.019,649 Telefonica S.A. (Telecommunications) 126,406 0.04
453,480 0.15
Sweden
57,430 Atlas Copco AB “B” (Machinery—Construction & Mining) 1,335,050 0.45
3,771 Hennes & Mauritz AB “B” (Retail) 122,320 0.0440,335 Investor AB “B” (Investment Companies) 935,833 0.3117,330 Nordea Bank AB (Banks) 159,922 0.053,171 Skandinaviska Enskilda Banken AB “A”
(Banks) 25,643 0.014,748 Skanska AB “B”
(Construction & Engineering) 75,294 0.0368,984 Svenska Handelsbanken AB “A” (Banks) 2,469,690 0.823,717 Swedbank AB “A” (Banks) 68,992 0.021,880 Swedish Match AB
(Food, Beverages & Tobacco) 66,543 0.02151,444 Telefonaktiebolaget LM Ericsson “B”
(Telecommunications) 1,406,629 0.4726,979 TeliaSonera AB (Telecommunications) 180,899 0.0632,747 Volvo AB “B” (Automobile Manufacturers) 465,703 0.16
7,312,518 2.44
Switzerland
11,162 ABB Ltd. (Construction & Engineering) 218,811 0.07932 Adecco S.A. (Commercial Services) 46,288 0.02
31,011 Compagnie Financiere Richemont S.A. “A” (Retail) 2,407,582 0.80
7,223 Credit Suisse Group AG (Banks) 171,579 0.0652,675 Foster Wheeler AG
(Construction & Engineering) 1,190,455 0.40156 Geberit AG (Building Materials) 33,155 0.0174 Givaudan S.A. (Chemicals) 74,926 0.02
Goldman Sachs Funds II, SICAV—GMS Global Equity Portfolio
% ofMarket Value Shareholders’
Holdings Security Description USD Equity
% ofMarket Value Shareholders’
Holdings Security Description USD Equity
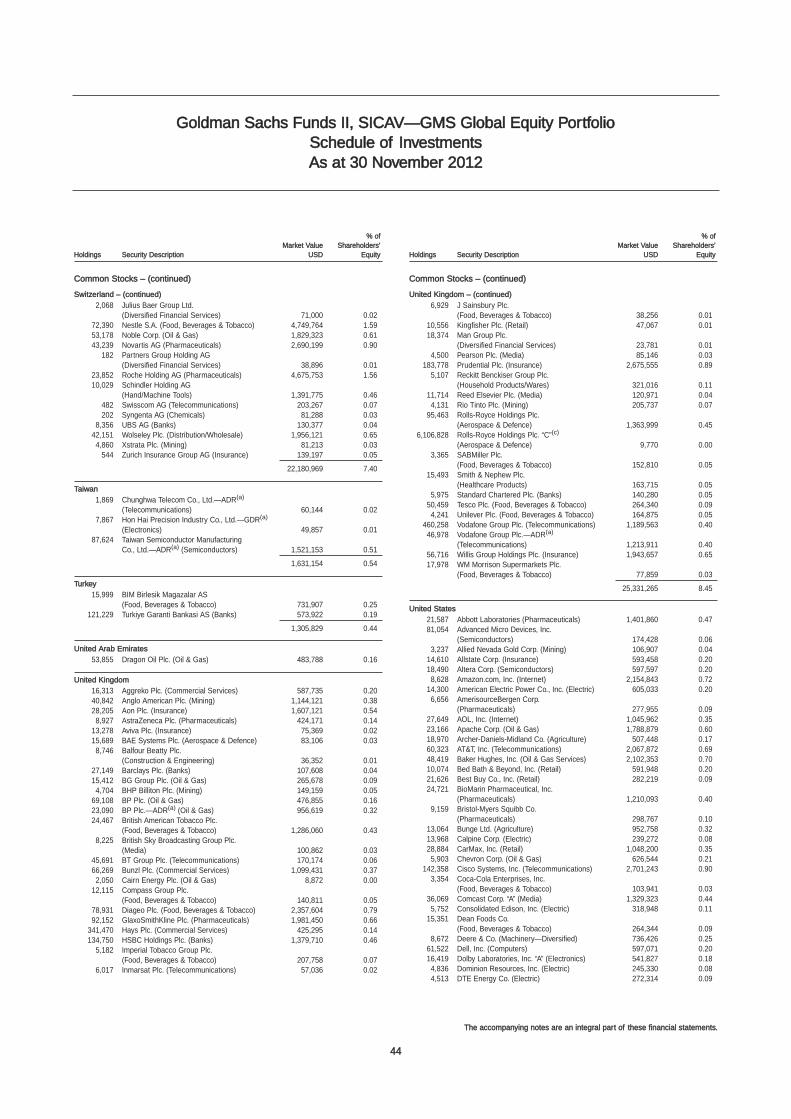
44
The accompanying notes are an integral part of these financial statements.
Schedule of InvestmentsAs at 30 November 2012
Goldman Sachs Funds II, SICAV—GMS Global Equity Portfolio
Common Stocks – (continued)
Switzerland – (continued)
2,068 Julius Baer Group Ltd. (Diversified Financial Services) 71,000 0.02
72,390 Nestle S.A. (Food, Beverages & Tobacco) 4,749,764 1.5953,178 Noble Corp. (Oil & Gas) 1,829,323 0.6143,239 Novartis AG (Pharmaceuticals) 2,690,199 0.90
182 Partners Group Holding AG (Diversified Financial Services) 38,896 0.01
23,852 Roche Holding AG (Pharmaceuticals) 4,675,753 1.5610,029 Schindler Holding AG
(Hand/Machine Tools) 1,391,775 0.46482 Swisscom AG (Telecommunications) 203,267 0.07202 Syngenta AG (Chemicals) 81,288 0.03
8,356 UBS AG (Banks) 130,377 0.0442,151 Wolseley Plc. (Distribution/Wholesale) 1,956,121 0.654,860 Xstrata Plc. (Mining) 81,213 0.03
544 Zurich Insurance Group AG (Insurance) 139,197 0.05
22,180,969 7.40
Taiwan
1,869 Chunghwa Telecom Co., Ltd.—ADR(a)
(Telecommunications) 60,144 0.027,867 Hon Hai Precision Industry Co., Ltd.—GDR(a)
(Electronics) 49,857 0.0187,624 Taiwan Semiconductor Manufacturing
Co., Ltd.—ADR(a) (Semiconductors) 1,521,153 0.51
1,631,154 0.54
Turkey
15,999 BIM Birlesik Magazalar AS (Food, Beverages & Tobacco) 731,907 0.25
121,229 Turkiye Garanti Bankasi AS (Banks) 573,922 0.19
1,305,829 0.44
United Arab Emirates
53,855 Dragon Oil Plc. (Oil & Gas) 483,788 0.16
United Kingdom
16,313 Aggreko Plc. (Commercial Services) 587,735 0.2040,842 Anglo American Plc. (Mining) 1,144,121 0.3828,205 Aon Plc. (Insurance) 1,607,121 0.548,927 AstraZeneca Plc. (Pharmaceuticals) 424,171 0.14
13,278 Aviva Plc. (Insurance) 75,369 0.0215,689 BAE Systems Plc. (Aerospace & Defence) 83,106 0.038,746 Balfour Beatty Plc.
(Construction & Engineering) 36,352 0.0127,149 Barclays Plc. (Banks) 107,608 0.0415,412 BG Group Plc. (Oil & Gas) 265,678 0.094,704 BHP Billiton Plc. (Mining) 149,159 0.05
69,108 BP Plc. (Oil & Gas) 476,855 0.1623,090 BP Plc.—ADR(a) (Oil & Gas) 956,619 0.3224,467 British American Tobacco Plc.
(Food, Beverages & Tobacco) 1,286,060 0.438,225 British Sky Broadcasting Group Plc.
(Media) 100,862 0.0345,691 BT Group Plc. (Telecommunications) 170,174 0.0666,269 Bunzl Plc. (Commercial Services) 1,099,431 0.372,050 Cairn Energy Plc. (Oil & Gas) 8,872 0.00
12,115 Compass Group Plc. (Food, Beverages & Tobacco) 140,811 0.05
78,931 Diageo Plc. (Food, Beverages & Tobacco) 2,357,604 0.7992,152 GlaxoSmithKline Plc. (Pharmaceuticals) 1,981,450 0.66
341,470 Hays Plc. (Commercial Services) 425,295 0.14134,750 HSBC Holdings Plc. (Banks) 1,379,710 0.46
5,182 Imperial Tobacco Group Plc. (Food, Beverages & Tobacco) 207,758 0.07
6,017 Inmarsat Plc. (Telecommunications) 57,036 0.02
Common Stocks – (continued)
United Kingdom – (continued)
6,929 J Sainsbury Plc. (Food, Beverages & Tobacco) 38,256 0.01
10,556 Kingfisher Plc. (Retail) 47,067 0.0118,374 Man Group Plc.
(Diversified Financial Services) 23,781 0.014,500 Pearson Plc. (Media) 85,146 0.03
183,778 Prudential Plc. (Insurance) 2,675,555 0.895,107 Reckitt Benckiser Group Plc.
(Household Products/Wares) 321,016 0.1111,714 Reed Elsevier Plc. (Media) 120,971 0.044,131 Rio Tinto Plc. (Mining) 205,737 0.07
95,463 Rolls-Royce Holdings Plc. (Aerospace & Defence) 1,363,999 0.45
6,106,828 Rolls-Royce Holdings Plc. “C”(c)
(Aerospace & Defence) 9,770 0.003,365 SABMiller Plc.
(Food, Beverages & Tobacco) 152,810 0.0515,493 Smith & Nephew Plc.
(Healthcare Products) 163,715 0.055,975 Standard Chartered Plc. (Banks) 140,280 0.05
50,459 Tesco Plc. (Food, Beverages & Tobacco) 264,340 0.094,241 Unilever Plc. (Food, Beverages & Tobacco) 164,875 0.05
460,258 Vodafone Group Plc. (Telecommunications) 1,189,563 0.4046,978 Vodafone Group Plc.—ADR(a)
(Telecommunications) 1,213,911 0.4056,716 Willis Group Holdings Plc. (Insurance) 1,943,657 0.6517,978 WM Morrison Supermarkets Plc.
(Food, Beverages & Tobacco) 77,859 0.03
25,331,265 8.45
United States
21,587 Abbott Laboratories (Pharmaceuticals) 1,401,860 0.4781,054 Advanced Micro Devices, Inc.
(Semiconductors) 174,428 0.063,237 Allied Nevada Gold Corp. (Mining) 106,907 0.04
14,610 Allstate Corp. (Insurance) 593,458 0.2018,490 Altera Corp. (Semiconductors) 597,597 0.208,628 Amazon.com, Inc. (Internet) 2,154,843 0.72
14,300 American Electric Power Co., Inc. (Electric) 605,033 0.206,656 AmerisourceBergen Corp.
(Pharmaceuticals) 277,955 0.0927,649 AOL, Inc. (Internet) 1,045,962 0.3523,166 Apache Corp. (Oil & Gas) 1,788,879 0.6018,970 Archer-Daniels-Midland Co. (Agriculture) 507,448 0.1760,323 AT&T, Inc. (Telecommunications) 2,067,872 0.6948,419 Baker Hughes, Inc. (Oil & Gas Services) 2,102,353 0.7010,074 Bed Bath & Beyond, Inc. (Retail) 591,948 0.2021,626 Best Buy Co., Inc. (Retail) 282,219 0.0924,721 BioMarin Pharmaceutical, Inc.
(Pharmaceuticals) 1,210,093 0.409,159 Bristol-Myers Squibb Co.
(Pharmaceuticals) 298,767 0.1013,064 Bunge Ltd. (Agriculture) 952,758 0.3213,968 Calpine Corp. (Electric) 239,272 0.0828,884 CarMax, Inc. (Retail) 1,048,200 0.355,903 Chevron Corp. (Oil & Gas) 626,544 0.21
142,358 Cisco Systems, Inc. (Telecommunications) 2,701,243 0.903,354 Coca-Cola Enterprises, Inc.
(Food, Beverages & Tobacco) 103,941 0.0336,069 Comcast Corp. “A” (Media) 1,329,323 0.445,752 Consolidated Edison, Inc. (Electric) 318,948 0.11
15,351 Dean Foods Co. (Food, Beverages & Tobacco) 264,344 0.09
8,672 Deere & Co. (Machinery—Diversified) 736,426 0.2561,522 Dell, Inc. (Computers) 597,071 0.2016,419 Dolby Laboratories, Inc. “A” (Electronics) 541,827 0.184,836 Dominion Resources, Inc. (Electric) 245,330 0.084,513 DTE Energy Co. (Electric) 272,314 0.09
% ofMarket Value Shareholders’
Holdings Security Description USD Equity
% ofMarket Value Shareholders’
Holdings Security Description USD Equity
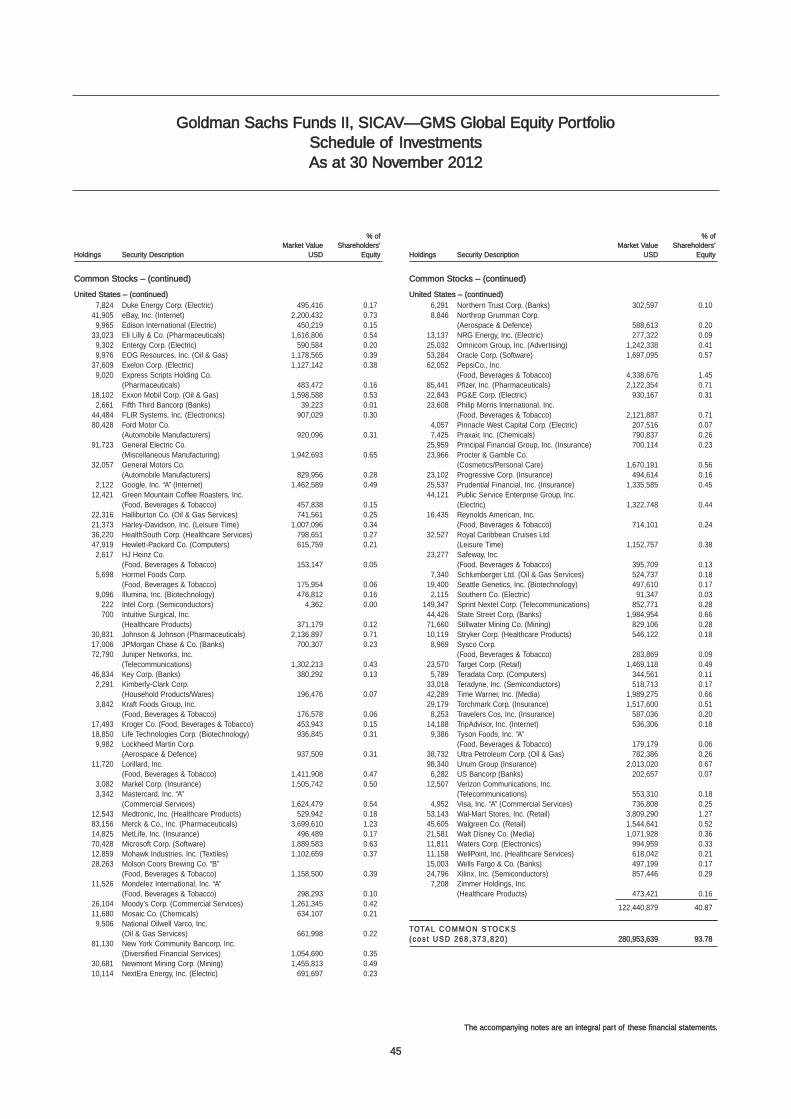
45
The accompanying notes are an integral part of these financial statements.
Schedule of InvestmentsAs at 30 November 2012
Common Stocks – (continued)
United States – (continued)
6,291 Northern Trust Corp. (Banks) 302,597 0.108,846 Northrop Grumman Corp.
(Aerospace & Defence) 588,613 0.2013,137 NRG Energy, Inc. (Electric) 277,322 0.0925,032 Omnicom Group, Inc. (Advertising) 1,242,338 0.4153,284 Oracle Corp. (Software) 1,697,095 0.5762,052 PepsiCo., Inc.
(Food, Beverages & Tobacco) 4,338,676 1.4585,441 Pfizer, Inc. (Pharmaceuticals) 2,122,354 0.7122,843 PG&E Corp. (Electric) 930,167 0.3123,608 Philip Morris International, Inc.
(Food, Beverages & Tobacco) 2,121,887 0.714,057 Pinnacle West Capital Corp. (Electric) 207,516 0.077,425 Praxair, Inc. (Chemicals) 790,837 0.26
25,959 Principal Financial Group, Inc. (Insurance) 700,114 0.2323,966 Procter & Gamble Co.
(Cosmetics/Personal Care) 1,670,191 0.5623,102 Progressive Corp. (Insurance) 494,614 0.1625,537 Prudential Financial, Inc. (Insurance) 1,335,585 0.4544,121 Public Service Enterprise Group, Inc.
(Electric) 1,322,748 0.4416,435 Reynolds American, Inc.
(Food, Beverages & Tobacco) 714,101 0.2432,527 Royal Caribbean Cruises Ltd.
(Leisure Time) 1,152,757 0.3823,277 Safeway, Inc.
(Food, Beverages & Tobacco) 395,709 0.137,340 Schlumberger Ltd. (Oil & Gas Services) 524,737 0.18
19,400 Seattle Genetics, Inc. (Biotechnology) 497,610 0.172,115 Southern Co. (Electric) 91,347 0.03
149,347 Sprint Nextel Corp. (Telecommunications) 852,771 0.2844,426 State Street Corp. (Banks) 1,984,954 0.6671,660 Stillwater Mining Co. (Mining) 829,106 0.2810,119 Stryker Corp. (Healthcare Products) 546,122 0.188,969 Sysco Corp.
(Food, Beverages & Tobacco) 283,869 0.0923,570 Target Corp. (Retail) 1,469,118 0.495,789 Teradata Corp. (Computers) 344,561 0.11
33,018 Teradyne, Inc. (Semiconductors) 518,713 0.1742,289 Time Warner, Inc. (Media) 1,989,275 0.6629,179 Torchmark Corp. (Insurance) 1,517,600 0.518,253 Travelers Cos, Inc. (Insurance) 587,036 0.20
14,188 TripAdvisor, Inc. (Internet) 536,306 0.189,386 Tyson Foods, Inc. “A”
(Food, Beverages & Tobacco) 179,179 0.0638,732 Ultra Petroleum Corp. (Oil & Gas) 782,386 0.2698,340 Unum Group (Insurance) 2,013,020 0.676,282 US Bancorp (Banks) 202,657 0.07
12,507 Verizon Communications, Inc. (Telecommunications) 553,310 0.18
4,952 Visa, Inc. “A” (Commercial Services) 736,808 0.2553,143 Wal-Mart Stores, Inc. (Retail) 3,809,290 1.2745,605 Walgreen Co. (Retail) 1,544,641 0.5221,581 Walt Disney Co. (Media) 1,071,928 0.3611,811 Waters Corp. (Electronics) 994,959 0.3311,158 WellPoint, Inc. (Healthcare Services) 618,042 0.2115,003 Wells Fargo & Co. (Banks) 497,199 0.1724,796 Xilinx, Inc. (Semiconductors) 857,446 0.297,208 Zimmer Holdings, Inc.
(Healthcare Products) 473,421 0.16
122,440,879 40.87
TOTAL COMMON STOCKS(cos t USD 268 ,373 ,820 ) 280,953,639 93.78
Goldman Sachs Funds II, SICAV—GMS Global Equity Portfolio
Common Stocks – (continued)
United States – (continued)
7,824 Duke Energy Corp. (Electric) 495,416 0.1741,905 eBay, Inc. (Internet) 2,200,432 0.739,965 Edison International (Electric) 450,219 0.15
33,023 Eli Lilly & Co. (Pharmaceuticals) 1,616,806 0.549,302 Entergy Corp. (Electric) 590,584 0.209,976 EOG Resources, Inc. (Oil & Gas) 1,178,565 0.39
37,609 Exelon Corp. (Electric) 1,127,142 0.389,020 Express Scripts Holding Co.
(Pharmaceuticals) 483,472 0.1618,102 Exxon Mobil Corp. (Oil & Gas) 1,598,588 0.532,661 Fifth Third Bancorp (Banks) 39,223 0.01
44,484 FLIR Systems, Inc. (Electronics) 907,029 0.3080,428 Ford Motor Co.
(Automobile Manufacturers) 920,096 0.3191,723 General Electric Co.
(Miscellaneous Manufacturing) 1,942,693 0.6532,057 General Motors Co.
(Automobile Manufacturers) 829,956 0.282,122 Google, Inc. “A” (Internet) 1,462,589 0.49
12,421 Green Mountain Coffee Roasters, Inc. (Food, Beverages & Tobacco) 457,838 0.15
22,316 Halliburton Co. (Oil & Gas Services) 741,561 0.2521,373 Harley-Davidson, Inc. (Leisure Time) 1,007,096 0.3436,220 HealthSouth Corp. (Healthcare Services) 798,651 0.2747,919 Hewlett-Packard Co. (Computers) 615,759 0.212,617 HJ Heinz Co.
(Food, Beverages & Tobacco) 153,147 0.055,698 Hormel Foods Corp.
(Food, Beverages & Tobacco) 175,954 0.069,096 Illumina, Inc. (Biotechnology) 476,812 0.16
222 Intel Corp. (Semiconductors) 4,362 0.00700 Intuitive Surgical, Inc.
(Healthcare Products) 371,179 0.1230,831 Johnson & Johnson (Pharmaceuticals) 2,136,897 0.7117,006 JPMorgan Chase & Co. (Banks) 700,307 0.2372,790 Juniper Networks, Inc.
(Telecommunications) 1,302,213 0.4346,834 Key Corp. (Banks) 380,292 0.132,291 Kimberly-Clark Corp.
(Household Products/Wares) 196,476 0.073,842 Kraft Foods Group, Inc.
(Food, Beverages & Tobacco) 176,578 0.0617,493 Kroger Co. (Food, Beverages & Tobacco) 453,943 0.1518,850 Life Technologies Corp. (Biotechnology) 936,845 0.319,982 Lockheed Martin Corp.
(Aerospace & Defence) 937,509 0.3111,720 Lorillard, Inc.
(Food, Beverages & Tobacco) 1,411,908 0.473,082 Markel Corp. (Insurance) 1,505,742 0.503,342 Mastercard, Inc. “A”
(Commercial Services) 1,624,479 0.5412,543 Medtronic, Inc. (Healthcare Products) 529,942 0.1883,156 Merck & Co., Inc. (Pharmaceuticals) 3,699,610 1.2314,825 MetLife, Inc. (Insurance) 496,489 0.1770,428 Microsoft Corp. (Software) 1,889,583 0.6312,859 Mohawk Industries, Inc. (Textiles) 1,102,659 0.3728,263 Molson Coors Brewing Co. “B”
(Food, Beverages & Tobacco) 1,158,500 0.3911,526 Mondelez International, Inc. “A”
(Food, Beverages & Tobacco) 298,293 0.1026,104 Moody’s Corp. (Commercial Services) 1,261,345 0.4211,680 Mosaic Co. (Chemicals) 634,107 0.219,506 National Oilwell Varco, Inc.
(Oil & Gas Services) 661,998 0.2281,130 New York Community Bancorp, Inc.
(Diversified Financial Services) 1,054,690 0.3530,681 Newmont Mining Corp. (Mining) 1,455,813 0.4910,114 NextEra Energy, Inc. (Electric) 691,697 0.23
% ofMarket Value Shareholders’
Holdings Security Description USD Equity
% ofMarket Value Shareholders’
Holdings Security Description USD Equity
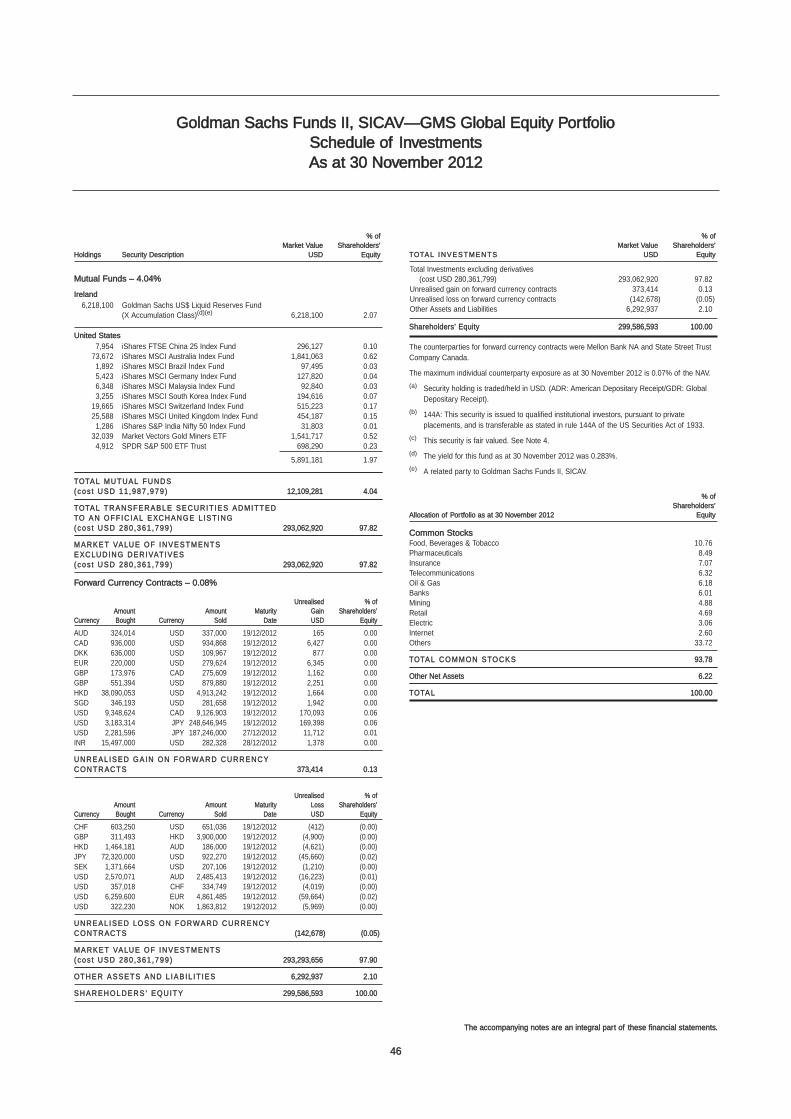
46
The accompanying notes are an integral part of these financial statements.
Schedule of InvestmentsAs at 30 November 2012
Goldman Sachs Funds II, SICAV—GMS Global Equity Portfolio
Mutual Funds – 4.04%
Ireland
6,218,100 Goldman Sachs US$ Liquid Reserves Fund (X Accumulation Class)(d)(e) 6,218,100 2.07
United States
7,954 iShares FTSE China 25 Index Fund 296,127 0.1073,672 iShares MSCI Australia Index Fund 1,841,063 0.621,892 iShares MSCI Brazil Index Fund 97,495 0.035,423 iShares MSCI Germany Index Fund 127,820 0.046,348 iShares MSCI Malaysia Index Fund 92,840 0.033,255 iShares MSCI South Korea Index Fund 194,616 0.07
19,665 iShares MSCI Switzerland Index Fund 515,223 0.1725,588 iShares MSCI United Kingdom Index Fund 454,187 0.151,286 iShares S&P India Nifty 50 Index Fund 31,803 0.01
32,039 Market Vectors Gold Miners ETF 1,541,717 0.524,912 SPDR S&P 500 ETF Trust 698,290 0.23
5,891,181 1.97
TOTAL MUTUAL FUNDS(cos t USD 11 ,987 ,979 ) 12,109,281 4.04
TOTAL TRANSFERA BLE SECURIT IES ADMITTED TO AN OFF IC IAL EXCHANGE L IST ING(cos t USD 280 ,361 ,799 ) 293,062,920 97.82
MARKET VALUE OF INVESTMENTS EXCLUDING DERIVAT IVES(cos t USD 280 ,361 ,799 ) 293,062,920 97.82
Forward Currency Contracts – 0.08%
Unrealised % ofAmount Amount Maturity Gain Shareholders’
Currency Bought Currency Sold Date USD Equity
AUD 324,014 USD 337,000 19/12/2012 165 0.00CAD 936,000 USD 934,868 19/12/2012 6,427 0.00DKK 636,000 USD 109,967 19/12/2012 877 0.00EUR 220,000 USD 279,624 19/12/2012 6,345 0.00GBP 173,976 CAD 275,609 19/12/2012 1,162 0.00GBP 551,394 USD 879,880 19/12/2012 2,251 0.00HKD 38,090,053 USD 4,913,242 19/12/2012 1,664 0.00SGD 346,193 USD 281,658 19/12/2012 1,942 0.00USD 9,348,624 CAD 9,126,903 19/12/2012 170,093 0.06USD 3,183,314 JPY 248,646,945 19/12/2012 169,398 0.06USD 2,281,596 JPY 187,246,000 27/12/2012 11,712 0.01INR 15,497,000 USD 282,328 28/12/2012 1,378 0.00
UNREAL ISED GAIN ON FORWARD CURRENCY CONTRACTS 373,414 0.13
Unrealised % ofAmount Amount Maturity Loss Shareholders’
Currency Bought Currency Sold Date USD Equity
CHF 603,250 USD 651,036 19/12/2012 (412) (0.00)GBP 311,493 HKD 3,900,000 19/12/2012 (4,900) (0.00)HKD 1,464,181 AUD 186,000 19/12/2012 (4,621) (0.00)JPY 72,320,000 USD 922,270 19/12/2012 (45,660) (0.02)SEK 1,371,664 USD 207,106 19/12/2012 (1,210) (0.00)USD 2,570,071 AUD 2,485,413 19/12/2012 (16,223) (0.01)USD 357,018 CHF 334,749 19/12/2012 (4,019) (0.00)USD 6,259,600 EUR 4,861,485 19/12/2012 (59,664) (0.02)USD 322,230 NOK 1,863,812 19/12/2012 (5,969) (0.00)
UNREAL ISED LOSS ON FORWARD CURRENCY CONTRACTS (142,678) (0.05)
MARKET VALUE OF INVESTMENTS(cos t USD 280 ,361 ,799 ) 293,293,656 97.90
OTHER ASSETS AND L IA B IL IT IES 6,292,937 2.10
SHAREHOLDERS ’ EQUITY 299,586,593 100.00
% ofMarket Value Shareholders’
TOTAL INVESTMENTS USD Equity
Total Investments excluding derivatives (cost USD 280,361,799) 293,062,920 97.82
Unrealised gain on forward currency contracts 373,414 0.13Unrealised loss on forward currency contracts (142,678) (0.05)Other Assets and Liabilities 6,292,937 2.10
Shareholders’ Equity 299,586,593 100.00
The counterparties for forward currency contracts were Mellon Bank NA and State Street TrustCompany Canada.
The maximum individual counterparty exposure as at 30 November 2012 is 0.07% of the NAV.
(a) Security holding is traded/held in USD. (ADR: American Depositary Receipt/GDR: GlobalDepositary Receipt).
(b) 144A: This security is issued to qualified institutional investors, pursuant to privateplacements, and is transferable as stated in rule 144A of the US Securities Act of 1933.
(c) This security is fair valued. See Note 4.
(d) The yield for this fund as at 30 November 2012 was 0.283%.
(e) A related party to Goldman Sachs Funds II, SICAV.
% ofShareholders’
Allocation of Portfolio as at 30 November 2012 Equity
Common StocksFood, Beverages & Tobacco 10.76Pharmaceuticals 8.49Insurance 7.07Telecommunications 6.32Oil & Gas 6.18Banks 6.01Mining 4.88Retail 4.69Electric 3.06Internet 2.60Others 33.72
TOTAL COMMON STOCKS 93.78
Other Net Assets 6.22
TOTAL 100.00
% ofMarket Value Shareholders’
Holdings Security Description USD Equity
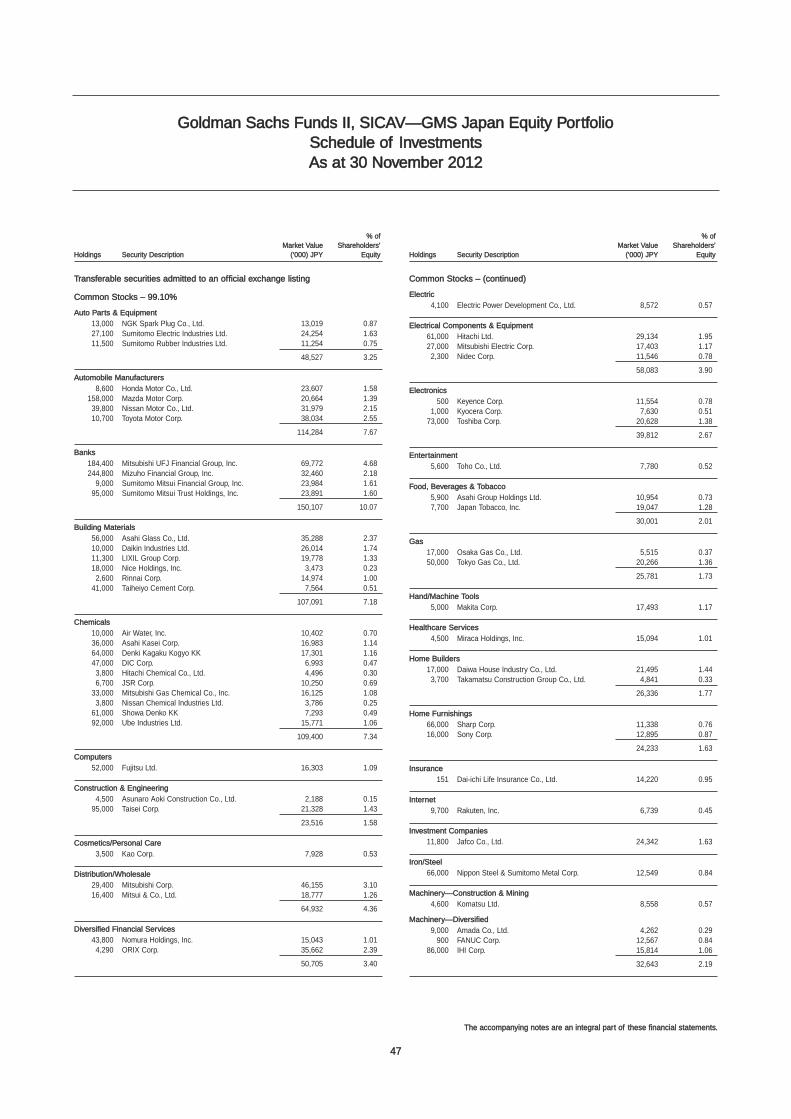
47
The accompanying notes are an integral part of these financial statements.
Schedule of InvestmentsAs at 30 November 2012
Transferable securities admitted to an official exchange listing
Common Stocks – 99.10%
Auto Parts & Equipment
13,000 NGK Spark Plug Co., Ltd. 13,019 0.8727,100 Sumitomo Electric Industries Ltd. 24,254 1.6311,500 Sumitomo Rubber Industries Ltd. 11,254 0.75
48,527 3.25
Automobile Manufacturers
8,600 Honda Motor Co., Ltd. 23,607 1.58158,000 Mazda Motor Corp. 20,664 1.3939,800 Nissan Motor Co., Ltd. 31,979 2.1510,700 Toyota Motor Corp. 38,034 2.55
114,284 7.67
Banks
184,400 Mitsubishi UFJ Financial Group, Inc. 69,772 4.68244,800 Mizuho Financial Group, Inc. 32,460 2.18
9,000 Sumitomo Mitsui Financial Group, Inc. 23,984 1.6195,000 Sumitomo Mitsui Trust Holdings, Inc. 23,891 1.60
150,107 10.07
Building Materials
56,000 Asahi Glass Co., Ltd. 35,288 2.3710,000 Daikin Industries Ltd. 26,014 1.7411,300 LIXIL Group Corp. 19,778 1.3318,000 Nice Holdings, Inc. 3,473 0.232,600 Rinnai Corp. 14,974 1.00
41,000 Taiheiyo Cement Corp. 7,564 0.51
107,091 7.18
Chemicals
10,000 Air Water, Inc. 10,402 0.7036,000 Asahi Kasei Corp. 16,983 1.1464,000 Denki Kagaku Kogyo KK 17,301 1.1647,000 DIC Corp. 6,993 0.473,800 Hitachi Chemical Co., Ltd. 4,496 0.306,700 JSR Corp. 10,250 0.69
33,000 Mitsubishi Gas Chemical Co., Inc. 16,125 1.083,800 Nissan Chemical Industries Ltd. 3,786 0.25
61,000 Showa Denko KK 7,293 0.4992,000 Ube Industries Ltd. 15,771 1.06
109,400 7.34
Computers
52,000 Fujitsu Ltd. 16,303 1.09
Construction & Engineering
4,500 Asunaro Aoki Construction Co., Ltd. 2,188 0.1595,000 Taisei Corp. 21,328 1.43
23,516 1.58
Cosmetics/Personal Care
3,500 Kao Corp. 7,928 0.53
Distribution/Wholesale
29,400 Mitsubishi Corp. 46,155 3.1016,400 Mitsui & Co., Ltd. 18,777 1.26
64,932 4.36
Diversified Financial Services
43,800 Nomura Holdings, Inc. 15,043 1.014,290 ORIX Corp. 35,662 2.39
50,705 3.40
Common Stocks – (continued)
Electric
4,100 Electric Power Development Co., Ltd. 8,572 0.57
Electrical Components & Equipment
61,000 Hitachi Ltd. 29,134 1.9527,000 Mitsubishi Electric Corp. 17,403 1.172,300 Nidec Corp. 11,546 0.78
58,083 3.90
Electronics
500 Keyence Corp. 11,554 0.781,000 Kyocera Corp. 7,630 0.51
73,000 Toshiba Corp. 20,628 1.38
39,812 2.67
Entertainment
5,600 Toho Co., Ltd. 7,780 0.52
Food, Beverages & Tobacco
5,900 Asahi Group Holdings Ltd. 10,954 0.737,700 Japan Tobacco, Inc. 19,047 1.28
30,001 2.01
Gas
17,000 Osaka Gas Co., Ltd. 5,515 0.3750,000 Tokyo Gas Co., Ltd. 20,266 1.36
25,781 1.73
Hand/Machine Tools
5,000 Makita Corp. 17,493 1.17
Healthcare Services
4,500 Miraca Holdings, Inc. 15,094 1.01
Home Builders
17,000 Daiwa House Industry Co., Ltd. 21,495 1.443,700 Takamatsu Construction Group Co., Ltd. 4,841 0.33
26,336 1.77
Home Furnishings
66,000 Sharp Corp. 11,338 0.7616,000 Sony Corp. 12,895 0.87
24,233 1.63
Insurance
151 Dai-ichi Life Insurance Co., Ltd. 14,220 0.95
Internet
9,700 Rakuten, Inc. 6,739 0.45
Investment Companies
11,800 Jafco Co., Ltd. 24,342 1.63
Iron/Steel
66,000 Nippon Steel & Sumitomo Metal Corp. 12,549 0.84
Machinery—Construction & Mining
4,600 Komatsu Ltd. 8,558 0.57
Machinery—Diversified
9,000 Amada Co., Ltd. 4,262 0.29900 FANUC Corp. 12,567 0.84
86,000 IHI Corp. 15,814 1.06
32,643 2.19
Goldman Sachs Funds II, SICAV—GMS Japan Equity Portfolio
% ofMarket Value Shareholders’
Holdings Security Description (‘000) JPY Equity
% ofMarket Value Shareholders’
Holdings Security Description (‘000) JPY Equity
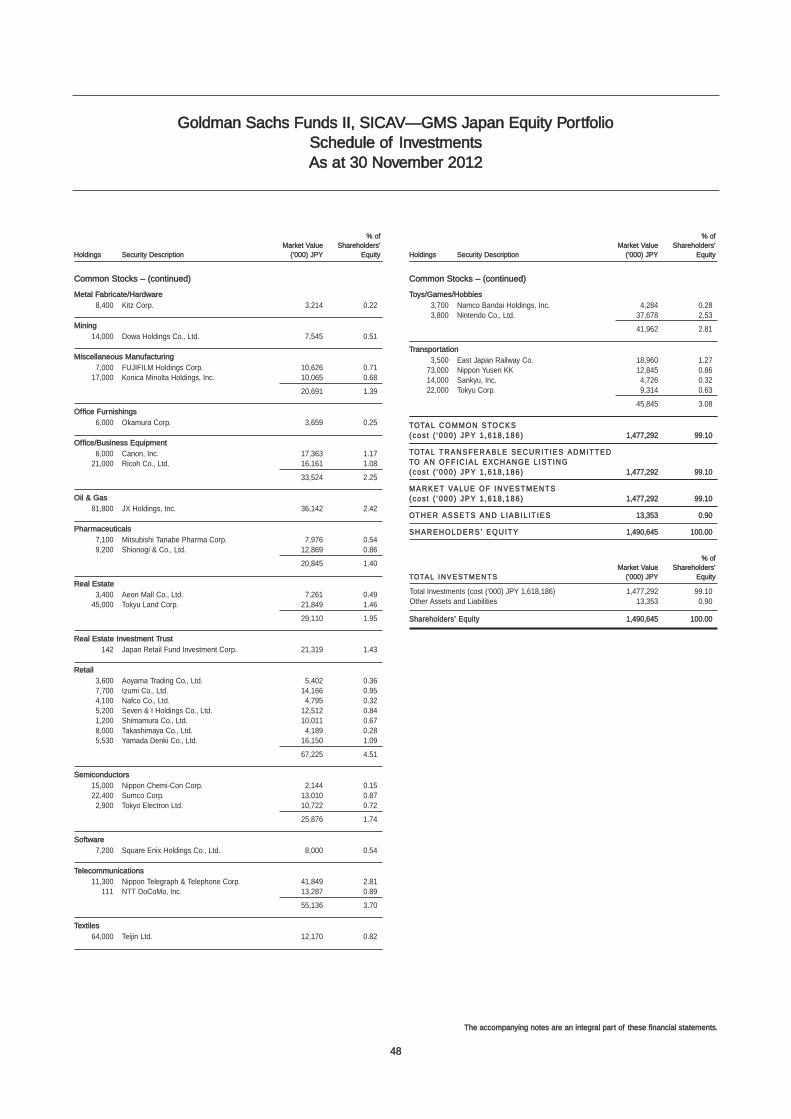
48
The accompanying notes are an integral part of these financial statements.
Schedule of InvestmentsAs at 30 November 2012
Common Stocks – (continued)
Metal Fabricate/Hardware
8,400 Kitz Corp. 3,214 0.22
Mining
14,000 Dowa Holdings Co., Ltd. 7,545 0.51
Miscellaneous Manufacturing
7,000 FUJIFILM Holdings Corp. 10,626 0.7117,000 Konica Minolta Holdings, Inc. 10,065 0.68
20,691 1.39
Office Furnishings
6,000 Okamura Corp. 3,659 0.25
Office/Business Equipment
6,000 Canon, Inc. 17,363 1.1721,000 Ricoh Co., Ltd. 16,161 1.08
33,524 2.25
Oil & Gas
81,800 JX Holdings, Inc. 36,142 2.42
Pharmaceuticals
7,100 Mitsubishi Tanabe Pharma Corp. 7,976 0.549,200 Shionogi & Co., Ltd. 12,869 0.86
20,845 1.40
Real Estate
3,400 Aeon Mall Co., Ltd. 7,261 0.4945,000 Tokyu Land Corp. 21,849 1.46
29,110 1.95
Real Estate Investment Trust
142 Japan Retail Fund Investment Corp. 21,319 1.43
Retail
3,600 Aoyama Trading Co., Ltd. 5,402 0.367,700 Izumi Co., Ltd. 14,166 0.954,100 Nafco Co., Ltd. 4,795 0.325,200 Seven & I Holdings Co., Ltd. 12,512 0.841,200 Shimamura Co., Ltd. 10,011 0.678,000 Takashimaya Co., Ltd. 4,189 0.285,530 Yamada Denki Co., Ltd. 16,150 1.09
67,225 4.51
Semiconductors
15,000 Nippon Chemi-Con Corp. 2,144 0.1522,400 Sumco Corp. 13,010 0.872,900 Tokyo Electron Ltd. 10,722 0.72
25,876 1.74
Software
7,200 Square Enix Holdings Co., Ltd. 8,000 0.54
Telecommunications
11,300 Nippon Telegraph & Telephone Corp. 41,849 2.81111 NTT DoCoMo, Inc. 13,287 0.89
55,136 3.70
Textiles
64,000 Teijin Ltd. 12,170 0.82
Common Stocks – (continued)
Toys/Games/Hobbies
3,700 Namco Bandai Holdings, Inc. 4,284 0.283,800 Nintendo Co., Ltd. 37,678 2.53
41,962 2.81
Transportation
3,500 East Japan Railway Co. 18,960 1.2773,000 Nippon Yusen KK 12,845 0.8614,000 Sankyu, Inc. 4,726 0.3222,000 Tokyu Corp. 9,314 0.63
45,845 3.08
TOTAL COMMON STOCKS(cos t ( ‘ 000 ) JPY 1 ,618 ,186 ) 1,477,292 99.10
TOTAL TRANSFERA BLE SECURIT IES ADMITTED TO AN OFF IC IAL EXCHANGE L IST ING(cos t ( ‘ 000 ) JPY 1 ,618 ,186 ) 1,477,292 99.10
MARKET VALUE OF INVESTMENTS(cos t ( ‘ 000 ) JPY 1 ,618 ,186 ) 1,477,292 99.10
OTHER ASSETS AND L IA B IL IT IES 13,353 0.90
SHAREHOLDERS ’ EQUITY 1,490,645 100.00
% ofMarket Value Shareholders’
TOTAL INVESTMENTS (‘000) JPY Equity
Total Investments (cost (‘000) JPY 1,618,186) 1,477,292 99.10Other Assets and Liabilities 13,353 0.90
Shareholders’ Equity 1,490,645 100.00
Goldman Sachs Funds II, SICAV—GMS Japan Equity Portfolio
% ofMarket Value Shareholders’
Holdings Security Description (‘000) JPY Equity
% ofMarket Value Shareholders’
Holdings Security Description (‘000) JPY Equity
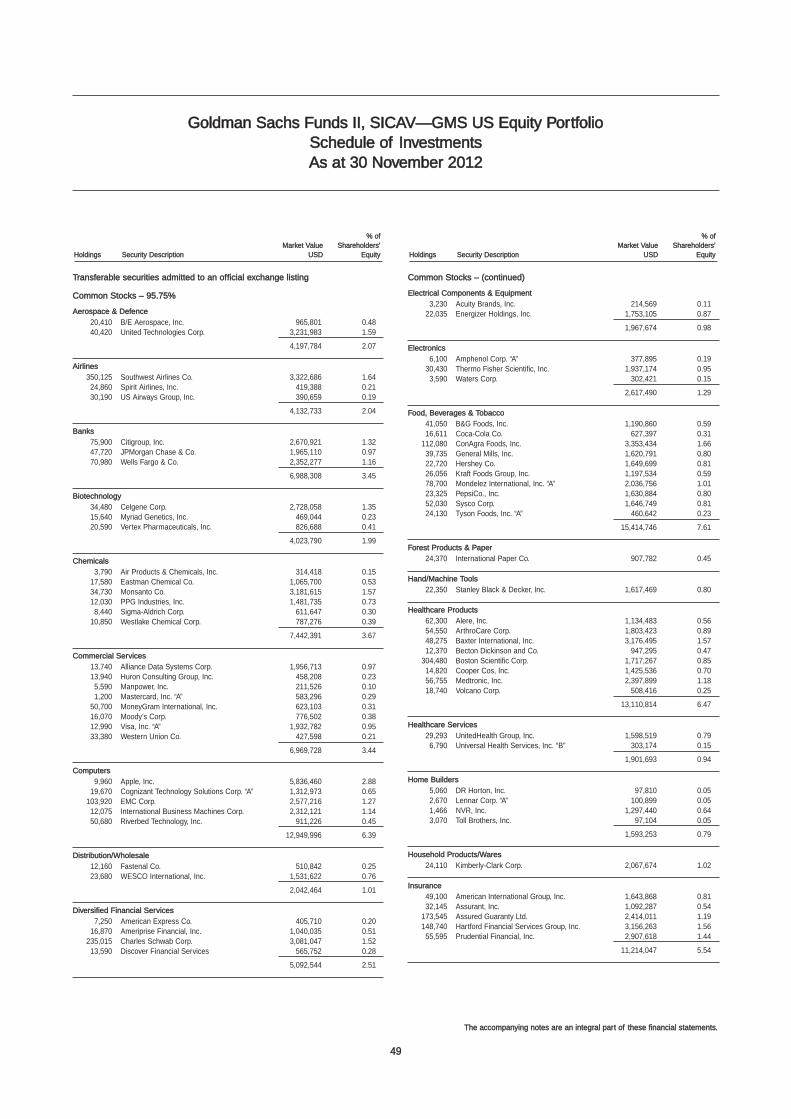
49
The accompanying notes are an integral part of these financial statements.
Schedule of InvestmentsAs at 30 November 2012
Goldman Sachs Funds II, SICAV—GMS US Equity Portfolio
Transferable securities admitted to an official exchange listing
Common Stocks – 95.75%
Aerospace & Defence
20,410 B/E Aerospace, Inc. 965,801 0.4840,420 United Technologies Corp. 3,231,983 1.59
4,197,784 2.07
Airlines
350,125 Southwest Airlines Co. 3,322,686 1.6424,860 Spirit Airlines, Inc. 419,388 0.2130,190 US Airways Group, Inc. 390,659 0.19
4,132,733 2.04
Banks
75,900 Citigroup, Inc. 2,670,921 1.3247,720 JPMorgan Chase & Co. 1,965,110 0.9770,980 Wells Fargo & Co. 2,352,277 1.16
6,988,308 3.45
Biotechnology
34,480 Celgene Corp. 2,728,058 1.3515,640 Myriad Genetics, Inc. 469,044 0.2320,590 Vertex Pharmaceuticals, Inc. 826,688 0.41
4,023,790 1.99
Chemicals
3,790 Air Products & Chemicals, Inc. 314,418 0.1517,580 Eastman Chemical Co. 1,065,700 0.5334,730 Monsanto Co. 3,181,615 1.5712,030 PPG Industries, Inc. 1,481,735 0.738,440 Sigma-Aldrich Corp. 611,647 0.30
10,850 Westlake Chemical Corp. 787,276 0.39
7,442,391 3.67
Commercial Services
13,740 Alliance Data Systems Corp. 1,956,713 0.9713,940 Huron Consulting Group, Inc. 458,208 0.235,590 Manpower, Inc. 211,526 0.101,200 Mastercard, Inc. “A” 583,296 0.29
50,700 MoneyGram International, Inc. 623,103 0.3116,070 Moody’s Corp. 776,502 0.3812,990 Visa, Inc. “A” 1,932,782 0.9533,380 Western Union Co. 427,598 0.21
6,969,728 3.44
Computers
9,960 Apple, Inc. 5,836,460 2.8819,670 Cognizant Technology Solutions Corp. “A” 1,312,973 0.65
103,920 EMC Corp. 2,577,216 1.2712,075 International Business Machines Corp. 2,312,121 1.1450,680 Riverbed Technology, Inc. 911,226 0.45
12,949,996 6.39
Distribution/Wholesale
12,160 Fastenal Co. 510,842 0.2523,680 WESCO International, Inc. 1,531,622 0.76
2,042,464 1.01
Diversified Financial Services
7,250 American Express Co. 405,710 0.2016,870 Ameriprise Financial, Inc. 1,040,035 0.51
235,015 Charles Schwab Corp. 3,081,047 1.5213,590 Discover Financial Services 565,752 0.28
5,092,544 2.51
Common Stocks – (continued)
Electrical Components & Equipment
3,230 Acuity Brands, Inc. 214,569 0.1122,035 Energizer Holdings, Inc. 1,753,105 0.87
1,967,674 0.98
Electronics
6,100 Amphenol Corp. “A” 377,895 0.1930,430 Thermo Fisher Scientific, Inc. 1,937,174 0.953,590 Waters Corp. 302,421 0.15
2,617,490 1.29
Food, Beverages & Tobacco
41,050 B&G Foods, Inc. 1,190,860 0.5916,611 Coca-Cola Co. 627,397 0.31
112,080 ConAgra Foods, Inc. 3,353,434 1.6639,735 General Mills, Inc. 1,620,791 0.8022,720 Hershey Co. 1,649,699 0.8126,056 Kraft Foods Group, Inc. 1,197,534 0.5978,700 Mondelez International, Inc. “A” 2,036,756 1.0123,325 PepsiCo., Inc. 1,630,884 0.8052,030 Sysco Corp. 1,646,749 0.8124,130 Tyson Foods, Inc. “A” 460,642 0.23
15,414,746 7.61
Forest Products & Paper
24,370 International Paper Co. 907,782 0.45
Hand/Machine Tools
22,350 Stanley Black & Decker, Inc. 1,617,469 0.80
Healthcare Products
62,300 Alere, Inc. 1,134,483 0.5654,550 ArthroCare Corp. 1,803,423 0.8948,275 Baxter International, Inc. 3,176,495 1.5712,370 Becton Dickinson and Co. 947,295 0.47
304,480 Boston Scientific Corp. 1,717,267 0.8514,820 Cooper Cos, Inc. 1,425,536 0.7056,755 Medtronic, Inc. 2,397,899 1.1818,740 Volcano Corp. 508,416 0.25
13,110,814 6.47
Healthcare Services
29,293 UnitedHealth Group, Inc. 1,598,519 0.796,790 Universal Health Services, Inc. “B” 303,174 0.15
1,901,693 0.94
Home Builders
5,060 DR Horton, Inc. 97,810 0.052,670 Lennar Corp. “A” 100,899 0.051,466 NVR, Inc. 1,297,440 0.643,070 Toll Brothers, Inc. 97,104 0.05
1,593,253 0.79
Household Products/Wares
24,110 Kimberly-Clark Corp. 2,067,674 1.02
Insurance
49,100 American International Group, Inc. 1,643,868 0.8132,145 Assurant, Inc. 1,092,287 0.54
173,545 Assured Guaranty Ltd. 2,414,011 1.19148,740 Hartford Financial Services Group, Inc. 3,156,263 1.5655,595 Prudential Financial, Inc. 2,907,618 1.44
11,214,047 5.54
% ofMarket Value Shareholders’
Holdings Security Description USD Equity
% ofMarket Value Shareholders’
Holdings Security Description USD Equity
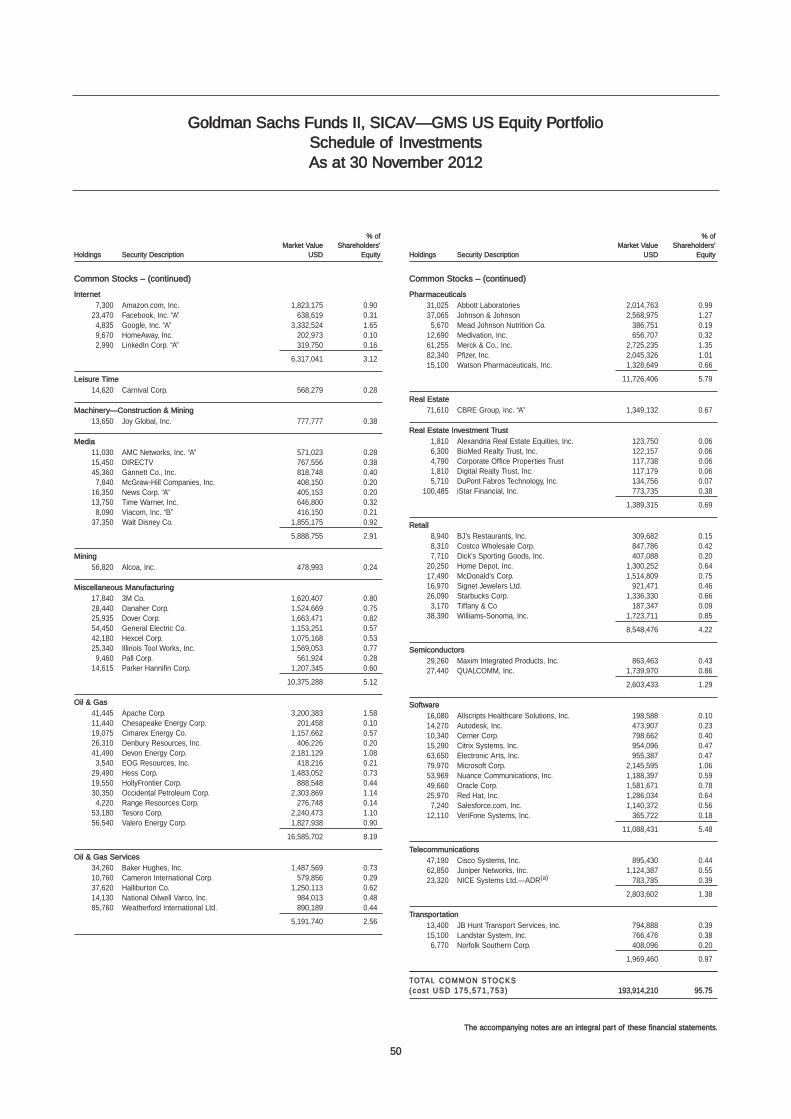
50
The accompanying notes are an integral part of these financial statements.
Schedule of InvestmentsAs at 30 November 2012
Common Stocks – (continued)
Internet
7,300 Amazon.com, Inc. 1,823,175 0.9023,470 Facebook, Inc. “A” 638,619 0.314,835 Google, Inc. “A” 3,332,524 1.659,670 HomeAway, Inc. 202,973 0.102,990 LinkedIn Corp. “A” 319,750 0.16
6,317,041 3.12
Leisure Time
14,620 Carnival Corp. 568,279 0.28
Machinery—Construction & Mining
13,650 Joy Global, Inc. 777,777 0.38
Media
11,030 AMC Networks, Inc. “A” 571,023 0.2815,450 DIRECTV 767,556 0.3845,360 Gannett Co., Inc. 818,748 0.407,840 McGraw-Hill Companies, Inc. 408,150 0.20
16,350 News Corp. “A” 405,153 0.2013,750 Time Warner, Inc. 646,800 0.328,090 Viacom, Inc. “B” 416,150 0.21
37,350 Walt Disney Co. 1,855,175 0.92
5,888,755 2.91
Mining
56,820 Alcoa, Inc. 478,993 0.24
Miscellaneous Manufacturing
17,840 3M Co. 1,620,407 0.8028,440 Danaher Corp. 1,524,669 0.7525,935 Dover Corp. 1,663,471 0.8254,450 General Electric Co. 1,153,251 0.5742,180 Hexcel Corp. 1,075,168 0.5325,340 Illinois Tool Works, Inc. 1,569,053 0.779,460 Pall Corp. 561,924 0.28
14,615 Parker Hannifin Corp. 1,207,345 0.60
10,375,288 5.12
Oil & Gas
41,445 Apache Corp. 3,200,383 1.5811,440 Chesapeake Energy Corp. 201,458 0.1019,075 Cimarex Energy Co. 1,157,662 0.5726,310 Denbury Resources, Inc. 406,226 0.2041,490 Devon Energy Corp. 2,181,129 1.083,540 EOG Resources, Inc. 418,216 0.21
29,490 Hess Corp. 1,483,052 0.7319,550 HollyFrontier Corp. 888,548 0.4430,350 Occidental Petroleum Corp. 2,303,869 1.144,220 Range Resources Corp. 276,748 0.14
53,180 Tesoro Corp. 2,240,473 1.1056,540 Valero Energy Corp. 1,827,938 0.90
16,585,702 8.19
Oil & Gas Services
34,260 Baker Hughes, Inc. 1,487,569 0.7310,760 Cameron International Corp. 579,856 0.2937,620 Halliburton Co. 1,250,113 0.6214,130 National Oilwell Varco, Inc. 984,013 0.4885,760 Weatherford International Ltd. 890,189 0.44
5,191,740 2.56
Common Stocks – (continued)
Pharmaceuticals
31,025 Abbott Laboratories 2,014,763 0.9937,065 Johnson & Johnson 2,568,975 1.275,670 Mead Johnson Nutrition Co. 386,751 0.19
12,690 Medivation, Inc. 656,707 0.3261,255 Merck & Co., Inc. 2,725,235 1.3582,340 Pfizer, Inc. 2,045,326 1.0115,100 Watson Pharmaceuticals, Inc. 1,328,649 0.66
11,726,406 5.79
Real Estate
71,610 CBRE Group, Inc. “A” 1,349,132 0.67
Real Estate Investment Trust
1,810 Alexandria Real Estate Equities, Inc. 123,750 0.066,300 BioMed Realty Trust, Inc. 122,157 0.064,790 Corporate Office Properties Trust 117,738 0.061,810 Digital Realty Trust, Inc. 117,179 0.065,710 DuPont Fabros Technology, Inc. 134,756 0.07
100,485 iStar Financial, Inc. 773,735 0.38
1,389,315 0.69
Retail
8,940 BJ’s Restaurants, Inc. 309,682 0.158,310 Costco Wholesale Corp. 847,786 0.427,710 Dick’s Sporting Goods, Inc. 407,088 0.20
20,250 Home Depot, Inc. 1,300,252 0.6417,490 McDonald’s Corp. 1,514,809 0.7516,970 Signet Jewelers Ltd. 921,471 0.4626,090 Starbucks Corp. 1,336,330 0.663,170 Tiffany & Co 187,347 0.09
38,390 Williams-Sonoma, Inc. 1,723,711 0.85
8,548,476 4.22
Semiconductors
29,260 Maxim Integrated Products, Inc. 863,463 0.4327,440 QUALCOMM, Inc. 1,739,970 0.86
2,603,433 1.29
Software
16,080 Allscripts Healthcare Solutions, Inc. 198,588 0.1014,270 Autodesk, Inc. 473,907 0.2310,340 Cerner Corp. 798,662 0.4015,290 Citrix Systems, Inc. 954,096 0.4763,650 Electronic Arts, Inc. 955,387 0.4779,970 Microsoft Corp. 2,145,595 1.0653,969 Nuance Communications, Inc. 1,188,397 0.5949,660 Oracle Corp. 1,581,671 0.7825,970 Red Hat, Inc. 1,286,034 0.647,240 Salesforce.com, Inc. 1,140,372 0.56
12,110 VeriFone Systems, Inc. 365,722 0.18
11,088,431 5.48
Telecommunications
47,190 Cisco Systems, Inc. 895,430 0.4462,850 Juniper Networks, Inc. 1,124,387 0.5523,320 NICE Systems Ltd.—ADR(a) 783,785 0.39
2,803,602 1.38
Transportation
13,400 JB Hunt Transport Services, Inc. 794,888 0.3915,100 Landstar System, Inc. 766,476 0.386,770 Norfolk Southern Corp. 408,096 0.20
1,969,460 0.97
TOTAL COMMON STOCKS(cos t USD 175 ,571 ,753 ) 193,914,210 95.75
Goldman Sachs Funds II, SICAV—GMS US Equity Portfolio
% ofMarket Value Shareholders’
Holdings Security Description USD Equity
% ofMarket Value Shareholders’
Holdings Security Description USD Equity
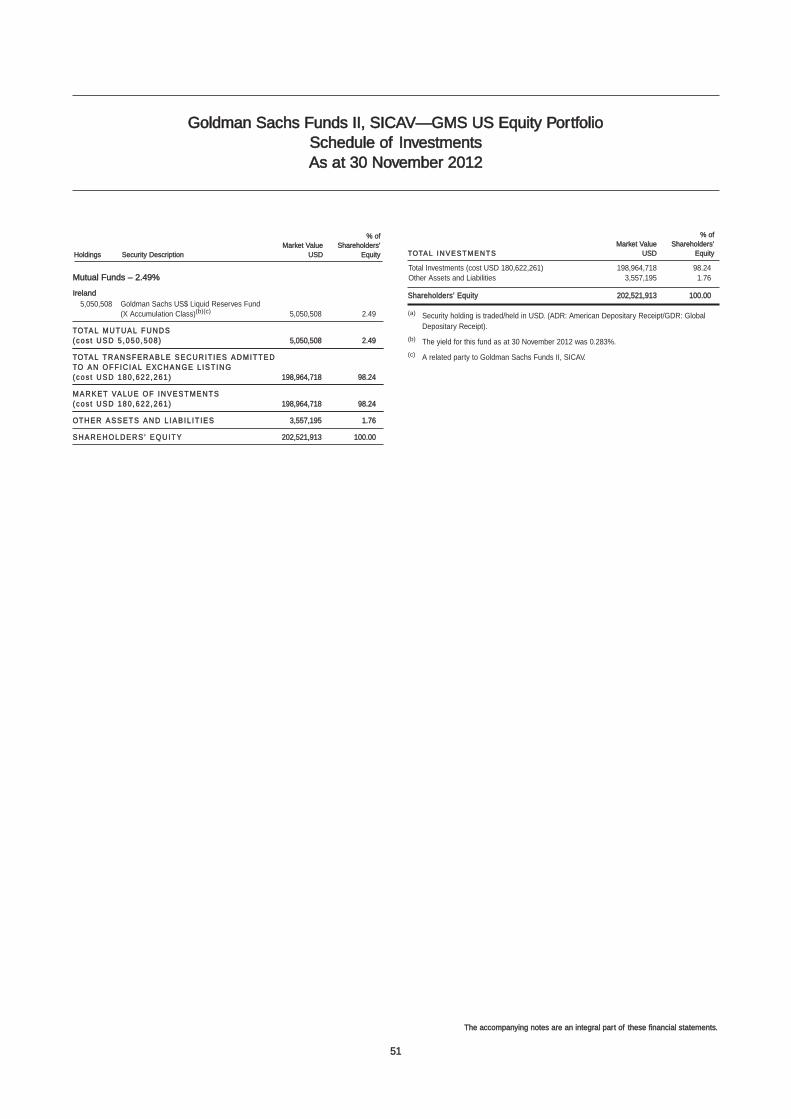
51
The accompanying notes are an integral part of these financial statements.
Schedule of InvestmentsAs at 30 November 2012
Goldman Sachs Funds II, SICAV—GMS US Equity Portfolio
% ofMarket Value Shareholders’
Holdings Security Description USD Equity
Mutual Funds – 2.49%
Ireland
5,050,508 Goldman Sachs US$ Liquid Reserves Fund (X Accumulation Class)(b)(c) 5,050,508 2.49
TOTAL MUTUAL FUNDS(cos t USD 5 ,050 ,508 ) 5,050,508 2.49
TOTAL TRANSFERA BLE SECURIT IES ADMITTED TO AN OFF IC IAL EXCHANGE L IST ING(cos t USD 180 ,622 ,261 ) 198,964,718 98.24
MARKET VALUE OF INVESTMENTS(cos t USD 180 ,622 ,261 ) 198,964,718 98.24
OTHER ASSETS AND L IA B IL IT IES 3,557,195 1.76
SHAREHOLDERS ’ EQUITY 202,521,913 100.00
% ofMarket Value Shareholders’
TOTAL INVESTMENTS USD Equity
Total Investments (cost USD 180,622,261) 198,964,718 98.24Other Assets and Liabilities 3,557,195 1.76
Shareholders’ Equity 202,521,913 100.00
(a) Security holding is traded/held in USD. (ADR: American Depositary Receipt/GDR: GlobalDepositary Receipt).
(b) The yield for this fund as at 30 November 2012 was 0.283%.
(c) A related party to Goldman Sachs Funds II, SICAV.
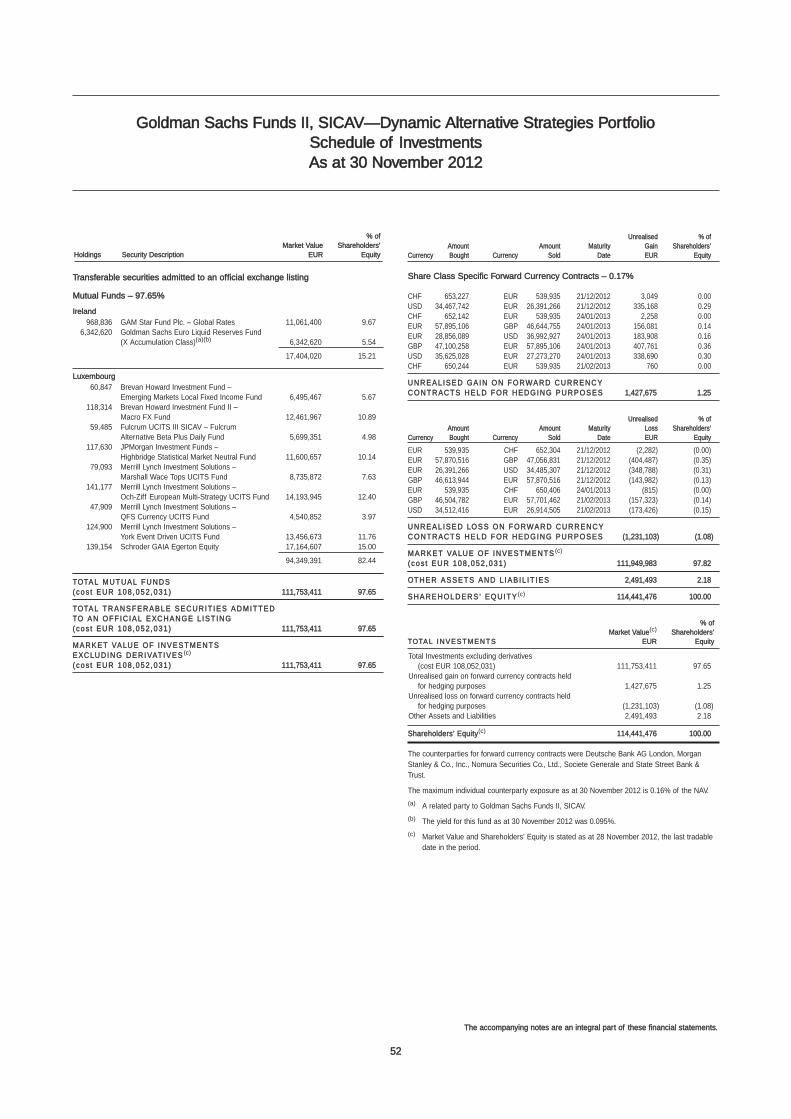
52
The accompanying notes are an integral part of these financial statements.
Schedule of InvestmentsAs at 30 November 2012
Goldman Sachs Funds II, SICAV—Dynamic Alternative Strategies Portfolio
Transferable securities admitted to an official exchange listing
Mutual Funds – 97.65%
Ireland
968,836 GAM Star Fund Plc. – Global Rates 11,061,400 9.676,342,620 Goldman Sachs Euro Liquid Reserves Fund
(X Accumulation Class)(a)(b) 6,342,620 5.54
17,404,020 15.21
Luxembourg
60,847 Brevan Howard Investment Fund – Emerging Markets Local Fixed Income Fund 6,495,467 5.67
118,314 Brevan Howard Investment Fund II – Macro FX Fund 12,461,967 10.89
59,485 Fulcrum UCITS III SICAV – Fulcrum Alternative Beta Plus Daily Fund 5,699,351 4.98
117,630 JPMorgan Investment Funds – Highbridge Statistical Market Neutral Fund 11,600,657 10.14
79,093 Merrill Lynch Investment Solutions – Marshall Wace Tops UCITS Fund 8,735,872 7.63
141,177 Merrill Lynch Investment Solutions – Och-Ziff European Multi-Strategy UCITS Fund 14,193,945 12.40
47,909 Merrill Lynch Investment Solutions – QFS Currency UCITS Fund 4,540,852 3.97
124,900 Merrill Lynch Investment Solutions – York Event Driven UCITS Fund 13,456,673 11.76
139,154 Schroder GAIA Egerton Equity 17,164,607 15.00
94,349,391 82.44
TOTAL MUTUAL FUNDS(cos t EUR 108 ,052 ,031 ) 111,753,411 97.65
TOTAL TRANSFERA BLE SECURIT IES ADMITTED TO AN OFF IC IAL EXCHANGE L IST ING(cos t EUR 108 ,052 ,031 ) 111,753,411 97.65
MARKET VALUE OF INVESTMENTS EXCLUDING DERIVAT IVES (c)
( cos t EUR 108 ,052 ,031 ) 111,753,411 97.65
Unrealised % ofAmount Amount Maturity Gain Shareholders’
Currency Bought Currency Sold Date EUR Equity
Share Class Specific Forward Currency Contracts – 0.17%
CHF 653,227 EUR 539,935 21/12/2012 3,049 0.00USD 34,467,742 EUR 26,391,266 21/12/2012 335,168 0.29CHF 652,142 EUR 539,935 24/01/2013 2,258 0.00EUR 57,895,106 GBP 46,644,755 24/01/2013 156,081 0.14EUR 28,856,089 USD 36,992,927 24/01/2013 183,908 0.16GBP 47,100,258 EUR 57,895,106 24/01/2013 407,761 0.36USD 35,625,028 EUR 27,273,270 24/01/2013 338,690 0.30CHF 650,244 EUR 539,935 21/02/2013 760 0.00
UNREAL ISED GAIN ON FORWARD CURRENCY CONTRACTS HELD FOR HEDGING PURPOSES 1,427,675 1.25
Unrealised % ofAmount Amount Maturity Loss Shareholders’
Currency Bought Currency Sold Date EUR Equity
EUR 539,935 CHF 652,304 21/12/2012 (2,282) (0.00)EUR 57,870,516 GBP 47,056,831 21/12/2012 (404,487) (0.35)EUR 26,391,266 USD 34,485,307 21/12/2012 (348,788) (0.31)GBP 46,613,944 EUR 57,870,516 21/12/2012 (143,982) (0.13)EUR 539,935 CHF 650,406 24/01/2013 (815) (0.00)GBP 46,504,782 EUR 57,701,462 21/02/2013 (157,323) (0.14)USD 34,512,416 EUR 26,914,505 21/02/2013 (173,426) (0.15)
UNREAL ISED LOSS ON FORWARD CURRENCY CONTRACTS HELD FOR HEDGING PURPOSES (1,231,103) (1.08)
MARKET VALUE OF INVESTMENTS (c)
( cos t EUR 108 ,052 ,031 ) 111,949,983 97.82
OTHER ASSETS AND L IA B IL IT IES 2,491,493 2.18
SHAREHOLDERS ’ EQUITY (c) 114,441,476 100.00
% ofMarket Value(c) Shareholders’
TOTAL INVESTMENTS EUR Equity
Total Investments excluding derivatives (cost EUR 108,052,031) 111,753,411 97.65
Unrealised gain on forward currency contracts held for hedging purposes 1,427,675 1.25
Unrealised loss on forward currency contracts held for hedging purposes (1,231,103) (1.08)
Other Assets and Liabilities 2,491,493 2.18
Shareholders’ Equity(c) 114,441,476 100.00
The counterparties for forward currency contracts were Deutsche Bank AG London, MorganStanley & Co., Inc., Nomura Securities Co., Ltd., Societe Generale and State Street Bank &Trust.
The maximum individual counterparty exposure as at 30 November 2012 is 0.16% of the NAV.
(a) A related party to Goldman Sachs Funds II, SICAV.
(b) The yield for this fund as at 30 November 2012 was 0.095%.
(c) Market Value and Shareholders’ Equity is stated as at 28 November 2012, the last tradabledate in the period.
% ofMarket Value Shareholders’
Holdings Security Description EUR Equity
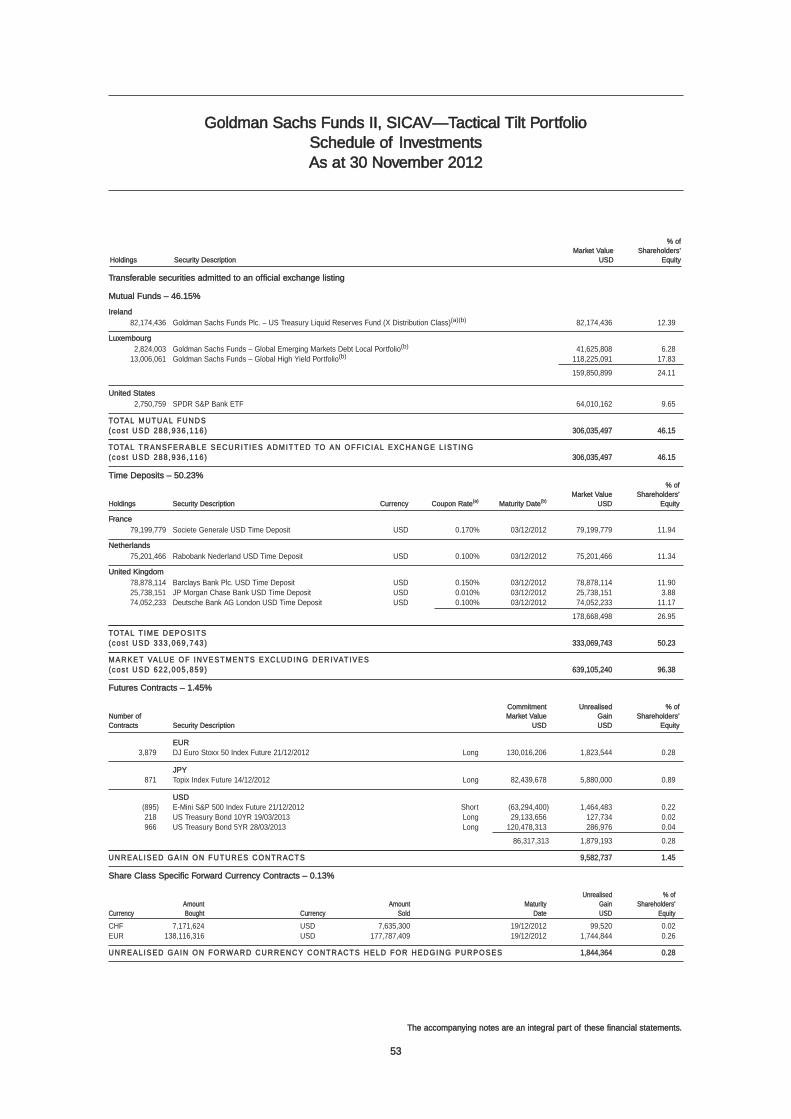
Schedule of InvestmentsAs at 30 November 2012
53
The accompanying notes are an integral part of these financial statements.
Goldman Sachs Funds II, SICAV—Tactical Tilt Portfolio
Transferable securities admitted to an official exchange listing
Mutual Funds – 46.15%
Ireland
82,174,436 Goldman Sachs Funds Plc. – US Treasury Liquid Reserves Fund (X Distribution Class)(a)(b) 82,174,436 12.39
Luxembourg
2,824,003 Goldman Sachs Funds – Global Emerging Markets Debt Local Portfolio(b) 41,625,808 6.2813,006,061 Goldman Sachs Funds – Global High Yield Portfolio(b) 118,225,091 17.83
159,850,899 24.11
United States
2,750,759 SPDR S&P Bank ETF 64,010,162 9.65
TOTAL MUTUAL FUNDS(cos t USD 288 ,936 ,116 ) 306,035,497 46.15
TOTAL TRANSFERA BLE SECURIT IES ADMITTED TO AN OFF IC IAL EXCHANGE L IST ING(cos t USD 288 ,936 ,116 ) 306,035,497 46.15
Time Deposits – 50.23%% of
Market Value Shareholders’Holdings Security Description Currency Coupon Rate(a) Maturity Date(b) USD Equity
France
79,199,779 Societe Generale USD Time Deposit USD 0.170% 03/12/2012 79,199,779 11.94
Netherlands
75,201,466 Rabobank Nederland USD Time Deposit USD 0.100% 03/12/2012 75,201,466 11.34
United Kingdom
78,878,114 Barclays Bank Plc. USD Time Deposit USD 0.150% 03/12/2012 78,878,114 11.9025,738,151 JP Morgan Chase Bank USD Time Deposit USD 0.010% 03/12/2012 25,738,151 3.8874,052,233 Deutsche Bank AG London USD Time Deposit USD 0.100% 03/12/2012 74,052,233 11.17
178,668,498 26.95
TOTAL T IME DEPOSITS(cos t USD 333 ,069 ,743 ) 333,069,743 50.23
MARKET VALUE OF INVESTMENTS EXCLUDING DERIVAT IVES(cos t USD 622 ,005 ,859 ) 639,105,240 96.38
Futures Contracts – 1.45%
Commitment Unrealised % ofNumber of Market Value Gain Shareholders’Contracts Security Description USD USD Equity
EUR3,879 DJ Euro Stoxx 50 Index Future 21/12/2012 Long 130,016,206 1,823,544 0.28
JPY871 Topix Index Future 14/12/2012 Long 82,439,678 5,880,000 0.89
USD(895) E-Mini S&P 500 Index Future 21/12/2012 Short (63,294,400) 1,464,483 0.22218 US Treasury Bond 10YR 19/03/2013 Long 29,133,656 127,734 0.02966 US Treasury Bond 5YR 28/03/2013 Long 120,478,313 286,976 0.04
86,317,313 1,879,193 0.28
UNREAL ISED GAIN ON FUTURES CONTRACTS 9,582,737 1.45
Share Class Specific Forward Currency Contracts – 0.13%
Unrealised % ofAmount Amount Maturity Gain Shareholders’
Currency Bought Currency Sold Date USD Equity
CHF 7,171,624 USD 7,635,300 19/12/2012 99,520 0.02EUR 138,116,316 USD 177,787,409 19/12/2012 1,744,844 0.26
UNREAL ISED GAIN ON FORWARD CURRENCY CONTRACTS HELD FOR HEDGING PURPOSES 1,844,364 0.28
% ofMarket Value Shareholders’
Holdings Security Description USD Equity
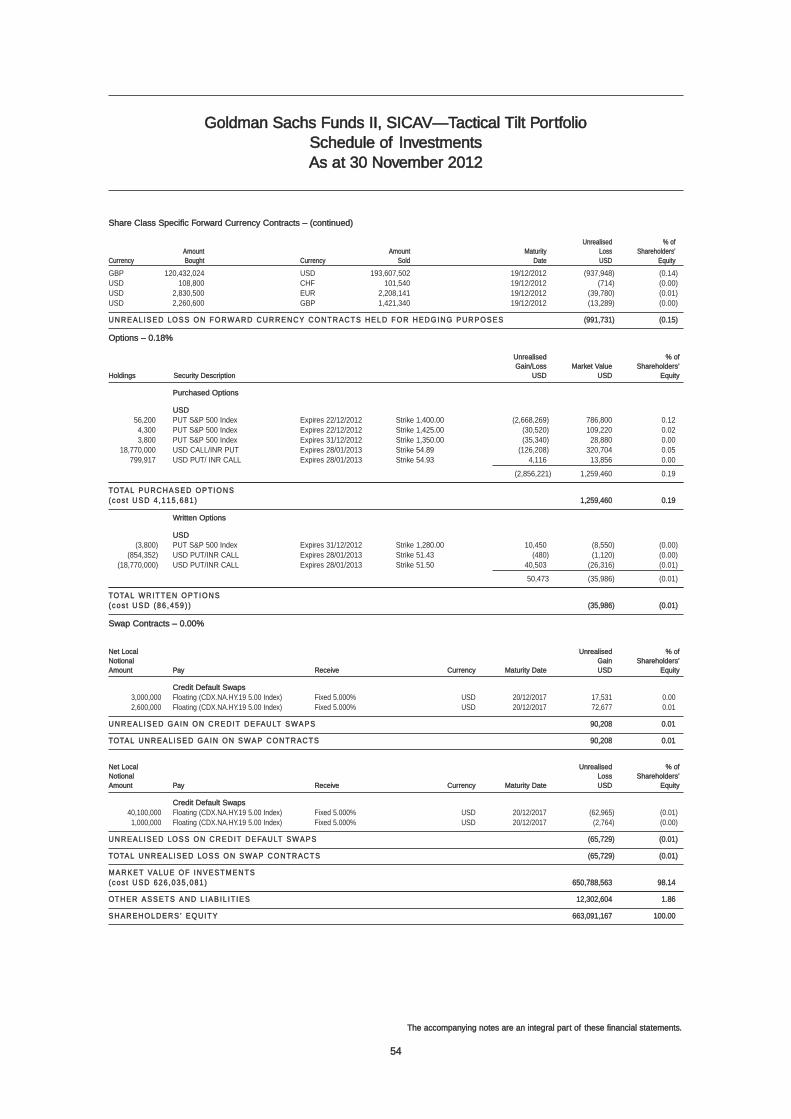
Schedule of InvestmentsAs at 30 November 2012
54
The accompanying notes are an integral part of these financial statements.
Goldman Sachs Funds II, SICAV—Tactical Tilt Portfolio
Share Class Specific Forward Currency Contracts – (continued)
Unrealised % ofAmount Amount Maturity Loss Shareholders’
Currency Bought Currency Sold Date USD Equity
GBP 120,432,024 USD 193,607,502 19/12/2012 (937,948) (0.14)USD 108,800 CHF 101,540 19/12/2012 (714) (0.00)USD 2,830,500 EUR 2,208,141 19/12/2012 (39,780) (0.01)USD 2,260,600 GBP 1,421,340 19/12/2012 (13,289) (0.00)
UNREAL ISED LOSS ON FORWARD CURRENCY CONTRACTS HELD FOR HEDGING PURPOSES (991,731) (0.15)
Options – 0.18%
Unrealised % ofGain/Loss Market Value Shareholders’
Holdings Security Description USD USD Equity
Purchased Options
USD56,200 PUT S&P 500 Index Expires 22/12/2012 Strike 1,400.00 (2,668,269) 786,800 0.124,300 PUT S&P 500 Index Expires 22/12/2012 Strike 1,425.00 (30,520) 109,220 0.023,800 PUT S&P 500 Index Expires 31/12/2012 Strike 1,350.00 (35,340) 28,880 0.00
18,770,000 USD CALL/INR PUT Expires 28/01/2013 Strike 54.89 (126,208) 320,704 0.05799,917 USD PUT/ INR CALL Expires 28/01/2013 Strike 54.93 4,116 13,856 0.00
(2,856,221) 1,259,460 0.19
TOTAL PURCHASED OPT IONS(cos t USD 4 ,115 ,681 ) 1,259,460 0.19
Written Options
USD(3,800) PUT S&P 500 Index Expires 31/12/2012 Strike 1,280.00 10,450 (8,550) (0.00)
(854,352) USD PUT/INR CALL Expires 28/01/2013 Strike 51.43 (480) (1,120) (0.00)(18,770,000) USD PUT/INR CALL Expires 28/01/2013 Strike 51.50 40,503 (26,316) (0.01)
50,473 (35,986) (0.01)
TOTAL WRITTEN OPT IONS(cos t USD (86 ,459 ) ) (35,986) (0.01)
Swap Contracts – 0.00%
Net Local Unrealised % ofNotional Gain Shareholders’Amount Pay Receive Currency Maturity Date USD Equity
Credit Default Swaps3,000,000 Floating (CDX.NA.HY.19 5.00 Index) Fixed 5.000% USD 20/12/2017 17,531 0.002,600,000 Floating (CDX.NA.HY.19 5.00 Index) Fixed 5.000% USD 20/12/2017 72,677 0.01
UNREAL ISED GAIN ON CREDIT DEFAULT S WAPS 90,208 0.01
TOTAL UNREAL ISED GAIN ON S WAP CONTRACTS 90,208 0.01
Net Local Unrealised % ofNotional Loss Shareholders’Amount Pay Receive Currency Maturity Date USD Equity
Credit Default Swaps40,100,000 Floating (CDX.NA.HY.19 5.00 Index) Fixed 5.000% USD 20/12/2017 (62,965) (0.01)1,000,000 Floating (CDX.NA.HY.19 5.00 Index) Fixed 5.000% USD 20/12/2017 (2,764) (0.00)
UNREAL ISED LOSS ON CREDIT DEFAULT S WAPS (65,729) (0.01)
TOTAL UNREAL ISED LOSS ON S WAP CONTRACTS (65,729) (0.01)
MARKET VALUE OF INVESTMENTS(cos t USD 626 ,035 ,081 ) 650,788,563 98.14
OTHER ASSETS AND L IA B IL IT IES 12,302,604 1.86
SHAREHOLDERS ’ EQUITY 663,091,167 100.00
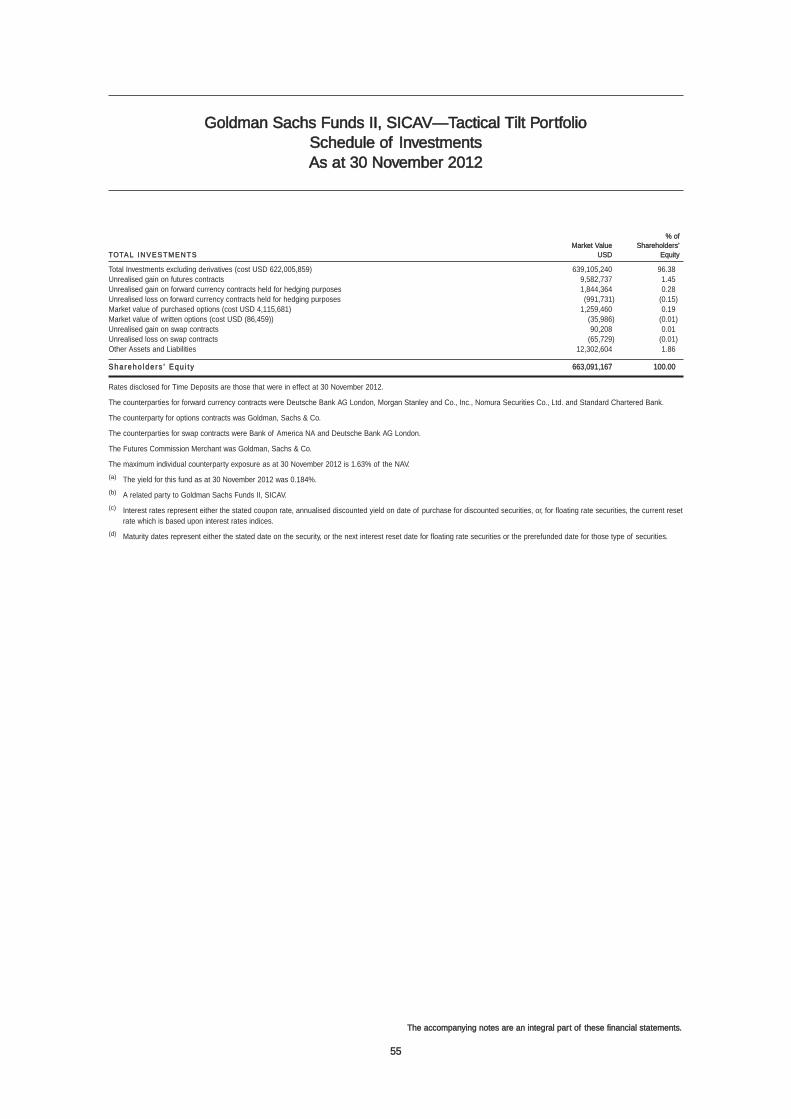
Schedule of InvestmentsAs at 30 November 2012
55
The accompanying notes are an integral part of these financial statements.
Goldman Sachs Funds II, SICAV—Tactical Tilt Portfolio
% ofMarket Value Shareholders’
TOTAL INVESTMENTS USD Equity
Total Investments excluding derivatives (cost USD 622,005,859) 639,105,240 96.38Unrealised gain on futures contracts 9,582,737 1.45Unrealised gain on forward currency contracts held for hedging purposes 1,844,364 0.28Unrealised loss on forward currency contracts held for hedging purposes (991,731) (0.15)Market value of purchased options (cost USD 4,115,681) 1,259,460 0.19Market value of written options (cost USD (86,459)) (35,986) (0.01)Unrealised gain on swap contracts 90,208 0.01Unrealised loss on swap contracts (65,729) (0.01)Other Assets and Liabilities 12,302,604 1.86
Sha reho lde r s ’ Equ i t y 663,091,167 100.00
Rates disclosed for Time Deposits are those that were in effect at 30 November 2012.
The counterparties for forward currency contracts were Deutsche Bank AG London, Morgan Stanley and Co., Inc., Nomura Securities Co., Ltd. and Standard Chartered Bank.
The counterparty for options contracts was Goldman, Sachs & Co.
The counterparties for swap contracts were Bank of America NA and Deutsche Bank AG London.
The Futures Commission Merchant was Goldman, Sachs & Co.
The maximum individual counterparty exposure as at 30 November 2012 is 1.63% of the NAV.
(a) The yield for this fund as at 30 November 2012 was 0.184%.
(b) A related party to Goldman Sachs Funds II, SICAV.
(c) Interest rates represent either the stated coupon rate, annualised discounted yield on date of purchase for discounted securities, or, for floating rate securities, the current resetrate which is based upon interest rates indices.
(d) Maturity dates represent either the stated date on the security, or the next interest reset date for floating rate securities or the prerefunded date for those type of securities.
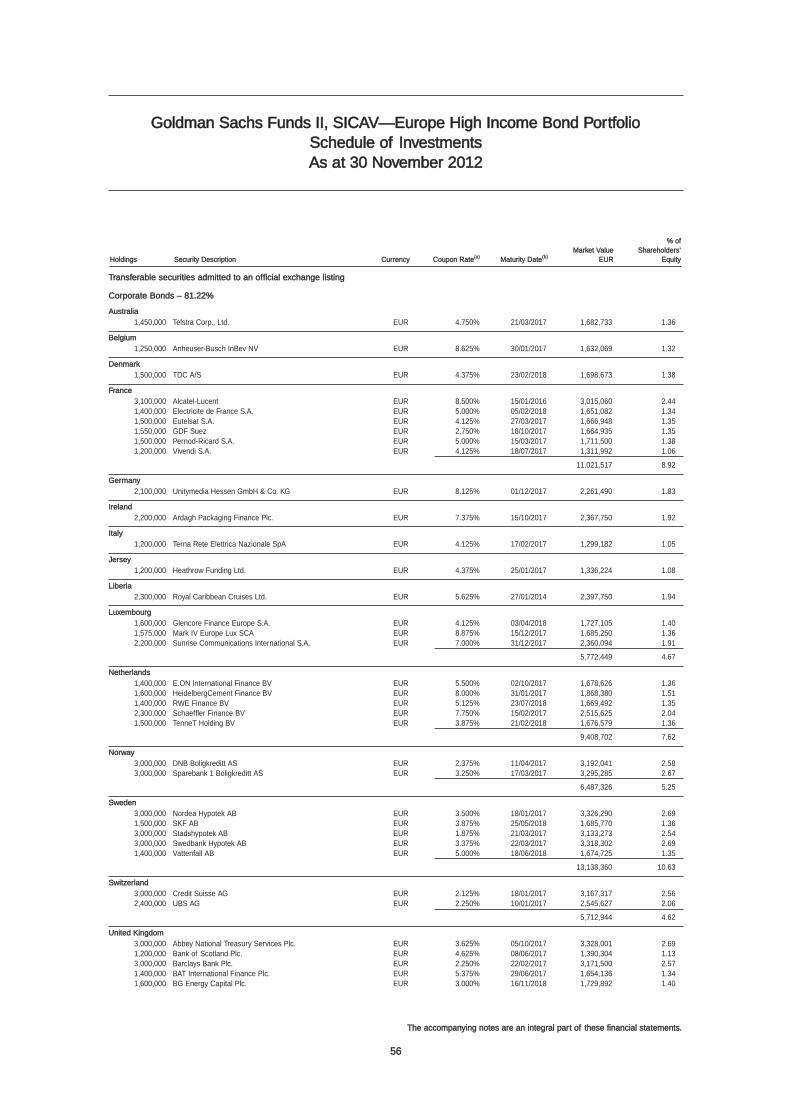
Schedule of InvestmentsAs at 30 November 2012
56
The accompanying notes are an integral part of these financial statements.
Goldman Sachs Funds II, SICAV—Europe High Income Bond Portfolio
Transferable securities admitted to an official exchange listing
Corporate Bonds – 81.22%
Australia
1,450,000 Telstra Corp., Ltd. EUR 4.750% 21/03/2017 1,682,733 1.36
Belgium
1,250,000 Anheuser-Busch InBev NV EUR 8.625% 30/01/2017 1,632,069 1.32
Denmark
1,500,000 TDC A/S EUR 4.375% 23/02/2018 1,698,673 1.38
France
3,100,000 Alcatel-Lucent EUR 8.500% 15/01/2016 3,015,060 2.441,400,000 Electricite de France S.A. EUR 5.000% 05/02/2018 1,651,082 1.341,500,000 Eutelsat S.A. EUR 4.125% 27/03/2017 1,666,948 1.351,550,000 GDF Suez EUR 2.750% 18/10/2017 1,664,935 1.351,500,000 Pernod-Ricard S.A. EUR 5.000% 15/03/2017 1,711,500 1.381,200,000 Vivendi S.A. EUR 4.125% 18/07/2017 1,311,992 1.06
11,021,517 8.92
Germany
2,100,000 Unitymedia Hessen GmbH & Co. KG EUR 8.125% 01/12/2017 2,261,490 1.83
Ireland
2,200,000 Ardagh Packaging Finance Plc. EUR 7.375% 15/10/2017 2,367,750 1.92
Italy
1,200,000 Terna Rete Elettrica Nazionale SpA EUR 4.125% 17/02/2017 1,299,182 1.05
Jersey
1,200,000 Heathrow Funding Ltd. EUR 4.375% 25/01/2017 1,336,224 1.08
Liberia
2,300,000 Royal Caribbean Cruises Ltd. EUR 5.625% 27/01/2014 2,397,750 1.94
Luxembourg
1,600,000 Glencore Finance Europe S.A. EUR 4.125% 03/04/2018 1,727,105 1.401,575,000 Mark IV Europe Lux SCA EUR 8.875% 15/12/2017 1,685,250 1.362,200,000 Sunrise Communications International S.A. EUR 7.000% 31/12/2017 2,360,094 1.91
5,772,449 4.67
Netherlands
1,400,000 E.ON International Finance BV EUR 5.500% 02/10/2017 1,678,626 1.361,600,000 HeidelbergCement Finance BV EUR 8.000% 31/01/2017 1,868,380 1.511,400,000 RWE Finance BV EUR 5.125% 23/07/2018 1,669,492 1.352,300,000 Schaeffler Finance BV EUR 7.750% 15/02/2017 2,515,625 2.041,500,000 TenneT Holding BV EUR 3.875% 21/02/2018 1,676,579 1.36
9,408,702 7.62
Norway
3,000,000 DNB Boligkreditt AS EUR 2.375% 11/04/2017 3,192,041 2.583,000,000 Sparebank 1 Boligkreditt AS EUR 3.250% 17/03/2017 3,295,285 2.67
6,487,326 5.25
Sweden
3,000,000 Nordea Hypotek AB EUR 3.500% 18/01/2017 3,326,290 2.691,500,000 SKF AB EUR 3.875% 25/05/2018 1,685,770 1.363,000,000 Stadshypotek AB EUR 1.875% 21/03/2017 3,133,273 2.543,000,000 Swedbank Hypotek AB EUR 3.375% 22/03/2017 3,318,302 2.691,400,000 Vattenfall AB EUR 5.000% 18/06/2018 1,674,725 1.35
13,138,360 10.63
Switzerland
3,000,000 Credit Suisse AG EUR 2.125% 18/01/2017 3,167,317 2.562,400,000 UBS AG EUR 2.250% 10/01/2017 2,545,627 2.06
5,712,944 4.62
United Kingdom
3,000,000 Abbey National Treasury Services Plc. EUR 3.625% 05/10/2017 3,328,001 2.691,200,000 Bank of Scotland Plc. EUR 4.625% 08/06/2017 1,390,304 1.133,000,000 Barclays Bank Plc. EUR 2.250% 22/02/2017 3,171,500 2.571,400,000 BAT International Finance Plc. EUR 5.375% 29/06/2017 1,654,136 1.341,600,000 BG Energy Capital Plc. EUR 3.000% 16/11/2018 1,729,892 1.40
% ofMarket Value Shareholders’
Holdings Security Description Currency Coupon Rate(a) Maturity Date(b) EUR Equity
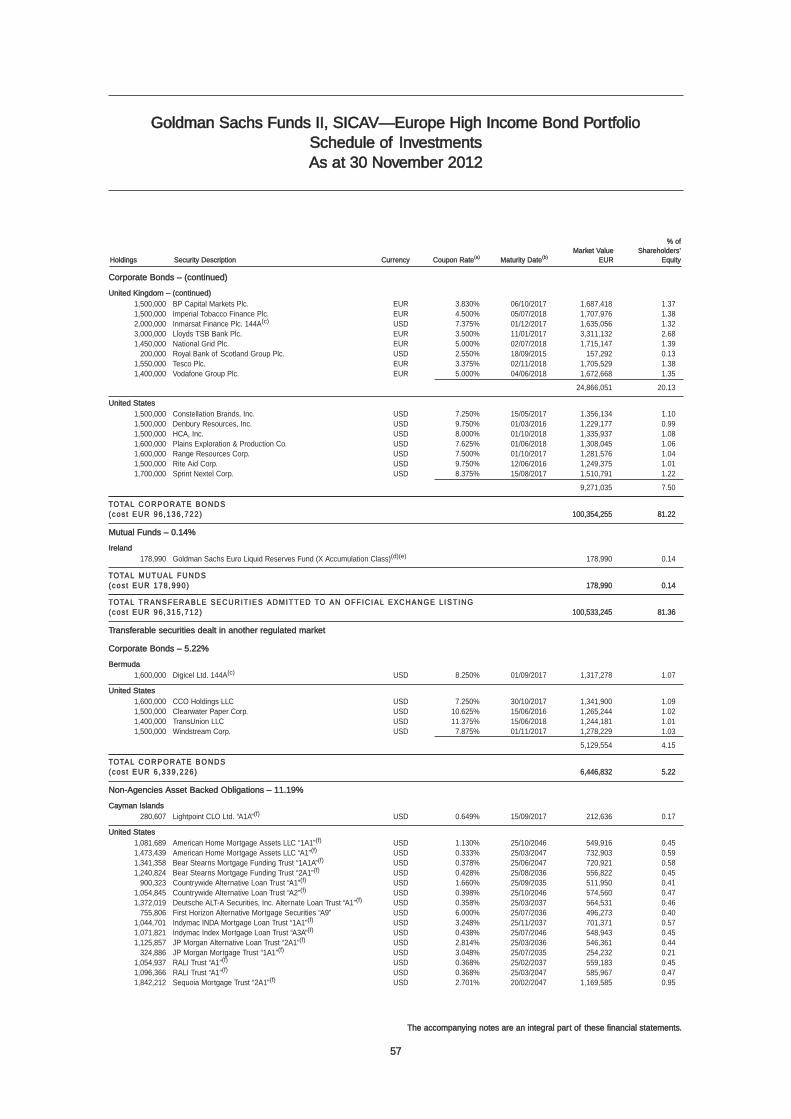
Schedule of InvestmentsAs at 30 November 2012
57
The accompanying notes are an integral part of these financial statements.
Goldman Sachs Funds II, SICAV—Europe High Income Bond Portfolio
Corporate Bonds – (continued)
United Kingdom – (continued)
1,500,000 BP Capital Markets Plc. EUR 3.830% 06/10/2017 1,687,418 1.371,500,000 Imperial Tobacco Finance Plc. EUR 4.500% 05/07/2018 1,707,976 1.382,000,000 Inmarsat Finance Plc. 144A(c) USD 7.375% 01/12/2017 1,635,056 1.323,000,000 Lloyds TSB Bank Plc. EUR 3.500% 11/01/2017 3,311,132 2.681,450,000 National Grid Plc. EUR 5.000% 02/07/2018 1,715,147 1.39
200,000 Royal Bank of Scotland Group Plc. USD 2.550% 18/09/2015 157,292 0.131,550,000 Tesco Plc. EUR 3.375% 02/11/2018 1,705,529 1.381,400,000 Vodafone Group Plc. EUR 5.000% 04/06/2018 1,672,668 1.35
24,866,051 20.13
United States
1,500,000 Constellation Brands, Inc. USD 7.250% 15/05/2017 1,356,134 1.101,500,000 Denbury Resources, Inc. USD 9.750% 01/03/2016 1,229,177 0.991,500,000 HCA, Inc. USD 8.000% 01/10/2018 1,335,937 1.081,600,000 Plains Exploration & Production Co. USD 7.625% 01/06/2018 1,308,045 1.061,600,000 Range Resources Corp. USD 7.500% 01/10/2017 1,281,576 1.041,500,000 Rite Aid Corp. USD 9.750% 12/06/2016 1,249,375 1.011,700,000 Sprint Nextel Corp. USD 8.375% 15/08/2017 1,510,791 1.22
9,271,035 7.50
TOTAL CORPORATE BONDS(cos t EUR 96 ,136 ,722 ) 100,354,255 81.22
Mutual Funds – 0.14%
Ireland
178,990 Goldman Sachs Euro Liquid Reserves Fund (X Accumulation Class)(d)(e) 178,990 0.14
TOTAL MUTUAL FUNDS(cos t EUR 178 ,990 ) 178,990 0.14
TOTAL TRANSFERA BLE SECURIT IES ADMITTED TO AN OFF IC IAL EXCHANGE L IST ING(cos t EUR 96 ,315 ,712 ) 100,533,245 81.36
Transferable securities dealt in another regulated market
Corporate Bonds – 5.22%
Bermuda
1,600,000 Digicel Ltd. 144A(c) USD 8.250% 01/09/2017 1,317,278 1.07
United States
1,600,000 CCO Holdings LLC USD 7.250% 30/10/2017 1,341,900 1.091,500,000 Clearwater Paper Corp. USD 10.625% 15/06/2016 1,265,244 1.021,400,000 TransUnion LLC USD 11.375% 15/06/2018 1,244,181 1.011,500,000 Windstream Corp. USD 7.875% 01/11/2017 1,278,229 1.03
5,129,554 4.15
TOTAL CORPORATE BONDS(cos t EUR 6 ,339 ,226 ) 6,446,832 5.22
Non-Agencies Asset Backed Obligations – 11.19%
Cayman Islands
280,607 Lightpoint CLO Ltd. “A1A”(f) USD 0.649% 15/09/2017 212,636 0.17
United States
1,081,689 American Home Mortgage Assets LLC “1A1”(f) USD 1.130% 25/10/2046 549,916 0.451,473,439 American Home Mortgage Assets LLC “A1”(f) USD 0.333% 25/03/2047 732,903 0.591,341,358 Bear Stearns Mortgage Funding Trust “1A1A”(f) USD 0.378% 25/06/2047 720,921 0.581,240,824 Bear Stearns Mortgage Funding Trust “2A1”(f) USD 0.428% 25/08/2036 556,822 0.45
900,323 Countrywide Alternative Loan Trust “A1”(f) USD 1.660% 25/09/2035 511,950 0.411,054,845 Countrywide Alternative Loan Trust “A2”(f) USD 0.398% 25/10/2046 574,560 0.471,372,019 Deutsche ALT-A Securities, Inc. Alternate Loan Trust “A1”(f) USD 0.358% 25/03/2037 564,531 0.46
755,806 First Horizon Alternative Mortgage Securities “A9” USD 6.000% 25/07/2036 496,273 0.401,044,701 Indymac INDA Mortgage Loan Trust “1A1”(f) USD 3.248% 25/11/2037 701,371 0.571,071,821 Indymac Index Mortgage Loan Trust “A3A”(f) USD 0.438% 25/07/2046 548,943 0.451,125,857 JP Morgan Alternative Loan Trust “2A1”(f) USD 2.814% 25/03/2036 546,361 0.44
324,886 JP Morgan Mortgage Trust “1A1”(f) USD 3.048% 25/07/2035 254,232 0.211,054,937 RALI Trust “A1”(f) USD 0.368% 25/02/2037 559,183 0.451,096,366 RALI Trust “A1”(f) USD 0.368% 25/03/2047 585,967 0.471,842,212 Sequoia Mortgage Trust “2A1”(f) USD 2.701% 20/02/2047 1,169,585 0.95
% ofMarket Value Shareholders’
Holdings Security Description Currency Coupon Rate(a) Maturity Date(b) EUR Equity
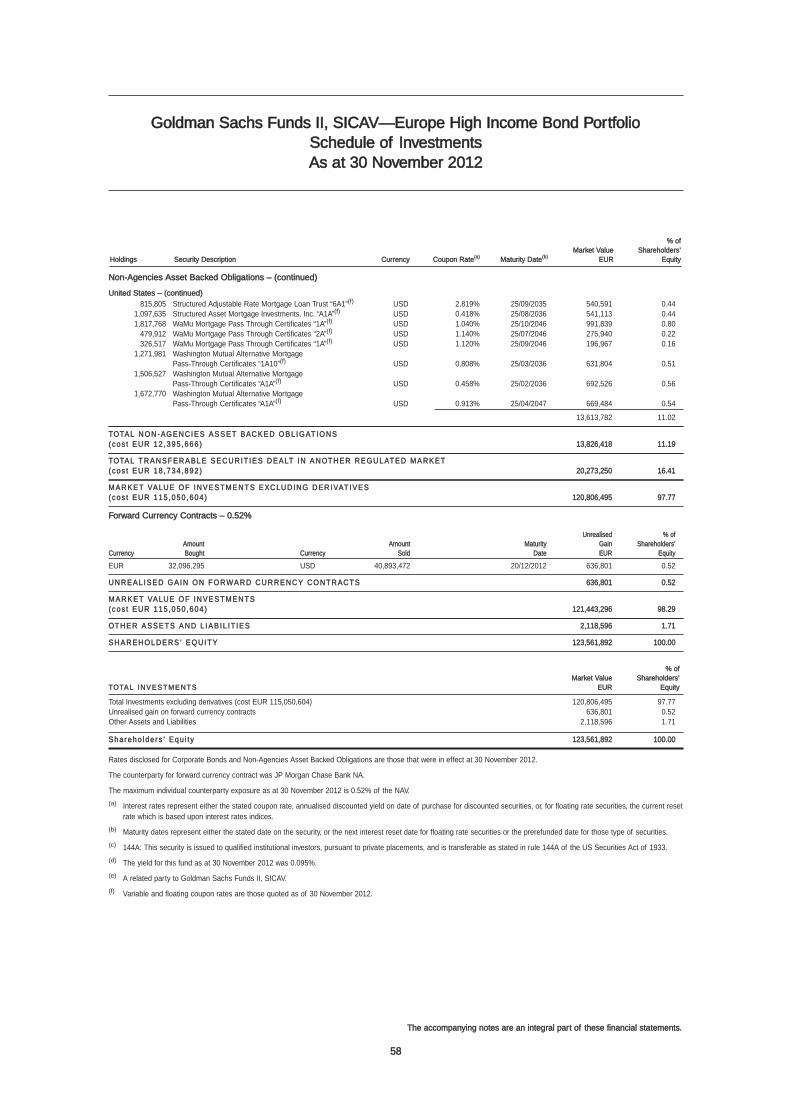
Schedule of InvestmentsAs at 30 November 2012
58
The accompanying notes are an integral part of these financial statements.
Goldman Sachs Funds II, SICAV—Europe High Income Bond Portfolio
% ofMarket Value Shareholders’
Holdings Security Description Currency Coupon Rate(a) Maturity Date(b) EUR Equity
Non-Agencies Asset Backed Obligations – (continued)
United States – (continued)
815,805 Structured Adjustable Rate Mortgage Loan Trust “6A1”(f) USD 2.819% 25/09/2035 540,591 0.441,097,635 Structured Asset Mortgage Investments, Inc. “A1A”(f) USD 0.418% 25/08/2036 541,113 0.441,817,768 WaMu Mortgage Pass Through Certificates “1A”(f) USD 1.040% 25/10/2046 991,839 0.80
479,912 WaMu Mortgage Pass Through Certificates “2A”(f) USD 1.140% 25/07/2046 275,940 0.22326,517 WaMu Mortgage Pass Through Certificates “1A”(f) USD 1.120% 25/09/2046 196,967 0.16
1,271,981 Washington Mutual Alternative Mortgage Pass-Through Certificates “1A10”(f) USD 0.808% 25/03/2036 631,804 0.51
1,506,527 Washington Mutual Alternative Mortgage Pass-Through Certificates “A1A”(f) USD 0.458% 25/02/2036 692,526 0.56
1,672,770 Washington Mutual Alternative Mortgage Pass-Through Certificates “A1A”(f) USD 0.913% 25/04/2047 669,484 0.54
13,613,782 11.02
TOTAL NON-AGENCIES ASSET BACKED OBL IGAT IONS(cos t EUR 12 ,395 ,666 ) 13,826,418 11.19
TOTAL TRANSFERA BLE SECURIT IES DEALT IN ANOTHER REGULATED MARKET(cos t EUR 18 ,734 ,892 ) 20,273,250 16.41
MARKET VALUE OF INVESTMENTS EXCLUDING DERIVAT IVES(cos t EUR 115 ,050 ,604 ) 120,806,495 97.77
Forward Currency Contracts – 0.52%
Unrealised % ofAmount Amount Maturity Gain Shareholders’
Currency Bought Currency Sold Date EUR Equity
EUR 32,096,295 USD 40,893,472 20/12/2012 636,801 0.52
UNREAL ISED GAIN ON FORWARD CURRENCY CONTRACTS 636,801 0.52
MARKET VALUE OF INVESTMENTS(cos t EUR 115 ,050 ,604 ) 121,443,296 98.29
OTHER ASSETS AND L IA B IL IT IES 2,118,596 1.71
SHAREHOLDERS ’ EQUITY 123,561,892 100.00
% ofMarket Value Shareholders’
TOTAL INVESTMENTS EUR Equity
Total Investments excluding derivatives (cost EUR 115,050,604) 120,806,495 97.77Unrealised gain on forward currency contracts 636,801 0.52Other Assets and Liabilities 2,118,596 1.71
Sha reho lde r s ’ Equ i t y 123,561,892 100.00
Rates disclosed for Corporate Bonds and Non-Agencies Asset Backed Obligations are those that were in effect at 30 November 2012.
The counterparty for forward currency contract was JP Morgan Chase Bank NA.
The maximum individual counterparty exposure as at 30 November 2012 is 0.52% of the NAV.
(a) Interest rates represent either the stated coupon rate, annualised discounted yield on date of purchase for discounted securities, or, for floating rate securities, the current resetrate which is based upon interest rates indices.
(b) Maturity dates represent either the stated date on the security, or the next interest reset date for floating rate securities or the prerefunded date for those type of securities.
(c) 144A: This security is issued to qualified institutional investors, pursuant to private placements, and is transferable as stated in rule 144A of the US Securities Act of 1933.
(d) The yield for this fund as at 30 November 2012 was 0.095%.
(e) A related party to Goldman Sachs Funds II, SICAV.
(f) Variable and floating coupon rates are those quoted as of 30 November 2012.
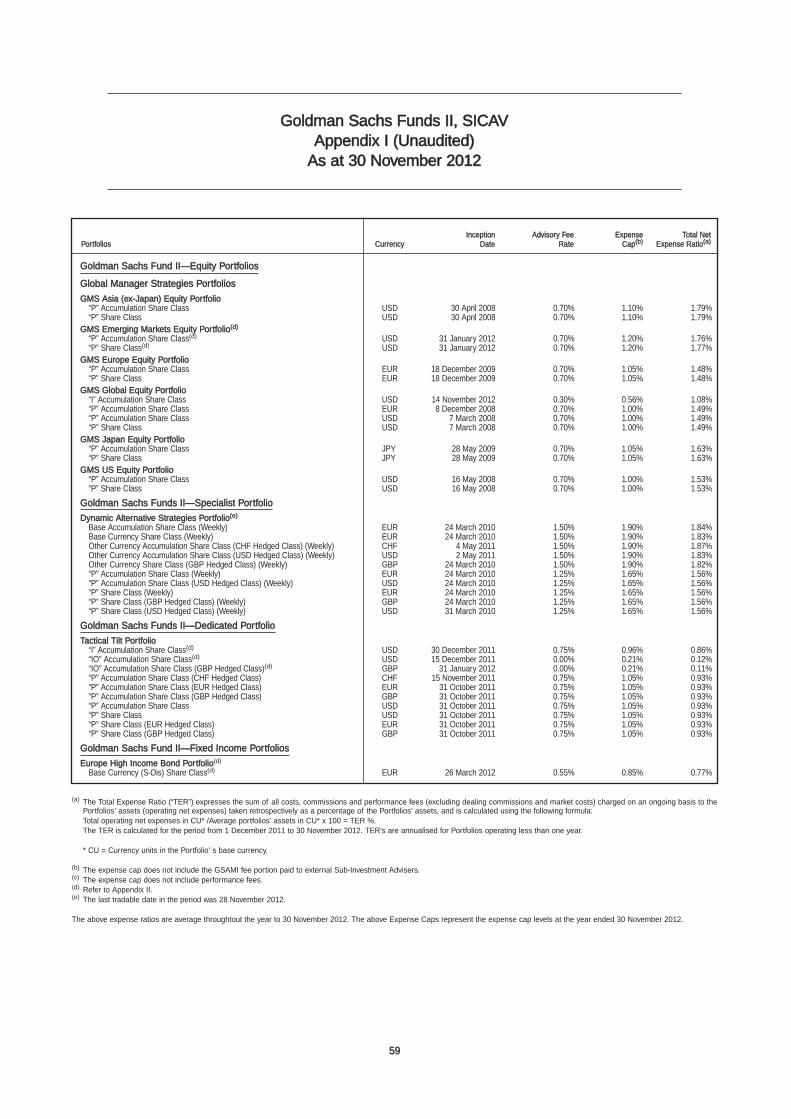
Goldman Sachs Fund II—Equity Portfolios
Global Manager Strategies Portfolios
GMS Asia (ex-Japan) Equity Portfolio“P” Accumulation Share Class USD 30 April 2008 0.70% 1.10% 1.79%“P” Share Class USD 30 April 2008 0.70% 1.10% 1.79%
GMS Emerging Markets Equity Portfolio(d)
“P” Accumulation Share Class(d) USD 31 January 2012 0.70% 1.20% 1.76%“P” Share Class(d) USD 31 January 2012 0.70% 1.20% 1.77%
GMS Europe Equity Portfolio“P” Accumulation Share Class EUR 18 December 2009 0.70% 1.05% 1.48%“P” Share Class EUR 18 December 2009 0.70% 1.05% 1.48%
GMS Global Equity Portfolio“I” Accumulation Share Class USD 14 November 2012 0.30% 0.56% 1.08%“P” Accumulation Share Class EUR 8 December 2008 0.70% 1.00% 1.49%“P” Accumulation Share Class USD 7 March 2008 0.70% 1.00% 1.49%“P” Share Class USD 7 March 2008 0.70% 1.00% 1.49%
GMS Japan Equity Portfolio“P” Accumulation Share Class JPY 28 May 2009 0.70% 1.05% 1.63%“P” Share Class JPY 28 May 2009 0.70% 1.05% 1.63%
GMS US Equity Portfolio“P” Accumulation Share Class USD 16 May 2008 0.70% 1.00% 1.53%“P” Share Class USD 16 May 2008 0.70% 1.00% 1.53%
Goldman Sachs Funds II—Specialist Portfolio
Dynamic Alternative Strategies Portfolio(e)
Base Accumulation Share Class (Weekly) EUR 24 March 2010 1.50% 1.90% 1.84%Base Currency Share Class (Weekly) EUR 24 March 2010 1.50% 1.90% 1.83%Other Currency Accumulation Share Class (CHF Hedged Class) (Weekly) CHF 4 May 2011 1.50% 1.90% 1.87%Other Currency Accumulation Share Class (USD Hedged Class) (Weekly) USD 2 May 2011 1.50% 1.90% 1.83%Other Currency Share Class (GBP Hedged Class) (Weekly) GBP 24 March 2010 1.50% 1.90% 1.82%“P” Accumulation Share Class (Weekly) EUR 24 March 2010 1.25% 1.65% 1.56%“P” Accumulation Share Class (USD Hedged Class) (Weekly) USD 24 March 2010 1.25% 1.65% 1.56%“P” Share Class (Weekly) EUR 24 March 2010 1.25% 1.65% 1.56%“P” Share Class (GBP Hedged Class) (Weekly) GBP 24 March 2010 1.25% 1.65% 1.56%“P” Share Class (USD Hedged Class) (Weekly) USD 31 March 2010 1.25% 1.65% 1.56%
Goldman Sachs Funds II—Dedicated Portfolio
Tactical Tilt Portfolio“I” Accumulation Share Class(d) USD 30 December 2011 0.75% 0.96% 0.86%“IO” Accumulation Share Class(d) USD 15 December 2011 0.00% 0.21% 0.12%“IO” Accumulation Share Class (GBP Hedged Class)(d) GBP 31 January 2012 0.00% 0.21% 0.11%“P” Accumulation Share Class (CHF Hedged Class) CHF 15 November 2011 0.75% 1.05% 0.93%“P” Accumulation Share Class (EUR Hedged Class) EUR 31 October 2011 0.75% 1.05% 0.93%“P” Accumulation Share Class (GBP Hedged Class) GBP 31 October 2011 0.75% 1.05% 0.93%“P” Accumulation Share Class USD 31 October 2011 0.75% 1.05% 0.93%“P” Share Class USD 31 October 2011 0.75% 1.05% 0.93%“P” Share Class (EUR Hedged Class) EUR 31 October 2011 0.75% 1.05% 0.93%“P” Share Class (GBP Hedged Class) GBP 31 October 2011 0.75% 1.05% 0.93%
Goldman Sachs Fund II—Fixed Income Portfolios
Europe High Income Bond Portfolio(d)
Base Currency (S-Dis) Share Class(d) EUR 26 March 2012 0.55% 0.85% 0.77%
(a) The Total Expense Ratio (“TER”) expresses the sum of all costs, commissions and performance fees (excluding dealing commissions and market costs) charged on an ongoing basis to thePortfolios’ assets (operating net expenses) taken retrospectively as a percentage of the Portfolios’ assets, and is calculated using the following formula:Total operating net expenses in CU* /Average portfolios’ assets in CU* x 100 = TER %.The TER is calculated for the period from 1 December 2011 to 30 November 2012. TER’s are annualised for Portfolios operating less than one year.
* CU = Currency units in the Portfolio’ s base currency.
(b) The expense cap does not include the GSAMI fee portion paid to external Sub-Investment Advisers.(c) The expense cap does not include performance fees.(d) Refer to Appendix II.(e) The last tradable date in the period was 28 November 2012.
The above expense ratios are average throughtout the year to 30 November 2012. The above Expense Caps represent the expense cap levels at the year ended 30 November 2012.
Inception Advisory Fee Expense Total NetPortfolios Currency Date Rate Cap(b) Expense Ratio(a)
Goldman Sachs Funds II, SICAVAppendix I (Unaudited)
As at 30 November 2012
59
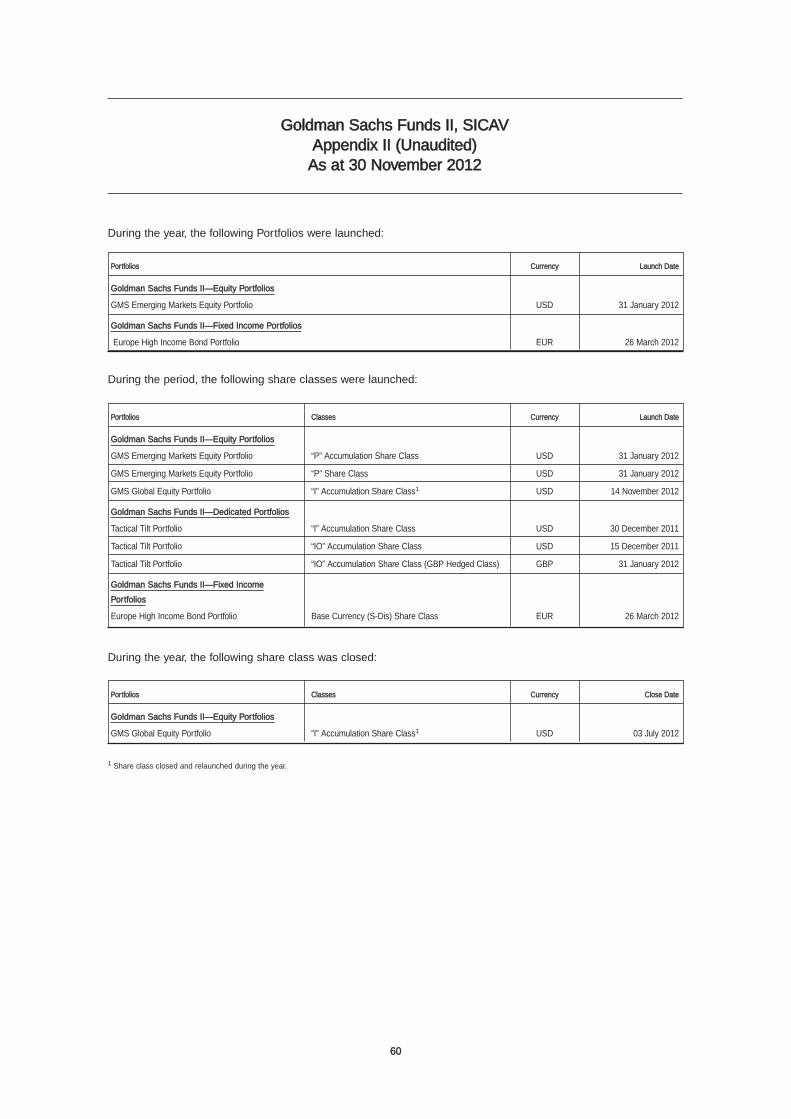
60
Goldman Sachs Funds II, SICAVAppendix II (Unaudited)
As at 30 November 2012
During the year, the following Portfolios were launched:
During the period, the following share classes were launched:
During the year, the following share class was closed:
1 Share class closed and relaunched during the year.
Portfolios Classes Currency Launch Date
Goldman Sachs Funds II—Equity Portfolios
GMS Emerging Markets Equity Portfolio “P” Accumulation Share Class USD 31 January 2012
GMS Emerging Markets Equity Portfolio “P” Share Class USD 31 January 2012
GMS Global Equity Portfolio “I” Accumulation Share Class1 USD 14 November 2012
Goldman Sachs Funds II—Dedicated Portfolios
Tactical Tilt Portfolio “I” Accumulation Share Class USD 30 December 2011
Tactical Tilt Portfolio “IO” Accumulation Share Class USD 15 December 2011
Tactical Tilt Portfolio “IO” Accumulation Share Class (GBP Hedged Class) GBP 31 January 2012
Goldman Sachs Funds II—Fixed Income
Portfolios
Europe High Income Bond Portfolio Base Currency (S-Dis) Share Class EUR 26 March 2012
Portfolios Classes Currency Close Date
Goldman Sachs Funds II—Equity Portfolios
GMS Global Equity Portfolio “I” Accumulation Share Class1 USD 03 July 2012
Portfolios Currency Launch Date
Goldman Sachs Funds II—Equity Portfolios
GMS Emerging Markets Equity Portfolio USD 31 January 2012
Goldman Sachs Funds II—Fixed Income Portfolios
Europe High Income Bond Portfolio EUR 26 March 2012
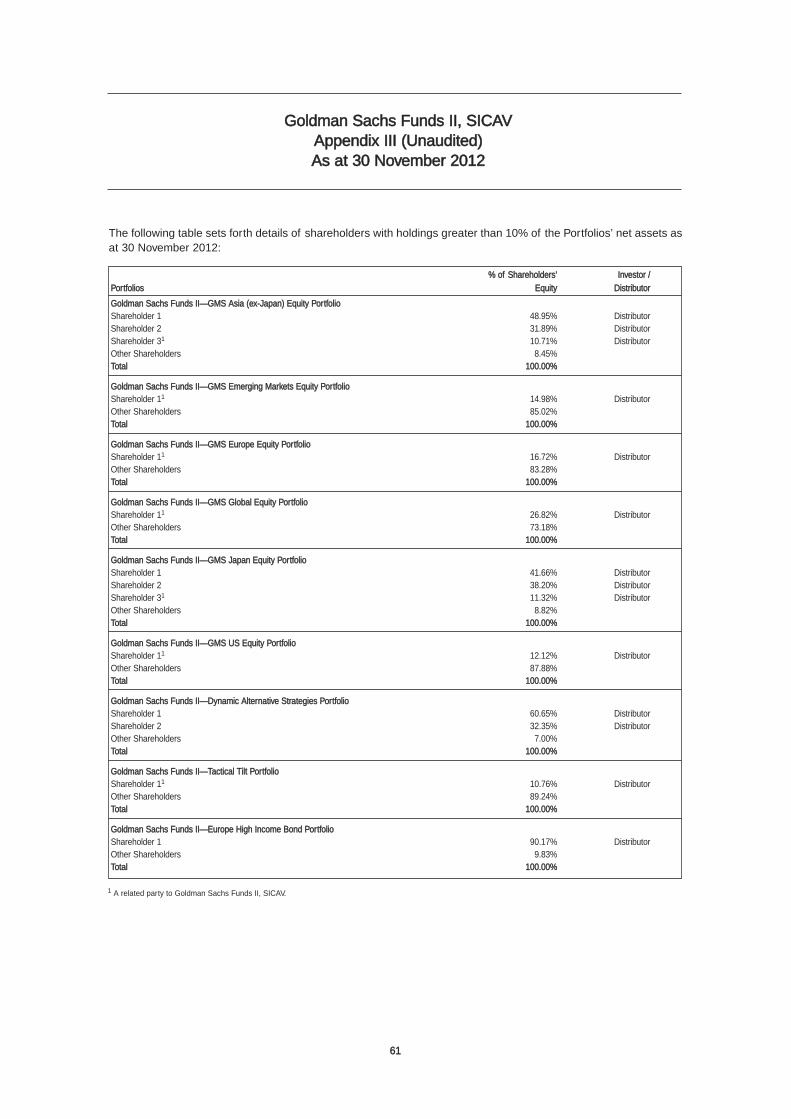
The following table sets forth details of shareholders with holdings greater than 10% of the Portfolios’ net assets asat 30 November 2012:
% of Shareholders’ Investor /
Portfolios Equity Distributor
Goldman Sachs Funds II—GMS Asia (ex-Japan) Equity PortfolioShareholder 1 48.95% DistributorShareholder 2 31.89% DistributorShareholder 31 10.71% DistributorOther Shareholders 8.45%Total 100.00%
Goldman Sachs Funds II—GMS Emerging Markets Equity PortfolioShareholder 11 14.98% DistributorOther Shareholders 85.02%Total 100.00%
Goldman Sachs Funds II—GMS Europe Equity PortfolioShareholder 11 16.72% DistributorOther Shareholders 83.28%Total 100.00%
Goldman Sachs Funds II—GMS Global Equity PortfolioShareholder 11 26.82% DistributorOther Shareholders 73.18%Total 100.00%
Goldman Sachs Funds II—GMS Japan Equity PortfolioShareholder 1 41.66% DistributorShareholder 2 38.20% DistributorShareholder 31 11.32% DistributorOther Shareholders 8.82%Total 100.00%
Goldman Sachs Funds II—GMS US Equity PortfolioShareholder 11 12.12% DistributorOther Shareholders 87.88%Total 100.00%
Goldman Sachs Funds II—Dynamic Alternative Strategies PortfolioShareholder 1 60.65% DistributorShareholder 2 32.35% DistributorOther Shareholders 7.00%Total 100.00%
Goldman Sachs Funds II—Tactical Tilt PortfolioShareholder 11 10.76% DistributorOther Shareholders 89.24%Total 100.00%
Goldman Sachs Funds II—Europe High Income Bond PortfolioShareholder 1 90.17% DistributorOther Shareholders 9.83%Total 100.00%
Goldman Sachs Funds II, SICAVAppendix III (Unaudited)As at 30 November 2012
61
1 A related party to Goldman Sachs Funds II, SICAV.
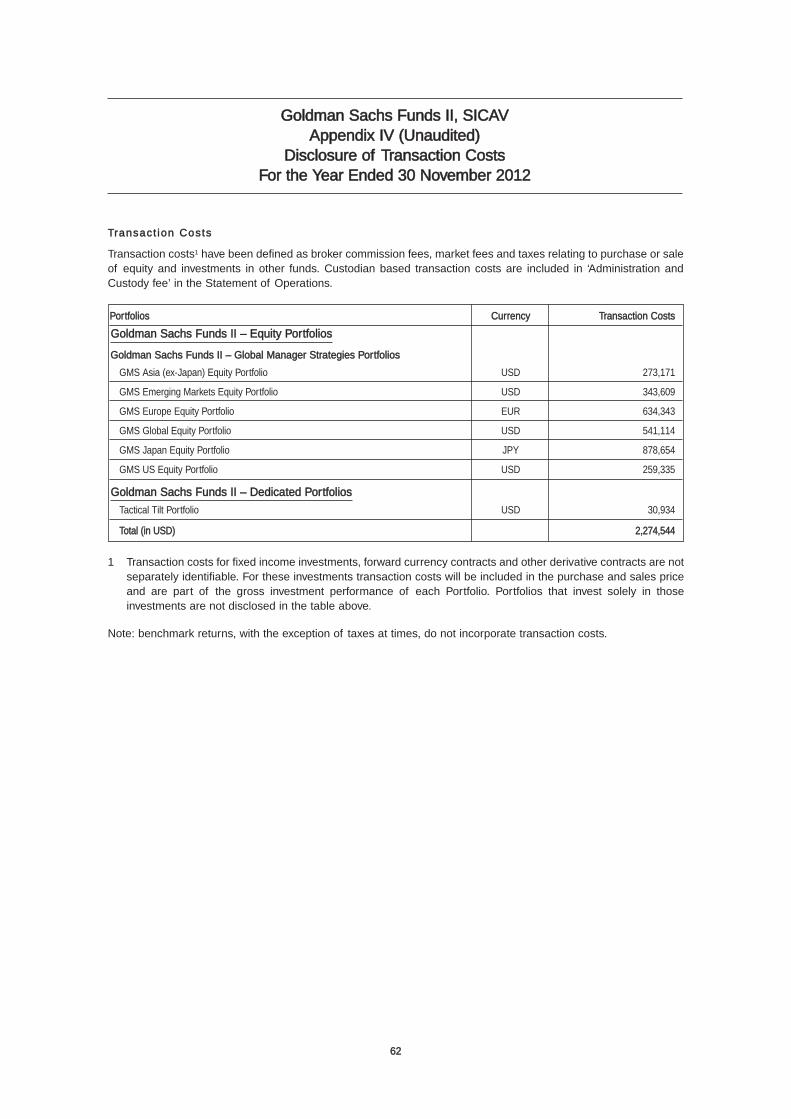
Goldman Sachs Funds II, SICAVAppendix IV (Unaudited)
Disclosure of Transaction CostsFor the Year Ended 30 November 2012
Portfolios Currency Transaction Costs
Goldman Sachs Funds II – Equity Portfolios
Goldman Sachs Funds II – Global Manager Strategies Portfolios
GMS Asia (ex-Japan) Equity Portfolio USD 273,171
GMS Emerging Markets Equity Portfolio USD 343,609
GMS Europe Equity Portfolio EUR 634,343
GMS Global Equity Portfolio USD 541,114
GMS Japan Equity Portfolio JPY 878,654
GMS US Equity Portfolio USD 259,335
Goldman Sachs Funds II – Dedicated Portfolios
Tactical Tilt Portfolio USD 30,934
Total (in USD) 2,274,544
Transact ion Costs
Transaction costs1 have been defined as broker commission fees, market fees and taxes relating to purchase or saleof equity and investments in other funds. Custodian based transaction costs are included in ‘Administration andCustody fee’ in the Statement of Operations.
1 Transaction costs for fixed income investments, forward currency contracts and other derivative contracts are notseparately identifiable. For these investments transaction costs will be included in the purchase and sales priceand are part of the gross investment performance of each Portfolio. Portfolios that invest solely in thoseinvestments are not disclosed in the table above.
Note: benchmark returns, with the exception of taxes at times, do not incorporate transaction costs.
62
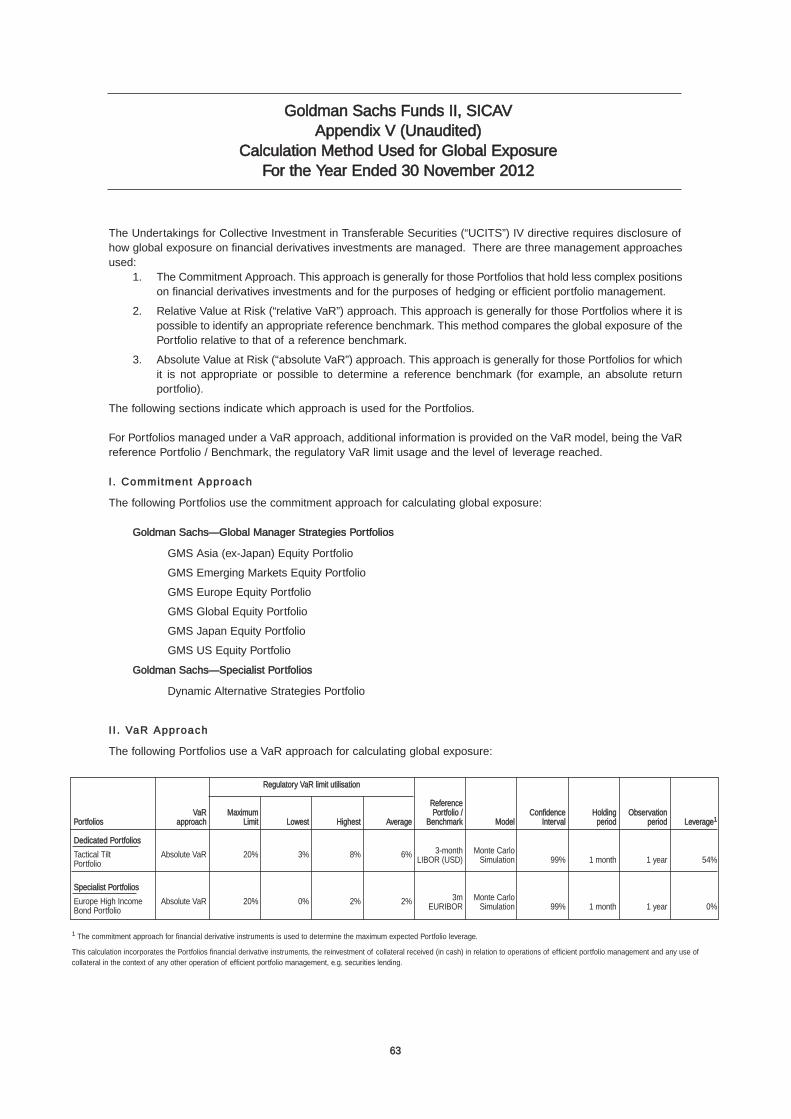
Goldman Sachs Funds II, SICAVAppendix V (Unaudited)
Calculation Method Used for Global ExposureFor the Year Ended 30 November 2012
The Undertakings for Collective Investment in Transferable Securities (“UCITS”) IV directive requires disclosure ofhow global exposure on financial derivatives investments are managed. There are three management approachesused:
1. The Commitment Approach. This approach is generally for those Portfolios that hold less complex positionson financial derivatives investments and for the purposes of hedging or efficient portfolio management.
2. Relative Value at Risk (“relative VaR”) approach. This approach is generally for those Portfolios where it ispossible to identify an appropriate reference benchmark. This method compares the global exposure of thePortfolio relative to that of a reference benchmark.
3. Absolute Value at Risk (“absolute VaR”) approach. This approach is generally for those Portfolios for whichit is not appropriate or possible to determine a reference benchmark (for example, an absolute returnportfolio).
The following sections indicate which approach is used for the Portfolios.
For Portfolios managed under a VaR approach, additional information is provided on the VaR model, being the VaRreference Portfolio / Benchmark, the regulatory VaR limit usage and the level of leverage reached.
I . Commitment Approach
The following Portfolios use the commitment approach for calculating global exposure:
Goldman Sachs—Global Manager Strategies Portfolios
GMS Asia (ex-Japan) Equity Portfolio
GMS Emerging Markets Equity Portfolio
GMS Europe Equity Portfolio
GMS Global Equity Portfolio
GMS Japan Equity Portfolio
GMS US Equity Portfolio
Goldman Sachs—Specialist Portfolios
Dynamic Alternative Strategies Portfolio
I I . VaR Approach
The following Portfolios use a VaR approach for calculating global exposure:
Regulatory VaR limit utilisation
ReferenceVaR Maximum Portfolio / Confidence Holding Observation
Portfolios approach Limit Lowest Highest Average Benchmark Model Interval period period Leverage1
Dedicated Portfolios
Tactical Tilt Absolute VaR 20% 3% 8% 6% 3-month Monte Carlo
Portfolio LIBOR (USD) Simulation 99% 1 month 1 year 54%
Specialist Portfolios
Europe High Income Absolute VaR 20% 0% 2% 2% 3m Monte Carlo
Bond Portfolio EURIBOR Simulation 99% 1 month 1 year 0%
1 The commitment approach for financial derivative instruments is used to determine the maximum expected Portfolio leverage.
This calculation incorporates the Portfolios financial derivative instruments, the reinvestment of collateral received (in cash) in relation to operations of efficient portfolio management and any use ofcollateral in the context of any other operation of efficient portfolio management, e.g. securities lending.
63
Shares of the Goldman Sachs Funds II, SICAV Portfolios are issued solely on the basis of information setout in the current Prospectus of Goldman Sachs Funds II, SICAV, which is available free of charge at theFund’s registered office. Prospective investors should review the Prospectus and the Key Investor InformationDocument (“KIID”) carefully and consult their financial adviser before investing to determine that aninvestment in the Portfolios would be suitable for them. Past performance is not a guide to future performanceand the value of investments and the income derived from them can go down as well as up. Future returnsare not guaranteed and a loss of principal may occur.
No subscriptions can be received on the basis of financial reports alone. Subscriptions are only valid if madeon the basis of the current Prospectus and KIID supplemented by the most recent Annual Report and thelatest Semi-Annual report if published thereafter. Opinions expressed are current opinions as of the dateappearing in this material only.
This document does not constitute a solicitation in any jurisdiction in which such a solicitation is unlawful orto any person to whom it is unlawful. Moreover, this document neither constitutes an offer to enter into aninvestment agreement with the recipient of this document nor an invitation to respond to it by making an offerto enter into an investment agreement.
This information does not constitute tax advice and as such, shareholders should be advised to consult theirown tax advisers regarding the tax consequences of their investment activities.
Views and opinions expressed are for informational purposes only and do not constitute a recommendationby GSAM to buy, sell, or hold any security. Views and opinions are current as of the date of this material andmay be subject to change, they should not be construed as investment advice.
No part of this material may be (i) copied, photocopied or duplicated in any form, by any means, or(ii) distributed to any person that is not an employee, officer, director, or authorised agent of the recipient,without GSAM’s prior written consent.
In the United Kingdom, this material has been communicated by Goldman Sachs International, which isauthorised and regulated by the Financial Services Authority.
© 2013 Goldman Sachs. All rights reserved.
64
Goldman Sachs Funds II, SICAVAdditional Information
SICAVIIAENG